4 Fasli Jalal - Crawford School of Public Policy PMPTK, 2010 - Calculated using Teacher Salary Data...
71
Fasli Jalal Suhar, Policy Direc,on to Improve the Quality of Educa,on and its Linkage Indonesia Update 2012 Canberra, 2122 September 2012
-
Upload
nguyenphuc -
Category
Documents
-
view
213 -
download
0
Transcript of 4 Fasli Jalal - Crawford School of Public Policy PMPTK, 2010 - Calculated using Teacher Salary Data...

Fasli Jalal Suhar,
Policy Direc,on to Improve the Quality of Educa,on and its Linkage
Indonesia Update 2012 Canberra, 21-‐22 September 2012

Outline 1. Access to educa1on 2. Quality of educa1on – current situa1on 3. Policy direc1on for quality improvement
Indonesia Update 2012 2

RA Kindegarten
MI Primary School (grade 1-6)
Junior Secondary School (grade 7-9)
General Senior Sec. School (10-12)
Vocational Senior Sec School (10-12)
D3 D2 S1/D4
Child care, play Group,
etc.
Package A
Package B
Package C
MTs
MA
Master Master
Doctorate Doctorate
Vocational Courses
5-6
7-12
13-15
16-18
0-4
Indonesian education structure is complex
D1 S1
Formal Age General Formal Religious
Formal Non-‐‑Formal
19+
Indonesia Update 2012 3

Indonesia Update 2012 4
Access to Educa1on

0
20
40
60
80
100
120
140
1965 1970 1975 1980 1985 1990 1995 2000 2005 2010
Primary School Junior Secondary School Senior Secondary School Tertiary Education
Presidential Report SUSENAS
Sources: collected from the Presidential Report 1968-‐‑1994 and SUSENAS 1994-‐‑2010
Indonesia has successfully increased school enrolment rates over 1me as indicated by con1nuous increases in gross enrolment rates
Indonesia Update 2012 5

Indonesia Update 2012 6
0
20
40
60
80
100
1993 1996 2000 2006 2009 1993 1996 2000 2006 2009
Aged 13-15 Aged 16-18
Quintile-1 Quintile-2 Quintile-3 Quintile-4 Quintile-5
Although there are s1ll some gaps in school enrolment between children from poor and rich families, the gaps keep decreasing over 1me
Source: calculated using SUSENAS data


Indonesia Update 2012 8
70
80
90
100
110
1993
1994
1995
1996
1997
1998
1999
2000
2001
2002
2003
2004
2005
2006
2007
2008
2009
2010
2011
Primary education Junior secondary educationSenior secondary education Tertiary education
Boys and girls have equal access to educa1on as measured by the ra1o of net enrolment rate of female to male students


1,5 %
8,6 % PS
1.8 %
24,0 % JHS
4,2 %
51.7 %
HE
31,05 mil
12,69 mil
SHS 9,11 mil
5,2 mil
= % drop out = % of discontinued to higher level 10
Sumber: PSP 2009/2010
Drop out and discontinuation rate
465,000
445,000
228 ribu
1 million
389 ,000
1,5 million

Issues: 1. Student learning outcomes 2. Teacher qualification and competency 3. Teacher management, financing, and welfare
Indonesia Update 2012 11
Quality of Education

-100%-80%-60%-40%-20%
0%20%40%60%80%
100%So
uth
Kor
ea
Sing
apor
e
Japa
n
Chi
nese
Tai
pei
Hon
g K
ong
Hun
gary
Eng
land
Rus
sia
Uni
ted
Stat
es
Aus
tral
ia
Swed
en
Ital
y
Mal
aysi
a
Nor
way
Tha
iland
Tur
key
Iran
Indo
nesi
a
Mor
occo
Kuw
ait
Qat
ar
Med
ian
Intermediate High Advanced Low Below low
• Performance of students from Indonesia in interna1onal standardized tests is not as good as those from other countries.
• In TIMMS 2007 à 52% of 8th grade students had below the low benchmark in mathema1cs achievement
Source: IEA’s TIMMS 2007 Indonesia Update 2012 12


14
Average number of words spoken in a 50 minutes class
Ratio number of words spoken by the teacher to the words spoken by the students
0 1,000 2,000 3,000 4,000 5,000 6,000 7,000
Ind OCs Ind OCs Spoken by teachers Spoken by the
students
2,633
5,902
5,148
1,018 640 197
Num
ber o
f words
8 9 9 10
13 16
25
0 5 10 15 20 25 30 United States
Australia Czech Republic
Switzerland Netherlands Hong Kong Indonesia
14

Indonesia Update 2012 15
Teaching and learning process: • Available ,me is not fully u,lized • Limited teacher-‐student interac,ons • Students’ communica,on skills are not well developed • Students mostly work in isola,on and with individual exercises


-100%-80%-60%-40%-20%
0%20%40%60%80%
100%
Sing
apor
e
Rus
sia
Bul
garia
Eng
land
Luxe
mbo
urg
Hon
g K
ong
Hun
gary
Ital
y
New
Zea
land
Uni
ted
Stat
es
Swed
en
Ger
man
y
Isra
el
Aus
tria
Pola
nd
Chi
nese
Tai
pei
Net
herla
nds
Fran
ce
Spai
n
Rom
ania
Nor
way
Sout
h A
fric
a
Iran
Indo
nesia
Mor
occo
Kuw
ait
Qat
ar
Intermediate High Advanced Low Below low
• Students from Indonesia have lower reading skills
• In PIRLS 2006, about 46% students did not reach the low benchmark in reading achievement
Indonesia Update 2012 19


Measured with na1onal exam scores, there are large varia1ons of student performance at individual, school, and regional level
0 .2 .4 .6 .8 1
PapuaWest Papua
North MalukuMaluku
West SulawesiGorontalo
Southeast SulawesiSouth Sulawesi
Central SulawesiNorth Sulawesi
East KalimantanSouth Kalimantan
Central KalimantanWest Kalimantan
East Nusa TenggaraWest Nusa Tenggara
BaliBanten
East JavaDI Yogyakarta
Central JavaWest Java
DKI JakartaRiau Island
Bangka BelitungLampungBengkulu
South SumateraJambiRiau
West SumateraNorth Sumatera
NAD
Mathematics
Proportion of students having 5 points or higher score
Proportion of students having 6 points or higher score
Proportion of students having 7 points or higher score
Proportion of students having 8 points or higher score
0 .2 .4 .6 .8 1
PapuaWest Papua
North MalukuMaluku
West SulawesiGorontalo
Southeast SulawesiSouth Sulawesi
Central SulawesiNorth Sulawesi
East KalimantanSouth Kalimantan
Central KalimantanWest Kalimantan
East Nusa TenggaraWest Nusa Tenggara
BaliBanten
East JavaDI Yogyakarta
Central JavaWest Java
DKI JakartaRiau Island
Bangka BelitungLampungBengkulu
South SumateraJambiRiau
West SumateraNorth Sumatera
NAD
Indonesian Language
Proportion of students having 5 points or higher score
Proportion of students having 6 points or higher score
Proportion of students having 7 points or higher score
Proportion of students having 8 points or higher score
Source: calculated using 2010 junior secondary school national exam data (N:3.5 million) 21

The Teacher Law: UU 14/2005
• Qualifications Upgrading • Professional Certification • Quality Assurance • On-Going Professional Development • Mapping, Deployment and Recruitment
Requirements • Welfare • Information Management Systems

The Teacher Law: UU 14/2005
• The Teacher Law provides an opportunity for teachers to improve their knowledge and skills through a certification process.
• By 2015, Indonesia’s schools system will only allow certified teachers which is a bold step in the right direction.
• To be certified, teachers must have a 4-year college degree and teach a minimum of 24 periods a week.
• Doubling of teacher salary upon certification; (possibly) tripling of salary with special area allowance.
23

24
Plan of teachers’ quali2ication improvement to S-‐1
Improvement of teachers’ quali2ication

Teacher’s certi2ication
Year Target (%) Annual target Realization
2014 100 436.731
2013 90 436.731
2012 80 436.731
2011 70 391.097 360.000 2010 55 391.097 200.000 2009 40 521.462 200.000 2008 20 299.841 200.000 2007 8,5 221.621 200.450 2006 0
Total 2.783.321 1.160.450
Plan of teacher’s certification 2011-2014
25

Portofolio documents

Evaluation of portofolio
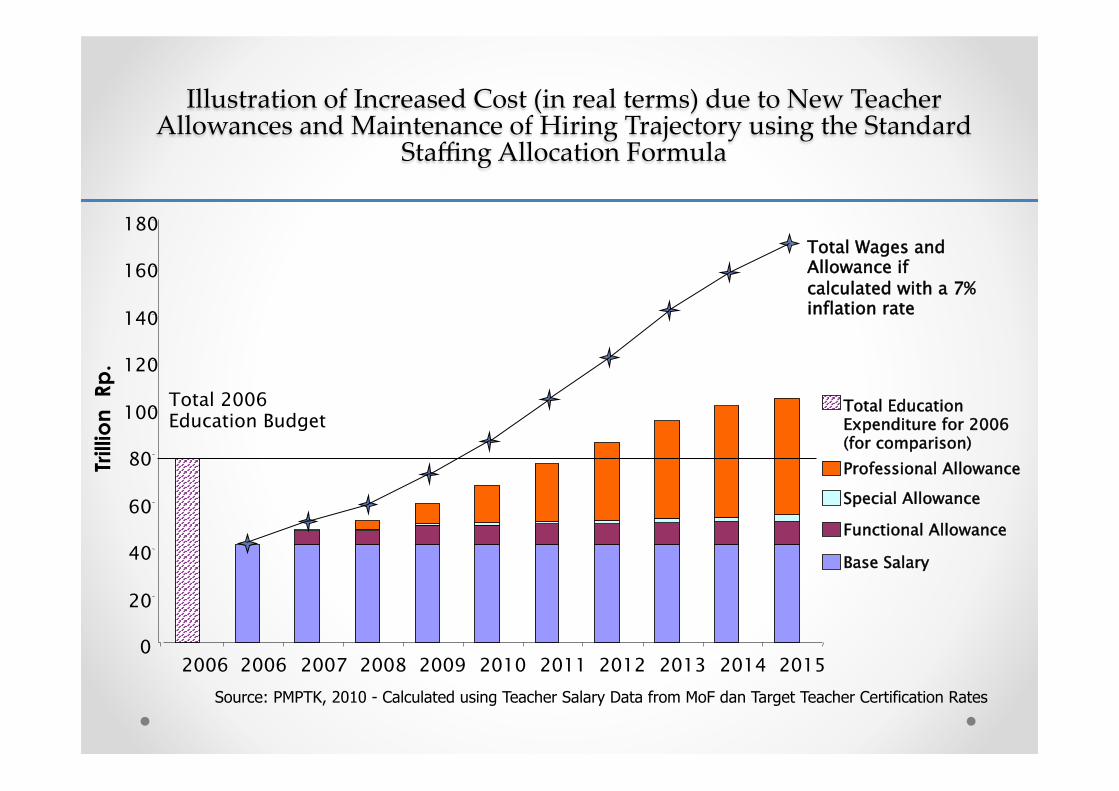
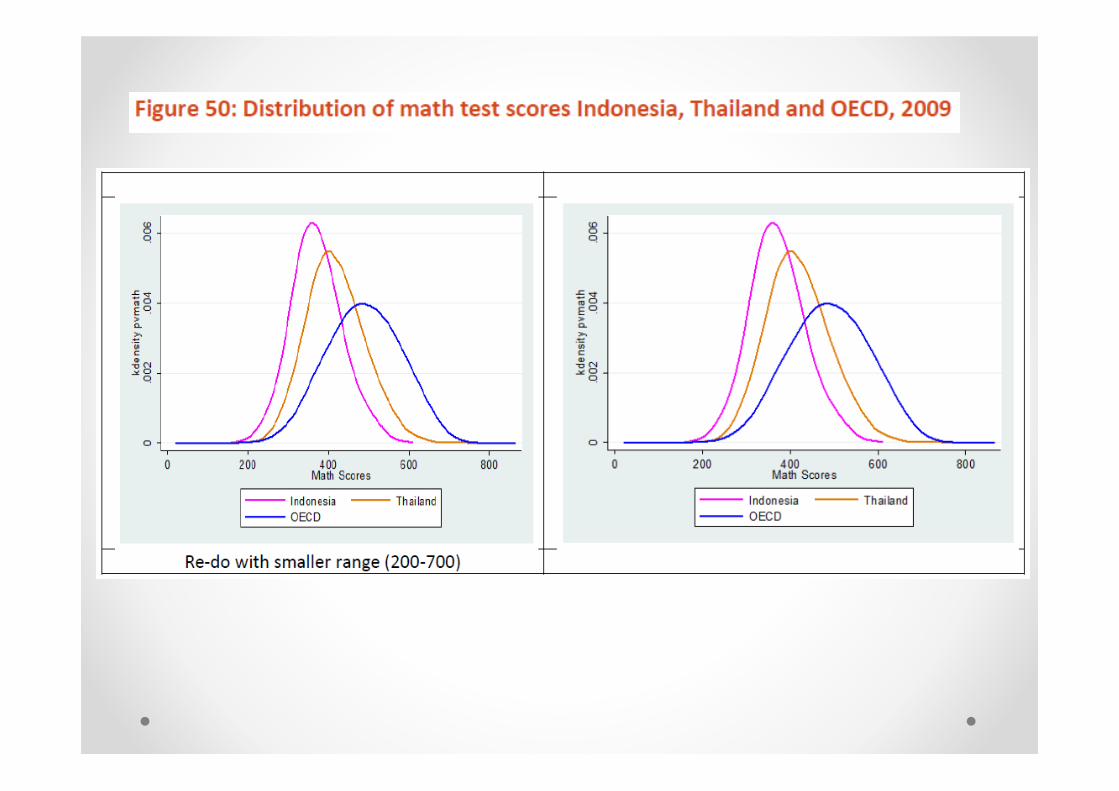
Illustration of Increased Cost (in real terms) due to New Teacher Allowances and Maintenance of Hiring Trajectory using the Standard
Staffing Allocation Formula
Source: PMPTK, 2010 - Calculated using Teacher Salary Data from MoF dan Target Teacher Certification Rates
20 40 60 80 100 120 140 160 180
0 2006
Total 2006 Education Budget
2006 2007 2008 2009 2010 2011 2012 2013 2014 2015
Trill
ion
Rp
.
Total Wages and Allowance if calculated with a 7% inflation rate
Total Education Expenditure for 2006 (for comparison) Professional Allowance
Functional Allowance
Special Allowance
Base Salary


0
5
10
15
20
0
100
200
300
400
500
600
Indonesia Japan China Singapore Korea Thailand
Stud
ent
Tea
cher
Rat
io
Mat
h Sc
ore
Math Score Student Teacher Ratio 2007
• Indonesia’s STR is be]er than that in other countries à one of the lowest STR in the world
• The low STR does not lead to be]er student performance, as indicated by student performance in interna1onal standardized tests
Source: UNESCO Edstats online query database & TIMMS 2007
Indonesia Update 2012 31

68%52%
17%
-21%-37%
-66%
-80%
-60%
-40%
-20%
0%
20%
40%
60%
80%
Urban Rural Remote
Over Under
Teacher Distribution per Region - Percent Oversupply, Undersupply and Entitlement
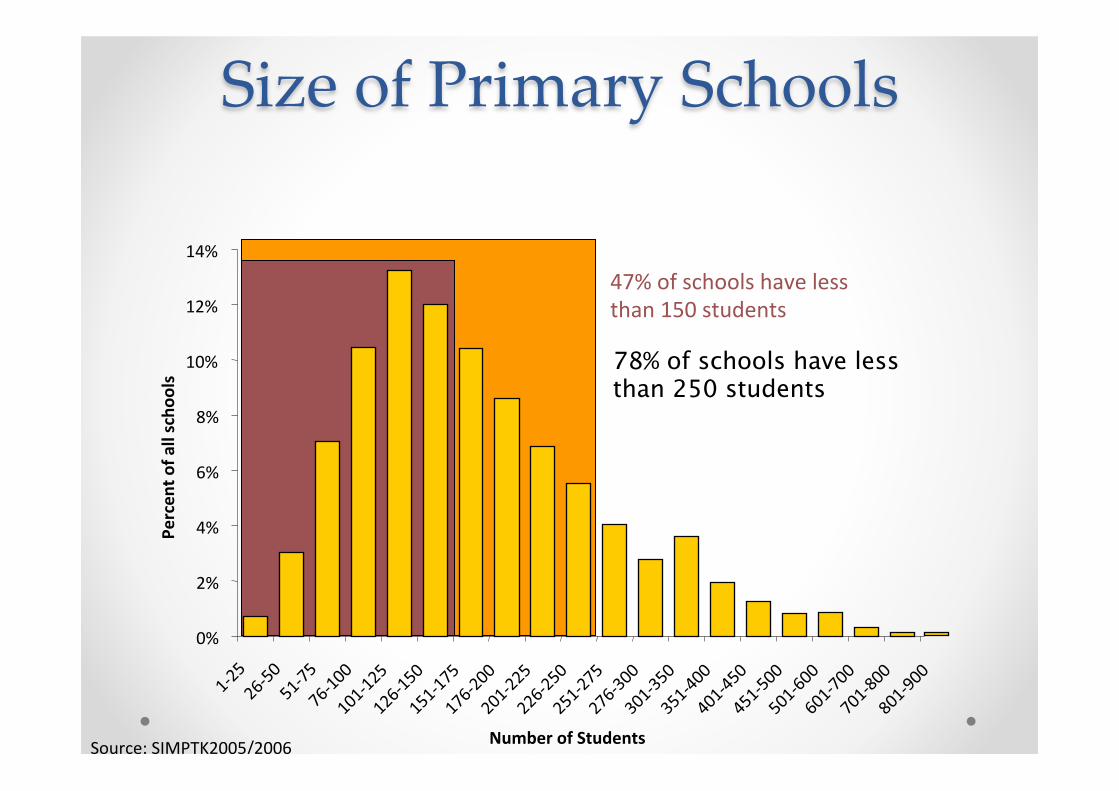
Size of Primary Schools
0%
2%
4%
6%
8%
10%
12%
14%
Number of Students
Percen
t of a
ll scho
ols
47% of schools have less than 150 students
78% of schools have less than 250 students
Source: SIMPTK2005/2006

Indonesia Update 2012 34
1.0 3.0 1.0 11.0
4.0 13.0
2.0
58.9
36.9 46.1
51.3 50.0 49.1
32.6
90.0
80.0 87.5 90.0
97.0 95.0
72.0
-
20.0
40.0
60.0
80.0
100.0
Kindergarten Primary School Junior Secondary
School
General Senior Secondary
School
Vocational Senior
Secondary School
Special School
School Supervisors
Minimum Average Maximum
The competency of teacher and school supervisor are very low
Performance of teachers & school supervisors in a recent competency test conducted by the Ministry of Education and Culture

School leadership & supervision • School principals are lack of leadership knowledge and skill • Problems in the appointment of school principals and school
supervisors • Professional development for school principals and school
supervisors have been neglected • Unclear career advancement for school principals and school
supervisors • Insufficient resources for supervisory ac1vi1es
Indonesia Update 2012 35

Does certification make the system more efficient?
- Before certification program introduced, only 35% primary teachers and 19% junior secondary teachers taught 18 hours or more - Now, nearly 100% certified teach 18 hours or more, while non-certified teachers also significantly increased teaching hours.
36

Prevalence (%) of Teachers with Second Jobs
37
32% 34%
27%
0%
10%
20%
30%
40%
Baseline 2009 Midline 2011
Control Treatment
Source: World Bank Staff Calculations
Are teachers more motivated due to certification efforts?

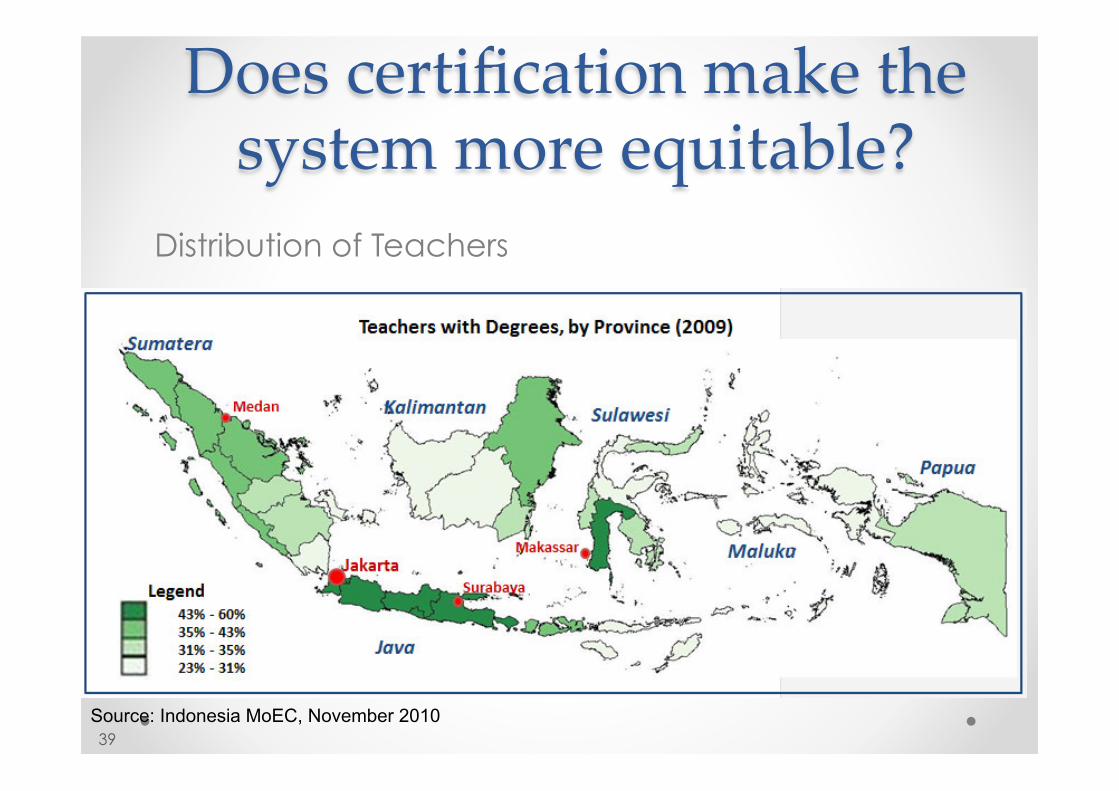
Does certification make the system more equitable?
Distribution of Teachers
39 Source: Indonesia MoEC, November 2010

Does Certification improve the quality of the teaching
force? 0
510
1520
2530
3540
45
S1, certified S1, not certified not S1, certified not S1, not certifiedSource: Teacher certification IE data (1700 SD teachers)
by degree and certification statusAverage Primary School (SD) teacher test scores
40
• S1 is key requirement for certification
• S1 teachers are only slightly better on average (on a 60 question subject knowledge test)
• S1/Certification is not a very useful indicator of teacher subject knowledge
• Certified and noncertified teachers score similarly, regardless of degree

Does certification influence pre-‐‑service training?
41
23,086
15,747
2,878
11,638
4,311
39,281
24,496
3,783
23,214
6,064
0
5,000
10,000
15,000
20,000
25,000
30,000
35,000
40,000
45,000
PGSD English Education English Mathematics Education
Mathematics
Applicants at 5 Study Programs at 15 Institutions
56% 100%
70%
Source: Puslitjak, 2009

Policy Direc,on
Indonesia Update 2012 42

Indonesia Update 2012 43
1. Teacher quality improvement a. Building the capacity for the recogni1on of prior
learning of teachers à reducing the need for trainings for knowledge and skill that teachers already possess
b. Building the capacity of the local teacher working groups.
c. Reforming teacher accountability and incen1ve systems.
d. Realigning the role of in-‐service training providers.

MGMP

MGMP

KKG and MGMP

47
Most teacher-‐working-‐groups require teachers to a]end all ac1vi1es
75%
76%
20%
21%
5%
2%
1%
1%
0% 10% 20% 30% 40% 50% 60% 70% 80% 90% 100%
MGMP
KKG
wajib semua kegiatan dapat gantian dgn guru lain tidak wajib lainnyaMandatory to agend all activities
Might be replaced by other teachers
Not mandatory Other

48
Teachers’ percep1on on the benefit of KKG/MGMP
4%
3%
5%
6%
9%
10%
18%
45%
3%
4%
6%
6%
7%
8%
25%
42%
0% 5% 10% 15% 20% 25% 30% 35% 40% 45% 50%
Self-confident, accountability, motivated
Improve in Learning Assessment, Student Evaluation
Communication, decree, getting funds, rewards
Support effective & relevant teaching
Syllabus and lesson plan
Produce innovative T&L model, teaching aids, media
Discuss difficult problem & problem solving
Improved knowledge, skills, competencies, & professionalism
KKGMGMP
Source: KKG/MGMP survey

49
Lessons obtained from KKG/MGMP
32%
45%
56%
49%
62%
77%
33%
50%
56%
62%
65%
78%
0% 10% 20% 30% 40% 50% 60% 70% 80% 90%
Classroom action research
Teaching material & skills
Teaching-learning evaluation
Creating teaching kits
Teaching methods
Curriculum development
KKG MGMP
Source: KKG/MGMP survey

50
Main obstacles of KKG/MGMP
35%
47%
9%
12%
9%
6%
7%
3%
19%
14%
0% 10% 20% 30% 40% 50% 60% 70% 80% 90% 100%
MGMP
KKG
Insufficient budget Lack of instructors Unclear programs Lack of coaching Other

51
Teachers’ expecta1on to improve the effec1veness of KKG/MGMP
29%
57%
57%
68%
63%
31%
58%
64%
74%
75%
0% 10% 20% 30% 40% 50% 60% 70% 80% 90% 100%
Facilitating network with other institutions
Provision of budget
Following-up the evaluation
Provision of structured activities
Provision of intensive coaching
KKG MGMP

52
Dura1on of mee1ngs are rela1vely short
Duration of Meetings (Survey)
3%
72%
17%6%3%
24%
39%33%
0%10%20%30%40%50%60%70%80%90%
100%
< 2 jam 2-3 jam 4-5 jam > 5 jam
KKG MGMP
Duration of Meeting (Observation)
56%
37%
5% 2%
40%48%
8%3%
0%10%20%30%40%50%60%70%80%90%
100%
< 2 jam 2-3 jam 4-5 jam > 5 jam
KKG MGMP

Indonesia Update 2012 53
e. U1lizing informa1on technology to support teacher professional development.
• Providing access to IT-‐based teaching materials
• Providing access to share good prac1ces
f. Developing a financing system for teacher professional development
• U1liza1on of school subsidy program to finance teacher professional development par1cularly the teacher working groups
• Exploring the possibility of “semi-‐self-‐finance” for teacher con1nuous development

Challenges of teachers’ qualification program
geographical
transporta1on
infrastructure
maintain the duty

The use of ICT in teacher’s qualification improvement at
SD Arso 7, Papua

56
0% 10% 20% 30% 40% 50% 60% 70%
Other
Central
District
Sub-District
School
Teacher
KKGMGMP
• Teachers expect schools could finance KKG/MGMP ac1vi1es
• Some teachers are willing to self-‐finance their involvement in their professional development

Indonesia Update 2012 57
2. Improvement of school leadership and supervision • Law enforcement in the recruitment of school
principals & supervisors at district level
• Providing school supervisors with adequate opera1onal facili1es/resources
• Sehng up a school principal & supervisor career advancement & reward system to reinforce performance and maintain mo1va1on

Geographical challenges in Papua

59
Challenges of quality improvement in Papua

60

HONAI


Sekolah di Soba
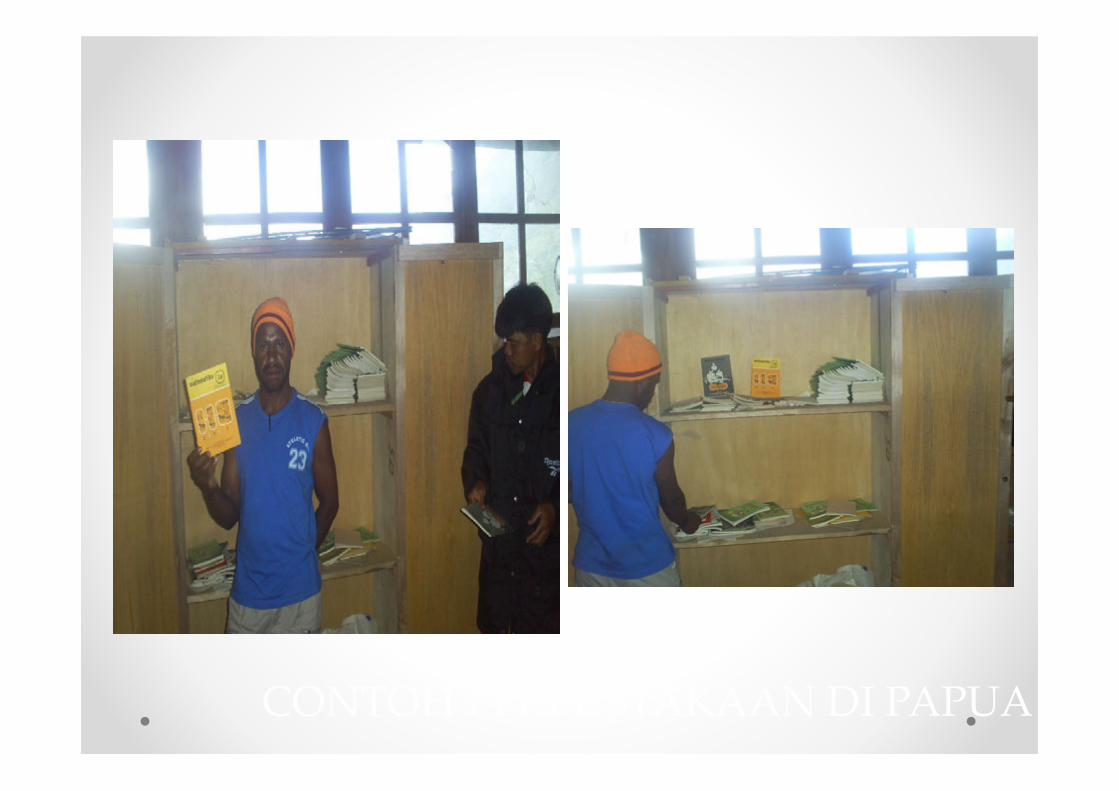
CONTOH PERPUSTAKAAN DI PAPUA

65
Literacy Education in Papua


67


First and foremost, the Law defines teaching as a profession and sets out the basic principles on
which it is established: a) Teachers have “… talent, interest, zeal and idealism”; b) Teachers have “… commitment to improving the quality of
education, faith, devoutness and good morale”; c) Teachers have “… educational qualifications and backgrounds
in their fields”; d) Teachers “… have the necessary competencies in their fields”; e) Teachers are “… responsible for the performance in their
professional tasks”; f) Teachers “… earn income according to their performance”; g) Teachers “… have opportunities to develop the profession in a
sustainable way through lifelong learning”; h) Teachers “… have a legal protection guarantee in performing
their professional tasks”; i) Teachers “… have a professional organization having the
authority to regulate professional matters for Teachers and have a scientific professional organization for lecturers”.

In carrying out their professional tasks, teachers have the right to:
a) Receive incomes above the minimum subsistence level and social security benefits;
b) Gain promotions and receive rewards in accordance with their tasks and performance;
c) receive legal protection in carrying out their tasks and exercising their intellectual property rights;
d) Have opportunities to improve their competencies; e) Receive and use learning facilities and infrastructure to support
their professional tasks; f) Have the freedom to give scores and take part in deciding
graduation, rewards, and/or sanctions on students in accordance with educational rules, the teaching code of ethics and legislation;
g) Derive a feeling of safety and security in carrying out their tasks; h) Have freedom of union in their professional organizations; i) Have opportunities to take part in deciding educational policies; j) Have opportunities to develop and improve quality and skills;
and k) Receive training and professional development in their fields.

In return for their professional service, teachers are entitled to receive an income above the
minimum subsistence level. This will consist of:
a) Basic salary and inherent allowances: base salary as determined by the employer;
b) Professional allowances; c) Functional allowances; d) Special allowances, and e) Fringe benefits related to their teaching tasks and
determined under the principles of performance-based rewards.