4 Exploratory synovial fluid peptidomics for the study of osteoarthritis
28
55 4 Exploratory synovial fluid peptidomics for the study of osteoarthritis Abstract Synovial fluid is likely to contain markers for early disease diagnosis and progression in degenerative joint diseases such as osteoarthritis. For those diseases, endogenous peptides may be of special interest, as they are protein degradation products (reflecting proteins present and protease activity) as well as bioactive compounds involved in signaling and communication. We report here the dedicated analysis of endogenous peptides in human synovial fluid samples from donors with osteoarthritis (OA), rheumatoid arthritis (RA), and from controls, by means of sensitive nanoLC coupled to high resolution mass spectrometry. In total ~1000 peptide features were compared among all samples and principal component analysis revealed clustering of the three groups. While fibrinogen fragments contributed considerably to this grouping, significant disease associated alterations were also found in the levels of peptide fragments derived from collagens (I, II, III), osteopontin, kininogen, complement components 3&4, serum amyloid A, and various histones. Amongst the most interesting findings was that levels of the pain and inflammation mediator bradykinin and its hydroxylated form were elevated in OA, when compared to control and RA. This study represents state-of-the-art analytical approaches in peptidomics research and pinpoints novel directions of research for its continued development. Based on: Kamphorst J. J.; DeGroot J.; van der Heijden R.; Reijmers T. H.; Lafeber F. P. J. G.; van der Greef J.; Hankemeier T. Exploratory synovial fluid peptidomics for the study of osteoarthritis. Submitted to Annals of the Rheumatic Diseases
Transcript of 4 Exploratory synovial fluid peptidomics for the study of osteoarthritis
55
4 Exploratory synovial fluid peptidomics for the study of osteoarthritis
Abstract Synovial fluid is likely to contain markers for early disease diagnosis and progression in degenerative joint diseases such as osteoarthritis. For those diseases, endogenous peptides may be of special interest, as they are protein degradation products (reflecting proteins present and protease activity) as well as bioactive compounds involved in signaling and communication. We report here the dedicated analysis of endogenous peptides in human synovial fluid samples from donors with osteoarthritis (OA), rheumatoid arthritis (RA), and from controls, by means of sensitive nanoLC coupled to high resolution mass spectrometry. In total ~1000 peptide features were compared among all samples and principal component analysis revealed clustering of the three groups. While fibrinogen fragments contributed considerably to this grouping, significant disease associated alterations were also found in the levels of peptide fragments derived from collagens (I, II, III), osteopontin, kininogen, complement components 3&4, serum amyloid A, and various histones. Amongst the most interesting findings was that levels of the pain and inflammation mediator bradykinin and its hydroxylated form were elevated in OA, when compared to control and RA. This study represents state-of-the-art analytical approaches in peptidomics research and pinpoints novel directions of research for its continued development.
Based on: Kamphorst J. J.; DeGroot J.; van der Heijden R.; Reijmers T. H.; Lafeber F. P. J. G.; van der Greef J.; Hankemeier T. Exploratory synovial fluid peptidomics for the study of osteoarthritis. Submitted to Annals of the Rheumatic Diseases
Exploratory synovial fluid peptidomics for the study of osteoarthritis
56
1. Introduction
Osteoarthritis (OA) is a degenerative joint disease that is characterized by progressive cartilage destruction and bone changes, occasionally accompanied by synovial inflammation (1). A variety of risk factors are known to predispose to the development of OA, including age, gender, bone density, obesity, joint injury and nutritional factors. Despite the growing knowledge on the pathogenesis of OA, its etiology is still not clear and effective disease-modifying treatment is lacking; existing therapies primarily comprise analgesics.
Whereas multiple biological mechanisms with potential involvement in OA pathology have been studied, most studies focus on a single molecular event or pathway that trigger or perpetuate cartilage degradation. These studies provided enormous amounts of new insights into the workings of the disease, but the lack of adequate treatment and diagnostics still persists. It is therefore worthwhile to ‘cast a wider net’ by using ‘omics’ approaches, which allow the study of new disease mechanisms and new levels of biological information. Through this approach it is thought that new biomarkers for OA by which diseases progression and efficacy of treatment can be accurately assessed, can be elucidated (2).
One particularly interesting level of biological information for OA, which has been largely ignored thus far, is that of the endogenous peptides (<10 kDa or 100 amino acids). The study of these endogenous peptides is called peptide profiling or peptidomics. This is in contrast to proteomics that generally deals with large proteins (> 10 kDa). In a peptidomics experiment the endogenous peptides are extracted from the sample of interest, and subsequently analyzed in an unprocessed manner (no additional digestion with a protease) using for example LC-MS. The peptides are endogenous degradation products of proteins and consequently their analysis provides a comprehensive view of the actual protease activity in the sample. In addition, peptides are known bioactive compounds that are involved in signaling and communication (for example, hormones, growth factors, and cytokines). Examples of existing peptide biomarkers in various disease areas are
Chapter 4
57
collagen telopeptides (e.g. CTX-II) for OA, osteocalcin for osteoporosis, and Pro-GRP for small-cell lung cancer (3).
A number of analytical methods have been reported for peptide profiling in serum, plasma, and cerebrospinal fluid (CSF). For example, using μLC-MS, 340 low molecular mass proteins could be identified in serum (4). In another study, 804 serum peptides were identified, belonging to 359 proteins (5).
In this work no enzymatic digestion was used, and therefore, proteolytic activity could be described by analyzing peptide cleavage sites. In a CSF peptide profiling study, 20 peptides were identified, originating from 12 unique proteins of which 4 were known to be associated with CNS disorders (6). Svensson et al. identified some 20 novel neuropeptides from mouse and hypothalamic extracts using ultrafiltration and nanoLC-MS (7).
As both degradation and signaling play an important role in OA pathology, the study of endogenous peptides is likely to increase our understanding of the disease and reveal potential biomarkers. While targeted approaches for the detection of collagen type II neoepitope peptides by an immunoaffinity LC-MS2 assay and for serum amyloid A-derived peptides by LC-MS have been reported in literature (8;9), we were the first to report an analytical platform for the comprehensive, untargeted profiling of endogenous peptides in synovial fluid (SF, joint fluid) (10). With this platform, endogenous peptides can effectively be extracted from the highly viscous SF using a combination of ultrafiltration and SPE, followed by sensitive nanoLC-MS analysis. In the current paper we present an explorative peptidomics study, using OA, rheumatoid arthritis (RA, an inflammatory joint disease), and control samples. This study provides for the first time a view of the disease-related endogenous peptide content in synovial fluid. This could provide additional insight into the pathophysiologies of OA and RA and could eventually lead to novel biomarkers.

Exploratory synovial fluid peptidomics for the study of osteoarthritis
58
2. Materials and methods
2.1. Chemicals. ULC/MS grade acetonitrile (ACN), formic acid (FA, 99%) and ULC/MS grade water (for nanoLC analysis) were purchased from Biosolve (Valkenswaard, the Netherlands). TFA (99%) was purchased from Sigma (St. Louis, Missouri). Dimethyl sulfoxide (DMSO) and ammonium bicarbonate were purchased from Baker (Deventer, the Netherlands). Ultrapure water (5.5 µS/m), used for sample preparation, was obtained from a Milli-Q gradient A10 system (Millipore, Bedford, Massachusetts). The high purity peptides bovine adrenal medulla dodecapeptide (BAMD), [Val5]-angiotensin I human, [Asn1, Val5]-angiotensin II, antiflammin-2, and ranakinin were obtained from Sigma (St. Louis, Missouri, USA), and syntide 2, myomodulin, kassinin, and C-peptide from Genscript (Piscataway, New Jersey, USA).
2.2. Synovial fluid samples. Synovial fluid (SF) samples were obtained from the knees of patients with osteoarthritis (OA, during surgery), rheumatoid arthritis (RA, via arthrocentesis), and from individuals without a joint disease (post mortem) and were stored at -80 °C. All procedures were conducted according to local ethical standards.
2.3. Sample preparation. The SF sample preparation procedure was based on our previously published method (10). Briefly, fifty microliters of each thawed SF sample was diluted with 330 µl 50 mM ammonium bicarbonate solution pH 8, containing 5% DMSO. To this, 20 µl of a 10% DMSO solution was added, containing 200 nmol/L of each of the internal standards BAMD, [Val5]-angiotensin I human, [Asn1, Val5]-angiotensin II, myomodulin, ranakinin, kassinin, and C-peptide. The samples were then centrifuged for 10 min at 14 000g and 4 °C to remove debris, after which the supernatant of each sample was transferred to a pre-washed ultrafiltration device (Microcon YM-30, Millipore, Bedford, Massachusetts) with a nominal molecular mass limit of 30 kDa, followed by centrifugation at 10 000g for 50 min at 4 °C. Subsequently 100 µl of the ammonium bicarbonate solution was added on top of the membrane to wash the residual material and to extract remaining peptides, after which the device was centrifuged again for 10 min. The resulting filtrate of about 500 µl was acidified with 50 µl 10%

Chapter 4
59
TFA and SPE was performed with POROS R2 C18 96 wells filter plates (Glygen, Columbia, Maryland) according to the manufacturer’s instructions; the peptides were eluted with 70% ACN containing 0.1% TFA.
The eluates were then lyophilized, reconstituted in 20 µl of a Milli-Q solution with 5% FA and 5% DMSO and 200 nmol/L of each of the internal standard peptides syntide 2 and antiflammin-2 (11), and subsequently stored at -80 °C until analysis.
2.4 Reversed-phase nanoLC-MS. To assess the analytical performance of the platform during the analysis of the series of samples, multiple analytical duplicates for samples in each of the three groups (OA, RA, control) were analyzed. In addition, a quality control (QC) sample (from a single donor, of which large quantities were available) was analyzed at regular intervals (every ninth analysis) during the sample series.
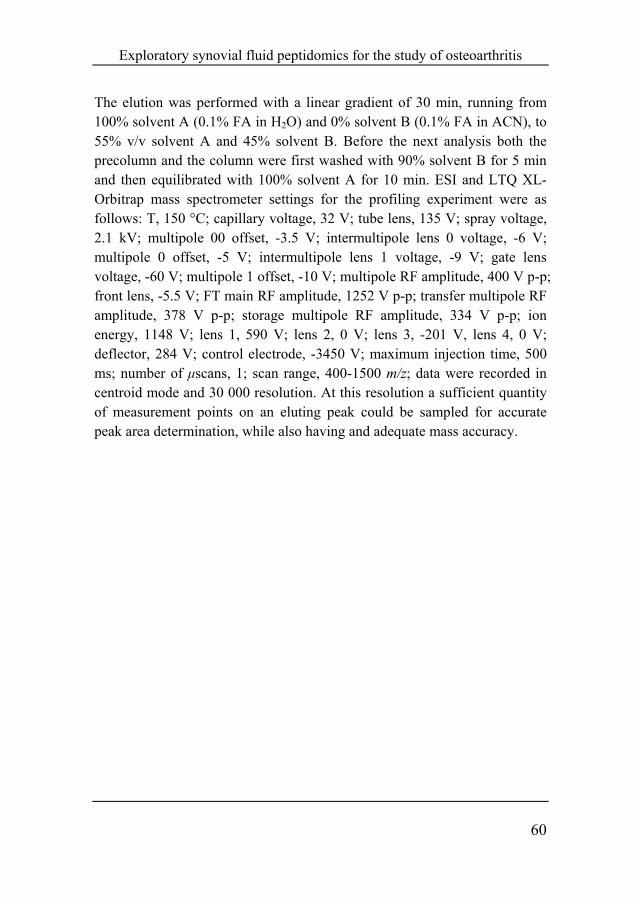
For separation an Ultimate 3000 pump system (LC Packings, Amsterdam, the Netherlands) was used, in combination with an LTQ XL-Orbitrap mass spectrometer for the profiling experiment (see Figure 1 for a typical chromatogram) and an LTQ-FTICR mass spectrometer for the identification experiment (Thermo Scientific, San Jose, California). To have an efficient nanoLC-MS system, the system's dead volume, both between the precolumn and column (pre-column dead volume) and after the column (post-column dead volume) was minimized. This was achieved by using a Dean's switching setup as described by Meiring et al (12). In our particular case 2 μl of sample was loaded onto a precolumn (0.1 x 20 mm, 5 μm C18 particles; NanoSeparations, Nieuwkoop, the Netherlands) with a flow rate of 5 μl/min using 0.1% FA. After loading and washing for 5 min, the precolumn and column (0.05 x 270 mm, 3 μm BioSphere C18 particles, NanoSeparations) were switched in series and the peptides were eluted with a flow rate of about 150 nl/min into the mass spectrometer via a small gold and carbon sputtered spray-tip (NanoSeparations), to which the voltage is applied. In this setup the outlet of the column and the spray-tip are directly connected to each other, resulting in a post-column dead volume of as little as 5 nl.
Exploratory synovial fluid peptidomics for the study of osteoarthritis
60
The elution was performed with a linear gradient of 30 min, running from 100% solvent A (0.1% FA in H2O) and 0% solvent B (0.1% FA in ACN), to 55% v/v solvent A and 45% solvent B. Before the next analysis both the precolumn and the column were first washed with 90% solvent B for 5 min and then equilibrated with 100% solvent A for 10 min. ESI and LTQ XL-Orbitrap mass spectrometer settings for the profiling experiment were as follows: T, 150 °C; capillary voltage, 32 V; tube lens, 135 V; spray voltage, 2.1 kV; multipole 00 offset, -3.5 V; intermultipole lens 0 voltage, -6 V; multipole 0 offset, -5 V; intermultipole lens 1 voltage, -9 V; gate lens voltage, -60 V; multipole 1 offset, -10 V; multipole RF amplitude, 400 V p-p; front lens, -5.5 V; FT main RF amplitude, 1252 V p-p; transfer multipole RF amplitude, 378 V p-p; storage multipole RF amplitude, 334 V p-p; ion energy, 1148 V; lens 1, 590 V; lens 2, 0 V; lens 3, -201 V, lens 4, 0 V; deflector, 284 V; control electrode, -3450 V; maximum injection time, 500 ms; number of μscans, 1; scan range, 400-1500 m/z; data were recorded in centroid mode and 30 000 resolution. At this resolution a sufficient quantity of measurement points on an eluting peak could be sampled for accurate peak area determination, while also having and adequate mass accuracy.
Chapter 4
61
Figure 1. Base peak chromatogram (A) and heat map (m/z vs. retention time) (B) of a typical nanoLC-MS separation of synovial fluid (Orbitrap, full scan). The separation took 35 minutes and the m/z range was 400-1500. The two-dimensional graph shows the part of the separation where most of the peptides elute. The spot intensity in the graph is represented by gray-scale changes, with black being the most intense signal, and white the lowest signal. The average relative standard deviation of the peptides’ peak areas is 20%, as was calculated from the QC samples, which were analyzed at regular intervals during the analysis.
Exploratory synovial fluid peptidomics for the study of osteoarthritis
62
2.5. Peptide identification. For the identification of peptides an LTQ-FTICR mass spectrometer was used. The FT settings were as follows: FT multipole 1 offset, 1.23 V; FT intermultipole lens 1, 114.08 V; FT multipole 2 offset, 15.31 V; FT intermultipole lens 2, 121.68 V; FT multipole 3 offset, 41.58 V; FT multipole 1 and 2 amplitude, 317.17 V p-p; FT multipole 3 amplitude, 233.81 V p-p; maximum injection time, 500 ms; number of μscans, 1. During analysis the mass spectrometer continuously performed scan cycles in which first a high resolution (100 000) full scan (400-1500 m/z) in profile mode was performed by the FT, after which MS2 spectra were recorded by the LTQ in centroid mode for the 3 most intense ions (isolation width, 4 m/z; normalized collision energy, 35% and 40%). Dynamic exclusion was enabled (repeat count, 1; repeat duration, 30 s; exclusion list size, 500; exclusion duration, 180 s; relative exclusion mass width, 5 ppm) as was charge state screening. Singly charged ions were not fragmented. In addition to the 30 min gradient as discussed in the previous section, the samples were separated with a 3 h gradient running from 100% solvent A and 0% solvent B, to 72% v/v solvent A and 28% solvent B. The obtained spectra were correlated with a recent version of the human FASTA database (November 2008) using Bioworks v3.3 (Thermo Scientific, San Jose, California). The following post-translational modifications were taken into account: C-terminal amidation; phosphorylation on S, T, and Y; hydroxylation on P and K; oxidation on M; pyroglutamic acid formed from Q or E. The following settings were used for the search engine: mass type, monoisotopic precursor and fragments; enzyme, no enzyme; peptide tolerance, 20 ppm; fragment ion tolerance, 1 AMU; number of results scored, 250; ions and ion series calculated, B and Y; peptide matches reported, 10; PTMs per peptide, 3. For a peptide to be considered as identified it had to match the following criteria: Δppm < 5; Xcorr vs charge state (1 >= 1.8, 2 >= 2.5, 3 >= 3.5); ΔCN > 0.1; Peptide probability < 0.5.
2.6. Data processing. Untargeted peak detection, peak area calculation, and alignment were performed with MZmine 2 (13). The following features and settings were used in sequence: chromatogram builder, centroid mass detection (noise level 2x10⁵) and chromatogram construction (minimum time span 8 s, minimum height 5x10⁴, m/z tolerance 0.003 u); deisotoping,
Chapter 4
63
isotopic peaks grouping (m/z tolerance 0.003 u, RT tolerance 5 s, monotonic shape no, max charge 6, representative isotope lowest m/z); peak recognition, local maximum search (chromatographic threshold 80%, search minimum in RT range 8 s, minimum relative height 1%, minimum absolute height 5x10⁴, minimum ratio of peak top/edge 2); join aligner (m/z tolerance 0.003 u, weight for m/z 20, retention time tolerance type absolute, absolute RT tolerance 75 s, relative RT tolerance 15%, weight for RT 5, compare isotopic pattern yes, isotope pattern score threshold level 65%, weight for isotope pattern score 5); filter, remove duplicates (m/z tolerance 0.003 u, RT difference maximum 75 s); gap filling (intensity tolerance 20%, m/z tolerance 0.003 u, retention time tolerance 75 s, relative RT tolerance 15%); filter, peak list rows filter (minimum peaks in a row 5, minimum peaks in isotope pattern 1, minimum m/z 400.00 u, maximum m/z 1500.00 u, minimum retention time 8 min, maximum retention time 28 min). Remaining missing values for peak areas were substituted with 50% of the lowest calculated peak area for that peak in any of the samples.
Targeted peak area calculation was performed with LCquan v2.5. The peak areas of selected peptides were obtained from the smoothed extracted ion chromatograms. The following options were selected: m/z window, 25 ppm; trace, base peak; time window, 90 s; smoothing points, 5; baseline window, 40; area noise factor, 5; peak noise factor, 10; peak detection algorithm, ICIS; minimum peak height (S/N), 3.
Analytical variation in the peak areas was eliminated through standardization by dividing the peak area of each peak by the peak area of the most closely eluting internal standard. Subsequently, all peaks in a sample were normalized with the median peak area for that sample, to compensate for systematic variations in concentration levels between samples.
Statistics and visualization were performed with MATLAB R2006a (the MathWorks, Natick, Massachusetts) and Office Excel 2003 (Microsoft, Redmond, Washington).

Exploratory synovial fluid peptidomics for the study of osteoarthritis
64
3. Results
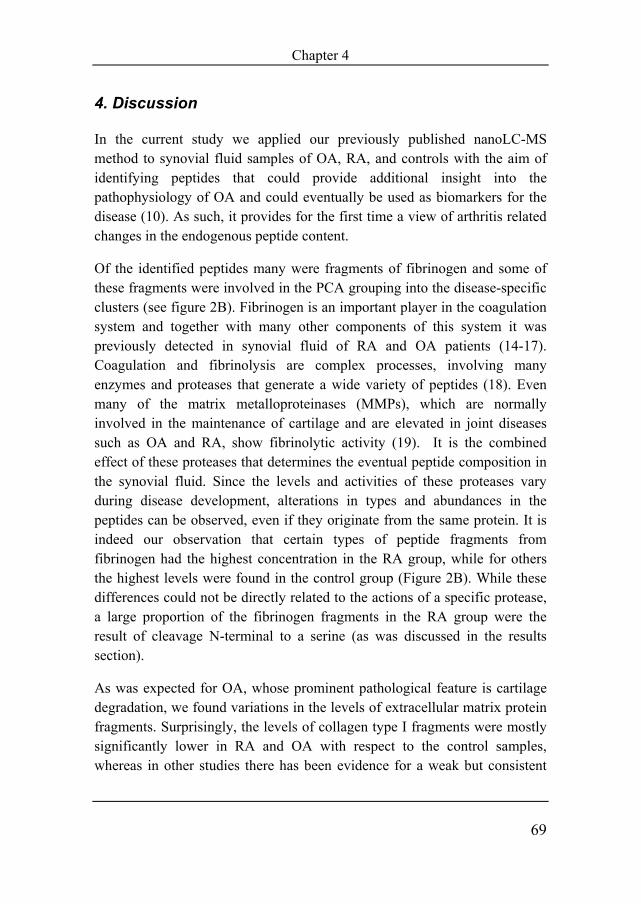
3.1. Synovial fluid peptidomics. Synovial fluid samples were analyzed by nanoLC-MS from donors suffering from osteoarthritis (OA) (15 samples), rheumatoid arthritis (RA) (12 samples), as well as samples from controls (15 samples). The internal standards in the QC analyses showed an average relative standard deviation of 20%, indicating that the platform’s functioning during the series was satisfactory. Untargeted peptide feature detection and peak area calculation were performed for all samples with the software program MZmine 2. This way, peak areas for 988 peptide features could be calculated in the chromatograms from all samples. After correcting for analytical and biological variation (see data processing section), variations in the relative levels of the endogenous peptides among the three groups were visualized with principal component analysis (PCA) (see Figure 2A). From the PCA plot constructed for the analyzed samples two conclusions can be derived. Firstly, the analytical duplicates are positioned closely to each other. This means that the analytical variation is much smaller than the biological variation observed. Secondly, while there is considerable overlap in the center, there is an apparent clustering observable between the OA, RA, and control groups, indicating that there are disease-specific variations in the relative levels of (groups of) endogenous peptides. Additionally, while the individual OA samples cluster closely to each other, more variation between the samples is observed for the RA and control groups. This could suggest that, for the currently used set of samples OA pathology has the least diversity among patients in the processes detected.

Chapter 4
65
3.2. Characterization of the peptide features causing clustering of the disease groups. To learn which peptides were causing the disease specific clustering, we combined the information of the loadings plot from the PCA model with the peptide identity information gathered from the analyses using the LTQ-FTICR MS and database searches. A striking observation was that many of the identified peptides were fragments of the fibrinogen protein (116 fragments observed) and that some of these fragments were in part responsible for the clustering of the disease-specific groups (see Figure 2B). We found that 38% of the fibrinogen fragments with highest levels in the RA group were the result of cleavage N-terminal to a serine, versus 9% for fibrinogen fragments with highest levels in controls.
Figure 2. Scores plot (A) and loadings plot (B) of the first two principal components of the PCA model. The relative position of the analytical duplicates in the scores plot shows that the analytical variation is much smaller than the biological variation, and a clustering of the samples of the osteoarthritis, rheumatoid arthritis and control groups is clearly observable. The loadings plot shows which peptide features are causing the clustering. Highlighted (red triangle) are the 116 features that are identified as fragments from the fibrinogen proteins. Although not being the only cause, several of these fragments are contributing to the grouping of the rheumatoid arthritis and control samples.
Exploratory synovial fluid peptidomics for the study of osteoarthritis
66
Apart from those derived from fibrinogen, fragments from other proteins were also responsible for the disease-specific grouping of the samples.
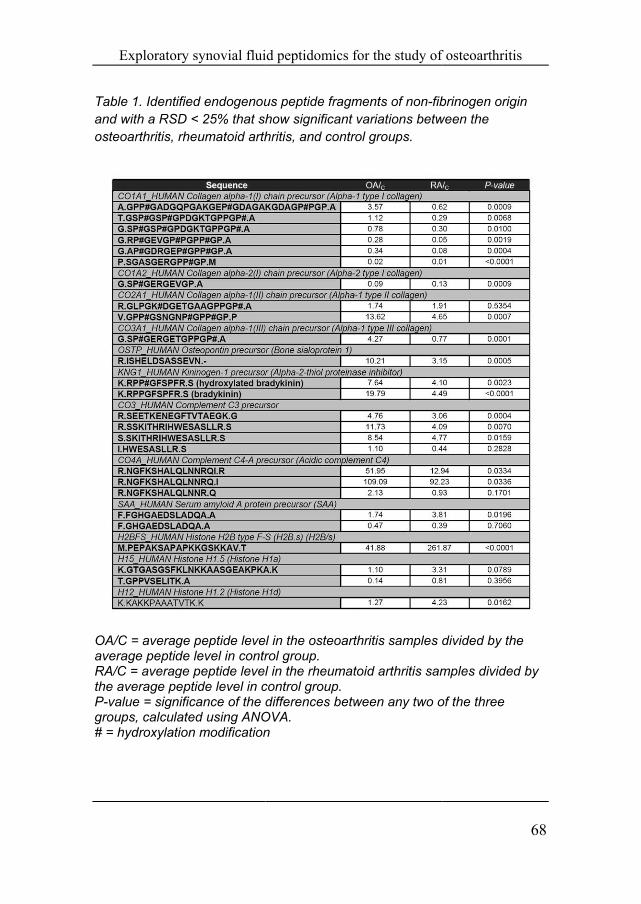
The peak areas of these peptide features were manually verified with the program LCquan and were required to have a RSD <25% in the QC samples to be included for further (ANOVA) data analysis (see Table 1). Some peptide features had higher RSD values, most likely due to their low abundance and their peak areas are therefore not reliable enough for further statistical evaluation. The levels of collagen type I fragments were mostly lower in RA and OA compared to the control samples. Next to this, increased levels in the OA samples were found for peptide fragments of type II collagen (the main component of cartilage) and type III collagen. All but one of the collagen fragments have the same C-terminal sequence of ~GPPGP, suggesting that they were cleaved (or processed after initial cleavage) by the same protease(s). Likewise, significant alterations in the concentration levels were found for fragments of osteopontin and for proteins involved in inflammation (Complement components 3&4, serum amyloid A, and kininogen). The observed fragments of kininogen are the known bioactive peptides bradykinin and its hydroxylated form. Both peptides were significantly elevated in OA when compared to both the RA and control groups (see Figure 3). Various fragments from histone proteins were also observed and were mostly increased in levels in the RA samples.

Chapter 4
67
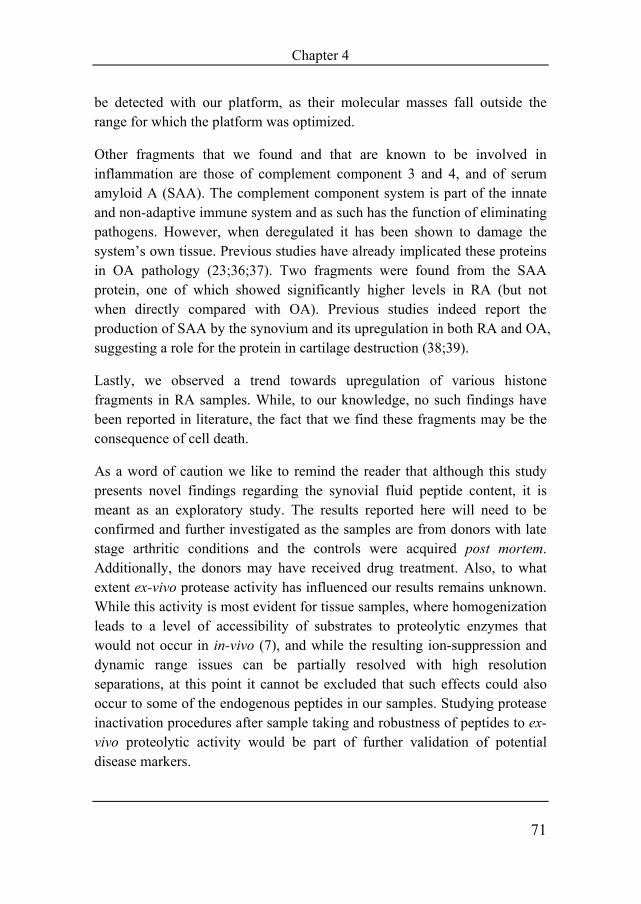
Figure 3. Fragmentation spectra (left) of bradykinin and hydroxylated bradykinin, and the box plots (right) showing the results of ANOVA analysis. A significant rise in the levels of the bioactive peptide and its hydroxylated form is clearly observable in OA when compared with control and RA.
Explorator
Table 1. Identiand with a RSosteoarthritis,
OA/C = averagaverage peptidRA/C = averagthe average peP-value = signgroups, calcul# = hydroxylat
ry synovial flui
ified endogenouSD < 25% that sh
rheumatoid arth
ge peptide levede level in contrge peptide leveleptide level in c
nificance of the lated using ANOtion modification
id peptidomics f
us peptide fragmhow significant hritis, and contr
l in the osteoartrol group. l in the rheumat
control group. differences betw
OVA. n
for the study of
ments of non-fibvariations betw
rol groups.
thritis samples d
toid arthritis sam
ween any two o
f osteoarthritis
brinogen origin ween the
divided by the
mples divided b
of the three
68
by
Chapter 4
69
4. Discussion In the current study we applied our previously published nanoLC-MS method to synovial fluid samples of OA, RA, and controls with the aim of identifying peptides that could provide additional insight into the pathophysiology of OA and could eventually be used as biomarkers for the disease (10). As such, it provides for the first time a view of arthritis related changes in the endogenous peptide content.
Of the identified peptides many were fragments of fibrinogen and some of these fragments were involved in the PCA grouping into the disease-specific clusters (see figure 2B). Fibrinogen is an important player in the coagulation system and together with many other components of this system it was previously detected in synovial fluid of RA and OA patients (14-17). Coagulation and fibrinolysis are complex processes, involving many enzymes and proteases that generate a wide variety of peptides (18). Even many of the matrix metalloproteinases (MMPs), which are normally involved in the maintenance of cartilage and are elevated in joint diseases such as OA and RA, show fibrinolytic activity (19). It is the combined effect of these proteases that determines the eventual peptide composition in the synovial fluid. Since the levels and activities of these proteases vary during disease development, alterations in types and abundances in the peptides can be observed, even if they originate from the same protein. It is indeed our observation that certain types of peptide fragments from fibrinogen had the highest concentration in the RA group, while for others the highest levels were found in the control group (Figure 2B). While these differences could not be directly related to the actions of a specific protease, a large proportion of the fibrinogen fragments in the RA group were the result of cleavage N-terminal to a serine (as was discussed in the results section).
As was expected for OA, whose prominent pathological feature is cartilage degradation, we found variations in the levels of extracellular matrix protein fragments. Surprisingly, the levels of collagen type I fragments were mostly significantly lower in RA and OA with respect to the control samples, whereas in other studies there has been evidence for a weak but consistent

Exploratory synovial fluid peptidomics for the study of osteoarthritis
70
upregulation at the mRNA and protein level (20-24). This indicates that higher levels of collagen I are maintained in OA and RA by a combination of heightened production and a lower degradation rate. Next to this, increased levels in the OA samples were found for peptide fragments of type II (the main component of cartilage) and type III, being consistent with earlier, published findings.
The fact that the C-terminal sequence for almost all collagen fragments is ~GPPGP, is a good demonstration of the ability of our platform to study actual protease activities.
Also contributing to the PCA clustering were the peptides derived from kininogen (which belongs to the group of kinins): these are the bioactive molecules bradykinin (BK) and its hydroxylated form (Figure 3). Generally, BK is formed in plasma and inflamed tissue, and by activating the B2 receptor it mediates its vasodilatory, inflammatory, and algesic functions. In the joint it is known to be produced in the synovium, and it has been shown that higher levels of BK in synovial fluid coincide with joint diseases as OA and RA (25). BK plays its part in an intricate biological system, and (while relatively unstudied in OA) it is also suspected to play a role in the release of cytokines, proteolytic enzymes, and growth factors, thus contributing to the progression of OA cartilage degradation. Our finding that both BK and its hydroxylated form have significantly higher levels in synovial fluid of OA and RA patients compared to controls corroborates findings in earlier studies (26-30). However, our finding that both kinin peptides are significantly elevated in OA in direct comparison to RA presents new and exciting information.
With our platform we were able to study one fragment originating from a protein with cytokine-like functions, namely a 13 amino acid fragment from the C-terminus of noncollagenous matrix protein osteopontin (31-33). For this fragment clear elevation in OA with respect to RA and the control samples was observed. There have been multiple publications demonstrating the upregulation of the (intact) protein and its mRNA in the synovial fluid and cartilage of OA and RA patients (31;34;35). Other cytokines could not
Chapter 4
71
be detected with our platform, as their molecular masses fall outside the range for which the platform was optimized.
Other fragments that we found and that are known to be involved in inflammation are those of complement component 3 and 4, and of serum amyloid A (SAA). The complement component system is part of the innate and non-adaptive immune system and as such has the function of eliminating pathogens. However, when deregulated it has been shown to damage the system’s own tissue. Previous studies have already implicated these proteins in OA pathology (23;36;37). Two fragments were found from the SAA protein, one of which showed significantly higher levels in RA (but not when directly compared with OA). Previous studies indeed report the production of SAA by the synovium and its upregulation in both RA and OA, suggesting a role for the protein in cartilage destruction (38;39).
Lastly, we observed a trend towards upregulation of various histone fragments in RA samples. While, to our knowledge, no such findings have been reported in literature, the fact that we find these fragments may be the consequence of cell death.
As a word of caution we like to remind the reader that although this study presents novel findings regarding the synovial fluid peptide content, it is meant as an exploratory study. The results reported here will need to be confirmed and further investigated as the samples are from donors with late stage arthritic conditions and the controls were acquired post mortem. Additionally, the donors may have received drug treatment. Also, to what extent ex-vivo protease activity has influenced our results remains unknown. While this activity is most evident for tissue samples, where homogenization leads to a level of accessibility of substrates to proteolytic enzymes that would not occur in in-vivo (7), and while the resulting ion-suppression and dynamic range issues can be partially resolved with high resolution separations, at this point it cannot be excluded that such effects could also occur to some of the endogenous peptides in our samples. Studying protease inactivation procedures after sample taking and robustness of peptides to ex-vivo proteolytic activity would be part of further validation of potential disease markers.
Exploratory synovial fluid peptidomics for the study of osteoarthritis
72
5. Conclusion
In the current study we applied our recently developed nanoLC-MS method to synovial fluid samples of OA, RA, and controls to identify peptides that could provide additional insight into the pathophysiology of OA and could help to find biomarkers for the disease. Comparison of the endogenous peptide profiles of the three groups revealed distinctive patterns resulting from a mix of protein degradation (linking proteins present and protease activitiy) and signalling events. Most of our findings were in agreement with previously published results, but we also made novel observations: lower levels of collagen I fragments in OA and RA, same C-terminal sequence for the collagen fragments, higher levels for the bioactive peptide bradykinin (and for hydroxylated bradykinin) in osteoarthritis in comparison to rheumatoid arthritis, and increased amounts of histone fragments in RA.
To bring this field of research further, future efforts will need to be directed towards both the technological and biological sides: while the analytical platform that we used is among the most sensitive known, the repertoire of peptides that we observed in this study is only part of the peptides actually present (i.e. we miss the very low concentration peptides). Therefore, ever increasing sensitivity and robustness in chromatographic separations and mass spectrometers will continue to be in demand, as well as improvements in sample preparation & enrichment, and identification. From a biological perspective, the results obtained are exciting and insightful, but will need to be further explored by assessing the extent to which ex-vivo protease activity is occurring and skewing the biological interpretation, as well as by analyzing the endogenous peptide content in a variety of sample types relevant to joint disease, so as to gain a better insight in the diagnostic quality of the candidate markers.

Chapter 4
73
Acknowledgements
This study was financed by the research programme of the Centre for Medical Systems Biology (CMSB), which is part of the Netherlands Genomics Initiative/Netherlands Organization for scientific research.
Reference List (1) Wieland H. A.; Michaels M.; Kirschbaum B. J.; Rudolphi K. A. Osteoarthritis: an
untreatable disease? Nat. Rev. Drug Disc. 2005, 4, 331-343. (2) DeGroot J.; Bank R. A.; Tchetverikov I.; Verzijl N.; TeKoppele J. M. Molecular
markers for osteoarthritis: The road ahead. Curr. Opin. Rheumatol. 2002, 14, 585-589.
(3) Schulte I.; Tammen H.; Selle H.; Schulz-Knappe P. Peptides in body fluids and tissues as markers of disease. Expert Rev. Mol. Diagn. 2005, 5, 1-13.
(4) Tirumalai R. S.; Chan K. C.; Prieto D. A.; Issaq H. J.; Conrads T. P.; Veenstra T. D. Characterization of the low molecular weight human serum proteome. Mol. Cel. Proteomics. 2003, 2, 1096-1103.
(5) Zheng X.; Baker H.; Hancock W. S. Analysis of the low molecular weight serum peptidome using ultrafiltration and a hybrid ion trap-fourier transform mass spectrometer. J. Chromatogr. , A. 2006, 1120, 173-184.
(6) Yuan X.; Desiderio D. M. Human cerebrospinal fluid peptidomics. J. Mass Spectrom. 2005, 40, 176-181.
(7) Svensson M.; Sköld K.; Svenningsson P.; Andren P. E. Peptidomics-based discovery of novel neuropeptides. J. Proteome Res. 2003, 2, 213-219.
(8) Nemirovskiy O. V.; Dufield D. R.; Sunyer T.; Aggarwal P.; Welsch D. J.; Mathews W. R. Discovery and development of a type II collagen neoepitope (TIINE) biomarker for matrix metalloproteinase activity: From in vitro to in vivo. Anal. Biochem. 2007, 361, 93-101.
(9) Yavin E. J.; Preciado-Patt L.; Rosen O.; Yaron M.; Suessmuth R. D.; Levartowsky D.; Jung G.; Lider O.; Fridkin M. Serum amyloid A-derived peptides, present in human rheumatic synovial fluids, induce the secretion of interferon-g by human CD4+ T-lymphocytes. FEBS Lett. 2000, 472, 259-262.
(10) Kamphorst J. J.; van der Heijden R.; DeGroot J.; Lafeber F. P.; Reijmers T. H.; Van El B.; Tjaden U. R.; van der Greef J.; Hankemeier T. Profiling of endogenous peptides in human synovial fluid by NanoLC-MS: method validation and peptide identification. J. Proteome Res. 2007, 6, 4388-4396.
(11) van Midwoud P. M.; Rieux L.; Bischoff R.; Verpoorte E.; Niederländer H. A. G. Improvement of recovery and repeatability in liquid chromatography-mass spectrometry analysis of peptides. J. Proteome Res. 2007, 6, 781-791.
(12) Meiring H. D.; van der Heeft E.; ten Hove G. J.; de Jong A. P. J. M. Nanoscale LC-MS(n): Technical design and applications to peptide and protein analysis. J. Sep. Sci. 2002, 25, 557-568.
(13) Katajamaa M.; Miettinen J.; Oresic M. MZmine: Toolbox for processing and visualization of mass spectrometry based molecular profile data. Bioinformatics. 2006, 22, 634-636.
(14) Jespersen J.; Brommer E. J. P.; Haverkate F.; Nieuwenhuizen W. Degradation products of fibrin and fibrinogen in synovial fluid and in plasma of patients with rheumatoid arthritis. Fibrinolysis. 1989, 3, 183-186.
Exploratory synovial fluid peptidomics for the study of osteoarthritis
74
(15) Carmassi F.; De Negri F.; Morale M.; Song K. Y.; Chung S. I. Fibrin degradation in the synovial fluid of rheumatoid arthritis patients: A model for extravascular fibrinolysis. Semin. Thromb. Hemost. 1996, 22, 489-496.
(16) Chung S. I.; Lee S. Y.; Uchino R.; Carmassi F. Factors that control extravascular fibrinolysis. Semin. Thromb. Hemost. 1996, 22, 479-488.
(17) So A. K.; Varisco P.-A.; Kemkes-Matthes B.; Herkenne-Morard C.; Chobaz-Péclat V.; Gerster J.-C.; Busso N. Arthritis is linked to local and systemic activation of coagulation and fibrinolysis pathways. J. Thromb. Heamost. 2003, 1, 2510-2515.
(18) Tammen H.; Schulte I.; Hess R.; Menzel C.; Kellmann M.; Mohring T.; Schulz-Knappe P. Peptidomic analysis of human blood specimens: Comparison between plasma specimens and serum by differential peptide display. Proteomics. 2005, 5, 3414-3422.
(19) Sánchez-Pernaute O.; Largo R.; Calvo E.; Alvarez-Soria M. A.; Egido J.; Herrero-Beaumont G. A fibrin based model for rheumatoid synovitis. Ann. Rheum. Dis. 2003, 62, 1135-1138.
(20) Aigner T.; Fundel K.; Saas J.; Gebhard P. M.; Haag J.; Weiss T.; Zien A.; Obermayr F.; Zimmer R.; Bartnik E. Large-scale gene expression profiling reveals major pathogenic pathways of cartilage degeneration in osteoarthritis. Arthritis Rheum. 2006, 54, 3533-3544.
(21) Clements D. N.; Carter S. D.; Innes J. F.; Ollier W. E. R.; Day P. J. R. Gene expression profiling of normal and ruptured canine anterior cruciate ligaments. Osteoarthritis Cartilage. 2008, 16, 203-
(22) Meng J.; Ma X.; Ma D.; Xu C. Microarray analysis of differential gene expression in temporomandibular joint condylar cartilage after experimentally induced osteoarthritis. Osteoarthritis Cartilage. 2005, 13, 1115-1125.
(23) Appleton C. T. G.; Pitelka V.; Henry J.; Beier F. Global analysis of gene expression in early experimental osteoarthritis. Arthritis Rheum. 2007, 56, 1854-1868.
(24) Guo D.; Tan W.; Wang F.; Lv Z.; Hu J.; Lv T.; Chen Q.; Gu X.; Wan B.; Zhang Z. Proteomic analysis of human articular cartilage: identification of differentially expressed proteins in knee osteoarthritis. Joint Bone Spine. 2008, 75, 439-444.
(25) Meini S.; Maggi C. A. Knee osteoarthritis: a role for bradykinin. Inflamm. Res. 2008, 57, 351-361.
(26) Bathon J. M.; Manning D. C.; Goldman D. W.; Towns M. C.; Proud D. Characterization of kinin receptors on human synovial cells and upregulation of receptor number by interleuking-1. J. Pharmacol. Exp. Ther. 1992, 260, 384-392.
(27) Cassim B.; Naidoo S.; Ramsaroop R.; Bhoola K. D. Immunolocalization of bradykinin receptors on human synovial tissue. Immunopharmacology. 1997, 36, 121-125.
(28) Bond A. P.; Lemon M.; Dieppe P. A.; Bhoola K. D. Generation of kinins in synovial fluid from patients with arthropathy. Immunopharmacology. 1997, 36, 209-216.
(29) Rahman M. M.; Bhoola K. D.; Elson C. J.; Lemon M.; Dieppe P. A. Identification and functional importance of plasma kallikrein in the synovial fluid of patients with rheumatoid, psoriatic and osteoarhtritis. Ann. Rheum. Dis. 1995, 54, 345-350.
(30) Rahman M. M.; Worthy K.; Elson C. J.; Fink E.; Dieppe P. A.; Bhoola K. D. Inhibitor regulation of tissue kallikrein activity in synovial fluid of patients with rheumatoid arthritis. Br. J. Rheumatol. 1994, 33, 215-223.
Chapter 4
75
(31) Attur M. G.; Dave M. N.; Stuchin S.; Kowalski A. J.; Steiner G.; Abramson S. B.; Denhardt D. T.; Amin A. R. Osteopontin: An intrinsic inhibitor of inflammation in cartilage. Arthritis Rheum. 2001, 44, 578-584.
(32) Gravallese E. M. Osteopontin: a bridge between bone and the immune system. J. Clin. Invest. 2003, 112, 147-149.
(33) Yamamoto N.; Sakai F.; Kon S.; Morimoto J.; Kimura C.; Yamazaki H.; Okazaki I.; Seki N.; Fuji T.; Uede T. Essential role of the cryptic epitope SLAYGLR within osteopontin in a murine model of rheumatoid arthritis. J. Clin. Invest. 2003, 112, 181-188.
(34) Honsawek S.; Tanavalee A.; Sakdinakiattikoon M.; Chayanupatkul M.; Yuktanandana P. Correlation of plasma and synovial fluid osteopontin with disease severity in knee osteoarthritis. Clin. Biochem. 2009, 42, 808-812.
(35) Ohshima S.; Yamaguchi N.; Nishioka K.; Mima T.; Ishii T.; Umeshita-Sasai M.; Kobayashi H.; Shimizu M.; Katada Y.; Wakitani S.; Murata N.; Nomura S.; Matsuno H.; Katayama R.; Kon S.; Inobe M.; Uede T.; Kawase I.; Saeki Y. Enhanced local production of osteopontin in rheumatoid joints. J. Rheumatol. 2002, 29, 2061-2067.
(36) Wu J.; Liu W.; Bemis A.; Wang E.; Qiu Y.; Morris E. A.; Flannery C. R.; Yang Z. Comparative proteomic characterization of articular cartilage tissue from normal donors and patients with osteoarthritis. Arthritis Rheum. 2007, 56, 3675-3684.
(37) Gobezie R.; Kho A.; Krastins B.; Sarracino D. A.; Thornhill T. S.; Chase M.; Millet P. J.; Lee D. M. High abundance synovial fluid proteome: Distinct profiles in health and osteoarthritis. Arthritis Res. Ther. 2007, 9, R36-R51.
(38) O'Hara R.; Murphy E. P.; Whitehead A. S.; Fitzgerald O.; Bresnihan B. Acute-phase serum amyloid A production by rheumatoid arthritis synovial tissue. Arthritis Res. 2000, 2, 142-144.
(39) Vallon R.; Freuler F.; Desta-Tsedu N.; Robeva A.; Dawson J.; Wenner P.; Engelhardt P.; Boes L.; Schnyder J.; Tschopp C.; Urfer R.; Baumann G. Serum Amyloid A (apoSAA) expression is up-regulated in rheumatoid arthritis and induces transcription of matrix metalloproteinases. J. Immunol. 2001, 166, 2801-2807.

Exploratory synovial fluid peptidomics for the study of osteoarthritis
76
Chapter 4
77
Appendix: Evaluation of a chip-based nanoLC platform for peptidomics biomarker studies Aim of study
As part of our peptidomics effort, we have developed a nanoLC-MS platform for the sensitive analysis of endogenous peptides (1;2). This platform provides excellent analysis results in terms of sensitivity, peak width and repeatability. However, a point of attention is its somewhat limited robustness and limited ease of use; some proper training is required to connect the fitting. In addition, in longer sample series it can occur that after tens or hundreds samples the nanospray becomes unstable, and the sensitivity is changed. While sufficient for our purposes, the platform is not straightforward in its use for biomarker studies where large numbers (hundreds) of samples need to be analyzed. In this light, a chip-based nanoLC platform may present a suitable alternative as its design, in which the separation channels, switching valve and spray tip are integrated on a chip, potentially solves many issues with regards to robustness and ease of use (3). In this proof of principle study, we examined the usability of the chip-based nanoLC platform by comparing its separation efficiency and repeatability with our Dean’s switching nanoLC setup (chapter 3 and 4).
Methods
As different mass spectrometers (and settings) were used for the Dean’s switch nanoLC and the chip-based nanoLC setup, a direct comparison of sensitivity was not attainable. Therefore the comparison was focused on separation performance (peak width) and repeatability and robustness. Additional considerations are that the results from the Dean’s switch nanoLC are obtained with a 30 cm column with a diameter of 50 μm, and packed with 3 μm particles. The precolumn had a length of 2 cm with a diameter of 100 μm, and 5 μm particles. The separation was performed with a linear gradient of 30 min, running from 100% solvent A (0.1% FA in H2O) and 0% solvent B (0.1% FA in ACN), to 55% v/v solvent A and 45% solvent
Appendix: Evaluation of a chip-based nanoLC platform for peptidomics biomarker studies
78
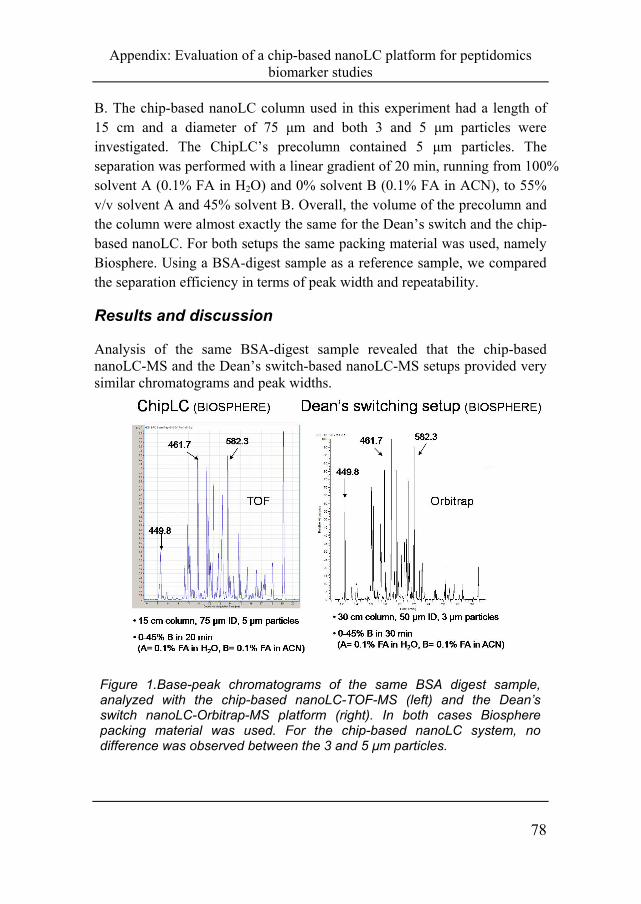
B. The chip-based nanoLC column used in this experiment had a length of 15 cm and a diameter of 75 μm and both 3 and 5 μm particles were investigated. The ChipLC’s precolumn contained 5 μm particles. The separation was performed with a linear gradient of 20 min, running from 100% solvent A (0.1% FA in H2O) and 0% solvent B (0.1% FA in ACN), to 55% v/v solvent A and 45% solvent B. Overall, the volume of the precolumn and the column were almost exactly the same for the Dean’s switch and the chip-based nanoLC. For both setups the same packing material was used, namely Biosphere. Using a BSA-digest sample as a reference sample, we compared the separation efficiency in terms of peak width and repeatability.
Results and discussion
Analysis of the same BSA-digest sample revealed that the chip-based nanoLC-MS and the Dean’s switch-based nanoLC-MS setups provided very similar chromatograms and peak widths.
Figure 1.Base-peak chromatograms of the same BSA digest sample, analyzed with the chip-based nanoLC-TOF-MS (left) and the Dean’s switch nanoLC-Orbitrap-MS platform (right). In both cases Biosphere packing material was used. For the chip-based nanoLC system, no difference was observed between the 3 and 5 μm particles.
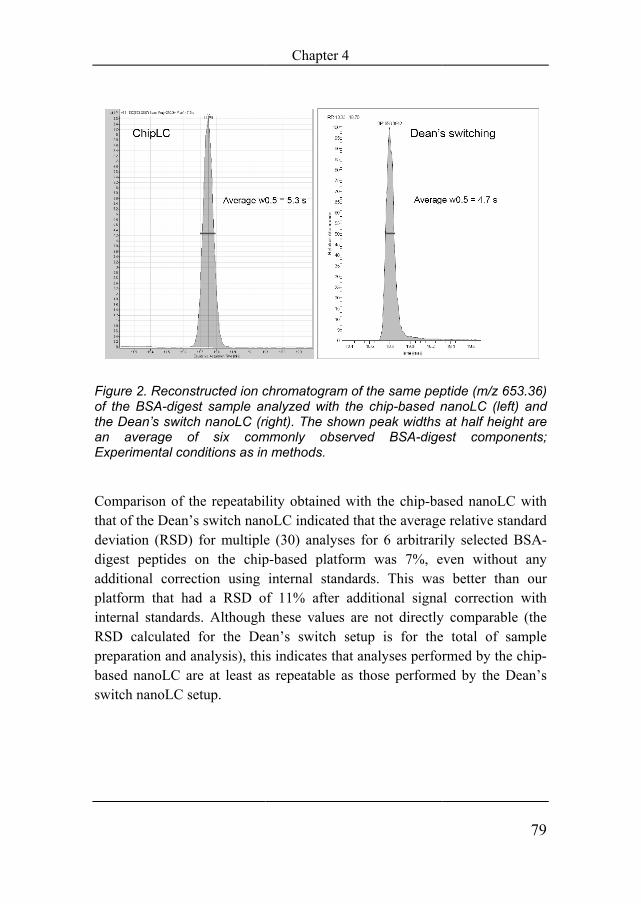
Figure 2. Recoof the BSA-dithe Dean’s swan average Experimental c
Comparison othat of the Deadeviation (RSdigest peptideadditional corplatform that internal standaRSD calculatepreparation anbased nanoLCswitch nanoLC
onstructed ion cigest sample an
witch nanoLC (riof six com
conditions as in
of the repeatabian’s switch nanD) for multiplees on the chiprrection using had a RSD o
ards. Although ed for the De
nd analysis), thiC are at least asC setup.
Chapter 4
chromatogram onalyzed with thright). The showmmonly obsern methods.
lity obtained wnoLC indicated te (30) analysesp-based platforinternal standa
of 11% after adthese values a
an’s switch ses indicates that s repeatable as
of the same pephe chip-based nwn peak widths rved BSA-dige
with the chip-bathat the averages for 6 arbitrarirm was 7%, eards. This wasdditional signaare not directlyetup is for the
analyses perforthose perform
ptide (m/z 653.3nanoLC (left) aat half height a
est componen
ased nanoLC we relative standaily selected BSeven without as better than oal correction wy comparable (te total of samprmed by the chied by the Dean
79
36) and are nts;
with ard A-
any our
with the ple ip-n’s
Appendix: Evaluation of a chip-based nanoLC platform for peptidomics biomarker studies
80
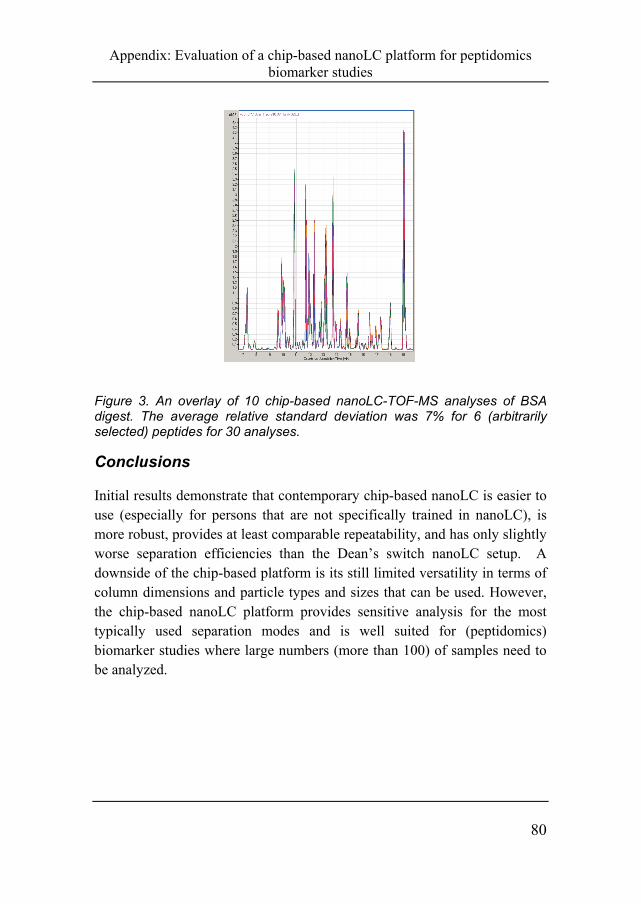
Figure 3. An overlay of 10 chip-based nanoLC-TOF-MS analyses of BSA digest. The average relative standard deviation was 7% for 6 (arbitrarily selected) peptides for 30 analyses.
Conclusions
Initial results demonstrate that contemporary chip-based nanoLC is easier to use (especially for persons that are not specifically trained in nanoLC), is more robust, provides at least comparable repeatability, and has only slightly worse separation efficiencies than the Dean’s switch nanoLC setup. A downside of the chip-based platform is its still limited versatility in terms of column dimensions and particle types and sizes that can be used. However, the chip-based nanoLC platform provides sensitive analysis for the most typically used separation modes and is well suited for (peptidomics) biomarker studies where large numbers (more than 100) of samples need to be analyzed.
Chapter 4
81
Acknowledgements
The author thanks Ad de Jong (RIVM) for kindly providing the Biosphere packing material. Also, Agilent Technologies is acknowledged for providing the resources for the chip-based nanoLC experiments.
Reference List
(1) Kamphorst J. J.; van der Heijden R.; DeGroot J.; Lafeber F. P.; Reijmers T. H.; Van El B.; Tjaden U. R.; van der Greef J.; Hankemeier T. Profiling of endogenous peptides in human synovial fluid by NanoLC-MS: method validation and peptide identification. J. Proteome Res. 2007, 6, 4388-4396.
(2) Meiring H. D.; van der Heeft E.; ten Hove G. J.; de Jong A. P. J. M. Nanoscale LC-MS(n): Technical design and applications to peptide and protein analysis. J. Sep. Sci. 2002, 25, 557-568.
(3) Yin H.; Killeen K.; Brennen R.; Sobek D.; Werlich M.; van de Goor T. Microfluidic chip for peptide analysis with and integrated HPLC column, sample enrichment column, and nanoelectrospray tip. Anal. Chem. 2005, 77, 527-533.

82