
4. Economics of Solar Thermal Power Plants - Department of Energy ...NSTPP/sites/default/files/2....
42
Economics of Solar Thermal Power in Economics of Solar Thermal Power in India: Rangan Banerjee Forbes Marshall Chair Professor Department of Energy Science and Engineering Indian Institute of Technology Bombay Solar Thermal Simulator Workshop, February 21, 2014
Transcript of 4. Economics of Solar Thermal Power Plants - Department of Energy ...NSTPP/sites/default/files/2....

Economics of Solar Thermal Power in Economics of Solar Thermal Power in India:
Rangan Banerjee
Forbes Marshall Chair Professor
Department of Energy Science and Engineering
Indian Institute of Technology Bombay
Solar Thermal Simulator Workshop, February 21, 2014

Challenges
Source: World Energy Outlook – 2008, International Energy Agency
1. Limited experience in CSP in the country
Solar Insolation and area required
= 2500 sq.km
k
2. Need for cost reduction
3. Need for indigenous technology, system development
2
= 625 sq.km4. Need for demonstration, public domain
information

Estimated cost of EnergyEstimated cost of Energy
` 5/kWh` 3/kWh ` 10/kWh5/kWh3/kWh 10/kWh
3
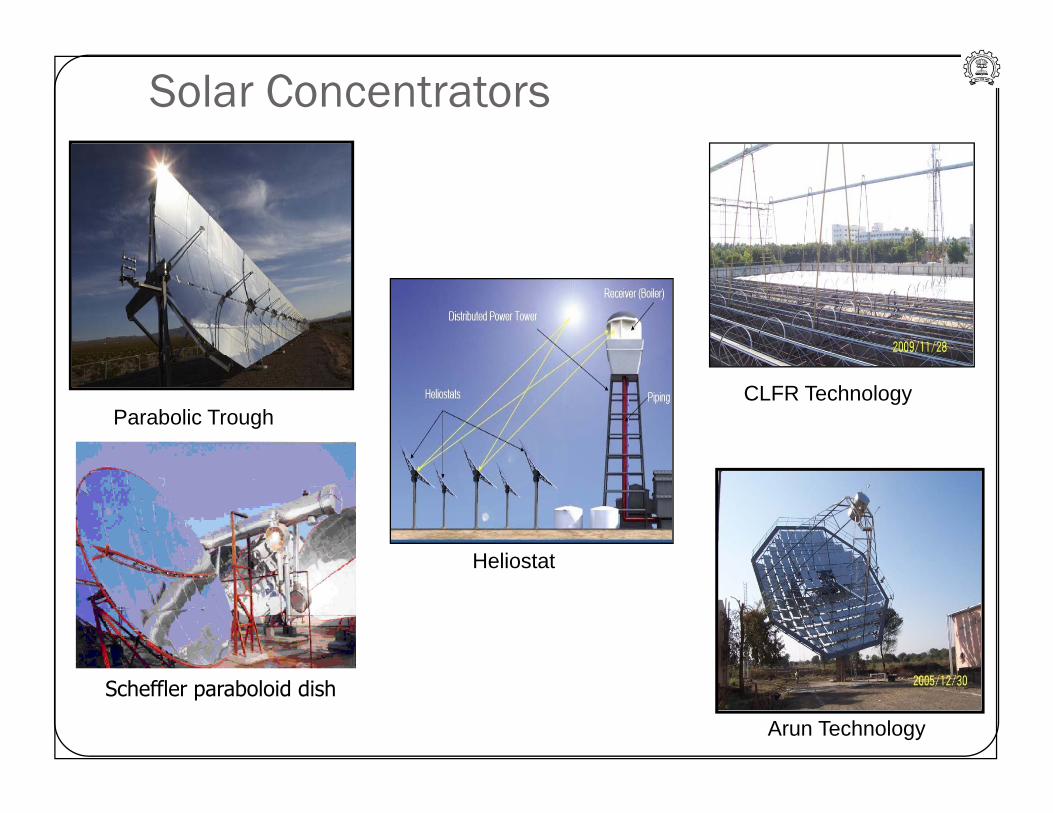
Solar Concentrators
CLFR TechnologyParabolic Trough
HeliostatHeliostat
Arun Technology
Scheffler paraboloid dish4
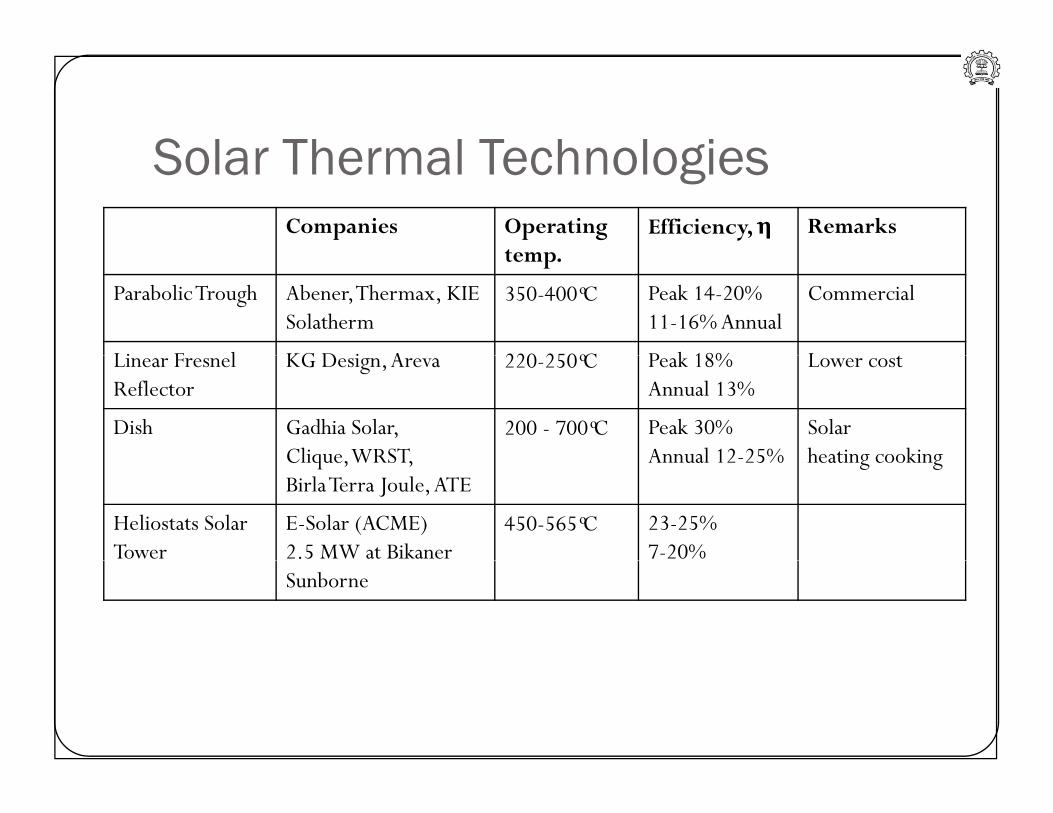
Solar Thermal TechnologiesSolar Thermal TechnologiesCompanies Operating
tempEfficiency, η Remarks
temp.
Parabolic Trough Abener, Thermax, KIE Solatherm
350-400 ͦC Peak 14-20%11-16% Annual
Commercial
Li F l KG D i A 220 250 ͦC P k 18% L Linear Fresnel Reflector
KG Design, Areva 220-250 ͦC Peak 18%Annual 13%
Lower cost
Dish Gadhia Solar, Clique WRST
200 - 700 ͦC Peak 30%Annual 12-25%
Solar heating cooking Clique, WRST,
Birla Terra Joule, ATEAnnual 12-25% heating cooking
Heliostats Solar Tower
E-Solar (ACME)2.5 MW at Bikaner
450-565 ͦC 23-25%7-20%
Sunborne
5

Worldwide operational CSP plants based on PTC technology(Source: http://www.nrel.gov/csp/solarpaces/by_status.cfm)
3000
3500
We)
2000
2500
3000
apacity
(MW
1500
2000
nstalled Ca
500
1000
umulative I
0
1983 1989 1995 2001 2007 2013
Cu
YearYear

Worldwide operational CSP plants based on PTC technology
• Most commercially applied technology with more than
3100 MWe installed capacity (Operational)p y ( p )
• Turbine inlet pressure range: 40 bar to 100 bar
S l Fi ld O tl t T t R 300°C t 550°C• Solar Field Outlet Temperature Range: 300°C to 550°C
• Godawari Green Energy ‐ Solar thermal power plant
o Turbine Capacity (Gross): 50.0 MW
o PPA/Tariff Rate: 12 2 Rs per kWho PPA/Tariff Rate: 12.2 Rs per kWh
o PPA/Tariff Period: 25 years

Worldwide operational CSP plants based on SPT technology(Source: http://www.nrel.gov/csp/solarpaces/by_status.cfm)
Capacity (MW)
Name Country Aperture Area (m2)
Tower Height (m)
HTF Solar Field Outlet Temp. (°C)
Storage (hrs)
Turbine Inlet Pressure (b )(bar)
11 PS10 Spain 75000 115 Water 300 1 4520 PS20 Spain 150000 165 Water 300 1 45
19 9 Gemasolar Spain 318000 140 Molten 565 15 -19.9 Gemasolar Spain 318000 140 Molten Salt
565 15 -
5 Sierra Sun Tower
USA 27670 55 Water 440 0 -
1.5 Julich Solar Tower
Germany 18000 60 Air 680 1.5 -
2.5 ACME India 16279 46 Water - 0 60
1 Dahan Power
China 10000 118 Water 400 1 -
Plant
3 Lake Cargelligo
Australia 6080 - Water 500 Yes 50

Worldwide operational CSP plants based on LFR technology(Source: http://www.nrel.gov/csp/solarpaces/by_status.cfm)
Capacity (MW)
Name Developer/ EPC
Country Aperture Area (m2)
Storage (hrs)
Turbine Inlet Pressure (bar)
Solar Field Outlet Temp. (°C)
0.25 Augustin Fresnel
Solar Euromed
France 4000 0.25 100 300
9 Liddell No atec A stralia 18490 55 2709 Liddell Power Station
Novatec Solar
Australia 18490 - 55 270
5 Kimberlina Areva USA 26000 - 40 -5 Kimberlina Areva USA 26000 40
1.4 Puerto Errado 1
Novatec Solar
Spain 18662 yes 55 270
30 P t N t S i 302000 0 5 55 27030 Puerto Errado 2
Novatec Solar
Spain 302000 0.5 55 270
• 100 MWe CSP plant of Reliance Power about to commissioned• 100 MWe CSP plant of Reliance Power about to commissioned
• Project cost: $336 million (Source: www.csp‐world.com)

Configuration
Plant Configuration
Fluid Technology Operation
Parabolic Trough CLFR
Water/
Trough
StOnly
B ff ThermicFluid
Water/ Direct Steam
Storage Buffer Storage

Ann alised Life C cle CostAnnualised Life Cycle Cost Annualised Life Cycle Costs (ALCC) - annual cost of owning
d ti i tand operating equipment
ALCC = C0 CRF(d,n) + AC f + AC O&M CRF (d n) =[ d(1+d)n]/[(1+d)n-1] CRF (d,n) [ d(1+d) ]/[(1+d) 1] discount rate d, Life n years, C0 Capital Cost,AC f
, AC O&M , annual cost - fuel and O&M CRF –i l fCapital recovery factor
Cost of Generated Energy = ALCC/ Annual net generationgeneration

Schematic of Solar Thermal Power Plant
Thermal Storage
Generator
Turbine
Solar Field (Oil)
Heat Exchanger
Condenser
Cooling Water CircuitCircuit
Expansion Vessel
Balance Components
PumpPump

Assumptions – Cost AnalysisEquipment Cost (Rs.) Per Unit Remarks
HX 10 Million MWe
PT cost 15000 m2
2CLFR cost 10000 m2
HTFcost 150 kg
Mirrors 0.5 % Annual Replacement
HTF 1 % Annual ReplacementHTF 1 % Annual Replacement
Receivers 2 % Annual Replacement
O&M 3 % Of Equipment

T end in CSP Plant CostTrend in CSP Plant Cost
Source: Krishnamurthy, P., Mishra, S., and Banerjee, R., Energy Policy, 2012

PTC Power Plant Capital CostPTC Power Plant Capital Cost
Source: IRENA, 2012
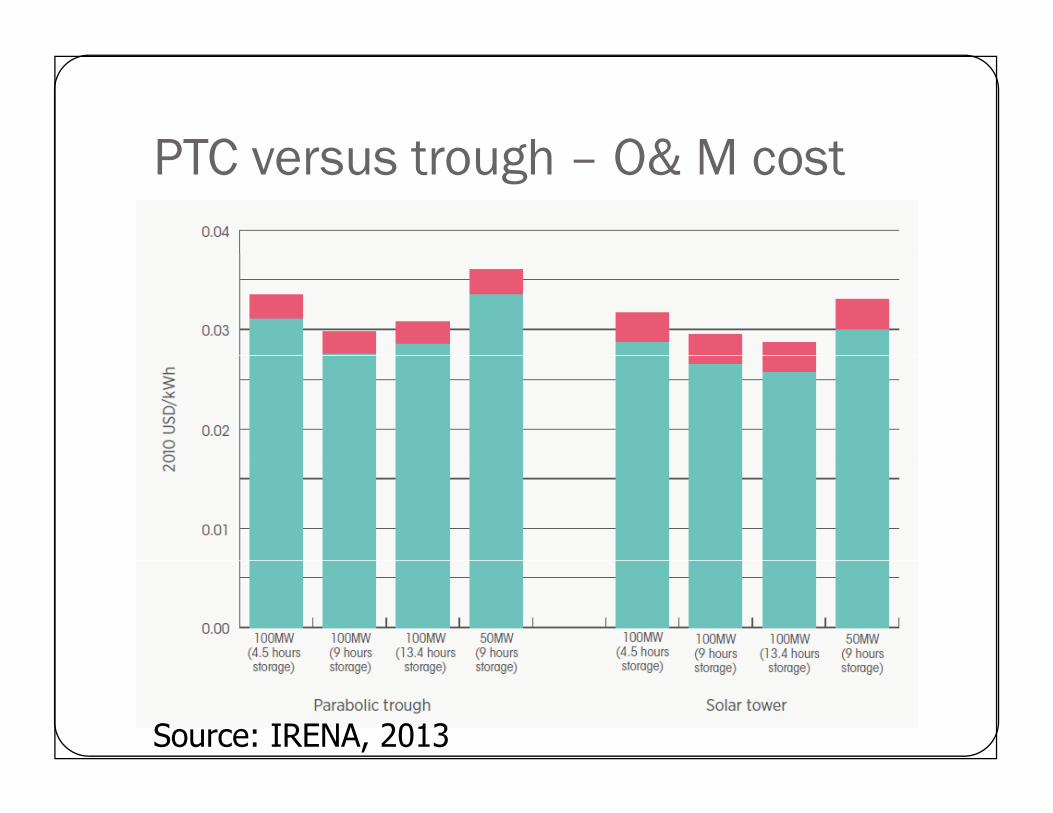
PTC versus trough O& M costPTC versus trough – O& M cost
Source: IRENA, 2013
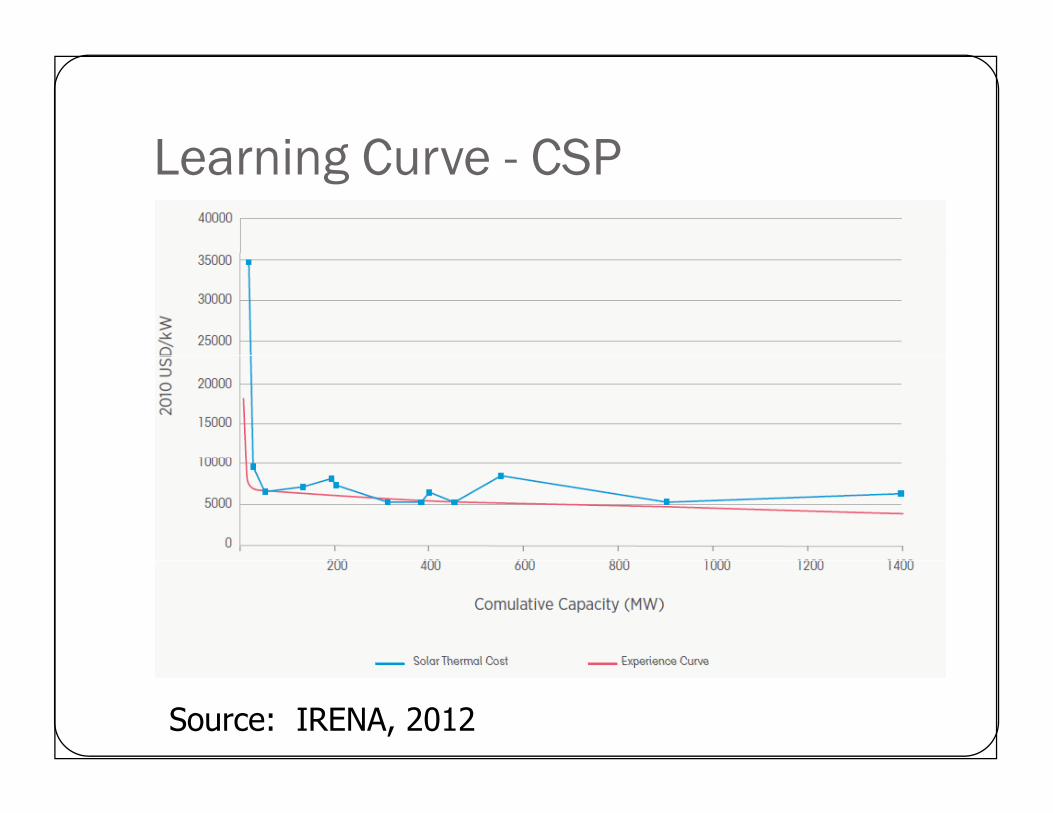
Learning Curve CSPLearning Curve - CSP
Source: IRENA, 2012
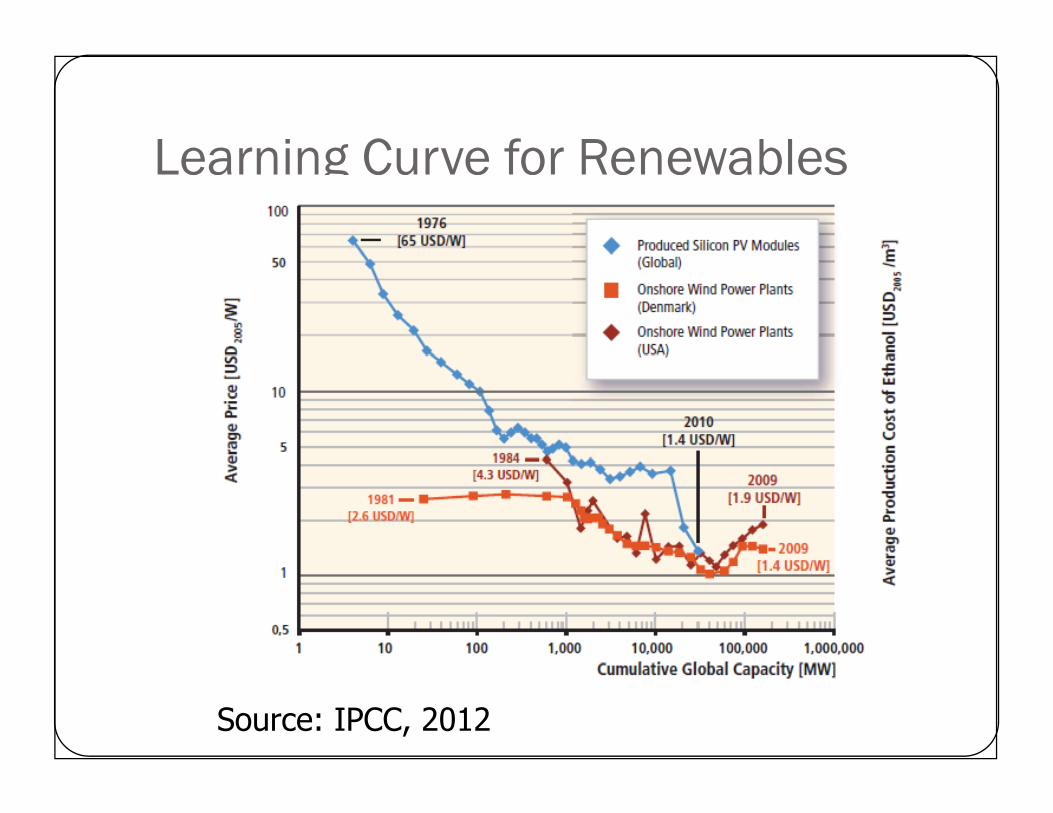
Learning Curve for RenewablesLearning Curve for Renewables
Source: IPCC, 2012

Methodology - Cost Analysis
Solar Field Efficiency
Turbine Efficiency
Loss %
Solar Field Area
Solar Insolation
Solar i ld
Plant Efficiency
Operating Hours
Land Area Field Cost
Hours
Storage Size
Plant Size
Land Cost
HTF quantity HTF Cost
Plant Output
Collector Size
Receiver Size
HX CostPower Block
Cost
Storage Cost
Capital CostCapacity Factor
Discount Rate
Life
AnnualisedCost O&M
Replacement Costs
19
Cost of Generation Source: Krishnamurthy et al. 2012

Annual Plant output
Feed‐in tariff
Annual Revenue Annual O&M Expenses
Feed in tariffAnnual Working
Capital EBITDA
Interest Rate
MAT Rate
Total Debt
Interest Rate
Interest EBT
Loan repaymentAnnual
Depreciation Debt to equity ratio
Taxes Loan repayment
period
Net repayment
Capital CostNet Profit Depreciation
RateNet annual repayment
Net repayment upto ith year
Salvage Value
Free Cash Flow to Firm
repayment
Free cash flow to equity to Firm q y
IRR Equity Source: Krishnamurthy et al. 2012

Capital cost Break up PTC plantCapital cost Break-up PTC plant
Source: Krishnamurthy et al. 2012

PTC with and without storagePTC- with and without storage
Source: Krishnamurthy et al. 2012
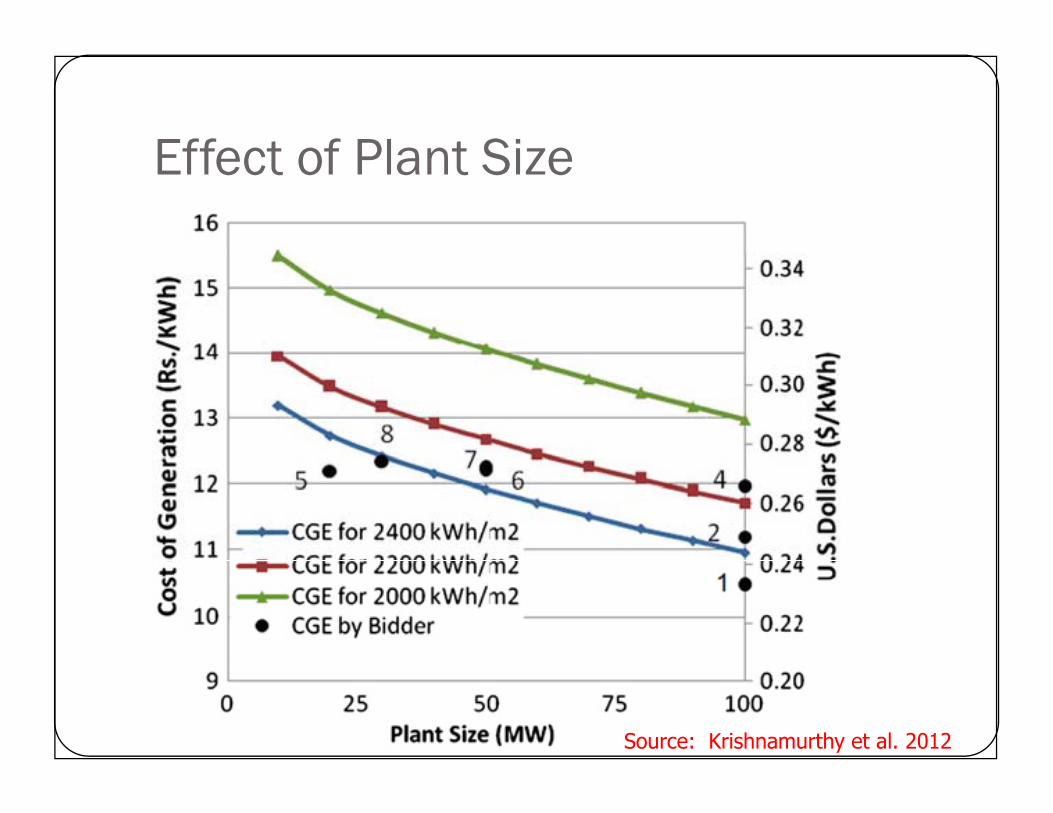
Effect of Plant SizeEffect of Plant Size
Source: Krishnamurthy et al. 2012

Summary of Results
Plant Size (MWe)
10 50 100
2000 Rs. 12.24 15.50 17.26 10.31 13.04 14.52 10.25 12.97 14.44
Wh/
m2 /y
ear) USc 26.6 33.7 37.5 22.4 28.3 31.5 22.3 28.2 31.4
2200 Rs. 11.53 14.60 16.26 9.66 12.22 13.61 9.55 12.08 13.45
sola
tion
(kW USc 25.0 31.7 35.3 21.0 26.5 29.5 20.7 26.2 29.2
2400 Rs. 10.94 13.85 15.43 9.12 11.54 12.85 8.96 11.33 12.62
Sola
r In
s
USc 23.7 30.1 33.5 19.8 25.1 27.9 19.5 24.6 27.4
6 10 12 6 10 12 6 10 12
Discount Rate (%)
Source: Krishnamurthy, P., Mishra, S., and Banerjee, R., Energy Policy, 2012

Base Case
50 MWe Solar Thermal
7 5 H Th l S 7.5 Hour Thermal Storage
Oil Loop
Design Solar Insolation = 650 W/m2 Design Solar Insolation 650 W/m
Location - New Delhi
PT and CLFR comparisonp

Results – PT vs CLFR
Cost Breakup – PT Power PlantCapital Cost = Rs. 1164 Crores Capital Cost = Rs. 233 Million / MWe CGE = 10.54 Rs/kWhPower Block CGE 10.54 Rs/kWhIRR = 17%Capacity Factor = 0.36
Power Block 7% Storage 12%
Heat Exchanger
Solar Field 64%
4%
Heat transfer Fluid 2%
Cost Breakup – CLFR Power64%Civil Costs
3%Balance of Plant 6%
Power Block 8%
Storage 13%
Cost Breakup – CLFR Power Plant
Heat Exchanger 5%
Heat transfer Fl id 3%
Capital Cost = Rs. 1045 Crores Capital Cost = Rs. 209 Million / MWe CGE = 9 69 Rs/kWh
Solar Field 60%
Fluid 3%
Civil Costs 4%Balance of
Plant 8%
CGE = 9.69 Rs/kWhIRR = 20%Capacity Factor = 0.35

Comparison of Renewable Projects Comparison of Renewable Projects
27 Source: Nelson et al, 2012

Estimated LCOE for existing and proposed Parabolic Trough and Solar Tower CSP Plants
28Source: IRENA, 2012

Returns on Debt and EquityReturns on Debt and Equity
29 Source: Nelson et al, 2012
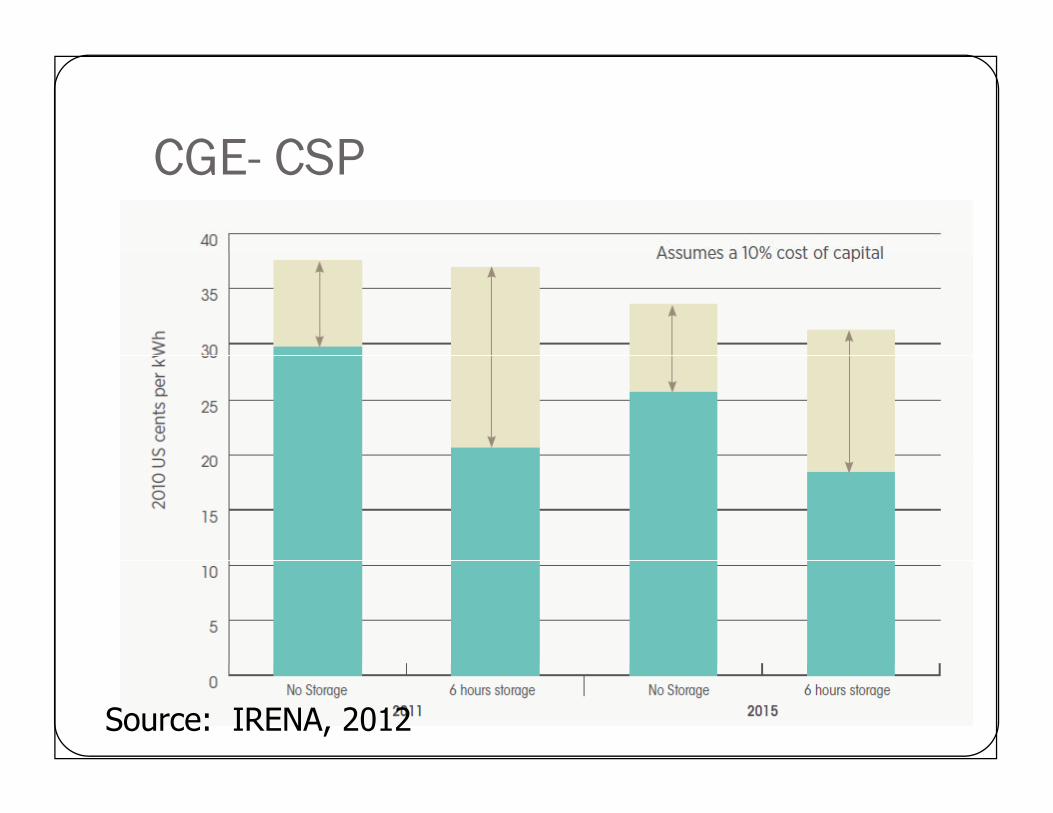
CGE CSPCGE- CSP
Source: IRENA, 2012
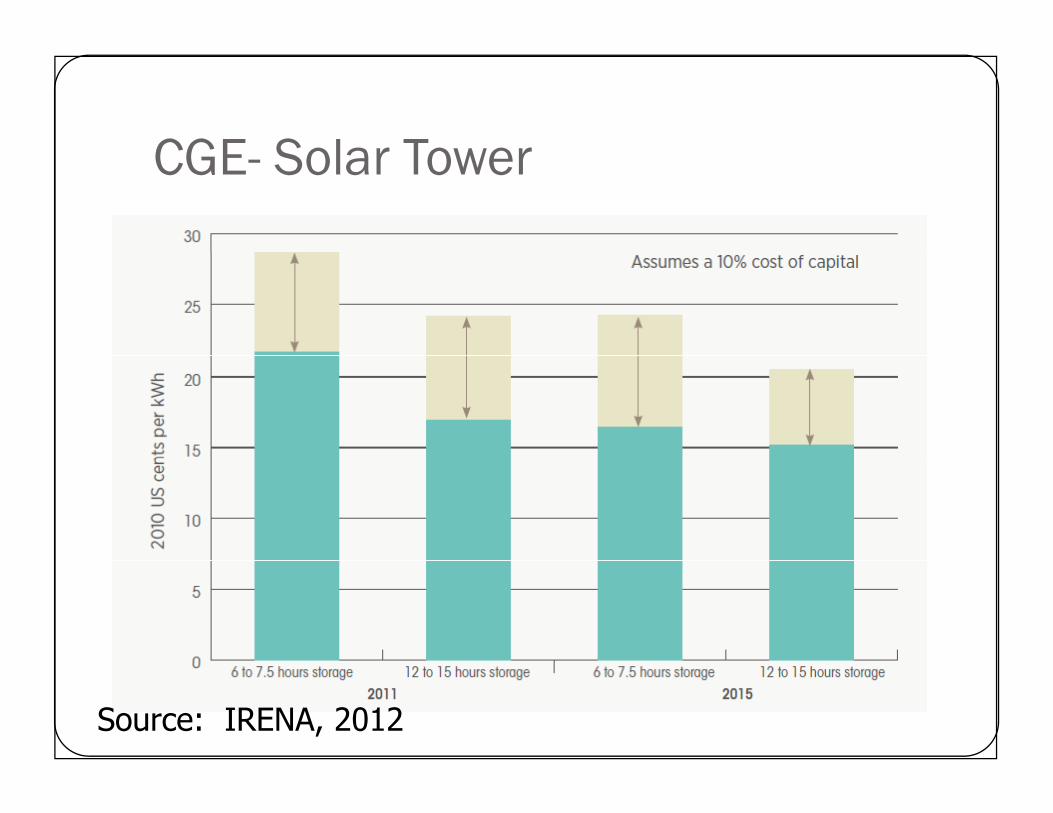
CGE Solar Tower CGE- Solar Tower
Source: IRENA, 2012

Energy Analysis
Embodied E
Energy
Energy
O&M Ee gy Consumed O&M Energy
l EnergyAnalysis
Disposal Energy
Energy Produced
Annual Power Generation
32

Methodology – Oil LoopCollector Design T ambient Fluid Inlet Temp Fluid Outlet TempCollector
CharacteristicsDesign T ambient Fluid Inlet Temp. Fluid Outlet Temp.
Collector EfficiencyCollector Efficiency
Hour AngleIbn
Declination
Latitude
Tracking Angle
Solar Field O/P
T DA exit
HX Pressure
h DA exit
Latitude
Field AreaT Superheat
T Steam exit
h Superheat
h Steam exitm steam
P o/p
Iterate
33
η Turbine η GeneratorLoss %
A

Methodology – Oil LoopAStorage Storage AStorage
HoursStorage
Field Area
Embodied Energy Factor for Materials
Mirror Weight
Total Field Area
Module Length
Module Width
for MaterialsReceiver Weight
St tS l Fi ldNo. of
ModulesPiping Volume Piping
Structure Weight
Solar Field Embodied
Energy
O&M & Di lVolume
Receiver Volume
Oil Volume
Piping Mass
O&M & Disposal Energy
Annual o/p
EPPEROI
Exp. Vessel Volume
Exp. Vessel Mass
Transport
Annual o/p Energy
Exp. Vessel Height Exp. Vessel
DiameterIterate
Exp. Vessel Thickness
BOP Embodied Energy
Transport Energy

Methodology – Direct SteamCollector Design T Fluid Inlet Fluid OutletCollector
CharacteristicsDesign T ambient
Fluid Inlet Temp.
Fluid Outlet Temp.
C ll tCollector Efficiency
Hour Angle
Ibn
Declination
Latitude
Tracking Angle
Solar Field O/P HX Pressure
h DA exit
Latitude
Field Area
T Steam exit
h Superheat
h Steam exitm steam
P o/p
Iterate
η Turbine η GeneratorLoss %
B

Methodology – Direct SteamBStorage Storage BStorage
HoursStorage
Field Area
Embodied Energy F t f M t i l
Mirror Weight
Total Field Area
Module Length
Module Width
Factor for MaterialsReceiver Weight
St tS l Fi ldNo. of
ModulesPiping Volume Piping
Structure Weight
Solar Field Embodied
Energy
O&M & Di lVolume Piping Mass
O&M & Disposal Energy
A l /
EPPEROI
Steam Accumulator
SizeTransport
Annual o/p Energy
EROI
BOP Embodied Energy
Transport EnergyPlant
Size

Assumptions – Energy AnalysisFactor Value Unit RemarksFactor Value Unit Remarks
Plant Size 5 -
100
MWe Range
100
Turbine Efficiency 50 % Assumed Constant
Generator Efficiency 98 % Assumed Constant
Piping and Heat loss 25 % For Oil Loop Configuration
20 % For Direct Steam Configuration
f f 2Life of Plant 25 Years
Disposal Energy 5 % Of Total Embodied Energy
Auxiliary Consumption 10 % Of Annual Power GenerationAuxiliary Consumption 10 % Of Annual Power Generation
Tamb 25 oC
Collector Transport distance 200 km By truck average
37
37

Material Use – Solar Collectors
W ight/
Parabolic Trough – Per Module(69 m2)
ComponentWeight/ Area Unit Material
Glass Mirrors 76.6 m2 Float Glass
CLFR – Per MWe (@650 W/m2)
HCE8.6 kg
Borosilicate Glass
39.4 kg SteelTorque Box 597 kg Steel
ComponentWeight/ Area Unit Material
End Plate 186 kg Steel
Cantilever Arms 384 kg Steel
Steel 44000 kg Steel
Glass 12545 m2 Float Glass
HCE Supports 113 kg Steel
Torque Transfer 32 kg Steel
Concrete 64 m3 Concrete
38
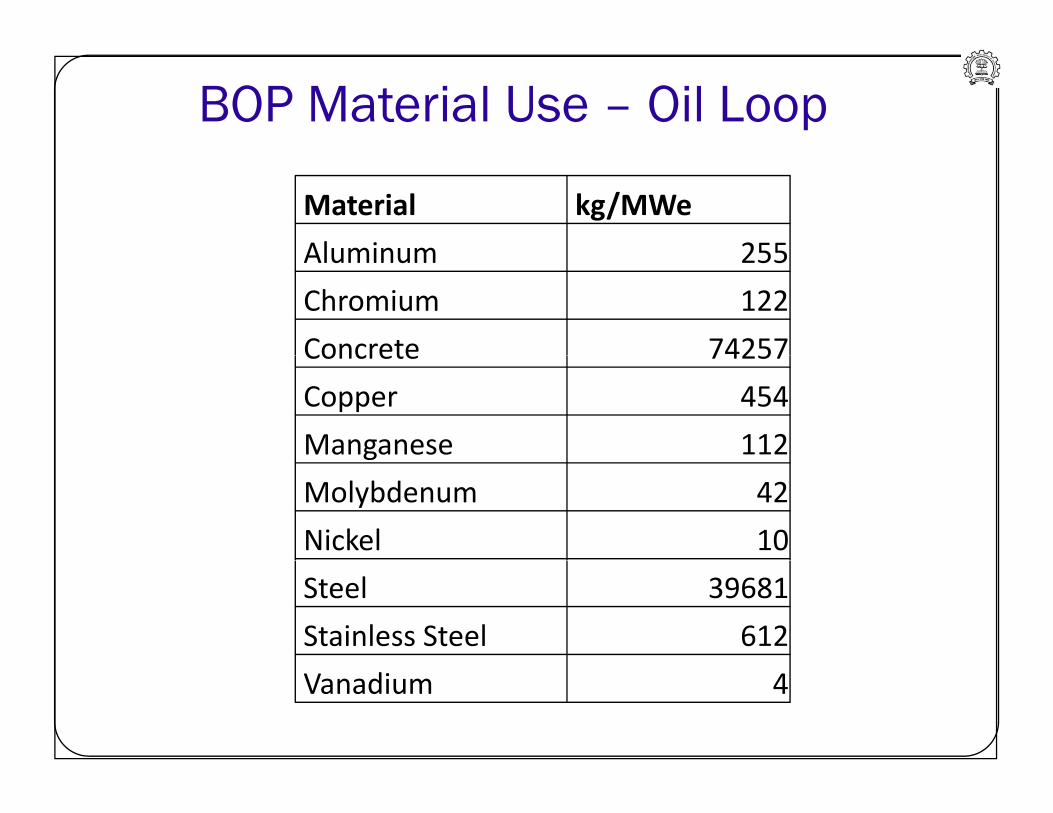
BOP Material Use – Oil Loop
Material kg/MWeAluminum 255Aluminum 255Chromium 122Concrete 74257Concrete 74257Copper 454Manganese 112gMolybdenum 42Nickel 10Steel 39681Stainless Steel 612
39
Vanadium 4

BOP Material Use – Direct Steam
Component Material MJ/MWe
Foundation Concrete 400000Steel 700000
TG 649333Boiler 2246667Boiler 2246667
Cooling Tower 151333
De Aerator 576000De‐Aerator 576000Steam Seal Heater 138667
Condenser 126667
Transformer Silica 12240000
40
Steel 252000Copper 134400

Summing Up
Solar Thermal – Sustainable from energy input
EPP = 3 to 5 years
Effect of variation in parameters
Material variation
F k f b l l Framework for sustainability analysis
Limited experience in power plant and solar field,Sub-critical base of researchersresearchers
Not much evidence of cost reduction
Need for public domain performance data
Most collaborations – ‘turnkey plants’ –no focus on indigenisation
CSP – significant potential for cost reduction
41
References Krishnamurthy P. and Banerjee R., "Energy analysis of solar thermal
concentrating systems for power plants“. The International Conference on Future Electrical Power and Energy Systems, 2012 . ChinaElectrical Power and Energy Systems, 2012 . China
Krishnamurthy P. Mishra, S and Banerjee R., An analysis of costs of parabolic trough technology in India, Energy Policy, 2012, 407-419
Ministry of New and Renewable Energy, New Delhi, website: www.mnre.gov.ins y o e a d e e ab e e gy, e e , ebs e e go Nelson et al, 2012 Meeting India’s Renewable Energy Targets: The Financing
Challenge, Climate Policy Initiative, December 2012 IRENA , Concentrating Solar Power , June 2012, g , IPCC, Special Report on Renewables , 2012 Bloomberg New Energy Finance, 2013
Email: [email protected]
rangan banerjee@gmail com
42
Thank you [email protected]