4. CSX MIT 10-24-12 no Notes
15
1 The Carbon Footprint of Freight Rail Carl A. Gerhardstein Assistant VP Environmental October 25, 2012 Overview CSX Overview GHG and Footprint GHG Engagement – internally and externally 2
Transcript of 4. CSX MIT 10-24-12 no Notes

1
The Carbon Footprint of Freight Rail Carl A. Gerhardstein Assistant VP Environmental October 25, 2012
Overview
n CSX Overview
n GHG and Footprint
n GHG Engagement – internally and externally
2

• Founded in 1827
• Based in Jacksonville, FL
• Operate in 23 states
• 21,000 Miles of Network
• 32,000 Employees
• 1,300 Trains/Day
Overview of CSX
Cumberland
Pensacola
Detroit Philadelphia
Norfolk
Charleston Savannah Jacksonville
Newark
Cincinnati
Tampa Orlando Miami
Boston
West Palm Beach New Orleans
Washington D.C. New York City
Montreal
Toledo Harrisburg
Montgomery Waycross
Charlotte Hamlet Memphis
Louisville Huntington Indianapolis Chicago
Columbus Buffalo Syracuse Selkirk
Charleston Baltimore
Knoxville Nashville Rocky Mount East St. Louis
Atlanta Birmingham
Pittsburgh Willard
Who we are
3
CSX is Built on a Strong Foundation
Core Values n It starts with the customer n People make the difference n Safety is a way of life n Fact based n Right results, right way
To be the safest, most progressive North American railroad, relentless in the pursuit of customer and employee excellence.
Vision
To capitalize on the efficiency of rail transportation to serve America.
Purpose ADD PIC
4
Rail GHG Contribution
Transportation 33%
Industrial 28%
Residential 20%
Commercial 18%
U.S. Territories
1%
U.S. Greenhouse Gas Emissions By Economic Sector
Passenger 63%
Trucks 20%
Air 9%
Rail 3%
Other 5%
Source: EPA, Inventory of U.S. Greenhouse Gas Emissions and Sinks: 1990-2006, Tables 2-15.
U.S. Greenhouse Gas Emissions By Transportation
5
Fuel Efficiency of Freight Rail
Miles
Revenue ton miles per gallon of fuel 6
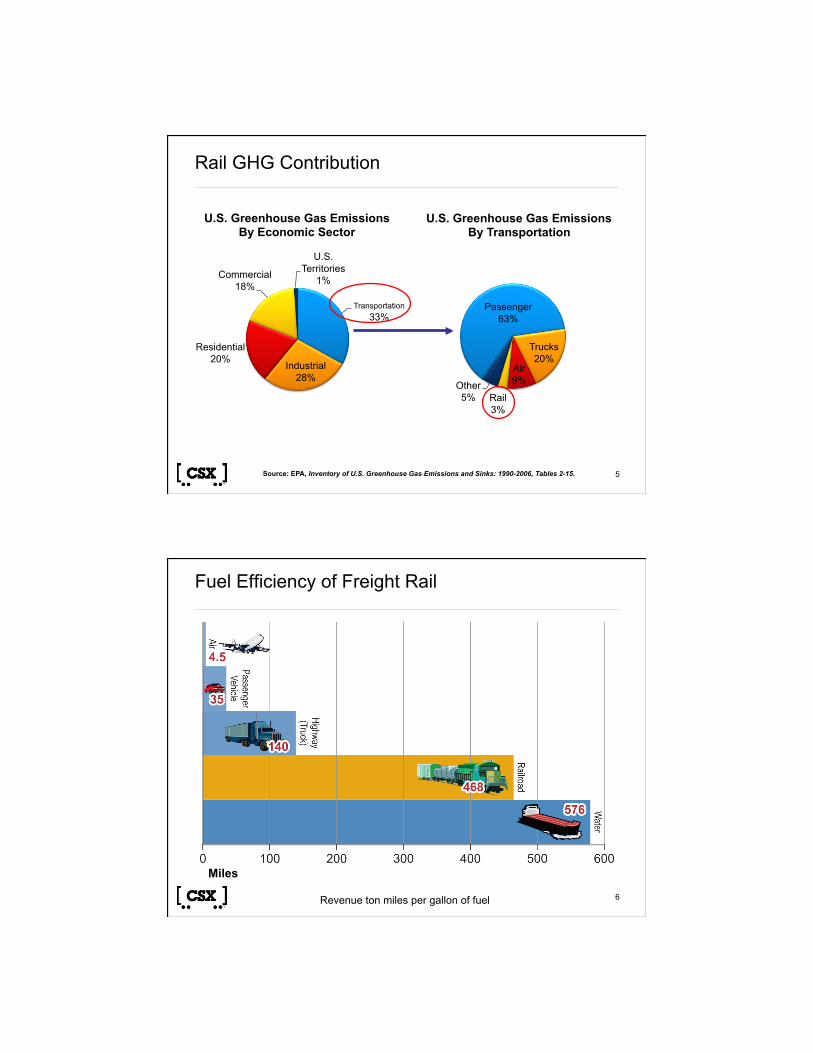
CSX is Committed to Reducing Greenhouse Gases
Collaboration n 1st in the transportation industry to join the EPA
Climate Leaders Program. n Charter railroad industry member of EPA
SmartWay program
Information n Only US railroad Listed on the Dow Jones
Sustainability Index n Carbon Disclosure Project S&P 500 and Global
500 Leadership Index
Innovation n 1st US freight railroad to developed an online
carbon calculator to provide customers with a tool to determine the least GHG intensive way to transport their freight by land.
CARBON DISCLOSURE PROJECT
7
8
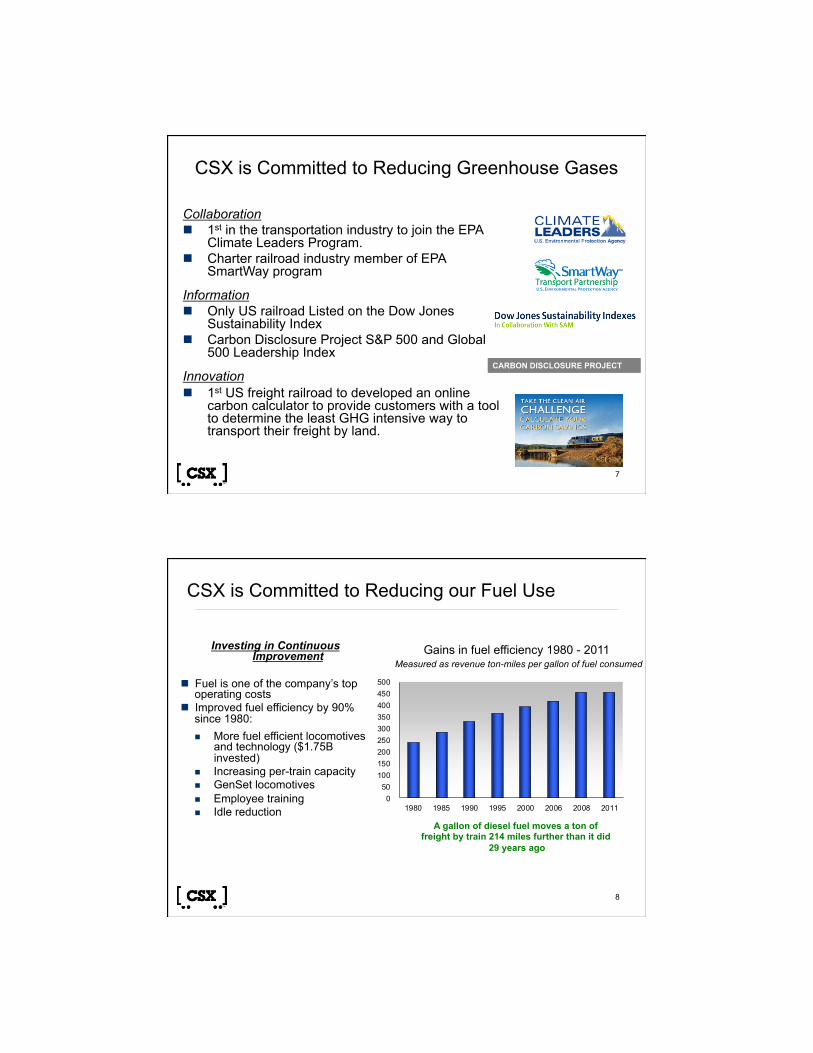
CSX is Committed to Reducing our Fuel Use
Investing in Continuous Improvement
n Fuel is one of the company’s top operating costs
n Improved fuel efficiency by 90% since 1980: n More fuel efficient locomotives
and technology ($1.75B invested)
n Increasing per-train capacity n GenSet locomotives n Employee training n Idle reduction
A gallon of diesel fuel moves a ton of freight by train 214 miles further than it did
29 years ago
050100150200250300350400450500
1980 1985 1990 1995 2000 2006 2008 2011
Gains in fuel efficiency 1980 - 2011 Measured as revenue ton-miles per gallon of fuel consumed
8

First Component of GHG Inventory: Develop a Customized Inventory
n Required n Establish inventory boundaries n Inventory ALL company-wide emissions n 6 major GHGs (CO2, CH4, N2O, HFC, PFC, SF6) n Direct (Scope 1) emissions n Indirect (Scope 2) emissions from purchased
electricity, heat, and steam
n Optional (Scope 3) Emissions n International operations n Offset projects n Employee travel and commuting n Product transport
9
First Component of CSX Inventory
n Mobile Sources n Approximately 4,000 locomotives n Approximately 6,000 vehicles n Off-road work equipment n Air conditioning units on
locomotives
n Stationary Sources n Approximately 5,000 buildings –
electricity, steam, gas n Air conditioning units for buildings n Oil/water separators n Landfills n Switch heaters n Comfort heaters
10

Other Sources of CSX GHG Emissions: Vehicles, Work Equipment and Generators
11
CSX Corporation GHG Emissions Profile: Base Year 2011
Emissions Source % of Total Emissions
Mobile - Locomotives 89.709%
Purchased Electricity 5.549%
Mobile - Vehicles 2.097%
Mobile - Other 1.163%
Stationary Sources 0.885%
Employee Business Travel 0.515%
Landfills 0.067%
O/W Separators 0.013%
Refrigerants 0.001%
Total Scope 1 93.935%
Total Scope 2 5.549%
Total Scope 3 0.515%
12
Second Component of GHG Inventory: Create an Inventory Management Plan (IMP)
n Institutionalizes inventory process n Leads to comprehensive & credible
data management
n Increases accuracy and transparency of data and calculations
n Allows for continual improvement n WRI -The Greenhouse Gas
Protocol: (March 2004)
n EPA Climate Leaders Inventory Protocol
CSX Corporation Inventory Management Plan August 2012
13
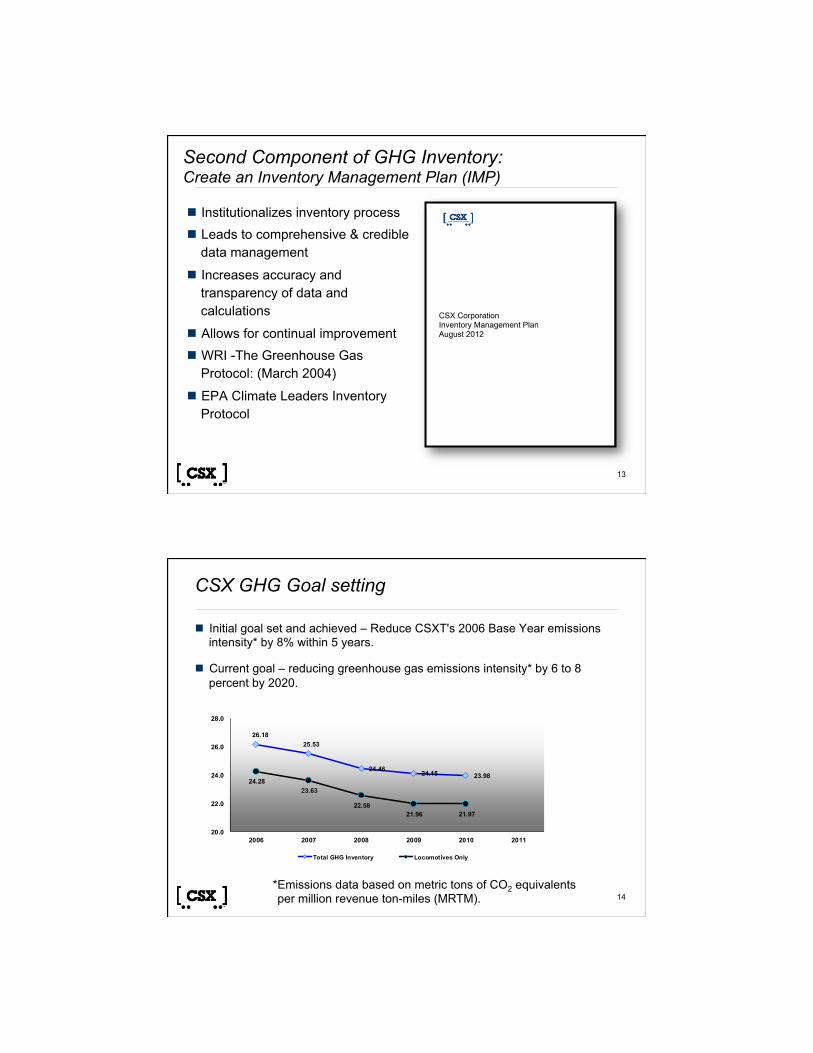
CSX GHG Goal setting
n Initial goal set and achieved – Reduce CSXT's 2006 Base Year emissions intensity* by 8% within 5 years.
n Current goal – reducing greenhouse gas emissions intensity* by 6 to 8 percent by 2020.
*Emissions data based on metric tons of CO2 equivalents per million revenue ton-miles (MRTM).
26.1825.53
24.46 24.15 23.9824.28
23.63
22.5821.96 21.97
20.0
22.0
24.0
26.0
28.0
2006 2007 2008 2009 2010 2011
Total GHG Inventory Locomotives Only
14

External engagement – Key Raters and Rankers
n Carbon Disclosure Project
n Dow Jones Sustainability Index
n JustMeans
n Bloomberg
n EIRIS
n ASSET4
n Maplecroft
n IW Financial
15
CSX’s Customer Carbon Calculator
n Dual-function: intermodal container shipments and rail car option
n Consumer-facing version which allows general consumers to see the environmental benefit of freight rail in the global supply chain. This version allows the user to compare carbon emissions based on specific commodities while changing a few default values.
17

How are Emissions Estimated?
Tons of CO2
emissions* =
Tons of freight x
shipping distance
Mode-‐specific diesel economy
factor Emissions factor x x
*The carbon emissions calculated with the CSX Carbon Calculator are intended to be used as an es7mate of the total carbon emissions that
can be avoided by shipping freight via rail. 18
How it Works: Consumers
Setting parameters
Choose a type of goods to ship via CSX
Getting there
Access the Carbon Calculator at
http://www.csx.com/index.cfm/customers/tools/
carbon-calculator-v2e/
19

Step 1
Choose the origin and destination cities from the
map
How it Works: Consumers
20
Step 2
Choose the volume of your shipment
How it Works: Consumers
21

Results
How it Works
The Carbon Calculator details the difference in carbon emissions from shipping via truck only
versus via freight rail only, including equivalent
measures of: • Home electricity use • Pine forest carbon
absorption • Passenger vehicle
emissions
22
How it Works: Customers
Setting parameters
Choose to calculate either carload freight or intermodal freight
Getting there
Access the Carbon Calculator on CSX.com
23

Step 1
Type a commodity keyword into the search box. A drop-down list of specific options
will appear for you to choose from
How it Works: Carloads
24
How it Works
Step 2
Enter the cargo weight, in tons
The tool will automatically
calculate the transportation variables based on industry averages. These variables can be manually updated, if
desired
25

How it Works
Step 3
Choose mode of transportation for this
segment
The transportation variables will automatically
update to reflect any changes in mode
26
How it Works
Step 4
Select the shipping distance by:
A) Choosing origin and
destination from the drop-down lists, or
B) Manually entering a
distance (in miles)
27

How it Works
Step 5
Choose to add another segment using the same steps, or calculate your
carbon savings
28
How it Works
Results
The Carbon Calculator details the difference in carbon emissions from
shipping via truck versus via freight rail, including equivalent measures of: • Home electricity use • Pine forest carbon
absorption • Passenger vehicle
emissions
29

How it Works: Intermodal
Enter the number of units and tons per unit for your double-stacked container
shipment
Adjust truck average miles per gallon if desired
Step 1
30
Conclusions
n GHG reduction is a key focus for CSX – good for the environment and the bottom line
n Shipping by rail helps customers reduce their scope 3 GHG footprint
n CSX has made it easy for our customers, employees, and the public to recognize the benefits of shipping by rail
31