![i cro eparate Screen Y 100 Y) 30 O. 1kWi cro eparate Screen Y 100 Y) 30 O. 1kW 3ØX200VXO.1 kW MSS- 300 MSS- 600 MSS- 900 MSS -1200 MSS- 1500 MSS- 1800 [kg] 200 260 325 455 520 585](https://static.fdocuments.in/doc/165x107/608f28a1057c035c36673166/i-cro-eparate-screen-y-100-y-30-o-1kw-i-cro-eparate-screen-y-100-y-30-o-1kw.jpg)
4-1 MSS Modeling Key element in DSS Many classes of models Specialized techniques for each model...
77
4-1 MSS Modeling • Key element in DSS • Many classes of models • Specialized techniques for each model • Allows for rapid examination of alternative solutions • Multiple models often included in a DSS • Trend toward transparency – Multidimensional modeling exhibits as spreadsheet
-
Upload
harry-owen -
Category
Documents
-
view
213 -
download
0
Transcript of 4-1 MSS Modeling Key element in DSS Many classes of models Specialized techniques for each model...

4-1
MSS Modeling
• Key element in DSS• Many classes of models• Specialized techniques for each model• Allows for rapid examination of alternative solutions• Multiple models often included in a DSS• Trend toward transparency– Multidimensional modeling exhibits as spreadsheet

2
Major Modeling Issues• Problem identification • Environmental analysis• Variable identification• Forecasting• Multiple model use• Model categories or selection • Model management• Knowledge-based modeling

4-3
Simulations
• Explore problem at hand• Identify alternative solutions• Can be object-oriented• Enhances decision making• View impacts of decision alternatives

© 2005 Prentice Hall, Decision Support Systems and Intelligent Systems, 7th Edition, Turban, Aronson, and Liang
4-4
DSS Models
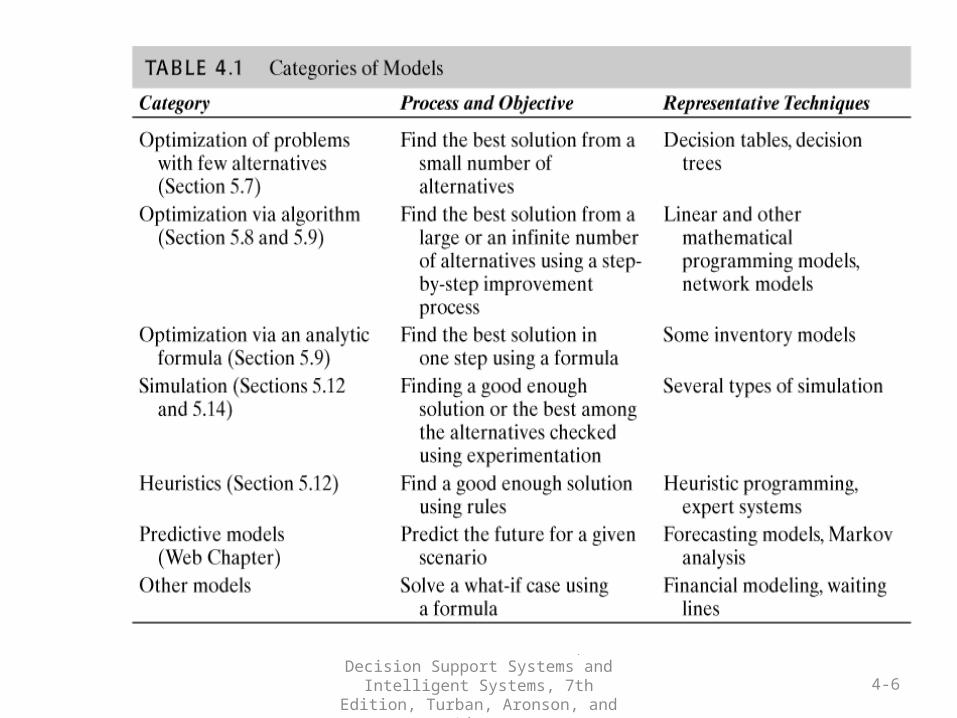
• Algorithm-based models• Statistic-based models• Linear programming models• Graphical models• Quantitative models• Qualitative models• Simulation models

© 2005 Prentice Hall, Decision Support Systems and Intelligent Systems, 7th Edition, Turban, Aronson, and Liang
4-5
Problem Identification
• Environmental scanning and analysis• Business intelligence• Identify variables and relationships– Influence diagrams– Cognitive maps
• Forecasting– Fueled by e-commerce– Increased amounts of information available
through technology
© 2005 Prentice Hall, Decision Support Systems and Intelligent Systems, 7th Edition, Turban, Aronson, and Liang
4-6

4-7
Static Models
• Single photograph of situation• Single interval• Time can be rolled forward, a photo at a time• Usually repeatable• Steady state– Optimal operating parameters– Continuous– Unvarying– Primary tool for process design

4-8
Dynamic Model
• Represent changing situations• Time dependent• Varying conditions• Generate and use trends• Occurrence may not repeat

© 2005 Prentice Hall, Decision Support Systems and Intelligent Systems, 7th Edition, Turban, Aronson, and Liang
4-9
Decision-Making
• Certainty– Assume complete knowledge– All potential outcomes known– Easy to develop– Resolution determined easily– Can be very complex
© 2005 Prentice Hall, Decision Support Systems and Intelligent Systems, 7th Edition, Turban, Aronson, and Liang
4-10
Decision-Making
• Uncertainty– Several outcomes for each decision– Probability of occurrence of each outcome
unknown– Insufficient information– Assess risk and willingness to take it– Pessimistic/optimistic approaches

© 2005 Prentice Hall, Decision Support Systems and Intelligent Systems, 7th Edition, Turban, Aronson, and Liang
4-11
Decision-Making
• Probabilistic Decision-Making– Decision under risk– Probability of each of several possible outcomes
occurring– Risk analysis• Calculate value of each alternative• Select best expected value

© 2005 Prentice Hall, Decision Support Systems and Intelligent Systems, 7th Edition, Turban, Aronson, and Liang
4-12
Influence Diagrams
• Graphical representation of model• Provides relationship framework• Examines dependencies of variables• Any level of detail• Shows impact of change• Shows what-if analysis

© 2005 Prentice Hall, Decision Support Systems and Intelligent Systems, 7th Edition, Turban, Aronson, and Liang
4-13
Influence Diagrams
Decision Intermediate or uncontrollable
Variables:Result or outcome (intermediate or final)
Certainty
Uncertainty
Arrows indicate type of relationship and direction of influence
Amount in CDs
Interest earned
PriceSales

© 2005 Prentice Hall, Decision Support Systems and Intelligent Systems, 7th Edition, Turban, Aronson, and Liang
4-14
Influence Diagrams
Random (risk)Place tilde above variable’s name
~ Demand
Sales
Preference(double line arrow)
Graduate University
Sleep all day
Ski all day
Get job
Arrows can be one-way or bidirectional, based upon the direction of influence

© 2005 Prentice Hall, Decision Support Systems and Intelligent Systems, 7th Edition, Turban, Aronson, and Liang
4-15

© 2005 Prentice Hall, Decision Support Systems and Intelligent Systems, 7th Edition, Turban, Aronson, and Liang
4-16
Modeling with Spreadsheets
• Flexible and easy to use• End-user modeling tool• Allows linear programming and regression
analysis• Features what-if analysis, data management,
macros• Seamless and transparent• Incorporates both static and dynamic models

© 2005 Prentice Hall, Decision Support Systems and Intelligent Systems, 7th Edition, Turban, Aronson, and Liang
4-17

© 2005 Prentice Hall, Decision Support Systems and Intelligent Systems, 7th Edition, Turban, Aronson, and Liang
4-18
Decision Tables
• Multiple criteria decision analysis• Features include:– Decision variables (alternatives)– Uncontrollable variables– Result variables
• Applies principles of certainty, uncertainty, and risk

© 2005 Prentice Hall, Decision Support Systems and Intelligent Systems, 7th Edition, Turban, Aronson, and Liang
4-19
Decision Tree
• Graphical representation of relationships• Multiple criteria approach• Demonstrates complex relationships• Cumbersome, if many alternatives

© 2005 Prentice Hall, Decision Support Systems and Intelligent Systems, 7th Edition, Turban, Aronson, and Liang
4-20
MSS Mathematical Models
• Link decision variables, uncontrollable variables, parameters, and result variables together– Decision variables describe alternative choices.– Uncontrollable variables are outside decision-maker’s
control.– Fixed factors are parameters. – Intermediate outcomes produce intermediate result
variables.– Result variables are dependent on chosen solution and
uncontrollable variables.

© 2005 Prentice Hall, Decision Support Systems and Intelligent Systems, 7th Edition, Turban, Aronson, and Liang
4-21
MSS Mathematical Models
• Nonquantitative models– Symbolic relationship– Qualitative relationship– Results based upon • Decision selected• Factors beyond control of decision maker• Relationships amongst variables

© 2005 Prentice Hall, Decision Support Systems and Intelligent Systems, 7th Edition, Turban, Aronson, and Liang
4-22

© 2005 Prentice Hall, Decision Support Systems and Intelligent Systems, 7th Edition, Turban, Aronson, and Liang
4-23
Mathematical Programming
• Tools for solving managerial problems• Decision-maker must allocate resources amongst
competing activities• Optimization of specific goals• Linear programming– Consists of decision variables, objective function and
coefficients, uncontrollable variables (constraints), capacities, input and output coefficients

© 2005 Prentice Hall, Decision Support Systems and Intelligent Systems, 7th Edition, Turban, Aronson, and Liang
4-24
Multiple Goals
• Simultaneous, often conflicting goals sought by management
• Determining single measure of effectiveness is difficult
• Handling methods:– Utility theory– Goal programming– Linear programming with goals as constraints– Point system
© 2005 Prentice Hall, Decision Support Systems and Intelligent Systems, 7th Edition, Turban, Aronson, and Liang
4-25
Sensitivity, What-if, and Goal Seeking Analysis
• Sensitivity– Assesses impact of change in inputs or parameters on solutions– Allows for adaptability and flexibility– Eliminates or reduces variables– Can be automatic or trial and error
• What-if– Assesses solutions based on changes in variables or assumptions
• Goal seeking– Backwards approach, starts with goal– Determines values of inputs needed to achieve goal– Example is break-even point determination
© 2005 Prentice Hall, Decision Support Systems and Intelligent Systems, 7th Edition, Turban, Aronson, and Liang
4-26
Search Approaches
• Analytical techniques (algorithms) for structured problems– General, step-by-step search– Obtains an optimal solution
• Blind search– Complete enumeration
• All alternatives explored– Incomplete
• Partial search– Achieves particular goal– May obtain optimal goal

© 2005 Prentice Hall, Decision Support Systems and Intelligent Systems, 7th Edition, Turban, Aronson, and Liang
4-27
Search Approaches
• Heurisitic– Repeated, step-by-step searches– Rule-based, so used for specific situations– “Good enough” solution, but, eventually, will obtain
optimal goal– Examples of heuristics
• Tabu search – Remembers and directs toward higher quality choices
• Genetic algorithms– Randomly examines pairs of solutions and mutations

© 2005 Prentice Hall, Decision Support Systems and Intelligent Systems, 7th Edition, Turban, Aronson, and Liang
4-28

© 2005 Prentice Hall, Decision Support Systems and Intelligent Systems, 7th Edition, Turban, Aronson, and Liang
4-29
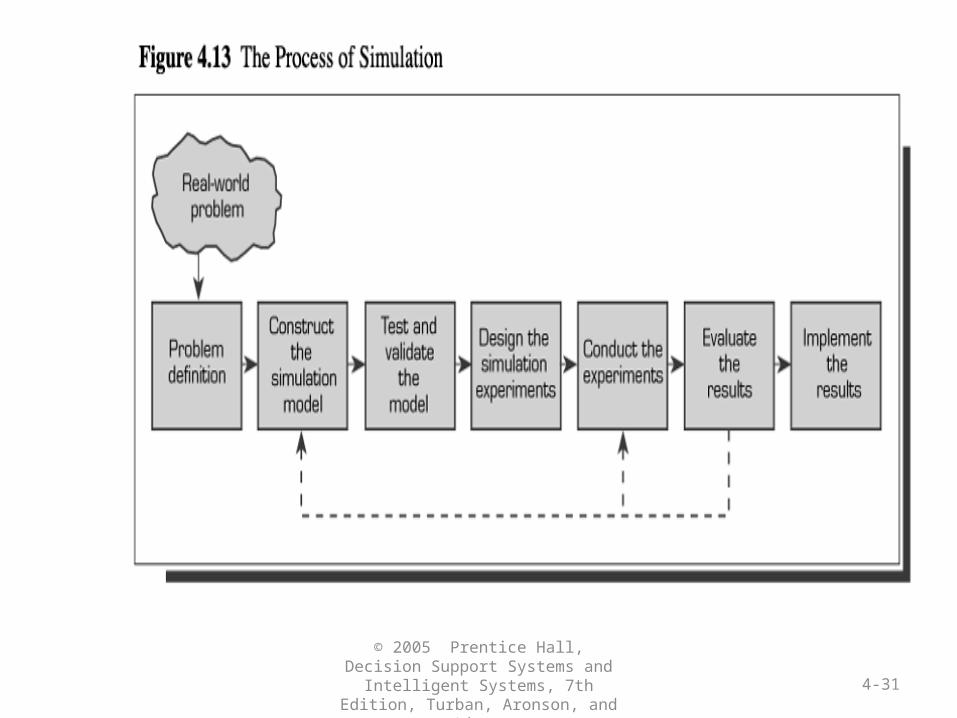
Simulations• Imitation of reality• Allows for experimentation and time compression• Descriptive, not normative• Can include complexities, but requires special skills• Handles unstructured problems• Optimal solution not guaranteed• Methodology
– Problem definition– Construction of model– Testing and validation– Design of experiment– Experimentation– Evaluation– Implementation
© 2005 Prentice Hall, Decision Support Systems and Intelligent Systems, 7th Edition, Turban, Aronson, and Liang
4-30
Simulations
• Probabilistic independent variables– Discrete or continuous distributions
• Time-dependent or time-independent• Visual interactive modeling – Graphical– Decision-makers interact with simulated model– may be used with artificial intelligence
• Can be objected oriented
© 2005 Prentice Hall, Decision Support Systems and Intelligent Systems, 7th Edition, Turban, Aronson, and Liang
4-31

32
Optimization via Mathematical Programming
• Linear programming (LP)
Used extensively in DSS
• Mathematical Programming Family of tools to solve managerial problems in
allocating scarce resources among various activities to optimize a measurable goal
33
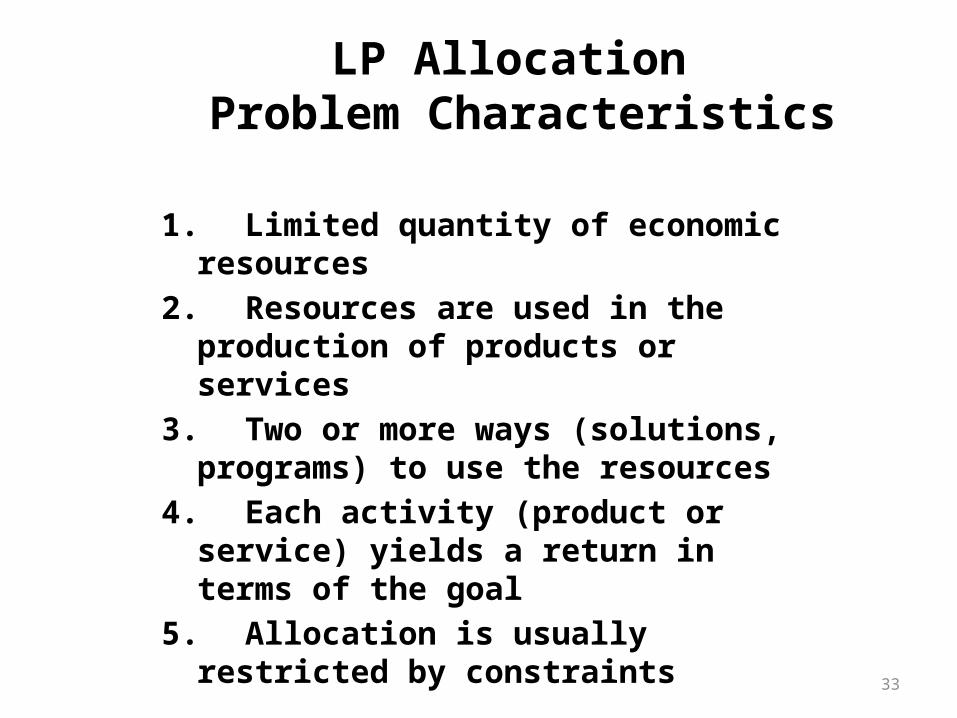
LP Allocation Problem Characteristics
1. Limited quantity of economic resources
2. Resources are used in the production of products or services
3. Two or more ways (solutions, programs) to use the resources
4. Each activity (product or service) yields a return in terms of the goal
5. Allocation is usually restricted by constraints

34
LP Allocation Model
• Rational economic assumptions1. Returns from allocations can be compared in a common unit
2. Independent returns
3. Total return is the sum of different activities’ returns
4. All data are known with certainty
5. The resources are to be used in the most economical manner
• Optimal solution: the best, found algorithmically

Linear programming components
• LP is composed of the following:1- decision variables- vars whose values are
unknown and / or searched for.2- objective functions: math functions that do
the following: a- relates decision vars to goals. b- measure goal attainment to be optimized.

3- objective function coefficient: unit profit or cost coefficient indicating the contribution to the objective of one unit of decision variable.
4- constraints: expressed in the form of linear inequalities or equalities that limit resources and/or requirements.
5-capacities describe upper and lower limits on constraint variables.

6- input-output coefficient-technology which indicate resource utilization for decision variables.
Do the homework handed in class for linear programming implentation.

Multiple Goals
• Analysis of management decision aims at evaluating how far each alternative brings management toward achieving its goals.
• Most management decisions have multiple goals.
• Different management have different goals• To achieve multiple goals, we need to analyze
each alternative in light of achievement of the proposed goal.

• Goals may complement each other or conflict each other.
• Difficulties of analyzing multiple goals: 1- it is hard for organizations to clearly state
their goals. 2-DM may change the importance assigned to
goals overtime or for different situation – situation change.

• 3- goals and sub goals are viewed differently at various levels of organization and within different departments.
• 4-if organization changes or the environment changes goals also change.
• 5-difficult to quantify relations between alternatives and their role in goal determination.
6-Each DM has different goals regarding a complex problem and he participate to solve it.
7-particpant in problem solving assess the priorities of various goals differently.
Method to handle Multiple Goals
1- utility theory 2- goal programming3- expression of goals and constraints using LP.4- a point system

Sensitivity Analysis
• Attempts to assess the impact of change in the input data or parameters on the proposed solution- the result variables.
• Allows flexibility and adaptation to changing conditions and to the requirements of different decision-making situation.
• Provide better understanding of the model and the decision making situation it attempts to describe.

• Permits managers to input data so that confidence in the model increases.
• Tests relationships such as:1- impact of change in external variables
(uncontrolled) and on outcome variables.2-Impact of changes in decision variables on
outcome vars.3- effect of uncertainly in estimating external
vars.

4-Effects of different dependent interactions among vars.
5-Robustness of decision under changing conditions

Uses of sensitivity analysis
Sensitivity analysis can be used for:1- revising models to eliminate large
sensitivities.2-adding details about sensitive vars or
scenarios.3-obtaining better estimates of sensitive
external vars.4-altering the real-world system to reduce actual
sensitivity.
5- accepting and using the sensitive real world, leading to continuous and close monitoring of actual results.

Types of sensitivity
A- automatic sensitivity analysis• Reports the range within which a certain input
var (unit cost) can vary without affecting the proposed solution.
• Usually limited to one change at a time, only for certain vars.

B- Trail and Error:• Impact of change in any var or several vars,
can be determined through trail and error approach.
• You can change some input and solve problem again. The more vars change the more solutions you discover. This can be done through either what-if or goal seeking.

• What-if : structured as what will happen to the solution if an input var or an assumption or value is changed?
• Goal-seeking: calculates values of the input necessary to achieve a desired level of an output (goal). It represent a backward solution approach.
Ex: how many tellers needed to reduce waiting time in a bank?

Problem-solving search methods
• When problem solving, Choice phase involves a search for an appropriate course of action that can solve the problem.
• For normative models such as math programming based ones, either an analytical approach is used OR a complete, exhaustive calculations are applied (comparing outcomes of all alternatives).

• For descriptive models, comparison of limited number of alternatives is used.
• Analytical techniques:• Use math formulas to derive an optimal
solution directly or predict a certain result.• Used for solving structured problems of
operational nature such as resource allocation or inventory managment

• Algorithms:• Used by analytical technique to increase
efficiency of search.• It is step by step search process for getting an
optimal solution.• Solutions are generated and tested for
improvements, and tested again , this repeats until no further improvements is possible.

54
Heuristic Programming
• Cuts the search• Gets satisfactory solutions more quickly and less
expensively• Finds rules to solve complex problems• Finds good enough feasible solutions to complex problems• Heuristics can be
– Quantitative– Qualitative (in ES)

55
When to Use Heuristics
1. Inexact or limited input data
2. Complex reality
3. Reliable, exact algorithm not available
4. Computation time excessive
5. To improve the efficiency of optimization
6. To solve complex problems
7. For symbolic processing
8. For making quick decisions

56
Advantages of Heuristics
1. Simple to understand: easier to implement and explain
2. Help train people to be creative
3. Save formulation time
4. Save programming and storage on computers
5. Save computational time
6. Frequently produce multiple acceptable solutions
7. Possible to develop a solution quality measure
8. Can incorporate intelligent search
9. Can solve very complex models

57
Limitations of Heuristics
1. Cannot guarantee an optimal solution
2. There may be too many exceptions
3. Sequential decisions might not anticipate future consequences
4. Interdependencies of subsystems can influence the whole system
• Heuristics successfully applied to vehicle routing

58
Heuristic Types
• Construction• Improvement• Mathematical programming• Decomposition• Partitioning

59
Simulation• Technique for conducting experiments with a
computer on a model of a management system
• Frequently used DSS tool

Simulation
• To assume the appearance of the characteristics of reality. It is a technique for conducting experiments (what-if analysis) with computer on a model of a management system.
• Most common method for handling semi structured and unstructured situation.
• It is a well established, useful method for gaining insights into complex MSS situation.

Simulation characteristics
• It imitates a model.• It conducting experiments, it involves testing
specific values of decision or uncontrolled vars and observing the impact on output vars.
• It is descriptive, describes or predict the characteristics of a system under different situation.
• Repeats an experiment many times to obtain an estimate of the overall effect of certain actions.
• Used when a problem is too complex to be treated by numerical optimization techniques.
Complexity means:1- problem can not be formulated for
optimization ( assumption do not hold)

2- formulation is too large3-too many interactions among variables.4-The problem exhibits some Risk and
uncertainty.

Simulation advantages
• It allows managers to pose what-if questions, use trail and error approach which is considered cheaper, faster, more accurate and less risks.
• Managers can experiment to determine which decision vars and part of environment that are important with different alternatives.

• Provide more understanding of the problem.• Built for specific problem, no generalization is
required• Can include the real complexities of the
problem, simplification are not necessary, handles unstructured problems.

Simulation Disadvantages
• Optimal solutions can not be guaranteed, good ( satisfying) is found.
• Construction of simulation models could be slow and costly.
• Solutions are not transferable to other problem.
• Simulation SW need special skills. Not easy to use.

Building simulation model
• Building a simulation model consists of the following steps:
1- problem definition: - real-world problem is examined and
classified. -here we specify why simulation is
appropriate. -define system boundaries, environment.

2- construction of simulation model: - determine vars and relationships among
them. -data are gathered, flowcharts are drawn and
computer programs are written.3-testing and validating the model:Making sure that the model represent the
system under study properly- testing and validation.

4- design the experiment -determine how long to run the simulation. - consider two conflicting objectives (accuracy and
cost) which are identified by three scenarios : a- typical mean and median cases for random vars b-best-case (low-cost, high revenues) c- worst-case (high-cost, low revenues)

5-Conducting experiment: -range from random-number generation to presenting
results.6- evaluation of results: results must be interpreted, use sensitivity analysis.7- implementation:Chances of success are high because managers are
involved in the process of simulation model development.

Simulation types

72
Major Characteristics of Simulation• Imitates reality and capture its richness
• Technique for conducting experiments
• Descriptive, not normative tool
• Often to solve very complex, risky problems

73
Advantages of Simulation
1. Theory is straightforward
2. Time compression
3. Descriptive, not normative
4. MSS builder interfaces with manager to gain intimate knowledge of the problem
5. Model is built from the manager's perspective
6. Manager needs no generalized understanding. Each component represents a real problem component
(More)

74
7. Wide variation in problem types
8. Can experiment with different variables
9. Allows for real-life problem complexities
10. Easy to obtain many performance measures directly
11. Frequently the only DSS modeling tool for nonstructured problems
12. Monte Carlo add-in spreadsheet packages (@Risk)
75
Limitations of Simulation
1. Cannot guarantee an optimal solution
2. Slow and costly construction process
3. Cannot transfer solutions and inferences to solve other problems
4. So easy to sell to managers, may miss analytical solutions
5. Software is not so user friendly

76
Simulation Methodology
Model real system and conduct repetitive experiments1. Define problem
2. Construct simulation model
3. Test and validate model
4. Design experiments
5. Conduct experiments
6. Evaluate results
7. Implement solution

77
Simulation Types• Probabilistic Simulation– Discrete distributions– Continuous distributions– Probabilistic simulation via Monte Carlo technique – Time dependent versus time independent simulation– Simulation software– Visual simulation– Object-oriented simulation