3rd Quarter Earnings Conference Call/media/Files/R/Regions-IR/...3Q16 4Q16 1Q17 2Q17 3Q17 18 18 19...
28
3rd Quarter Earnings Conference Call October 24, 2017
Transcript of 3rd Quarter Earnings Conference Call/media/Files/R/Regions-IR/...3Q16 4Q16 1Q17 2Q17 3Q17 18 18 19...

3rd Quarter EarningsConference Call
October 24, 2017

3rd quarter 2017
• Reported EPS of $0.25 per shareand generated positive operatingleverage, expanded net interestmargin, and produced solidgrowth in pre-tax pre-provisionincome
• Delivered solid earnings despitethe impact of recent hurricanes
• Net interest income and otherfinancial income increased 8%year-over-year
• Net interest margin increased 30bps over 3Q16 to 3.36%
• Non-interest expenses decreased5% year-over-year and theefficiency ratio improved 250 bpsover 3Q16
• Disciplined approach to creditcontinues to deliver positiveresults
Results reflect continued execution of our strategic plan
2
Profitability
• Remain committed to prudentlygrowing loans withoutcompromising risk-adjustedreturns
• Net interest income and otherfinancing income continued tobenefit from asset sensitivebalance sheet and strong depositfranchise
• Repurchased $500 million or34.6 million shares of commonstock and declared $105 millionin dividends to commonshareholders
Balance Sheet andCapital Optimization
• Plan to eliminate $400 million inexpenses by end of 2019 wellunderway, expect to achievemajority by end of 2018; committedto additional expense reductionsbeyond the $400 million, detailsprovided later this year
• Focus remains on helpingcustomers, associates andcommunities begin to recover andrebuild
• Grew checking accounts,households, credit cards, wealthmanagement relationships, assetsunder management and consumerloans
• Remain committed to offeringsuperior service, as well as financialadvice, guidance and education tohelp customers reach their financialgoals
Focused on theFundamentals

Average loans and leases
Business Lending Consumer Lending
3Q16 4Q16 1Q17 2Q17 3Q17
50.2 49.1 49.0 49.0 48.3
31.1
$81.3
31.5
$80.6
31.2
$80.2
31.1
$80.1
31.3
$79.6
Prudently managing loans
($ in billions)
Quarter-over-Quarter:• Total new and renewed loan production remained solid; however elevated loan
payoffs and pay downs drove quarter-over-quarter decline in total averagebalances
• Average Consumer lending portfolio increased $180 million
◦ Absent third-party indirect-vehicle run-off, consumer loans increasedapproximately $385 million
◦ Full-year average decline from third-party indirect-vehicle portfolio expectedto be approximately $510 million
• Average Business lending portfolio decreased $705 million
◦ Increased refinance activity in the capital markets drove elevated payoffs andpay downs in the large corporate space
◦ Low capitalization rates led several investor real estate loans to payoff priorto maturity
◦ Modest increase in M&A activity in the middle market space contributed toelevated loan payoffs
◦ Driven by risk mitigation strategies, average direct energy loans decreased$52 million, multi-family loans decreased $58 million and medical officebuilding loans decreased $24 million
Year-over-Year:• Average loan and lease balances declined $1.7 billion
• Average Consumer lending portfolio increased $207 million
• Average Business lending portfolio declined $1.9 billion
3
2017 Expectations: Excluding the impact of exiting the third-partyindirect-vehicle portfolio, full-year average loans are expected to be down
slightly compared to the prior year.

Low-costdeposits
Time deposits+ Other
3Q16 4Q16 1Q17 2Q17 3Q17
90.5 91.0 90.8 90.5 89.9
7.4$97.9
7.5$98.5
7.2$98.0
7.0$97.5
7.0$96.9
Average deposits by type Quarter-over-Quarter:• Average deposits decreased $626 million
• Strategic actions to reduce higher cost deposits contributed to thedecline
◦ Average Wealth Management deposits decreased $276million or 3% as a result of ongoing reductions of certaincollateralized deposits
◦ Average Other deposits declined $220 million or 7%primarily due to reductions of retail brokered sweepdeposits
• Average Consumer deposits decreased $153 million
• Average Corporate deposits increased $23 million
• Deposit costs remained low at 17 basis points
• Funding costs remained low at 37 basis points
Year-over-Year:• Average deposits decreased $1.1 billion
• Average Consumer deposits increased $1.8 billion
• Average Corporate deposits decreased $686 million
• Average Wealth Management deposits decreased $1.4 billion
• Average Other deposits decreased $807 million
Optimizing deposit mix
($ in billions)
4
($ in billions)
Average deposits by segment
ConsumerBank
Corporate Bank
WealthManagement
Other
3Q16 4Q16 1Q17 2Q17 3Q17
55.2 55.6 56.2 57.1 57.0
28.3 28.7 28.2 27.6 27.6
10.6 10.2 10.0 9.5 9.33.8
$97.94.0
$98.53.6
$98.03.3
$97.53.0
$96.9
2017 Expectations: Full-year average deposits are expected to berelatively stable with the prior year.

$57
$8
$28
$3
Deposits by Customer Type(1)
(Retail vs. Business)
OtherSegment
Deposit advantage
Non-Interest Bearing Depositsby Customer Type(1)
• Retail deposits consist of consumer and private wealthaccounts and represent 67% of total deposits
• Business deposits consist of corporate, institutionaltrust and other accounts and represent 33% of totaldeposits
• 38% of total average 3Q17 deposits are non-interestbearing deposits
• Approximately 43% of our consumer low-cost depositdollars have been customers for over 10 years
• Deposit MSA stratification
◦ ~50% of deposits <1M people◦ ~35% of deposits <500K people
Interest Bearing Depositsby Customer Type(1)
3Q16 4Q16 1Q17 2Q17 3Q17
18 18 19 19 19
17
$35
18
$36
17
$36
17
$36
18
$37
3Q16 4Q16 1Q17 2Q17 3Q17
44 45 46 45 45
19
$63
17
$62
16
$62
16
$61
15
$60
5
ConsumerSegment
PrivateWealth*
CorporateSegment
InstitutionalTrust*$1
* Private Wealth and Institutional Trust deposits are combined into the Wealth Management Segment.(1) Average Balances
($ in billions)3Q17 ($ in billions) ($ in billions)

Net interest income(1) and net interest margin
Improving net interest income(1) and netinterest margin
Net Interest Income (FTE)
Net Interest Margin
3Q16 4Q16 1Q17 2Q17 3Q17
$856
$874 $881
$904$921
3.06%
3.16%
3.25%
3.32%3.36%
Quarter-over-Quarter:• Net interest income(1) (FTE) increased $17 million or 2%, and the
net interest margin increased 4 bps
◦ Interest recoveries benefited net interest income adding $4million and 2 bps of net interest margin.
◦ Outside of recoveries, net interest margin and incomebenefited primarily from higher market interest rates,partially offset by a decrease in average loan balances andhigher debt costs
◦ One extra day in the quarter benefited net interest income(1)
(FTE) by ~$5 million and negatively impacted net interestmargin by ~ 2 bps
• Excluding impact of interest recoveries, expect 4Q17 net interestincome and related margin to grow modestly assuming aDecember Fed Funds rate increase
◦ If expectations for a December rate hike decline, expect net-interest income and related margin to be relatively stable
Year-over-Year:• Net interest income(1) (FTE) increased $65 million or 8%, and the
net interest margin increased 30 bps
◦ Net interest margin and net interest income(1) benefitedfrom higher market interest rates, prudent deposit costmanagement, favorable credit-related interest recoveries,and the impact of balance sheet management strategies,partially offset by lower average loan balances
($ in millions)
6
(1) Net interest income and other financing income
2017 Expectations: Full-year net interest income(1) growth of 3%-5%.
(1)

Building sustainable franchise value
(1) Non-GAAP; see appendix for reconciliation(2) Wealth Management income presented above does not include the portion of service charges on deposit accounts and similar smaller dollar amounts that are also
attributable to the Wealth Management segment.
Quarter-over-Quarter:• Non-interest income decreased $10 million or 2%; Adjusted
non-interest income(1) decreased $13 million or 3%◦ Driven primarily by declines in mortgage and capital
markets partially offset by an increase in service charges◦ 3Q17 adjusted non-interest income(1) includes $10 million
in operating lease impairment charges vs $7 million in theprior quarter
◦ 3Q17 adjusted non-interest income(1) also includes ~$1million in hurricane-related card & ATM fee waivers
• Expect 4Q17 adjusted non-interest income to grow driven byan increase in capital markets and to a lesser extent mortgage,Card & ATM fees, and wealth management
Year-over-Year:• Non-interest income decreased $84 million or 14% and
adjusted non-interest income(1) decreased $38 million or 7%◦ 3Q16 reported non-interest income includes $47 million of
insurance proceeds related to settlement regardinginsured mortgage loans, which did not repeat in 3Q17
◦ Growth in service charges offset by declines in mortgage,capital markets, and card & ATM fees
($ in millions)
7
Non-interest income
Capitalmarkets
Mortgageincome
Other
Wealthmanagementincome
Card and ATMfees
Service chargeson depositaccounts
Selected items
3Q16 4Q16 1Q17 2Q17 3Q17
42 31 32 38 35
4643 41 40 32
7859 56 60
53
107
103 109 108108
105
103 104 104103
166
173 168
$510
169175
55
$599
10
$5226
$525
9
$515
(2)
(1)
2017 Expectations: Full-year adjusted non-interest income expectedto remain relatively stable with the prior year.

Non-interest expense
3Q16 4Q16 1Q17 2Q17 3Q17
65.3%
63.2% 62.7% 63.2%61.7%
912877 872
899 880
22
$934
22
$899
5
$877 10
$909
6
$886
Prudently managing expenses
Quarter-over-Quarter:• Non-interest expense decreased $23 million or 3%; adjusted non-
interest expense(1) decreased $19 million or 2%◦ Salaries and benefits decreased $14 million or 3% primarily
due to reduced pension settlement charges and lower healthinsurance costs
◦ Professional fees decreased $7 million due to lower legal andconsulting costs
◦ Provision for unfunded credit losses decreased $5 million ◦ Declines partially offset by a $5 million increase in occupancy
and a $7 million increase in ORE driven by recent hurricanes• Adjusted efficiency ratio(1) decreased 150 bps to 61.7%
Year-over-Year:• Non-interest expense decreased $48 million or 5%; adjusted non-
interest expense(1) decreased $32 million or 4%
◦ 3Q16 reported non-interest expense included $14 millionloss on extinguishment of debt which did not repeat in 3Q17
◦ Decreases in salaries and benefits, professional fees andprovision for unfunded credits were partially offset byincreases in furniture and equipment and occupancyexpenses
(1) Non-GAAP; see appendix for reconciliation
($ in millions)
Selected Items(1)Adjusted Non-Interest Expense(1)
8
5
2017 Expectations: Full year adjusted non-interest expensegrowth of 0%-1%; full-year adjusted efficiency ratio ~62% and
adjusted operating leverage of ~2% Adjusted efficiency ratio(1)
NPLs and coverage ratio(1)
3Q16 4Q16 1Q17 2Q17 3Q17
305 311 310 267 247
773
$1,078
684
$995694
$1,004
556
$823
513
$760
104% 110% 106%127% 137%
123% 138% 135%163% 180%
Coverage ratio excluding Direct Energy
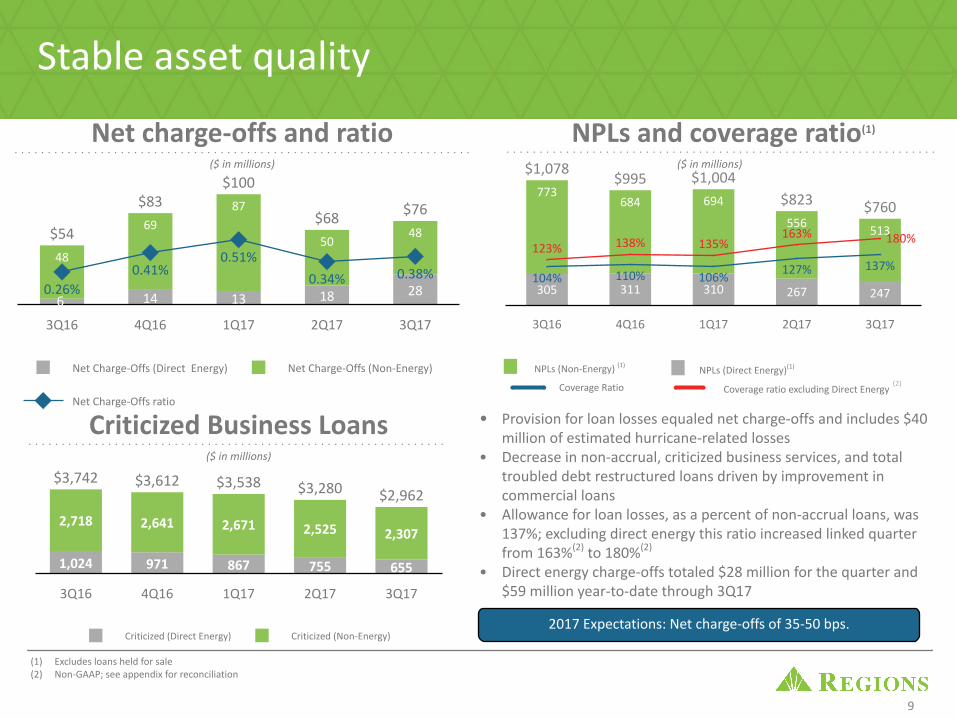
Stable asset quality
• Provision for loan losses equaled net charge-offs and includes $40million of estimated hurricane-related losses
• Decrease in non-accrual, criticized business services, and totaltroubled debt restructured loans driven by improvement incommercial loans
• Allowance for loan losses, as a percent of non-accrual loans, was137%; excluding direct energy this ratio increased linked quarterfrom 163%(2) to 180%(2)
• Direct energy charge-offs totaled $28 million for the quarter and$59 million year-to-date through 3Q17
Criticized (Direct Energy) Criticized (Non-Energy)
3Q16 4Q16 1Q17 2Q17 3Q17
1,024 971 867 755 655
2,718
$3,742
2,641
$3,612
2,671
$3,538
2,525
$3,280
2,307
$2,962
($ in millions)
($ in millions)
($ in millions)
9
Criticized Business Loans
(1) Excludes loans held for sale(2) Non-GAAP; see appendix for reconciliation
Net charge-offs and ratio
(2)
NPLs (Non-Energy) (1)
Coverage Ratio
Net Charge-Offs (Direct Energy) Net Charge-Offs (Non-Energy)
Net Charge-Offs ratio
3Q16 4Q16 1Q17 2Q17 3Q176
14 13 18 28
48
$5469
$83 87
$100
50
$6848
$76
0.26%0.41%
0.51%
0.34% 0.38%
NPLs (Direct Energy)(1)
2017 Expectations: Net charge-offs of 35-50 bps.
6

Industry leading capital and liquidity ratios
• Repurchased $500 million or 34.6 million shares ofcommon stock, and declared $105 million in dividends tocommon shareholders
• Basel III common equity tier 1 ratio estimated at 11.3%(1);Fully phased-in pro-forma Basel III common equity tier 1ratio estimated at 11.2%(1)(2), well above regulatoryminimums
• At period-end, Regions was fully compliant with theLiquidity Coverage Ratio rule
(1) Current quarter ratios are estimated(2) Non-GAAP; see appendix for reconciliation(3) Based on ending balances
10
Tier 1 capital ratio(1)
Common equity Tier 1 ratio –Fully phased-in pro-forma(1)(2)
Loan-to-deposit ratio(3)
3Q16 4Q16 1Q17 2Q17 3Q17
11.9% 12.0% 12.1% 12.3% 12.1%
3Q16 4Q16 1Q17 2Q17 3Q17
11.0% 11.1% 11.2%11.4%
11.2%
3Q16 4Q16 1Q17 2Q17 3Q17
82% 81% 80% 82% 81%

2017 expectations
11
• Excluding the impact of the third-party indirect-vehicle portfolio, full-year average loans areexpected to be down slightly compared to the prior year
• Full-year average deposits are expected to be relatively stable with the prior year
• Net interest income and other financing income growth of 3%-5%
• Adjusted non-interest income relatively stable with the prior year*
• Adjusted non-interest expense growth of 0%-1%; adjusted efficiency ratio ~62%*
• Adjusted operating leverage of approximately 2%*
• Full-year effective tax rate expected in the 30%-31% range
• Net charge-offs of 35-50 bps
* The reconciliation with respect to forward-looking non-GAAP measures is expected to be consistent with actual non-GAAP reconciliations included in attachedappendix.

Appendix
12

Selected items impacting earnings
• Incurred $5 million of expenses associatedwith branch consolidations and transfer ofland held for future branch sites to heldfor sale
• Recognized $10 million of impairmentcharges associated with operating leaseassets; recorded as reduction in non-interest income
• Recognized $2 million in pension-relatedsettlement charges; included in salariesand employee benefits
• Results negatively impacted by hurricanes:
◦ Estimated impact on card & ATMincome ~ $1 million
◦ Estimated impact on occupancyand other real estate ownedexpense ~$5 and ~$7 million,respectively
13
Quarter Ended
($ amounts in millions, except per share data) 9/30/2017 6/30/2017 9/30/2016
Pre-tax adjusted items:
Branch consolidation, property and equipment charges $ (5) $ (7) $ (5)
Salaries and benefits related to severance charges (1) (3) (3)
Loss on early extinguishment of debt — — (14)
Securities gains (losses), net 8 1 —
Leveraged lease termination gains, net 1 — 8
Gain on sale of affordable housing residential mortgage loans — 5 —
Insurance proceeds — — 47
Diluted EPS impact* $ — $ — $ 0.01
Pre-tax additional selected items**:
Operating lease impairment charges $ (10) $ (7) $ —
Pension settlement charge (2) (10) —
Hurricane-related impact on non-interest income andexpense, net (13) — —
Visa Class B shares expense (4) (1) (11)
Oil spill recovery — — 10
* Based on income taxes at a 38.5% incremental rate.** Items represent an outsized or unusual impact to the quarter or quarterly trends, but are not considered non-GAAP adjustments.

Quarter-over-Quarter:• Despite softness in non-interest income,
pre-tax pre-provision income(1) increased$29 million or 6% compared to 2Q17;adjusted pre-tax pre-provision income(1)
increased $22 million or 4%• Asset sensitive profile supports net
interest income despite lack of loangrowth
• Efficiency remains a top priority asevidenced by solid expense management
Year-over-Year:• Pre-tax pre-provision income(1) increased
$27 million or 5% compared to the 3Q16quarter; adjusted pre-tax pre-provisionincome(1) increased $57 million or 12%
Pre-tax pre-provision income
Adjusted PPI Selected Items
3Q16 4Q16 1Q17 2Q17 3Q17
467
488
$476
497
$492
502
$498
524
33
$500
3
$527
(12) (5) (4)
(1) (1)
(1) Non-GAAP; see appendix for reconciliation
14
(1)
(12)(5)
(4)

Commercial retail lending overview
As of 9/30/17
($ in millions)
LoanBalances
TotalCommitments
IncludingOutstanding
Balances%
Utilization$
Criticized%
Criticized# of
Clients *
REITs $1,451 $2,776 52% — — 27
Investor realestate (IRE) 956 1,034 92% 14 1% 318
C&I 1,236 2,393 52% 45 4% 7,310
CRE-OO 637 669 95% 30 5% 1,278
Asset BasedLending 682 1,695 40% 41 6% 25
Total Retail (1)
$4,962 $8,567 58% $130 3% 8,958
• Approximately $200 million of outstanding balances across the REIT andIRE portfolios relate to shopping malls
• Portfolio exposure to REITs specializing in enclosed malls consists of a smallnumber of credits, all of which are investment grade
• IRE portfolio is widely distributed, largest tenants typically include 'basicneeds' anchors
• C&I retail portfolio is also widely distributed; largest categories include:
◦ Motor vehicle & parts dealers ~$380 million outstanding to~1,100 clients
◦ Building materials, garden equipment & supplies ~$160 millionoutstanding to ~700 clients
◦ Non-store retailers ~$175 million outstanding to ~270 clients
◦ Less than $60 million outstanding to clothing & accessories
• CRE-OO portfolio consists primarily of small strip malls and conveniencestores
• Asset Based Lending portfolio is collateralized primarily by inventory andaccounts receivable
• Generally, well-placed retail centers continue to perform well with lowvacancy rates
• Regions has not been impacted by recent big name bankruptcies; continueto watch the sector closely
• Securities portfolio includes ~$792 million of post-crisis issued AAA ratedCMBS with exposure to retail within the diversified collateral pool;protected with 35% credit enhancement, and losses expected to be deminimis in severely adverse scenario; portfolio also includes ~$70 million inretail related high quality, investment grade corporate bonds
(1) Does not include $26 million of retail related operating leases.* Represents the number of clients with loan balances outstanding.
Total retail
15

• Total outstandings and commitmentsdeclined primarily due to paydownsand payoffs
• Allowance for loan and lease losseswas 6.1% of direct energy balances at9/30/17 vs 6.9% at 6/30/17
• No second lien exposure outstandingwithin the energy portfolio
• Leveraged loans account for 30% ofenergy related balances; the majorityare Exploration & Production andMidstream
• Energy charge-offs were $28 millionfor 3Q17 and $59 million for 2017year to date
• Under a scenario with oil averagingbelow $25, incremental losses couldtotal $100 million over the next 8quarters
• Utilization rate has remainedbetween 40-60% since 1Q15
• 13% of direct energy loans are onnon-accrual status
• ALLL/NPL excluding direct energy is180%(1)
Energy lending overview
Total energy
Note: Securities portfolio contained ~$3MM of high quality, investment grade corporate bonds that are energy related at 9/30/17, down $1mm from 6/30/17. A leveraged relationship is defined as senior cash flow leverage of 3x or total cash flow leverage of 4x except for Midstream Energy which is 6x total cash flow leverage.
(1) Non-GAAP; see appendix for reconciliation 16
As of 9/30/17 As of 6/30/17
($ in millions)
Loan /Lease
Balances
TotalCommitments
IncludingOutstanding
Balances%
Utilization$
Criticized%
Criticized
Loan /Lease
Balances
TotalCommitments
IncludingOutstanding
Balances%
Utilization$
Criticized%
Criticized
Oilfield servicesand supply (OFS)
$513 $758 68% $274 53% $601 $926 65% $335 56%
Exploration andproduction(E&P) 699 1,330 53% 354 51% 678 1,261 54% 388 57%
Midstream 524 1,225 43% 12 2% 519 1,188 44% 13 3%
Downstream72 277 26% 15 21% 81 299 27% 16 20%
Other 94 234 40% — —% 106 287 37% 3 3%
Total direct1,902 3,824 50% 655 34% 1,985 3,961 50% 755 38%
Indirect 572 935 61% 112 20% 544 994 55% 103 19%
Direct andindirect 2,474 4,759 52% 767 31% 2,529 4,955 51% 858 34%
Operating leases66 66 — 28 42% 97 97 — 58 60%
Loans held forsale 1 1 — 1 100% 1 1 — 1 100%
Total energy $2,541 $4,826 53% $796 31% $2,627 $5,053 52% $917 35%

Energy lending - oil field services and exploration &production detail
Type As of9/30/17
# ofClients* Commentary
Marine $324 7 Sector remains under stress and will likelyremain under stress in 2018. Contract coveragetotals 54% of outstandings for remainder of2017.
Integrated OFS 91 6 Stabilized conditions for companies servicingonshore activity. Average utilization is 32%indicating clients have ample liquidity.
Compression 46 2 Linked to movement of natural gas. Sector ismore stable and lower risk than other sectors.
Fluid Management 10 2 Exposure is minimal after recent payoffs.
Pre-drilling / Drilling 42 2 Outlook for onshore drillers has stablilized.Offshore drillers remain stressed; howeverRegions only has minimal exposure to offshoredrillers.
Total Oil Field Services(OFS)
$513 19
Exploration andProduction (E&P)
$699 28**
Total OFS and E&P $1,212
• 39% shared national credit (SNC) loans
• 68% utilization rate compared to 65%in 2Q17
• 79% Non-pass rated (criticized) loanspaying as agreed
E&P Portfolio
*Represents the number of clients that comprise 75% of the loan balances outstanding.**Represents the number of clients that comprise 90% of the loan balances outstanding.
OFS Portfolio
17
• Majority of borrowing is seniorsecured
• 99% shared national credit (SNC) loans
• 53% utilization rate compared to 54%in 2Q17
• Essentially all non-pass rated(criticized) loans paying as agreed
($ in millions)

Commercial - Non-Energy, $4,288
Investor RealEstate, $984
Consumer Real EstateSecured, $1,163
Consumer Non-Real EstateSecured, $1,013
Commercial - Energy(Direct), $1,043
Commercial -Non-Energy,$2,211
Investor RealEstate, $134
Consumer RealEstate Secured,
$1,145
Consumer Non-Real EstateSecured, $292
Commercial - Energy(Direct), $378
Loan balances by select states
Texas Louisiana
Investor Real Estate
($ inmillions) Office Retail Multi-Family
SingleFamily
Other Total
Baton Rouge $34 $1 $9 $9 $10 $63
NewOrleans 4 5 1 1 5 16
Other 5 4 30 1 15 55
Total $43 $10 $40 $11 $30 $134
Investor Real Estate
($ in millions)
Office RetailMulti-Family
SingleFamily
Other Total
Houston $43 $43 $188 $74 $20 $368
Dallas 106 31 113 62 30 342
San Antonio — 26 25 16 17 84
Other 9 75 95 4 7 190
Total $158 $175 $421 $156 $174 $984
18
$4.2B$8.5B

Loan balances by select states (continued)
Alabama Mississippi
Commercial - Non-Energy, $4,866
Investor Real Estate,$270
Consumer RealEstate Secured,
$3,577
Consumer Non-Real EstateSecured, $807
Commercial -Non-Energy,$1,454
Investor RealEstate, $131
Consumer RealEstate Secured,
$927
Consumer Non-Real EstateSecured, $356
Commercial -Energy (Direct),$26
19
$2.9B$9.5B
Investor Real Estate
($ in millions)Office Retail
Multi-Family
SingleFamily
Other Total
Birmingham $16 $21 $6 $14 $19 $76
Huntsville 81 15 5 4 1 106
Mobile / BaldwinCounty 2 15 3 1 17 38
Other 7 9 17 9 8 50
Total $106 $60 $31 $28 $45 $270
Investor Real Estate
($ in millions)Office Retail
Multi-Family
SingleFamily
Other Total
NorthMississippi — — — — $79 $79
Jackson/Other 4 4 21 1 3 33
Gulfport /Biloxi /Pascagoula — — 18 — 1 19
Total $4 $4 $39 $1 $83 $131
Commercial- Energy(Direct), $18

Loan balances by select states (continued)
Florida
Commercial - Non-Energy, $5,583
Investor Real Estate,$1,360
Consumer RealEstate Secured,
$7,946
Consumer Non-Real EstateSecured, $1,360
20
$16.2B
Investor Real Estate
($ in millions)
Office RetailMulti-Family
SingleFamily
Other Total
Miami-Fort LauderdaleCBSA/Key West $32 $132 $106 $41 $165 $476
Tampa/Sarasota 134 21 42 50 193 440
Orlando 8 7 63 37 74 189
Jacksonville 8 19 — 10 12 49
Other 20 19 6 98 63 206
Total $202 $198 $217 $236 $507 $1,360
Commercial- Energy(Direct), $0

Non-GAAP reconciliation: non-interest income,non-interest expense and efficiency ratio
NM - Not Meaningful(1) See page 23 for additional information regarding these adjustments.
21
The table below presents computations of the efficiency ratio (non-GAAP), which is a measure of productivity, generally calculated as non-interest expense divided by total revenue. Management uses this ratio to monitorperformance and believes this measure provides meaningful information to investors. Non-interest expense (GAAP) is presented excluding certain adjustments to arrive at adjusted non-interest expense (non-GAAP), whichis the numerator for the efficiency ratio. Non-interest income (GAAP) is presented excluding certain adjustments to arrive at adjusted non-interest income (non-GAAP), which is the numerator for the fee income ratio. Netinterest income and other financing income on a taxable-equivalent basis and non-interest income are added together to arrive at total revenue on a taxable-equivalent basis. Adjustments are made to arrive at adjusted totalrevenue on a taxable-equivalent basis (non-GAAP), which is the denominator for the efficiency ratio. Regions believes that the exclusion of these adjustments provides a meaningful base for period-to-period comparisons,which management believes will assist investors in analyzing the operating results of the Company and predicting future performance. These non-GAAP financial measures are also used by management to assess theperformance of Regions’ business. It is possible that the activities related to the adjustments may recur; however, management does not consider the activities related to the adjustments to be indications of ongoingoperations. The table on the following page presents a computation of the operating leverage ratio (non-GAAP) which is the period to period percentage change in adjusted total revenue on a taxable-equivalent basis (non-GAAP) less the percentage change in adjusted non-interest expense (non-GAAP). Regions believes that presentation of these non-GAAP financial measures will permit investors to assess the performance of the Companyon the same basis as that applied by management.
Quarter Ended($ amounts in millions) 9/30/2017 6/30/2017 3/31/2017 12/31/2016 9/30/2016 3Q17 vs. 2Q17 3Q17 vs. 3Q16
ADJUSTED EFFICIENCY AND FEE INCOME RATIOS, ADJUSTED NON-INTEREST INCOME/EXPENSE-CONTINUING OPERATIONSNon-interest expense (GAAP) A $ 886 $ 909 $ 877 $ 899 $ 934 $ (23) (2.5)% $ (48) (5.1)%Adjustments:Branch consolidation, property and equipment charges (5) (7) (1) (17) (5) 2 (28.6)% — NMLoss on early extinguishment of debt — — — — (14) — NM 14 (100.0)%
Salary and employee benefits—severance charges (1) (3) (4) (5) (3) 2 (66.7)% 2 (66.7)%Adjusted non-interest expense (non-GAAP) B $ 880 $ 899 $ 872 $ 877 $ 912 $ (19) (2.1)% $ (32) (3.5)%
Net interest income and other financing income (GAAP) $ 898 $ 882 $ 859 $ 853 $ 835 $ 16 1.8 % $ 63 7.5 %Taxable-equivalent adjustment 23 22 22 21 21 1 4.5 % 2 9.5 %Net interest income and other financing income, taxable-equivalentbasis C $ 921 $ 904 $ 881 $ 874 $ 856 $ 17 1.9 % $ 65 7.6 %Non-interest income (GAAP) D $ 515 $ 525 $ 510 $ 522 $ 599 $ (10) (1.9)% $ (84) (14.0)%Adjustments:
Securities (gains) losses, net (8) (1) — (5) — (7) NM (8) NM
Insurance proceeds (1) — — — — (47) — NM 47 (100.0)%Leveraged lease termination gains, net (1) (1) — — — (8) (1) NM 7 (87.5)%
Gain on sale of affordable housing residential mortgage loans (1) — (5) — (5) — 5 (100.0)% — NMAdjusted non-interest income (non-GAAP) E $ 506 $ 519 $ 510 $ 512 $ 544 $ (13) (2.5)% $ (38) (7.0)%Total revenue, taxable-equivalent basis C+D=F $ 1,436 $ 1,429 $ 1,391 $ 1,396 $ 1,455 $ 7 0.5 % $ (19) (1.3)%
Adjusted total revenue, taxable-equivalent basis (non-GAAP) C+E=G $ 1,427 $ 1,423 $ 1,391 $ 1,386 $ 1,400 $ 4 0.3 % $ 27 1.9 %Efficiency ratio (GAAP) A/F 61.7% 63.6% 63.1% 64.4% 64.2%Adjusted efficiency ratio (non-GAAP) B/G 61.7% 63.2% 62.7% 63.2% 65.3%Fee income ratio (GAAP) D/F 35.8% 36.8% 36.7% 37.4% 41.2%Adjusted fee income ratio (non-GAAP) E/G 35.4% 36.5% 36.6% 36.9% 38.8%

Non-GAAP reconciliation continued: non-interestincome, non-interest expense and efficiency ratio
NM - Not Meaningful(1) Regions recorded $3 million of contingent legal and regulatory accruals during the second quarter of 2016 related to previously disclosed matters.(2) Insurance proceeds recognized in the first nine months of 2016 are related to the previously disclosed settlements with the Department of Housing and Urban Development as well as the 2010 class-action
lawsuit. (3) See page 23 for additional information regarding these adjustments. 22
Nine Months Ended September 30($ amounts in millions) 2017 2016 2017 vs. 2016ADJUSTED EFFICIENCY, FEE INCOME AND OPERATING LEVERAGE RATIOS, ADJUSTED NON-INTEREST INCOME/EXPENSE- CONTINUING OPERATIONSNon-interest expense (GAAP) H $ 2,672 $ 2,718 $ (46) (1.7)%Adjustments:Professional, legal and regulatory expenses (1) — (3) 3 (100.0)%Branch consolidation, property and equipment charges (13) (41) 28 (68.3)%Loss on early extinguishment of debt — (14) 14 (100.0)%Salary and employee benefits—severance charges (8) (16) 8 (50.0)%Adjusted non-interest expense (non-GAAP) I $ 2,651 $ 2,644 $ 7 0.3 %Net interest income and other financing income (GAAP) $ 2,639 $ 2,545 $ 94 3.7 %Taxable-equivalent adjustment 67 63 4 6.3 %Net interest income and other financing income, taxable-equivalent basis J $ 2,706 $ 2,608 $ 98 3.8 %Non-interest income (GAAP) K $ 1,550 $ 1,631 $ (81) (5.0)%Adjustments:Securities (gains) losses, net (9) (1) (8) NMInsurance proceeds (2) — (50) 50 (100.0)%Leveraged lease termination gains, net (3) (1) (8) 7 (87.5)%Gain on sale of affordable housing residential mortgage loans (3) (5) — (5) NMAdjusted non-interest income (non-GAAP) L $ 1,535 $ 1,572 $ (37) (2.4)%Total revenue, taxable-equivalent basis J+K=M $ 4,256 $ 4,239 $ 17 0.4 %Adjusted total revenue, taxable-equivalent basis (non-GAAP) J+L=N $ 4,241 $ 4,180 $ 61 1.5 %Operating leverage ratio (GAAP) M-H 2.1 %Adjusted operating leverage ratio (non-GAAP) N-I 1.2 %Efficiency ratio (GAAP) H/M 62.8% 64.1%Adjusted efficiency ratio (non-GAAP) I/N 62.5% 63.3%Fee income ratio (GAAP) K/M 36.4% 38.5%Adjusted fee income ratio (non-GAAP) L/N 36.2% 37.6%

Non-GAAP reconciliation: pre-tax pre-provisionincome
Pre-Tax Pre-Provision Income ("PPI") and Adjusted PPI (non-GAAP)
The Pre-Tax Pre-Provision Income table below presents computations of pre-tax pre-provision income from continuing operations excluding certain adjustments (non-GAAP). Regions believes that thepresentation of PPI and the exclusion of certain items from PPI provides a meaningful base for period-to-period comparisons, which management believes will assist investors in analyzing theoperating results of the Company and predicting future performance. These non-GAAP financial measures are also used by management to assess the performance of Regions’ business. It is possiblethat the activities related to the adjustments may recur; however, management does not consider the activities related to the adjustments to be indications of ongoing operations. Regions believesthat presentation of these non-GAAP financial measures will permit investors to assess the performance of the Company on the same basis as that applied by management. Non-GAAP financialmeasures have inherent limitations, are not required to be uniformly applied and are not audited. Although these non-GAAP financial measures are frequently used by stakeholders in the evaluationof a company, they have limitations as analytical tools, and should not be considered in isolation, or as a substitute for analyses of results as reported under GAAP. In particular, a measure of incomethat excludes certain adjustments does not represent the amount that effectively accrues directly to stockholders.
Quarter Ended
($ amounts in millions) 9/30/2017 6/30/2017 3/31/2017 12/31/2016 9/30/2016 3Q17 vs. 2Q17 3Q17 vs. 3Q16
Net income from continuing operations available to common shareholders (GAAP) $ 296 $ 301 $ 278 $ 278 $ 303 $ (5) (1.7)% $ (7) (2.3)%
Preferred dividends (GAAP) 16 16 16 16 16 — NM — NM
Income tax expense (GAAP) 139 133 128 134 152 6 4.5 % (13) (8.6)%
Income from continuing operations before income taxes (GAAP) 451 450 422 428 471 1 0.2 % (20) (4.2)%
Provision for loan losses (GAAP) 76 48 70 48 29 28 58.3 % 47 162.1 %
Pre-tax pre-provision income from continuing operations (non-GAAP) 527 498 492 476 500 29 5.8 % 27 5.4 %
Other adjustments:
Gain on sale of affordable housing residential mortgage loans (1) — (5) — (5) — 5 (100.0)% — NM
Securities (gains) losses, net (8) (1) — (5) — (7) NM (8) NM
Insurance proceeds (2) — — — — (47) — NM 47 (100.0)%
Leveraged lease termination gains, net (3) (1) — — — (8) (1) NM 7 (87.5)%
Salaries and employee benefits—severance charges 1 3 4 5 3 (2) (66.7)% (2) (66.7)%
Branch consolidation, property and equipment charges 5 7 1 17 5 (2) (28.6)% — NM
Loss on early extinguishment of debt — — — — 14 — NM (14) (100.0)%
Total other adjustments (3) 4 5 12 (33) (7) (175.0)% 30 (90.9)%
Adjusted pre-tax pre-provision income from continuing operations (non-GAAP) $ 524 $ 502 $ 497 $ 488 $ 467 $ 22 4.4 % $ 57 12.2 %
NM - Not Meaningful (1) Gain on sale of affordable housing residential mortgage loans in the fourth quarter of 2016 was due to the decision to sell approximately $171 million of loans to Freddie Mac. Approximately $91 million were
sold with recourse, resulting in a deferred gain of $5 million, which was recognized during the second quarter of 2017. (2) Insurance proceeds recognized in the third quarter of 2016 are related to the previously disclosed settlement with the Department of Housing and Urban Development. (3) The impact of the leveraged lease termination gains, net in the third quarter of 2017 and 2016 were fully offset by increased tax expense.
23

The table below presents computations of the adjusted allowance for loan losses to non-performing loans, excluding loans held for sale ratio (non-GAAP), generally calculated as adjusted allowance forloan losses divided by adjusted total non-accrual loans, excluding loans held for sale. The allowance for loan losses (GAAP) is presented excluding the portion of the allowance related to direct energyloans to arrive at the adjusted allowance for loan losses (non-GAAP). Total non-accrual loans (GAAP) is presented excluding direct energy non-accrual loans to arrive at adjusted total non-accrual loans,excluding loans held for sale (non-GAAP), which is the denominator for the allowance for loan losses to non-accrual loans ratio. Management believes that excluding the portion of the allowance forloan losses related to direct energy loans and the direct energy non-accrual loans will assist investors in analyzing the Company's credit quality performance absent the volatility that has beenexperienced by energy businesses. Non-GAAP financial measures have inherent limitations, are not required to be uniformly applied, are not audited, and should not be considered in isolation, or as asubstitute for analyses of results as reported under GAAP.
Non-GAAP reconciliation: adjusted allowance for loan losses tonon-performing loans, excluding loans held for sale
24
As of
($ amounts in millions) 9/30/2017 6/30/2017 3/31/2017 12/31/2016 9/30/2016
Allowance for loan losses (GAAP) $ 1,041 $ 1,041 $ 1,061 $ 1,091 $ 1,126
Less: Direct energy portion 115 136 123 147 176
Adjusted allowance for loan losses (non-GAAP) $ 926 $ 905 $ 938 $ 944 $ 950
Total non-accrual loans (GAAP) $ 760 $ 823 $ 1,004 $ 995 $ 1,078
Less: Direct energy non-accrual loans 247 267 310 311 305
Adjusted total non-accrual loans (non-GAAP) $ 513 $ 556 $ 694 $ 684 $ 773
Allowance for loan losses to non-performing loans, excluding loans held for sale (GAAP) 1.37x 1.27x 1.06x 1.10x 1.04x
Adjusted allowance for loan losses to non-performing loans, excluding loans held for sale (non-GAAP) 1.80x 1.63x 1.35x 1.38x 1.23x

Non-GAAP reconciliation: Basel III common equity tier 1ratio – fully phased-in pro-forma
(1) Current quarter amounts and the resulting ratio are estimated. (2) Regions continues to develop systems and internal controls to precisely calculate risk-weighted assets as required by Basel III on a fully phased-in basis. The
amount included above is a reasonable approximation, based on our understanding of the requirements.25
The calculation of the fully phased-in pro-forma "Common equity Tier 1" (CET1) is based on Regions’ understanding of the Final Basel III requirements. For Regions, the Basel III framework becameeffective on a phased-in approach starting in 2015 with full implementation beginning in 2019. The calculation provided below includes estimated pro-forma amounts for the ratio on a fully phased-inbasis. Regions’ current understanding of the final framework includes certain assumptions, including the Company’s interpretation of the requirements, and informal feedback received through theregulatory process. Regions’ understanding of the framework is evolving and will likely change as analysis and discussions with regulators continue. Because Regions is not currently subject to the fully-phased in capital rules, this pro-forma measure is considered to be a non-GAAP financial measure, and other entities may calculate it differently from Regions’ disclosed calculation. A company's regulatory capital is often expressed as a percentage of risk-weighted assets. Under the risk-based capital framework, a company’s balance sheet assets and credit equivalent amounts ofoff-balance sheet items are assigned to broad risk categories. The aggregated dollar amount in each category is then multiplied by the prescribed risk-weighted percentage. The resulting weightedvalues from each of the categories are added together and this sum is the risk-weighted assets total that, as adjusted, comprises the denominator of certain risk-based capital ratios. Common equityTier 1 capital is then divided by this denominator (risk-weighted assets) to determine the common equity Tier 1 capital ratio. The amounts disclosed as risk-weighted assets are calculated consistentwith banking regulatory requirements on a fully phased-in basis. Since analysts and banking regulators may assess Regions’ capital adequacy using the fully phased-in Basel III framework, we believe that it is useful to provide investors the ability to assess Regions’capital adequacy on this same basis.
As of and for Quarter Ended
($ amounts in millions) 9/30/2017 6/30/2017 3/31/2017 12/31/2016 9/30/2016
Basel III Common Equity Tier 1 Ratio—Fully Phased-In Pro-Forma (1)
Stockholder's equity (GAAP) $ 16,624 $ 16,893 $ 16,722 $ 16,664 $ 17,365
Non-qualifying goodwill and intangibles (4,921) (4,932) (4,943) (4,955) (4,936)
Adjustments, including all components of accumulated other comprehensive income, disallowed deferred tax assets, thresholddeductions and other adjustments 406 432 510 489 (173)
Preferred stock (GAAP) (820) (820) (820) (820) (820)
Basel III common equity Tier 1—Fully Phased-In Pro-Forma (non-GAAP) D $ 11,289 $ 11,573 $ 11,469 $ 11,378 $ 11,436
Basel III risk-weighted assets—Fully Phased-In Pro-Forma (non-GAAP) (2) E $ 100,891 $ 101,894 $ 102,199 $ 102,975 $ 103,749
Basel III common equity Tier 1 ratio—Fully Phased-In Pro-Forma (non-GAAP) D/E 11.2% 11.4% 11.2% 11.1% 11.0%

Forward-looking statements
26
Forward-Looking Statements
This release may include forward-looking statements as defined in the Private Securities Litigation Reform Act of 1995, which reflect Regions’ current views with respect to future events and financial performance. Forward-looking statements are not basedon historical information, but rather are related to future operations, strategies, financial results or other developments. Forward-looking statements are based on management’s expectations as well as certain assumptions and estimates made by, andinformation available to, management at the time the statements are made. Those statements are based on general assumptions and are subject to various risks, uncertainties and other factors that may cause actual results to differ materially from theviews, beliefs and projections expressed in such statements. These risks, uncertainties and other factors include, but are not limited to, those described below:
• Current and future economic and market conditions in the United States generally or in the communities we serve, including the effects of declines in property values, unemployment rates and potential reductions of economic growth, whichmay adversely affect our lending and other businesses and our financial results and conditions.
• Possible changes in trade, monetary and fiscal policies of, and other activities undertaken by, governments, agencies, central banks and similar organizations, which could have a material adverse effect on our earnings.
• The effects of a possible downgrade in the U.S. government’s sovereign credit rating or outlook, which could result in risks to us and general economic conditions that we are not able to predict.
• Possible changes in market interest rates or capital markets could adversely affect our revenue and expense, the value of assets and obligations, and the availability and cost of capital and liquidity.
• Any impairment of our goodwill or other intangibles, or any adjustment of valuation allowances on our deferred tax assets due to adverse changes in the economic environment, declining operations of the reporting unit, or other factors.
• Possible changes in the creditworthiness of customers and the possible impairment of the collectability of loans and leases, including operating leases.
• Changes in the speed of loan prepayments, loan origination and sale volumes, charge-offs, loan loss provisions or actual loan losses where our allowance for loan losses may not be adequate to cover our eventual losses.
• Possible acceleration of prepayments on mortgage-backed securities due to low interest rates, and the related acceleration of premium amortization on those securities.
• Our ability to effectively compete with other financial services companies, some of whom possess greater financial resources than we do and are subject to different regulatory standards than we are.
• Loss of customer checking and savings account deposits as customers pursue other, higher-yield investments, which could increase our funding costs.
• Our inability to develop and gain acceptance from current and prospective customers for new products and services in a timely manner could have a negative impact on our revenue.
• The effects of any developments, changes or actions relating to any litigation or regulatory proceedings brought against us or any of our subsidiaries.
• Changes in laws and regulations affecting our businesses, such as the Dodd-Frank Act and other legislation and regulations relating to bank products and services, as well as changes in the enforcement and interpretation of such laws and regulationsby applicable governmental and self-regulatory agencies, which could require us to change certain business practices, increase compliance risk, reduce our revenue, impose additional costs on us, or otherwise negatively affect our businesses.
• Our ability to obtain a regulatory non-objection (as part of the CCAR process or otherwise) to take certain capital actions, including paying dividends and any plans to increase common stock dividends, repurchase common stock under currentor future programs, or redeem preferred stock or other regulatory capital instruments, may impact our ability to return capital to stockholders and market perceptions of us.
• Our ability to comply with stress testing and capital planning requirements (as part of the CCAR process or otherwise) may continue to require a significant investment of our managerial resources due to the importance and intensity of such testsand requirements.
• Our ability to comply with applicable capital and liquidity requirements (including, among other things, the Basel III capital standards and the LCR rule), including our ability to generate capital internally or raise capital on favorable terms, and ifwe fail to meet requirements, our financial condition could be negatively impacted.
• The Basel III framework calls for additional risk-based capital surcharges for globally systemically important banks. Although we are not subject to such surcharges, it is possible that in the future we may become subject to similar surcharges.
• The costs, including possibly incurring fines, penalties, or other negative effects (including reputational harm) of any adverse judicial, administrative, or arbitral rulings or proceedings, regulatory enforcement actions, or other legal actions towhich we or any of our subsidiaries are a party, and which may adversely affect our results.
• Our ability to manage fluctuations in the value of assets and liabilities and off-balance sheet exposure so as to maintain sufficient capital and liquidity to support our business.
The following list of factors is not exhaustive. For discussion of these and other factors that may cause actual results to differ from expectations, look under the captions “Forward-Looking Statements” and “RiskFactors" of Regions' Annual Report on Form 10-K for the year ended December 31, 2016, as filed with the Securities and Exchange Commission.
The words “anticipates,” “intends,” “plans,” “seeks,” “believes,” “estimates,” “expects,” “targets,” “projects,” “outlook,” “forecast,” “will,” “may,” “could,” “should,” “can,” and similar expressions often signifyforward-looking statements. You should not place undue reliance on any forward-looking statements, which speak only as of the date made. We assume no obligation to update or revise any forward-lookingstatements that are made from time to time.

• Our ability to execute on our strategic and operational plans, including our ability to fully realize the financial and non-financial benefits relating to our strategic initiatives.
• The success of our marketing efforts in attracting and retaining customers.
• Possible changes in consumer and business spending and saving habits and the related effect on our ability to increase assets and to attract deposits, which could adversely affect our net income.
• Our ability to recruit and retain talented and experienced personnel to assist in the development, management and operation of our products and services may be affected by changes in laws and regulations in effect from time to time.
• Fraud or misconduct by our customers, employees or business partners.
• Any inaccurate or incomplete information provided to us by our customers or counterparties.
• The risks and uncertainties related to our acquisition and integration of other companies.
• Inability of our framework to manage risks associated with our business such as credit risk and operational risk, including third-party vendors and other service providers, which could, among other things, result in a breach of operating or securitysystems as a result of a cyber attack or similar act.
• The inability of our internal disclosure controls and procedures to prevent, detect or mitigate any material errors or fraudulent acts.
• The effects of geopolitical instability, including wars, conflicts and terrorist attacks and the potential impact, directly or indirectly, on our businesses.
• The effects of man-made and natural disasters, including fires, floods, droughts, tornadoes, hurricanes, and environmental damage, which may negatively affect our operations and/or our loan portfolios and increase our cost of conducting business.
• Changes in commodity market prices and conditions could adversely affect the cash flows of our borrowers operating in industries that are impacted by changes in commodity prices (including businesses indirectly impacted by commodities pricessuch as businesses that transport commodities or manufacture equipment used in the production of commodities), which could impair their ability to service any loans outstanding to them and/or reduce demand for loans in those industries.
• Our inability to keep pace with technological changes could result in losing business to competitors.
• Our ability to identify and address cyber-security risks such as data security breaches, “denial of service” attacks, malware, “hacking” and identity theft, a failure of which could disrupt our business and result in the disclosure of and/or misuse ormisappropriation of confidential or proprietary information; disruption or damage to our systems; increased costs; losses; or adverse effects to our reputation.
• Our ability to realize our adjusted efficiency ratio target as part of our expense management initiatives.
• Significant disruption of, or loss of public confidence in, the Internet and services and devices used to access the Internet could affect the ability of our customers to access their accounts and conduct banking transactions.
• Possible downgrades in our credit ratings or outlook could increase the costs of funding from capital markets.
• The effects of problems encountered by other financial institutions that adversely affect us or the banking industry generally could require us to change certain business practices, reduce our revenue, impose additional costs on us, or otherwisenegatively affect our businesses.
• The effects of the failure of any component of our business infrastructure provided by a third party could disrupt our businesses; result in the disclosure of and/or misuse of confidential information or proprietary information; increase our costs;negatively affect our reputation; and cause losses.
• Our ability to receive dividends from our subsidiaries could affect our liquidity and ability to pay dividends to stockholders.
• Changes in accounting policies or procedures as may be required by the FASB or other regulatory agencies could materially affect how we report our financial results.
• Other risks identified from time to time in reports that we file with the SEC.
• The effects of any damage to our reputation resulting from developments related to any of the items identified above.
The foregoing list of factors is not exhaustive. For discussion of these and other factors that may cause actual results to differ from expectations, look under the captions “Forward-Looking Statements” and “Risk Factors” of Regions’ Annual Report onForm 10-K for the year ended December 31, 2016, as filed with the SEC.
The words “anticipates,” “intends,” “plans,” “seeks,” “believes,” “estimates,” “expects,” “targets,” “projects,” “outlook,” “forecast,” “will,” “may,” “could,” “should,” “can,” and similar expressions often signify forward-looking statements. You should notplace undue reliance on any forward-looking statements, which speak only as of the date made. We assume no obligation to update or revise any forward-looking statements that are made from time to time.
Regions’ Investor Relations contact is Dana Nolan at (205) 264-7040; Regions’ Media contact is Evelyn Mitchell at (205) 264-4551.
Forward-looking statements (continued)
27

®
28