3QFY15 HDFC Bank - motilaloswal.com fileHDFC Bank Alpesh Mehta ... Retail growth picking up; ......
16
14 February 2015 3QFY15 Results Update | Sector: Financials HDFC Bank Alpesh Mehta ([email protected]); +91 22 3982 5415 Vallabh Kulkarni ([email protected]); +91 22 3982 5430 BSE SENSEX S&P CNX CMP: INR1,066 TP: INR1,335 (+25%) Buy 29,095 8,806 Bloomberg HDFCB IN Equity Shares (m) 2,483.8 M.Cap (INR b)/(USD b) 2,647/42.6 52-Week Range (INR) 1,100/630 1, 6, 12 Rel. Per (%) 5/19/24 Avg Val (INRm)/Vol ‘000 1842/2180 Free float (%) 78.3 Financials & Valuation (INR Billion) Y/E Mar 2015E 2016E 2017E NII 224.7 275.9 340.1 OP 173.8 215.9 263.3 NP 102.4 127.3 155.3 NIM (%) 4.7 4.8 4.8 EPS (INR) 41.2 51.3 62.5 EPS Gr. (%) 16.6 24.4 22.0 BV/Sh. (INR) 246.0 285.3 333.3 ABV/Sh. (INR) 243.7 282.9 330.1 RoE (%) 19.6 19.3 20.2 RoA (%) 1.9 2.0 2.0 Payout (%) 23.4 23.4 23.4 Valuations P/E(X) 25.9 20.8 17.0 P/BV (X) 4.3 3.7 3.2 P/ABV (X) 4.4 3.8 3.2 Div. Yield (%) 0.8 1.0 1.2 Retail growth picking up; Impeccable asset quality; Highest ever RoA of 2.1% n HDFC Bank's (HDFCB) 3QFY15 PAT grew 20% YoY (in-line) to INR28b. Strong trading gains (INR2.7b) were utilized to make provisions (PCR +120bp QoQ to 73.9%). NIMs declined 10bp QoQ to 4.4%. Momentum in fee income (+15% YoY) continued to improve (+9% YoY in 1Q and +13% YoY in 2QFY15) n Retail loan growth bounced back to double digits (+12% YoY) post 3 quarters of single digit growth. Unsecured retail (+8% QoQ,+26% YoY), Auto loans (+6% QoQ,+19% YoY), Home loans (+2% QoQ,+24% YoY) and Kissan gold cards (+6% QoQ,+58% YoY) are the key drivers of the growth. These segments form ~33% of the loan book and ~70% of retail loans. n While on a reported basis, CV and CE (-5% QoQ, -21% YoY – an 11 quarter low of INR132b) and business banking (-3% QoQ,-20% YoY) are key drag to retail loan growth, management mentioned that on segmental basis (including wholesale – customer having >INR50m exposure) business banking momentum (+21% YoY) is healthy whereas, CV has bottomed out (+2% QoQ) n Other highlights: (1) NSL remains lowest at 36bp (2) Loan growth (+17% YoY) was also helped by strong growth in wholesale segment (+8% QoQ and +22% YoY) (3) Opex growth (+19% YoY) continue to lag/grow inline revenue growth (+21% YoY) Valuation and view: HDFCB is best-placed in the current environment, with a 40%+ CASA ratio, growth outlook of at least 1.3x industry and least asset quality risk. With the recent capital raise of INR97.7b (CET1 of 14.3%), strong capacity building in the moderate growth cycle (branches at 3,660 vs 1,412 in FY09), and significant digitalization initiatives HDFCB is well placed to capture expected pick-up in economic growth cycle. Despite capital raise, RoEs are expected to be ~20% by FY17. Comfort on earnings (22%+ CAGR) remains high. Buy with target price of INR1,335 (4x FY17E BV). Investors are advised to refer through disclosures made at the end of the Research Report. Motilal Oswal research is available on www.motilaloswal.com/Institutional-Equities , Bloomberg, Thomson Reuters, Factset and S&P Capital.
Transcript of 3QFY15 HDFC Bank - motilaloswal.com fileHDFC Bank Alpesh Mehta ... Retail growth picking up; ......
14 February 2015
3QFY15 Results Update | Sector: Financials
HDFC Bank
Alpesh Mehta ([email protected]); +91 22 3982 5415
Vallabh Kulkarni ([email protected]); +91 22 3982 5430
BSE SENSEX S&P CNX CMP: INR1,066 TP: INR1,335 (+25%) Buy 29,095 8,806
Bloomberg HDFCB IN
Equity Shares (m) 2,483.8
M.Cap (INR b)/(USD b) 2,647/42.6
52-Week Range (INR) 1,100/630
1, 6, 12 Rel. Per (%) 5/19/24
Avg Val (INRm)/Vol ‘000 1842/2180
Free float (%) 78.3
Financials & Valuation (INR Billion)
Y/E Mar 2015E 2016E 2017E
NII 224.7 275.9 340.1
OP 173.8 215.9 263.3
NP 102.4 127.3 155.3
NIM (%) 4.7 4.8 4.8
EPS (INR) 41.2 51.3 62.5
EPS Gr. (%) 16.6 24.4 22.0
BV/Sh. (INR) 246.0 285.3 333.3
ABV/Sh. (INR) 243.7 282.9 330.1
RoE (%) 19.6 19.3 20.2
RoA (%) 1.9 2.0 2.0
Payout (%) 23.4 23.4 23.4
Valuations
P/E(X) 25.9 20.8 17.0
P/BV (X) 4.3 3.7 3.2
P/ABV (X) 4.4 3.8 3.2
Div. Yield (%) 0.8 1.0 1.2
Retail growth picking up; Impeccable asset quality; Highest ever RoA of 2.1% n HDFC Bank's (HDFCB) 3QFY15 PAT grew 20% YoY (in-line) to INR28b. Strong
trading gains (INR2.7b) were utilized to make provisions (PCR +120bp QoQ to 73.9%). NIMs declined 10bp QoQ to 4.4%. Momentum in fee income (+15% YoY) continued to improve (+9% YoY in 1Q and +13% YoY in 2QFY15)
n Retail loan growth bounced back to double digits (+12% YoY) post 3 quarters of single digit growth. Unsecured retail (+8% QoQ,+26% YoY), Auto loans (+6% QoQ,+19% YoY), Home loans (+2% QoQ,+24% YoY) and Kissan gold cards (+6% QoQ,+58% YoY) are the key drivers of the growth. These segments form ~33% of the loan book and ~70% of retail loans.
n While on a reported basis, CV and CE (-5% QoQ, -21% YoY – an 11 quarter low of INR132b) and business banking (-3% QoQ,-20% YoY) are key drag to retail loan growth, management mentioned that on segmental basis (including wholesale –customer having >INR50m exposure) business banking momentum (+21% YoY) is healthy whereas, CV has bottomed out (+2% QoQ)
n Other highlights: (1) NSL remains lowest at 36bp (2) Loan growth (+17% YoY) was also helped by strong growth in wholesale segment (+8% QoQ and +22% YoY) (3) Opex growth (+19% YoY) continue to lag/grow inline revenue growth (+21% YoY)
Valuation and view: HDFCB is best-placed in the current environment, with a 40%+ CASA ratio, growth outlook of at least 1.3x industry and least asset quality risk. With the recent capital raise of INR97.7b (CET1 of 14.3%), strong capacity building in the moderate growth cycle (branches at 3,660 vs 1,412 in FY09), and significant digitalization initiatives HDFCB is well placed to capture expected pick-up in economic growth cycle. Despite capital raise, RoEs are expected to be ~20% by FY17. Comfort on earnings (22%+ CAGR) remains high. Buy with target price of INR1,335 (4x FY17E BV).
Investors are advised to refer through disclosures made at the end of the Research Report.
Motilal Oswal research is available on www.motilaloswal.com/Institutional-Equities, Bloomberg, Thomson Reuters, Factset and S&P Capital.

14 February 2015 2
HDFC Bank
Exhibit 1: Quarterly Performance: In-line with estimate Y/E March 3QFY15A 3QFY15E V/S our Est Comments Net Interest Income 56,999 57,580 -1 NIM declines 10bp QoQ. Seasonal QoQ pick up in loan growth marginally
lower than expectations % Change (Y-o-Y) 23 24 Other Income 25,349 23,687 7 Beat led by strong trading gains. Fees grew +15% YoY Net Income 82,348 81,267 1 Operating Expenses 34,563 33,847 2 Opex largely inline Operating Profit 47,786 47,420 1 % Change (Y-o-Y) 23 22 Other Provisions 5,604 5,000 12 Higher than expected specific provisioning; PCR improves 120bp QoQ Profit before Tax 42,181 42,420 -1 Tax Provisions 14,236 14,105 1 Net Profit 27,945 28,315 -1 Higher than expected provisions compensated by strong trading gains
leading to inline PAT % Change (Y-o-Y) 20 22
Source: MOSL, Company
Fee momentum picks up further n HDFCB reported continued traction in fee income (+15% YoY vs 9%/13% YoY in
1Q/2QFY15). Management indicated that fee income would continue to lag balance sheet growth and growth will be mainly driven by retail segment (~90% of fees in 3Q). In our view, wholesale related business fees can provide upside in the up-cycle as HDFCB as invested in the last down cycle
n Key fee income drivers during the quarter were (a) Pickup in third party business especially Mutual fund (a trend seen across private sector banks) (b) traction in income from payment and card business (seasonally strong quarter due to festive related spends) and (c) healthy growth in Auto and personal loans (high processing fees)
NIM declined 10bp QoQ; CASA ratio down 230bp QoQ n NIM declined 10bp QoQ to 4.4% on account of higher growth in term deposits
(+10% QoQ and +19% YoY) and high share of wholesale loans during the quarter.
n Term deposits accounted for ~97% of the incremental growth in deposits during the quarter. CASA deposits grew 18% YoY (flat QoQ). CASA ratio declined to 40.9% (-230bp).
Pick up in other opex growth; Strong control over employee expenses n Post 4 quarters of single digit opex growth, it has picked up during the last two
quarters led by focus on capacity building and cost on digitalization initiatives. n For FY15, HDFCB has capex plan of INR8.1b which includes INR2.5b for branch
and back office expansion, INR3.1b to upgrade and expand hard ware, data center network and balance is for adding new equipments in existing premises and expansion of existing premises.
n Overall operating expenditure grew 19.4% YoY (-3% QoQ) led by 21% YoY growth in other operating expenses. Bank added ~60 branches and ~900 employees during the quarter taking the overall branches/employees to 3,659/76,253.
n Considering strong capacity build up in the downcycle, control over operating expenditure is commendable and has been the key driver of profitability in the moderating revenue growth environment.
Third party related fees and strong traction in cards and
payments business drove fee income
High incremental share of wholesale business and low
CASA accretion impacted NIMs
Opex growth continuous to lag/grow inline with
revenue growth
14 February 2015 3
HDFC Bank
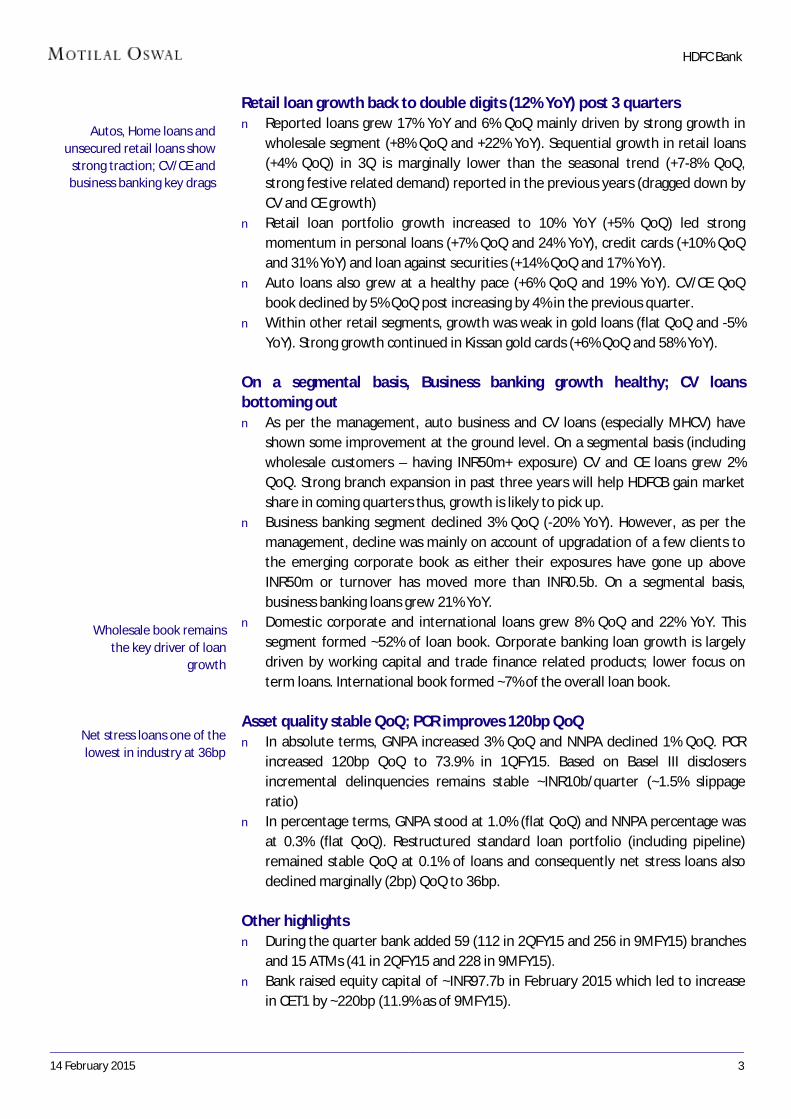
Retail loan growth back to double digits (12% YoY) post 3 quarters n Reported loans grew 17% YoY and 6% QoQ mainly driven by strong growth in
wholesale segment (+8% QoQ and +22% YoY). Sequential growth in retail loans (+4% QoQ) in 3Q is marginally lower than the seasonal trend (+7-8% QoQ, strong festive related demand) reported in the previous years (dragged down by CV and CE growth)
n Retail loan portfolio growth increased to 10% YoY (+5% QoQ) led strong momentum in personal loans (+7% QoQ and 24% YoY), credit cards (+10% QoQ and 31% YoY) and loan against securities (+14% QoQ and 17% YoY).
n Auto loans also grew at a healthy pace (+6% QoQ and 19% YoY). CV/CE QoQ book declined by 5% QoQ post increasing by 4% in the previous quarter.
n Within other retail segments, growth was weak in gold loans (flat QoQ and -5% YoY). Strong growth continued in Kissan gold cards (+6% QoQ and 58% YoY).
On a segmental basis, Business banking growth healthy; CV loans bottoming out n As per the management, auto business and CV loans (especially MHCV) have
shown some improvement at the ground level. On a segmental basis (including wholesale customers – having INR50m+ exposure) CV and CE loans grew 2% QoQ. Strong branch expansion in past three years will help HDFCB gain market share in coming quarters thus, growth is likely to pick up.
n Business banking segment declined 3% QoQ (-20% YoY). However, as per the management, decline was mainly on account of upgradation of a few clients to the emerging corporate book as either their exposures have gone up above INR50m or turnover has moved more than INR0.5b. On a segmental basis, business banking loans grew 21% YoY.
n Domestic corporate and international loans grew 8% QoQ and 22% YoY. This segment formed ~52% of loan book. Corporate banking loan growth is largely driven by working capital and trade finance related products; lower focus on term loans. International book formed ~7% of the overall loan book.
Asset quality stable QoQ; PCR improves 120bp QoQ n In absolute terms, GNPA increased 3% QoQ and NNPA declined 1% QoQ. PCR
increased 120bp QoQ to 73.9% in 1QFY15. Based on Basel III disclosers incremental delinquencies remains stable ~INR10b/quarter (~1.5% slippage ratio)
n In percentage terms, GNPA stood at 1.0% (flat QoQ) and NNPA percentage was at 0.3% (flat QoQ). Restructured standard loan portfolio (including pipeline) remained stable QoQ at 0.1% of loans and consequently net stress loans also declined marginally (2bp) QoQ to 36bp.
Other highlights n During the quarter bank added 59 (112 in 2QFY15 and 256 in 9MFY15) branches
and 15 ATMs (41 in 2QFY15 and 228 in 9MFY15). n Bank raised equity capital of ~INR97.7b in February 2015 which led to increase
in CET1 by ~220bp (11.9% as of 9MFY15).
Autos, Home loans and unsecured retail loans show
strong traction; CV/CE and business banking key drags
Wholesale book remains the key driver of loan
growth
Net stress loans one of the lowest in industry at 36bp

14 February 2015 4
HDFC Bank
Conference Call highlights Unsecured loans, Auto and home loans to drive near term retail growth n Business banking from a segment perspective grew 21% YoY. Decline seen in the
retail business banking (-3% QoQ and -20% YoY) is partially due to some of customers moving to wholesale category led by rise in exposure (INR50m+) or their turn over. Within this segment in LAP competitiveness has increased meaningfully. From a segmental perspective Business banking wholesale segment (~INR300b) contributes 60% of the book and rest is retail (~INR200b).
n CV and CE book (including wholesale) from a segmental perspective seen QoQ growth of ~2%. Under retail segment (-5% QoQ and -20% YoY) bank only reports exposure below INR50m in CV and CE segment
n Kissan gold cards business – strong growth on a lower base: These are purely retail agri loans and largely sourced from 6-7 states. These loans qualify in the direct agri for PSL. Average yield on the portfolio is 11-11.25%. NPAs in this segment are around 2-3%
n Remains comfortable on the underlying trends in the unsecured retail loans (~12% of the overall loans). Personal loans during the quarter grew 24% YoY and credit cards grew 31% YoY. There is no specific target for it to be as %age of overall loans
n INR12b home loans purchased during the quarter n Corporate banking loans break up: 75% is large corporate and 25% is mid
corporate. Within corporate segment working loans are 80% and project loans are at 20%
n 7% of the book is international and share of forex swap related loans stands stable YoY at US$1.8b
n Less than a percentage of total loan book is MFI Asset quality not much to worry about; No change in floating provisions n Retail asset quality remains stable. Concerns over CV and CE are coming down.
Overall delinquency levels remains well within the budgeted levels n 3QFY14 had a provision write back of INR1.8b leading to low base. In 2QFY15,
HDFCB utilized INR300m of floating provisions n INR4.8b specific provision and INR0.6b of general provisions during 3QFY15 n No addition or utilization of floating provisions during the quarter. Outstanding
floating provisions are at INR17.3b Fees will continue to lag loan growth n Fees growth picked up during the quarter to 15% YoY vs 9% YoY in 1Q and 13%
YoY in 2QFY15. Excluding one offs fee income growth would have been 12-13%. n Payment businesses, Card spends (impact of seasonality) and third party
distribution fees drove fees. 90% of the fees are retail and rest is wholesale. n Fee income growth will continue to lag loan growth in the near term as per
management. Over the medium and long term Retail: wholesale fees mix is expected to be 80:20.

14 February 2015 5
HDFC Bank
Other highlights n 56% of the outstanding branches (3659) in semi urban and rural in the areas n Total money raised via QIP INR97.7b. CET1 will increase by 220bp. n Trend of cost to income ratio is likely to remain at 42-45% n Outstanding RWA at INR3.96trn Valuation and view n Structural drivers in place with (1) CASA ratio of ~40%+, (2) growth outlook of
at-least 1.3x the industry growth, (3) improving operating efficiency, (4) expected traction in income due to strong expansion in branch network, and (5) best in the class asset quality.
n Retail loan growth is bottoming out and with the pickup in economic growth we expect its contribution to overall loans to go up. In the near term high ROE retail products like Unsecured retail loans, LAS etc will drive growth in our view. HDFCB has built capacity in downcycle to capture opportunities in the wholesale business and we expect it to play out as the risk aversion will reduce.
n Initial signs of core revenue growth pick up: Over the last 2 quarters, bank’s core revenue growth has accelerated to 21% YoY (16% in FY14 and 22% in FY13). With the improvement in economic growth and loan growth core revenues are expected to remain 22%+ from hereon.
n Despite pricing pressure NIMs are expected to remain at current levels as a) CASA growth will pick up b) benefit of falling rate cycle to occur due to high share of fixed rate retail loans c) high yielding retail loans contribution to rise and d) capital raise to provide free money benefit (benefit of ~15bp to NIMs)
n Operating leverage playing out: HDFCB is constantly striving to get operating leverage by improving productivity from the expansion happened in the last three years and cutting flab from the system. Efforts are demonstrated by 20%+ CAGR in core PPP despite some moderation in core revenues. Strong control over opex is commendable even as pace of expansion continues. With the ageing of branches, operating leverage to play out further and will be key to earnings growth in the moderate growth environment.
n Biggest risk to earnings for private financials is the implementation of dynamic provisioning by RBI wherein, HDFCB is best placed due to floating provisions created during the last three years. HDFCB carries floating provisions of INR17.2b created to smoothen earnings growth led by better-than-factored credit cost on retail loans.
n Earnings CAGR of 22%, best amongst large private banks, with core income growth pick up led by healthy loan growth, stable NIMs and improvement in fee income. Further, opex growth is expected to be lower at 18% CAGR over FY15/17 resulting into core PPP growth of 24%+.
n Attractive valuations for strong liability franchise: Over the last 12 years, HDFCB’s market share has increased significantly in (1) retail loans, (2) low cost deposits and (3) higher share in profitability; indicating the strength of its franchisee. Strong fundamentals and near nil stress loans would enable the bank to gain further market share. RoEs are expected to be best amongst private banks at ~20%. Maintain Buy.
Buy with a target price of INR1,335 (4x FY17E BV)

14 February 2015 6
HDFC Bank
Exhibit 2: Tweak estimates to factor in capital raise INR b Old Estimates New Estimates % Change FY15 FY16 FY17 FY15 FY16 FY17 FY15 FY16 FY17 Net Interest Income 224.0 272.6 336.9 224.7 275.9 340.1 0.3 1.2 1.0 Other Income 87.0 102.1 120.1 88.5 103.6 121.6 1.8 1.5 1.2 Total Income 311.0 374.7 457.0 313.2 379.4 461.7 0.7 1.3 1.0 Operating Expenses 137.8 161.7 196.2 139.4 163.5 198.4 1.2 1.2 1.2 Operating Profits 173.2 213.0 260.8 173.8 215.9 263.3 0.3 1.4 0.9 Provisions 18.7 25.1 32.3 19.3 24.4 31.4 PBT 154.5 187.9 228.5 154.5 191.5 231.8 0.0 1.9 1.5 Tax 51.8 62.0 75.4 52.2 64.1 76.5 0.8 3.5 1.5 PAT 102.8 125.9 153.1 102.4 127.3 155.3 -0.4 1.2 1.5 Margins (%) 4.6 4.7 4.7 4.7 4.8 4.8 Credit Cost (%) 0.6 0.6 0.6 0.6 0.6 0.6 RoA (%) 1.9 2.0 2.0 1.9 2.0 2.0 RoE (%) 21.7 22.4 22.9 19.6 19.3 20.2 EPS 43 52 64 41 51 63 BV 214 254 303 246 285 333 15 12 10 ABV 211 250 298 244 283 330 16 13 11
Exhibit 3: One year forward P/BV
Source: Company, MOSL
Exhibit 4: One year forward P/E
Source: Company, MOSL
BV increase of ~10% led by dilution however RoE
expected to best at ~20%
Factoring impact of capital raise; NIMs expected to be
higher by 10bp

14 February 2015 7
HDFC Bank
Exhibit 5: DuPont Analysis: Strong improvement in risk adjusted NIMs and operating leverage; RoAs at a decadal high (%) Y/E March FY08 FY09 FY10 FY11 FY12 FY13 FY14 FY15E FY16E FY17E
Net Interest Income 5.03 4.85 4.28 4.40 4.19 4.28 4.14 4.25 4.40 4.44
Core Fee Income 1.57 1.46 1.49 1.39 1.37 1.34 1.30 1.23 1.22 1.20
Fee to core Income 23.75 23.14 25.86 23.97 24.63 23.89 23.84 22.43 21.73 21.26
Core Income 6.60 6.31 5.77 5.79 5.56 5.63 5.44 5.47 5.63 5.63
Operating Expenses 3.84 3.76 3.19 3.11 3.02 3.04 2.70 2.63 2.61 2.59
Cost to Core Income 58.25 59.61 55.30 53.79 54.27 54.09 49.62 48.13 46.40 45.93
Employee cost 1.16 1.41 1.13 1.13 1.11 1.07 0.94 0.88 0.86 0.85
Others 2.68 2.35 2.06 1.98 1.91 1.97 1.76 1.75 1.75 1.74
Core operating Profits 2.75 2.55 2.58 2.67 2.54 2.58 2.74 2.84 3.02 3.05
Trading and others 0.66 0.88 0.76 0.59 0.51 0.51 0.48 0.45 0.43 0.39
Operating Profits 3.41 3.43 3.34 3.27 3.05 3.10 3.22 3.28 3.45 3.43
Provisions 1.38 1.34 1.23 0.94 0.61 0.45 0.36 0.36 0.39 0.41
NPA 1.14 1.25 1.13 0.48 0.35 0.33 0.37 0.35 0.39 0.40
Others 0.24 0.10 0.10 0.46 0.26 0.12 -0.01 0.02 0.00 0.01
PBT 2.03 2.09 2.11 2.33 2.44 2.64 2.86 2.92 3.06 3.02
Tax 0.62 0.67 0.66 0.76 0.76 0.82 0.96 0.99 1.02 1.00
Tax Rate 30.27 31.96 31.25 32.52 31.23 31.02 33.62 33.75 33.50 33.00
RoA 1.42 1.42 1.45 1.57 1.68 1.82 1.90 1.93 2.03 2.03
Leverage (x) 12.52 11.92 11.09 10.66 11.13 11.16 11.19 10.12 9.49 9.98
RoE 17.74 16.91 16.12 16.74 18.69 20.34 21.28 19.58 19.30 20.22
Source: Company, MOSL Exhibit 6: DuPont Analysis: Lower opex growth and strong trading gains help profitability in 3QFY15 (%) 1QFY13 2QFY13 3QFY13 4QFY13 1QFY14 2QFY14 3QFY14 4QFY14 1QFY15 2QFY15 3QFY15 NII 4.19 4.21 4.19 4.38 4.33 4.23 4.12 4.13 4.21 4.40 4.36 Fees (ex-forex) 1.32 1.32 1.49 1.41 1.26 1.28 1.40 1.27 1.14 1.23 1.38
Fees to core Inc 31.50 31.43 35.50 32.18 29.07 30.25 33.98 30.71 27.19 27.88 31.69 Core Income 5.51 5.54 5.67 5.79 5.59 5.50 5.52 5.40 5.35 5.63 5.75 Operating Expenses 3.01 2.91 2.93 3.20 2.98 2.77 2.58 2.65 2.59 2.79 2.65
C/ Core Inc (%) 54.69 52.63 51.68 55.24 53.27 50.32 46.62 49.04 48.32 49.63 46.04 Employee Expenses 1.14 1.04 1.06 1.03 1.09 0.98 0.87 0.88 0.92 0.93 0.87 Other Expenses 1.87 1.87 1.88 2.17 1.89 1.79 1.71 1.76 1.67 1.86 1.78 Core Oper. Profit 2.49 2.62 2.74 2.59 2.61 2.73 2.95 2.75 2.77 2.84 3.10 Trading and others 0.57 0.27 0.54 0.43 0.63 0.46 0.51 0.40 0.36 0.41 0.56 Operating Profit 3.07 2.89 3.28 3.02 3.24 3.20 3.46 3.15 3.13 3.24 3.66 Provisions 0.67 0.42 0.43 0.31 0.52 0.36 0.35 0.24 0.39 0.36 0.43 PBT 2.40 2.47 2.86 2.72 2.72 2.83 3.11 2.91 2.74 2.88 3.23 Tax 0.78 0.78 0.90 0.79 0.92 0.96 1.04 0.97 0.92 0.98 1.09
Tax Rate 32.30 31.53 31.56 29.01 33.65 33.94 33.53 33.40 33.56 33.93 33.75 ROA 1.62 1.69 1.95 1.93 1.81 1.87 2.07 1.94 1.82 1.90 2.14
Leverage (x) 11.34 11.35 11.07 10.94 10.94 10.74 10.79 11.11 10.98 10.57 10.41 ROE 18.43 19.21 21.62 21.10 19.77 20.10 22.32 21.55 19.95 20.10 22.27
Source: Company, MOSL

14 February 2015 8
HDFC Bank
Story in charts
Exhibit 7: Loans growth moderated on a high base..
Source: MOSL, Company
Exhibit 8: …. So does deposits growth
Source: MOSL, Company
Exhibit 9: Vehicle loans growth bottoming out
Source: MOSL, Company
Exhibit 10: Decline in CV/CE proportion continues
Source: MOSL, Company
Exhibit 11: Share of retail loans declined marginally to 47.7%
Loan (INR b) 3QFY15 3QFY14
YoY Gr (%)
2QFY15 QoQ
Gr (%) Auto 400 336 19 378 6 PL 248 201 24 231 7 LAS 12 10 17 11 14 2Wheerlers 40 33 21 36 9 CV and CE 132 167 -21 139 -5 CC 154 117 31 140 10 Bus. Banking 213 266 -20 220 -3 Home loans 200 161 24 196 2 Gold loans 39 41 -5 39 1 Kissan gold cards 136 86 58 129 6 Others 74 57 30 64 16 Retail loans 1,648 1,476 12 1,581 4 Corp and International 1,823 1,491 22 1,691 8 Total loans 3,471 2,967 17 3,273 6
Source: MOSL, Company
Exhibit 12: NIMs declined 10bp QoQ (%)
Source: MOSL, Company
1,75
5
1,88
5
1,94
3
1,95
4
2,13
3 2,31
6
2,41
5
2,39
7
2,58
6
2,68
6
2,96
7
3,03
0
3,12
1
3,27
3
3,47
1
20 20 22 22 22 23 24 23 21 1623 26
21 22 17
1QFY
12
1HFY
12
9MFY
12
FY12
1QFY
13
1HFY
13
9MFY
13
FY13
1QFY
14
1HFY
14
9MFY
14
FY14
1QFY
15
1HFY
15
9MFY
15
Loans (INR b) YoY Growth (%)
2,11
2
2,30
7
2,32
5
2,46
7
2,57
5
2,74
1
2,84
1
2,96
2
3,03
3
3,13
0
3,49
2
3,67
3
3,72
1
3,90
7
4,14
1
15.4 18.1 21.0 18.3 22.0 18.8 22.2 20.1 17.8 14.222.9 24.0 22.7 24.8
18.6
1QFY
12
1HFY
12
9MFY
12
FY12
1QFY
13
1HFY
13
9MFY
13
FY13
1QFY
14
1HFY
14
9MFY
14
FY14
1QFY
15
1HFY
15
9MFY
15
Deposits (INR b) YoY Gr (%)
343 381 408 420 446 482 494 501 522 526 536 508 515 553 572
2529
2430 30
2621 19 17
9 92 -1
5 7
1QFY
12
1HFY
12
9MFY
12
FY12
1QFY
13
1HFY
13
9MFY
13
FY13
1QFY
14
1HFY
14
9MFY
14
FY14
1QFY
15
1HFY
15
9MFY
15
Vehicle Loans (INR b) YoY Growth (%)6.
7
6.8
7.1
6.8
6.7
6.5
6.3
5.6
4.8
4.3
4.2
3.8
FY12
1QFY
13
1HFY
13
9MFY
13
FY13
1QFY
14
1HFY
14
9MFY
14
FY14
1QFY
15
1HFY
15
9MFY
15
%age of overall loans
4.24.1 4.1
4.44.6
4.44.3
4.6 4.6
4.34.2
4.4 4.44.5
4.4
1QFY
12
2QFY
12
3QFY
12
4QFY
12
1QFY
13
2QFY
13
3QFY
13
4QFY
13
1QFY
14
2QFY
14
3QFY
14
4QFY
14
1QFY
15
2QFY
15
3QFY
15

14 February 2015 9
HDFC Bank
Story in charts
Exhibit 13: Fee income growth strongest in last 8 quarters
Source: MOSL, Company
Exhibit 14: Asset quality remains under check
Source: MOSL, Company
Exhibit 15: Branch expansion continues
Source: MOSL, Company
Exhibit 16: CASA ratio declines 230bp QoQ (%)
Source: MOSL, Company
9.3
9.9
11.4
12.5
11.5
12.2
14.1
13.8
12.8
13.5
15.8
15.2
14.1
15.4
18.1
1.3 1.31.4 1.5
1.3 1.31.5 1.4
1.3 1.3 1.4 1.3 1.1 1.21.4
1QFY
12
2QFY
12
3QFY
12
4QFY
12
1QFY
13
2QFY
13
3QFY
13
4QFY
13
1QFY
14
2QFY
14
3QFY
14
4QFY
14
1QFY
15
2QFY
15
3QFY
15
Fee Inc.(INR b) Fee Inc. as % of Avg. Assets1.0 1.0 1.0 1.0 1.0 0.9
1.0 1.0 1.0 1.11.0 1.0
1.1 1.0 1.0
0.2 0.2 0.2 0.2 0.2 0.2 0.2 0.20.3 0.3
0.20.3 0.3 0.3 0.3
1QFY
12
1HFY
12
9MFY
12
FY12
1QFY
13
1HFY
13
9MFY
13
FY13
1QFY
14
1HFY
14
9MFY
14
FY14
1QFY
15
1HFY
15
9MFY
15
Gross NPAs (%) Net NPAs (%)
2,11
1
2,15
0
2,20
1
2,54
4
2,56
4
2,62
0
2,77
6
3,06
2
3,11
9
3,25
1
3,33
6
3,40
3
3,48
8
3,60
0
3,65
9
5,99
8
6,52
0
7,11
0
8,91
3
9,70
9
10,3
16
10,4
90
10,7
43
11,0
88
11,1
77
11,4
73
11,2
56
11,4
28
11,5
15
11,6
33
1QFY
12
1HFY
12
9MFY
12
FY12
1QFY
13
1HFY
13
9MFY
13
FY13
1QFY
14
1HFY
14
9MFY
14
FY14
1QFY
15
1HFY
15
9MFY
15
Branches ATM
1036
1092
1129
1194
1184
1273
1289
1405
1356
1409
1434
1646
1600
1686
1694
49.1
47.3
47.7
48.4
46.0
45.9
45.4
47.4
44.7
45.0
43.7
44.8
43.0
43.2
40.9
1QFY
12
1HFY
12
9MFY
12
FY12
1QFY
13
1HFY
13
9MFY
13
FY13
1QFY
14
1HFY
14
9MFY
14
FY14
1QFY
15
1HFY
15
9MFY
15
CASA Deposits (INR b) CASA Ratio (%)

14 February 2015 10
HDFC Bank
Exhibit 17: Quarterly Snapshot FY14 FY15 Variation (%) Cumulative Numbers 1Q 2Q 3Q 4Q 1Q 2Q 3Q QoQ YoY 9MFY14 9MFY15 YoY Gr (%) Profit and Loss (INR m)
Net Interest Income 44,187 44,765 46,348 49,527 51,716 55,110 56,999 3 23 135,300 163,825 21
Other Income 19,256 18,444 21,483 20,014 18,506 20,471 25,349 24 18 59,182 64,326 9
Trading profits 1,995 -1,733 509 333 250 951 2,655 179 422 771 3,856 400
Exchange Profits 3,143 5,014 3,332 2,521 2,242 2,217 2,534 14 -24 11,489 6,993 -39
Others (Ex non core) 14,118 15,163 17,642 17,160 16,014 17,303 20,160 17 14 46,922 53,477 14
Total Income 63,443 63,209 67,830 69,541 70,222 75,581 82,348 9 21 194,482 228,151 17
Operating Expenses 30,382 29,342 28,951 31,747 31,784 34,979 34,563 -1 19 88,675 101,326 14
Employee 11,091 10,357 9,730 10,612 11,259 11,669 11,325 -3 16 31,177 34,254 10
Others 19,291 18,985 19,221 21,135 20,525 23,310 23,238 0 21 57,497 67,072 17
Operating Profits 33,061 33,867 38,880 37,794 38,438 40,602 47,786 18 23 105,808 126,825 20
Provisions 5,271 3,859 3,888 2,861 4,828 4,559 5,604 23 44 13,019 14,991 15
PBT 27,790 30,007 34,991 34,933 33,610 36,043 42,181 17 21 92,789 111,834 21
Taxes 9,351 10,184 11,734 11,667 11,280 12,228 14,236 16 21 31,270 37,744 21
PAT 18,439 19,823 23,257 23,266 22,330 23,815 27,945 17 20 61,519 74,090 20
Asset Quality
GNPA 27,190 29,417 30,178 29,893 33,562 33,617 34,679 3 15
NNPA 6,890 7,672 7,973 8,200 10,074 9,173 9,037 -1 13
GNPA (%) 1.0 1.1 1.0 1.0 1.1 1.0 1.0 -3 -2
NNPA (%) 0.3 0.3 0.2 0.3 0.3 0.3 0.3 2 10
PCR (Calculated, %) 74.7 73.9 73.6 72.6 70.0 72.7 73.9 123 36
Ratios (%)
Fees to Total Income 22.3 24.0 26.0 24.7 22.8 22.9 24.5 24.1 23.4
Cost to Core Income 49.4 45.2 43.0 45.9 45.4 46.9 43.4 48.7 46.6
Tax Rate 33.6 33.9 33.5 33.4 33.6 33.9 33.8 33.7 33.7
CASA (Reported) 44.7 45.0 43.7 44.8 43.0 43.2 40.9
Loan/Deposit 85.3 85.8 85.0 82.5 83.9 83.8 83.8
RoA 1.8 1.9 2.1 1.9 1.8 1.9 2.1 1.9 2.0
RoE 19.8 20.1 22.3 21.5 20.0 20.1 22.3 20.7 20.8
Margins (%) - Calculated
Yield on loans 11.8 11.7 11.6 11.3 11.4 11.4 11.3 -3 -26 11.7 11.3 -33
Yield On Investments 8.2 8.9 8.7 7.7 7.6 8.3 8.2 -7 -51 8.6 8.0 -56
Yield on funds 10.5 10.8 10.6 10.0 10.2 10.4 10.3 -8 -28 10.6 10.3 -34
Cost of funds 6.2 6.5 6.4 5.8 5.9 6.0 6.1 3 -33 6.4 6.0 -36
Spreads 4.3 4.3 4.2 4.2 4.3 4.4 4.3 -11 5 4.3 4.3 2
Margins 4.8 4.8 4.6 4.6 4.7 4.8 4.7 -9 11 4.7 4.8 1
Margins (%) - Reported 4.6 4.3 4.2 4.4 4.4 4.5 4.4 -10 20 4.4 4.4 7
Source: MOSL, Company

14 February 2015 11
HDFC Bank
Exhibit 18: Quarterly Snapshot continued FY13 FY14 FY15 Variation (%)
1Q 2Q 3Q 4Q 1Q 2Q 3Q 4Q 1Q 2Q 3Q QoQ YoY
Balance Sheet (INR b)
ESC 5 5 5 5 5 5 5 5 5 5 5 0 1
Reserves and Surplus 311 329 350 357 379 400 424 430 456 482 512 6 21
Net Worth 316 333 354 362 384 405 429 435 460 487 517 6 20
Deposits 2,575 2,741 2,841 2,962 3,033 3,130 3,492 3,673 3,721 3,907 4,141 6 19
Borrowings+Sub Debt 261 310 316 330 391 393 438 394 386 385 397 3 -10
Other Liabiliites 448 389 326 349 355 383 322 413 346 320 294 -8 -9
Total Liabilities 3,600 3,774 3,837 4,003 4,163 4,312 4,681 4,916 4,914 5,100 5,349 5 14
Cash 183 217 200 146 190 199 213 253 221 204 210 3 -1
Money at call 57 50 47 127 64 81 139 142 80 113 121 7 -13
Investments 902 917 960 1,116 1,048 1,019 1,106 1,210 1,237 1,296 1,340 3 21
Advances 2,133 2,316 2,415 2,397 2,586 2,686 2,967 3,030 3,121 3,273 3,471 6 17
Total earning assets 3,092 3,284 3,422 3,640 3,699 3,786 4,213 4,382 4,438 4,681 4,931 5 17
Fixed Assets 24 25 26 27 29 29 29 29 29 29 29 1 0
Other Assets 301 248 190 190 246 297 226 251 226 186 178 -4 -21
Total Assets 3,600 3,774 3,837 4,003 4,163 4,312 4,681 4,916 4,914 5,100 5,349 5 14
Loan Break Up (%)
Retail 52.4 53.2 53.8 56.9 54.3 53.6 49.7 49.4 48.1 48.3 47.5 -83 -226
Auto Loans 12.9 12.5 12.4 12.9 12.5 12.1 11.3 10.9 11.1 11.5 11.5 -1 21
Personal Loans 6.9 6.8 7.0 7.3 7.2 7.2 6.8 6.7 6.9 7.1 7.1 8 38
Loan against securities 0.5 0.4 0.4 0.5 0.4 0.4 0.3 0.4 0.3 0.3 0.3 2 0
Two wheeler 1.2 1.2 1.2 1.3 1.2 1.2 1.1 1.1 1.1 1.1 1.1 3 4
CV & CE 6.8 7.1 6.8 6.7 6.5 6.3 5.6 4.8 4.3 4.2 3.8 -43 -184
Credit Cards 3.6 3.7 4.1 4.2 4.1 4.0 3.9 4.0 4.3 4.3 4.4 15 48
Business Banking 9.2 9.3 9.6 10.2 9.2 9.6 9.0 8.3 7.1 6.7 6.1 -56 -282
Home loans 6.4 6.7 6.6 7.0 6.6 6.1 5.4 6.4 6.3 6.0 5.8 -22 32
Gold loans 1.6 1.7 1.9 2.1 1.8 1.6 1.4 1.3 1.2 1.2 1.1 -6 -26
Kissan Gold Cards 2.1 2.9 2.9 3.5 3.5 3.9 3.9 -1 102
Other Retail loans 3.4 3.7 1.7 2.2 2.3 2.2 1.9 2.0 2.0 2.0 2.1 19 21
Corp. & International 47.6 46.8 46.2 43.1 45.7 46.4 50.3 50.6 51.9 51.7 52.5 83 226
Franchise
Branches 2,564 2,620 2,776 3,062 3,119 3,251 3,336 3,403 3,488 3,600 3,659 2 10
ATM 9,709 10,316 10,490 10,743 11,088 11,177 11,473 11,256 11,428 11,515 11,633 1 1
Source: Company, MOSL
14 February 2015 12
HDFC Bank
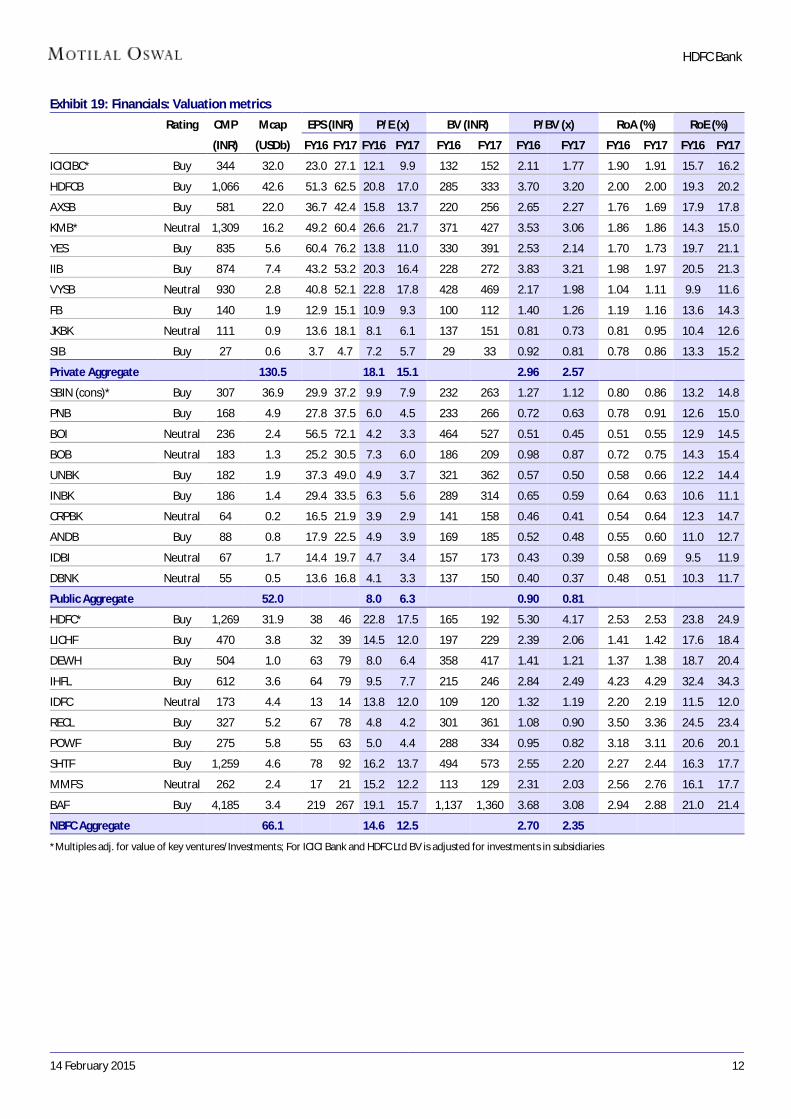
Exhibit 19: Financials: Valuation metrics
62.12 Rating CMP Mcap EPS (INR) P/E (x) BV (INR) P/BV (x) RoA (%) RoE (%)
(INR) (USDb) FY16 FY17 FY16 FY17 FY16 FY17 FY16 FY17 FY16 FY17 FY16 FY17
ICICIBC* Buy 344 32.0 23.0 27.1 12.1 9.9 132 152 2.11 1.77 1.90 1.91 15.7 16.2
HDFCB Buy 1,066 42.6 51.3 62.5 20.8 17.0 285 333 3.70 3.20 2.00 2.00 19.3 20.2
AXSB Buy 581 22.0 36.7 42.4 15.8 13.7 220 256 2.65 2.27 1.76 1.69 17.9 17.8
KMB* Neutral 1,309 16.2 49.2 60.4 26.6 21.7 371 427 3.53 3.06 1.86 1.86 14.3 15.0
YES Buy 835 5.6 60.4 76.2 13.8 11.0 330 391 2.53 2.14 1.70 1.73 19.7 21.1
IIB Buy 874 7.4 43.2 53.2 20.3 16.4 228 272 3.83 3.21 1.98 1.97 20.5 21.3
VYSB Neutral 930 2.8 40.8 52.1 22.8 17.8 428 469 2.17 1.98 1.04 1.11 9.9 11.6
FB Buy 140 1.9 12.9 15.1 10.9 9.3 100 112 1.40 1.26 1.19 1.16 13.6 14.3
JKBK Neutral 111 0.9 13.6 18.1 8.1 6.1 137 151 0.81 0.73 0.81 0.95 10.4 12.6
SIB Buy 27 0.6 3.7 4.7 7.2 5.7 29 33 0.92 0.81 0.78 0.86 13.3 15.2
Private Aggregate 130.5 18.1 15.1 2.96 2.57
SBIN (cons)* Buy 307 36.9 29.9 37.2 9.9 7.9 232 263 1.27 1.12 0.80 0.86 13.2 14.8
PNB Buy 168 4.9 27.8 37.5 6.0 4.5 233 266 0.72 0.63 0.78 0.91 12.6 15.0
BOI Neutral 236 2.4 56.5 72.1 4.2 3.3 464 527 0.51 0.45 0.51 0.55 12.9 14.5
BOB Neutral 183 1.3 25.2 30.5 7.3 6.0 186 209 0.98 0.87 0.72 0.75 14.3 15.4
UNBK Buy 182 1.9 37.3 49.0 4.9 3.7 321 362 0.57 0.50 0.58 0.66 12.2 14.4
INBK Buy 186 1.4 29.4 33.5 6.3 5.6 289 314 0.65 0.59 0.64 0.63 10.6 11.1
CRPBK Neutral 64 0.2 16.5 21.9 3.9 2.9 141 158 0.46 0.41 0.54 0.64 12.3 14.7
ANDB Buy 88 0.8 17.9 22.5 4.9 3.9 169 185 0.52 0.48 0.55 0.60 11.0 12.7
IDBI Neutral 67 1.7 14.4 19.7 4.7 3.4 157 173 0.43 0.39 0.58 0.69 9.5 11.9
DBNK Neutral 55 0.5 13.6 16.8 4.1 3.3 137 150 0.40 0.37 0.48 0.51 10.3 11.7
Public Aggregate 52.0 8.0 6.3 0.90 0.81
HDFC* Buy 1,269 31.9 38 46 22.8 17.5 165 192 5.30 4.17 2.53 2.53 23.8 24.9
LICHF Buy 470 3.8 32 39 14.5 12.0 197 229 2.39 2.06 1.41 1.42 17.6 18.4
DEWH Buy 504 1.0 63 79 8.0 6.4 358 417 1.41 1.21 1.37 1.38 18.7 20.4
IHFL Buy 612 3.6 64 79 9.5 7.7 215 246 2.84 2.49 4.23 4.29 32.4 34.3
IDFC Neutral 173 4.4 13 14 13.8 12.0 109 120 1.32 1.19 2.20 2.19 11.5 12.0
RECL Buy 327 5.2 67 78 4.8 4.2 301 361 1.08 0.90 3.50 3.36 24.5 23.4
POWF Buy 275 5.8 55 63 5.0 4.4 288 334 0.95 0.82 3.18 3.11 20.6 20.1
SHTF Buy 1,259 4.6 78 92 16.2 13.7 494 573 2.55 2.20 2.27 2.44 16.3 17.7
MMFS Neutral 262 2.4 17 21 15.2 12.2 113 129 2.31 2.03 2.56 2.76 16.1 17.7
BAF Buy 4,185 3.4 219 267 19.1 15.7 1,137 1,360 3.68 3.08 2.94 2.88 21.0 21.4
NBFC Aggregate 66.1 14.6 12.5 2.70 2.35
*Multiples adj. for value of key ventures/Investments; For ICICI Bank and HDFC Ltd BV is adjusted for investments in subsidiaries

14 February 2015 13
HDFC Bank
Financials and valuations
Income Statement (INR Million) Y/E March 2010 2011 2012 2013 2014 2015E 2016E 2017E
Interest Income 164,679 203,808 278,742 350,649 411,355 484,084 572,061 697,131
Interest Expense 77,863 93,851 149,896 192,538 226,529 259,424 296,179 356,988
Net Interest Income 86,816 109,957 128,846 158,111 184,826 224,659 275,882 340,144
Change (%) 13.1 26.7 17.2 22.7 16.9 21.6 22.8 23.3
Non Interest Income 45,736 49,452 57,836 68,526 79,196 88,523 103,554 121,584
Net Income 132,553 159,409 186,682 226,637 264,023 313,182 379,436 461,727
Change (%) 16.5 20.3 17.1 21.4 16.5 18.6 21.2 21.7
Operating Expenses 64,757 77,800 92,776 112,361 120,422 139,382 163,538 198,436
Pre Provision Profits 67,795 81,609 93,906 114,276 143,601 173,801 215,897 263,291
Change (%) 25.0 20.4 15.1 21.7 25.7 21.0 24.2 22.0
Provisions (excl tax) 24,904 23,422 18,774 16,770 15,880 19,256 24,425 31,442
PBT 42,891 58,187 75,132 97,506 127,721 154,545 191,473 231,849
Tax 13,404 18,923 23,461 30,249 42,937 52,159 64,143 76,510
Tax Rate (%) 31.3 32.5 31.2 31.0 33.6 33.8 33.5 33.0
PAT 29,487 39,264 51,671 67,257 84,784 102,386 127,329 155,339
Change (%) 31.3 33.2 31.6 30.2 26.1 20.8 24.4 22.0
Equity Dividend (Incl tax) 6,414 8,948 11,749 15,360 19,275 23,856 29,668 36,194
Core PPP* 52,167 68,179 79,428 97,607 122,227 150,239 188,944 233,569
Change (%) 24.6 30.7 16.5 22.9 25.2 22.9 25.8 23.6 *Core PPP is (NII+Fee income-Opex)
Balance Sheet (INR Million) Y/E March 2010 2011 2012 2013 2014 2015E 2016E 2017E Equity Share Capital 4,577 4,652 4,693 4,759 4,798 4,968 4,968 4,968 Reserves & Surplus 210,648 249,140 294,553 357,383 429,988 606,031 703,693 822,838 Net Worth 215,225 253,793 299,247 362,141 434,786 610,999 708,660 827,805 Deposits 1,674,044 2,085,864 2,467,064 2,962,470 3,673,375 4,334,582 5,288,190 6,610,238 Change (%) 17.2 24.6 18.3 20.1 24.0 18.0 22.0 25.0 of which CASA Dep 871,039 1,099,083 1,194,059 1,405,215 1,646,214 1,944,712 2,333,655 2,917,069 Change (%) 37.5 26.2 8.6 17.7 17.2 18.1 20.0 25.0 Borrowings 129,157 143,941 238,465 330,066 394,390 407,041 467,947 543,430 Other Liabilities & Prov. 206,159 289,929 374,319 348,642 413,444 315,658 394,306 492,761 Total Liabilities 2,224,586 2,773,526 3,379,095 4,003,319 4,915,995 5,668,280 6,859,104 8,474,234 Current Assets 299,424 296,688 209,377 272,802 395,836 395,097 389,097 486,703 Investments 586,076 709,294 974,829 1,116,136 1,209,511 1,390,937 1,669,125 2,002,950 Change (%) -0.4 21.0 37.4 14.5 8.4 15.0 20.0 20.0 Loans 1,258,306 1,599,827 1,954,200 2,397,206 3,030,003 3,636,003 4,508,644 5,635,805 Change (%) 27.3 27.1 22.2 22.7 26.4 20.0 24.0 25.0 Fixed Assets 21,228 21,706 23,472 27,031 29,399 32,683 35,967 41,251 Other Assets 59,551 146,011 217,216 190,144 251,246 213,559 256,271 307,525 Total Assets 2,224,586 2,773,526 3,379,095 4,003,319 4,915,995 5,668,280 6,859,104 8,474,234 Asset Quality (%) Y/E March 2010 2011 2012 2013 2014 2015E 2016E 2017E GNPA (INR m) 18,168 16,943 19,994 23,346 29,893 33,439 43,176 61,456 NNPA (INR m) 3,921 2,964 3,523 4,690 8,200 8,415 8,718 11,565 GNPA Ratio 1.4 1.0 1.0 1.0 1.0 0.9 1.0 1.1 NNPA Ratio 0.3 0.2 0.2 0.2 0.3 0.2 0.2 0.2 PCR (Excl Tech. write off) 78.4 82.5 82.4 79.9 72.6 74.8 79.8 81.2 E: MOSL Estimates

14 February 2015 14
HDFC Bank
Financials and valuations
Ratios
Y/E March 2010 2011 2012 2013 2014 2015E 2016E 2017E
Spreads Analysis (%)
Avg. Yield-Earning Assets 9.1 9.4 10.4 10.6 10.3 10.1 10.0 9.8
Avg. Yield on loans 11.0 10.9 11.9 12.3 11.7 11.2 11.0 10.9
Avg. Yield on Invt 6.8 7.2 7.7 7.5 7.8 8.0 7.6 7.4
Avg. Cost-Int. Bear. Liab. 4.7 4.7 6.1 6.4 6.2 5.9 5.6 5.5
Avg. Cost of Deposits 4.5 4.3 5.6 6.0 5.7 5.4 5.1 5.0
Interest Spread 4.4 4.7 4.4 4.2 4.1 4.3 4.3 4.3
Net Interest Margin 4.8 5.1 4.8 4.8 4.6 4.7 4.8 4.8
Profitability Ratios (%)
RoE 16.1 16.7 18.7 20.3 21.3 19.6 19.3 20.2
RoA 1.5 1.6 1.7 1.8 1.9 1.9 2.0 2.0
Int. Expense/Int.Income 47.3 46.0 53.8 54.9 55.1 53.6 51.8 51.2
Fee Income/Net Income 27.4 27.5 29.3 27.3 27.2 23.8 23.2 22.8
Non Int. Inc./Net Income 34.5 31.0 31.0 30.2 30.0 28.3 27.3 26.3
Efficiency Ratios (%)
Cost/Income* 50.2 48.6 49.2 49.9 45.8 46.8 45.2 44.9
Empl. Cost/Op. Exps. 35.4 36.5 36.6 35.3 34.7 33.4 33.1 32.7
Busi. per Empl. (INR m) 51.2 61.5 66.5 72.4 87.9 105.3 122.3 145.7 NP per Empl. (INR lac) 0.6 0.7 0.8 1.0 1.2 1.5 1.8 2.1 * ex treasury
Asset-Liability Profile (%)
Loans/Deposit 75.2 76.7 79.2 80.9 82.5 83.9 85.3 85.3
CASA Ratio 52.0 52.7 48.4 47.4 44.8 44.9 44.1 44.1
Investment/Deposit 35.0 34.0 39.5 37.7 32.9 32.1 31.6 30.3
G-Sec/Investment 87.1 75.6 78.2 76.1 78.2 81.0 82.4 85.8
CAR 17.4 16.2 16.5 16.8 16.1 18.1 16.8 15.4
Tier 1 13.3 12.2 11.6 11.1 11.8 14.3 13.6 12.8 Valuation
Book Value (INR) 94.0 109.1 127.4 152.1 181.3 246.0 285.3 333.3
Change (%) 32.9 16.0 16.8 19.4 19.2 35.7 16.0 16.8
Price-BV (x) 11.3 9.8 8.4 7.0 5.9 4.3 3.7 3.2
Adjusted BV (INR) 92.8 108.2 126.4 150.7 178.9 243.7 282.9 330.1
Price-ABV (x) 11.5 9.8 8.4 7.1 6.0 4.4 3.8 3.2
EPS (INR) 12.9 16.9 22.0 28.3 35.3 41.2 51.3 62.5
Change (%) 22.1 31.0 30.4 28.4 25.0 16.6 24.4 22.0
Price-Earnings (x) 63.1 48.4 37.7 30.2 25.9 20.8 17.0
Dividend Per Sh (INR) 2.4 3.3 4.3 5.5 6.9 8.2 10.3 12.5
Dividend Yield (%) 0.4 0.5 0.6 0.8 1.0 1.2 E: MOSL Estimates
14 February 2015 15
HDFC Bank
Corporate profile: HDFC Bank
Exhibit 21: Shareholding pattern (%) Dec-14 Sep-14 Dec-13
Promoter 22.5 22.5 22.7
DII 10.0 9.8 9.3
FII 50.6 50.7 51.9
Others 16.9 17.0 16.1
Note: FII Includes depository receipts
Exhibit 22: Top holders Holder Name % Holding
Europacific Growth Fund 3.7
LIC of India 2.9
ICICI Prudential Life Insurance Company Ltd 1.7
Government of Singapore 1.2
ICICI Prudential Focused Bluechip Equity Fund 1.1
Exhibit 23: Top management Name Designation
Aditya Puri Managing Director
Paresh Sukthankar Deputy Managing Director
Sashidhar Jagdishan CFO
Exhibit 24: Directors Name Name
Shyamala Gopinath Renu Karnad
Aditya Puri Bobby Parikh*
Paresh Sukthankar Pandit Palande*
A N Roy* Partho S Datta*
Keki Mistry Kaizad Bharucha
*Independent
Exhibit 25: Auditors
Name Type
BSR & Co LLP Statutory
Exhibit 26: MOSL forecast v/s consensus EPS (INR)
MOSL forecast
Consensus forecast
Variation (%)
FY15 41.2 42.8 -3.6 FY16 51.3 52.6 -2.4 FY17 62.5 64.8 -3.5
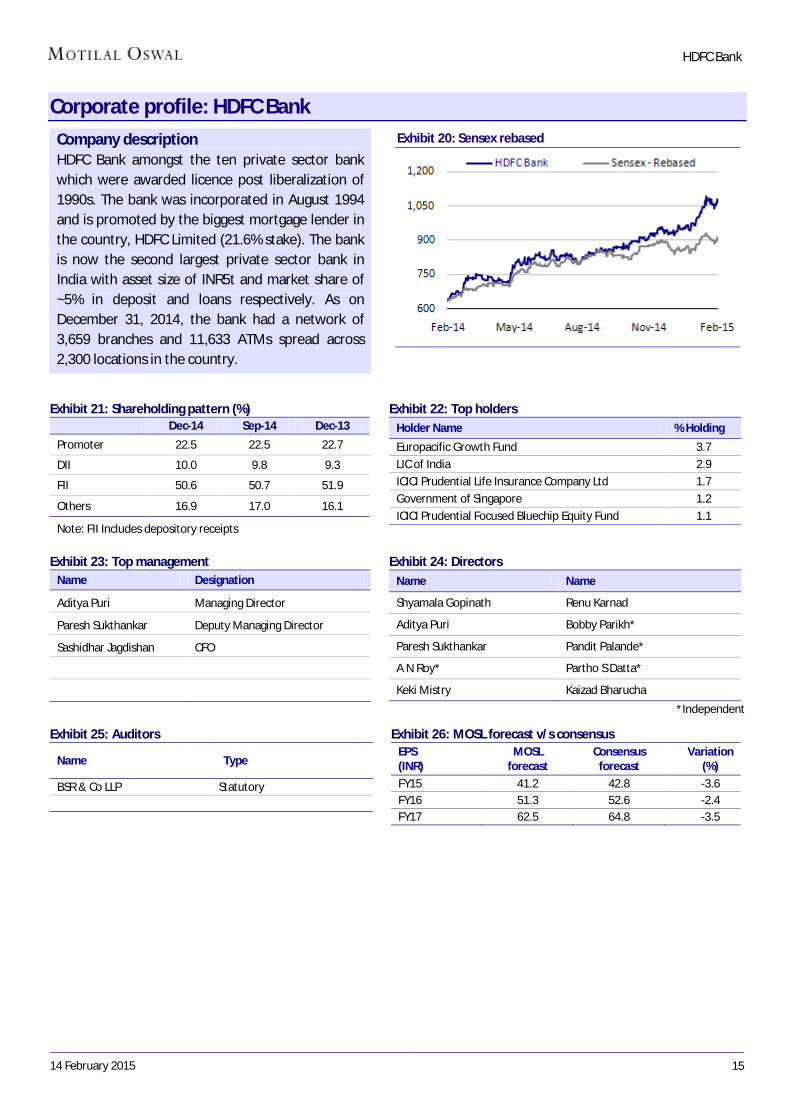
Company description HDFC Bank amongst the ten private sector bank which were awarded licence post liberalization of 1990s. The bank was incorporated in August 1994 and is promoted by the biggest mortgage lender in the country, HDFC Limited (21.6% stake). The bank is now the second largest private sector bank in India with asset size of INR5t and market share of ~5% in deposit and loans respectively. As on December 31, 2014, the bank had a network of 3,659 branches and 11,633 ATMs spread across 2,300 locations in the country.
Exhibit 20: Sensex rebased

14 February 2015 16
HDFC Bank
Disclosures This document has been prepared by Motilal Oswal Securities Limited (hereinafter referred to as Most) to provide information about the company(ies) and/sector(s), if any, covered in the report and may be distributed by it and/or its affiliated company(ies). This report is for personal information of the selected recipient/s and does not construe to be any investment, legal or taxation advice to you. This research report does not constitute an offer, invitation or inducement to invest in securities or other investments and Motilal Oswal Securities Limited (hereinafter referred as MOSt) is not soliciting any action based upon it. This report is not for public distribution and has been furnished to you solely for your general information and should not be reproduced or redistributed to any other person in any form. This report does not constitute a personal recommendation or take into account the particular investment objectives, financial situations, or needs of individual clients. Before acting on any advice or recommendation in this material, investors should consider whether it is suitable for their particular circumstances and, if necessary, seek professional advice. The price and value of the investments referred to in this material and the income from them may go down as well as up, and investors may realize losses on any investments. Past performance is not a guide for future performance, future returns are not guaranteed and a loss of original capital may occur.
MOSt and its affiliates are a full-service, integrated investment banking, investment management, brokerage and financing group. We and our affiliates have investment banking and other business relationships with a some companies covered by our Research Department. Our research professionals may provide input into our investment banking and other business selection processes. Investors should assume that MOSt and/or its affiliates are seeking or will seek investment banking or other business from the company or companies that are the subject of this material and that the research professionals who were involved in preparing this material may educate investors on investments in such business. The research professionals responsible for the preparation of this document may interact with trading desk personnel, sales personnel and other parties for the purpose of gathering, applying and interpreting information. Our research professionals are paid on the profitability of MOSt which may include earnings from investment banking and other business.
MOSt generally prohibits its analysts, persons reporting to analysts, and members of their households from maintaining a financial interest in the securities or derivatives of any companies that the analysts cover. Additionally, MOSt generally prohibits its analysts and persons reporting to analysts from serving as an officer, director, or advisory board member of any companies that the analysts cover. Our salespeople, traders, and other professionals or affiliates may provide oral or written market commentary or trading strategies to our clients that reflect opinions that are contrary to the opinions expressed herein, and our proprietary trading and investing businesses may make investment decisions that are inconsistent with the recommendations expressed herein. In reviewing these materials, you should be aware that any or all of the foregoing among other things, may give rise to real or potential conflicts of interest. MOSt and its affiliated company(ies), their directors and employees and their relatives may; (a) from time to time, have a long or short position in, act as principal in, and buy or sell the securities or derivatives thereof of companies mentioned herein. (b) be engaged in any other transaction involving such securities and earn brokerage or other compensation or act as a market maker in the financial instruments of the company(ies) discussed herein or act as an advisor or lender/borrower to such company(ies) or may have any other potential conflict of interests with respect to any recommendation and other related information and opinions.; however the same shall have no bearing whatsoever on the specific recommendations made by the analyst(s), as the recommendations made by the analyst(s) are completely independent of the views of the affiliates of MOSt even though there might exist an inherent conflict of interest in some of the stocks mentioned in the research report Reports based on technical and derivative analysis center on studying charts company's price movement, outstanding positions and trading volume, as opposed to focusing on a company's fundamentals and, as such, may not match with a report on a company's fundamental analysis. In addition MOST has different business segments / Divisions with independent research separated by Chinese walls catering to different set of customers having various objectives, risk profiles, investment horizon, etc, and therefore may at times have different contrary views on stocks sectors and markets.
Unauthorized disclosure, use, dissemination or copying (either whole or partial) of this information, is prohibited. The person accessing this information specifically agrees to exempt MOSt or any of its affiliates or employees from, any and all responsibility/liability arising from such misuse and agrees not to hold MOSt or any of its affiliates or employees responsible for any such misuse and further agrees to hold MOSt or any of its affiliates or employees free and harmless from all losses, costs, damages, expenses that may be suffered by the person accessing this information due to any errors and delays. The information contained herein is based on publicly available data or other sources believed to be reliable. Any statements contained in this report attributed to a third party represent MOSt’s interpretation of the data, information and/or opinions provided by that third party either publicly or through a subscription service, and such use and interpretation have not been reviewed by the third party. This Report is not intended to be a complete statement or summary of the securities, markets or developments referred to in the document. While we would endeavor to update the information herein on reasonable basis, MOSt and/or its affiliates are under no obligation to update the information. Also there may be regulatory, compliance, or other reasons that may prevent MOSt and/or its affiliates from doing so. MOSt or any of its affiliates or employees shall not be in any way responsible and liable for any loss or damage that may arise to any person from any inadvertent error in the information contained in this report. MOSt or any of its affiliates or employees do not provide, at any time, any express or implied warranty of any kind, regarding any matter pertaining to this report, including without limitation the implied warranties of merchantability, fitness for a particular purpose, and non-infringement. The recipients of this report should rely on their own investigations.
This report is intended for distribution to institutional investors. Recipients who are not institutional investors should seek advice of their independent financial advisor prior to taking any investment decision based on this report or for any necessary explanation of its contents.
Most and it’s associates may have managed or co-managed public offering of securities, may have received compensation for investment banking or merchant banking or brokerage services, may have received any compensation for products or services other than investment banking or merchant banking or brokerage services from the subject company in the past 12 months. Most and it’s associates have not received any compensation or other benefits from the subject company or third party in connection with the research report. Subject Company may have been a client of Most or its associates during twelve months preceding the date of distribution of the research report
MOSt and/or its affiliates and/or employees may have interests/positions, financial or otherwise of over 1 % at the end of the month immediately preceding the date of publication of the research in the securities mentioned in this report. To enhance transparency, MOSt has incorporated a Disclosure of Interest Statement in this document. This should, however, not be treated as endorsement of the views expressed in the report.
Motilal Oswal Securities Limited is under the process of seeking registration under SEBI (Research Analyst) Regulations, 2014.
There are no material disciplinary action that been taken by any regulatory authority impacting equity research analysis activities
Analyst Certification The views expressed in this research report accurately reflect the personal views of the analyst(s) about the subject securities or issues, and no part of the compensation of the research analyst(s) was, is, or will be directly or indirectly related to the specific recommendations and views expressed by research analyst(s) in this report. The research analysts, strategists, or research associates principally responsible for preparation of MOSt research receive compensation based upon various factors, including quality of research, investor client feedback, stock picking, competitive factors and firm revenues
Disclosure of Interest Statement HDFC BANK LIMITED § Analyst ownership of the stock No § Served as an officer, director or employee No
Regional Disclosures (outside India) This report is not directed or intended for distribution to or use by any person or entity resident in a state, country or any jurisdiction, where such distribution, publication, availability or use would be contrary to law, regulation or which would subject MOSt & its group companies to registration or licensing requirements within such jurisdictions.
For U.S. Motilal Oswal Securities Limited (MOSL) is not a registered broker - dealer under the U.S. Securities Exchange Act of 1934, as amended (the"1934 act") and under applicable state laws in the United States. In addition MOSL is not a registered investment adviser under the U.S. Investment Advisers Act of 1940, as amended (the "Advisers Act" and together with the 1934 Act, the "Acts), and under applicable state laws in the United States. Accordingly, in the absence of specific exemption under the Acts, any brokerage and investment services provided by MOSL, including the products and services described herein are not available to or intended for U.S. persons.
This report is intended for distribution only to "Major Institutional Investors" as defined by Rule 15a-6(b)(4) of the Exchange Act and interpretations thereof by SEC (henceforth referred to as "major institutional investors"). This document must not be acted on or relied on by persons who are not major institutional investors. Any investment or investment activity to which this document relates is only available to major institutional investors and will be engaged in only with major institutional investors. In reliance on the exemption from registration provided by Rule 15a-6 of the U.S. Securities Exchange Act of 1934, as amended (the "Exchange Act") and interpretations thereof by the U.S. Securities and Exchange Commission ("SEC") in order to conduct business with Institutional Investors based in the U.S., MOSL has entered into a chaperoning agreement with a U.S. registered broker-dealer, Motilal Oswal Securities International Private Limited. ("MOSIPL"). Any business interaction pursuant to this report will have to be executed within the provisions of this chaperoning agreement.
The Research Analysts contributing to the report may not be registered /qualified as research analyst with FINRA. Such research analyst may not be associated persons of the U.S. registered broker-dealer, MOSIPL, and therefore, may not be subject to NASD rule 2711 and NYSE Rule 472 restrictions on communication with a subject company, public appearances and trading securities held by a research analyst account.
For Singapore Motilal Oswal Capital Markets Singapore Pte Limited is acting as an exempt financial advisor under section 23(1)(f) of the Financial Advisers Act(FAA) read with regulation 17(1)(d) of the Financial Advisors Regulations and is a subsidiary of Motilal Oswal Securities Limited in India. This research is distributed in Singapore by Motilal Oswal Capital Markets Singapore Pte Limited and it is only directed in Singapore to accredited investors, as defined in the Financial Advisers Regulations and the Securities and Futures Act (Chapter 289), as amended from time to time. In respect of any matter arising from or in connection with the research you could contact the following representatives of Motilal Oswal Capital Markets Singapore Pte Limited: Anosh Koppikar Kadambari Balachandran Email : [email protected] Email : [email protected] Contact : (+65)68189232 Contact : (+65) 68189233 / 65249115 Office Address : 21 (Suite 31),16 Collyer Quay,Singapore 04931
Motilal Oswal Securities Ltd
Motilal Oswal Tower, Level 9, Sayani Road, Prabhadevi, Mumbai 400 025 Phone: +91 22 3982 5500 E-mail: [email protected]