3Q12 Earnings Release Divulgação de Resultados 3Q12 impacted by will Net Revenue Bento Gonçalves,...
17
Divulgação de Resultados 3Q12 3Q12 Earnings Release
Transcript of 3Q12 Earnings Release Divulgação de Resultados 3Q12 impacted by will Net Revenue Bento Gonçalves,...

Divulgação de Resultados 3Q12 3Q12 Earnings Release
3Q12
Bento Gonçalves, Rio Grande do Sul - November 12, 2012. Unicasa Móveis S.A.
(BM&FBOVESPA: UCAS3), one of the leading companies in Brazil’s customized furniture
industry, with a presence in all states and products in all income segments sold under the
brands Dell Anno, Favorita, New and Telasul, announces today its results for the third
quarter of 2012. Except where stated otherwise, all variations and comparisons are in
relation to the same period of the previous year and the following financial and operating
information is presented on an standalone basis, in thousands of reais, in accordance with
International Financial Reporting Standards (IFRS).
Market data as of Nov. 12, 2012 Stock price: R$
Market capitalization: R$
3Q12 Conference Call Conference call in Portuguese with
simultaneous translation into English:
November 13, 2012
Tuesday, 12:30 p.m. (Brasília time)
Dial-in through Brazil:
+ 55 11 4688-6341
Dial-in through the USA +1 786 924-6977
Investor Relations
3Q12 Highlights
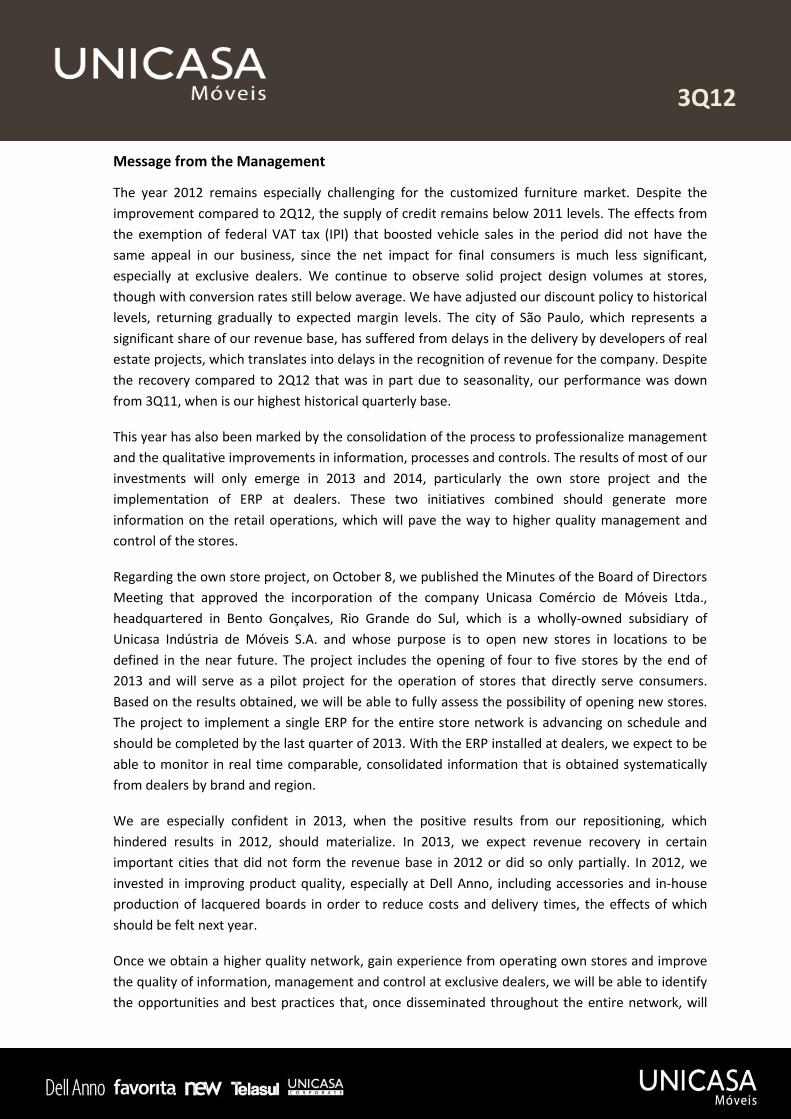
Net Revenue of R$72 million, down 11.7% from 3Q11 and up 8.2% from 2Q12;
Gross Margin of 41.0%, down 0.5 p.p. from 3Q11 and up 2 p.p. from 2Q12;
EBITDA of R$15.9 million, with EBITDA margin of 22.2%, compared to R$22.4 million with margin of 27.7% in 3Q11 and to R$7.9 million with margin of 12.0% in 2Q12;
Net income of R$12.2 million, down 30.4% from 3Q11 and up 114.1% from 2Q12;
Period Highlights
Executive Summary 3Q12 3Q11 Var. 9M12 9M11 Var.
Net Revenue 71,561 81,045 -11.7% 203,881 214,312 -4.9%
Gross Profit 29,339 33,604 -12.7% 83,990 90,905 -7.6%
Gross Margin 41.0% 41.5% -0.5 p.p. 41.2% 42.4% -1.2 p.p.
Operating Income 13,859 20,737 -33.2% 38,935 55,204 -29.5%
Operating Margin 19.4% 25.6% -6.2 p.p. 19.1% 25.8% -6.7 p.p.
Net Income 12,244 17,589 -30.4% 31,932 42,855 -25.5%
Net Margin 17.1% 21.7% -4.6 p.p. 15.7% 20.0% -4.3 p.p.
EBITDA 15,907 22,459 -29.2% 45,122 60,256 -25.1%
EBITDA Margin 22.2% 27.7% -5.5 p.p. 22.1% 28.1% -6.0 p.p.
The year 2012 has been especially challenging for the customized
furniture segment. Despite the recovery compared to the prior quarter
that was in part due to seasonality, our performance continued to be
impacted by the results in the first half of the year, with this scenario
expected to continue in the near term.
For 2013, considering a recovery in the macroeconomic scenario, we
will be in a privileged position to obtain better performance, benefitting
from the positive results of the repositioning efforts that adversely
affected results in 2012.
3Q12 Message from the Management
The year 2012 remains especially challenging for the customized furniture market. Despite the
improvement compared to 2Q12, the supply of credit remains below 2011 levels. The effects from
the exemption of federal VAT tax (IPI) that boosted vehicle sales in the period did not have the
same appeal in our business, since the net impact for final consumers is much less significant,
especially at exclusive dealers. We continue to observe solid project design volumes at stores,
though with conversion rates still below average. We have adjusted our discount policy to historical
levels, returning gradually to expected margin levels. The city of São Paulo, which represents a
significant share of our revenue base, has suffered from delays in the delivery by developers of real
estate projects, which translates into delays in the recognition of revenue for the company. Despite
the recovery compared to 2Q12 that was in part due to seasonality, our performance was down
from 3Q11, when is our highest historical quarterly base.
This year has also been marked by the consolidation of the process to professionalize management
and the qualitative improvements in information, processes and controls. The results of most of our
investments will only emerge in 2013 and 2014, particularly the own store project and the
implementation of ERP at dealers. These two initiatives combined should generate more
information on the retail operations, which will pave the way to higher quality management and
control of the stores.
Regarding the own store project, on October 8, we published the Minutes of the Board of Directors
Meeting that approved the incorporation of the company Unicasa Comércio de Móveis Ltda.,
headquartered in Bento Gonçalves, Rio Grande do Sul, which is a wholly-owned subsidiary of
Unicasa Indústria de Móveis S.A. and whose purpose is to open new stores in locations to be
defined in the near future. The project includes the opening of four to five stores by the end of
2013 and will serve as a pilot project for the operation of stores that directly serve consumers.
Based on the results obtained, we will be able to fully assess the possibility of opening new stores.
The project to implement a single ERP for the entire store network is advancing on schedule and
should be completed by the last quarter of 2013. With the ERP installed at dealers, we expect to be
able to monitor in real time comparable, consolidated information that is obtained systematically
from dealers by brand and region.
We are especially confident in 2013, when the positive results from our repositioning, which
hindered results in 2012, should materialize. In 2013, we expect revenue recovery in certain
important cities that did not form the revenue base in 2012 or did so only partially. In 2012, we
invested in improving product quality, especially at Dell Anno, including accessories and in-house
production of lacquered boards in order to reduce costs and delivery times, the effects of which
should be felt next year.
Once we obtain a higher quality network, gain experience from operating own stores and improve
the quality of information, management and control at exclusive dealers, we will be able to identify
the opportunities and best practices that, once disseminated throughout the entire network, will
3Q12
improve performance in the entire exclusive dealership base and in turn improve service quality
and consequently sales and profitability performance across the chain and for Unicasa.
Channels
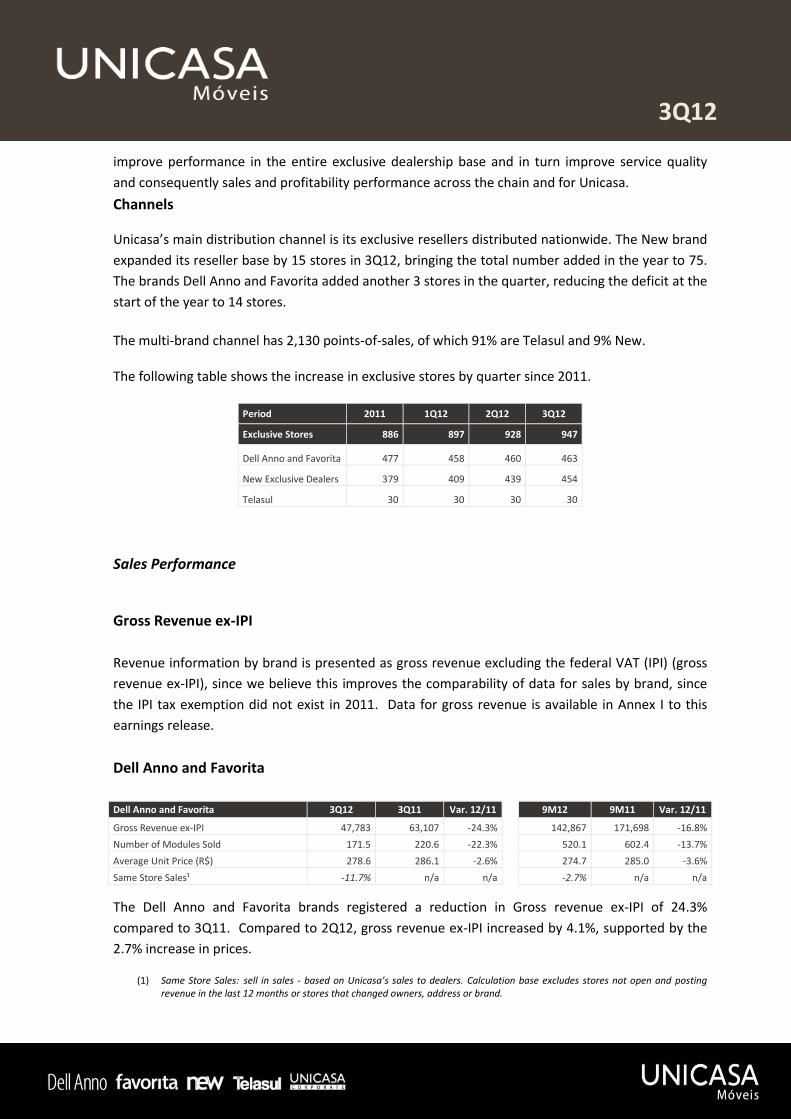
Unicasa’s main distribution channel is its exclusive resellers distributed nationwide. The New brand
expanded its reseller base by 15 stores in 3Q12, bringing the total number added in the year to 75.
The brands Dell Anno and Favorita added another 3 stores in the quarter, reducing the deficit at the
start of the year to 14 stores.
The multi-brand channel has 2,130 points-of-sales, of which 91% are Telasul and 9% New. The following table shows the increase in exclusive stores by quarter since 2011.
Period 2011 1Q12 2Q12 3Q12
Exclusive Stores 886 897 928 947
Dell Anno and Favorita 477 458 460 463
New Exclusive Dealers 379 409 439 454
Telasul 30 30 30 30
Sales Performance
Gross Revenue ex-IPI
Revenue information by brand is presented as gross revenue excluding the federal VAT (IPI) (gross
revenue ex-IPI), since we believe this improves the comparability of data for sales by brand, since
the IPI tax exemption did not exist in 2011. Data for gross revenue is available in Annex I to this
earnings release.
Dell Anno and Favorita
Dell Anno and Favorita 3Q12 3Q11 Var. 12/11 9M12 9M11 Var. 12/11
Gross Revenue ex-IPI 47,783 63,107 -24.3% 142,867 171,698 -16.8%
Number of Modules Sold 171.5 220.6 -22.3% 520.1 602.4 -13.7%
Average Unit Price (R$) 278.6 286.1 -2.6% 274.7 285.0 -3.6%
Same Store Sales¹ -11.7% n/a n/a -2.7% n/a n/a
The Dell Anno and Favorita brands registered a reduction in Gross revenue ex-IPI of 24.3%
compared to 3Q11. Compared to 2Q12, gross revenue ex-IPI increased by 4.1%, supported by the
2.7% increase in prices.
(1) Same Store Sales: sell in sales - based on Unicasa’s sales to dealers. Calculation base excludes stores not open and posting revenue in the last 12 months or stores that changed owners, address or brand.
3Q12
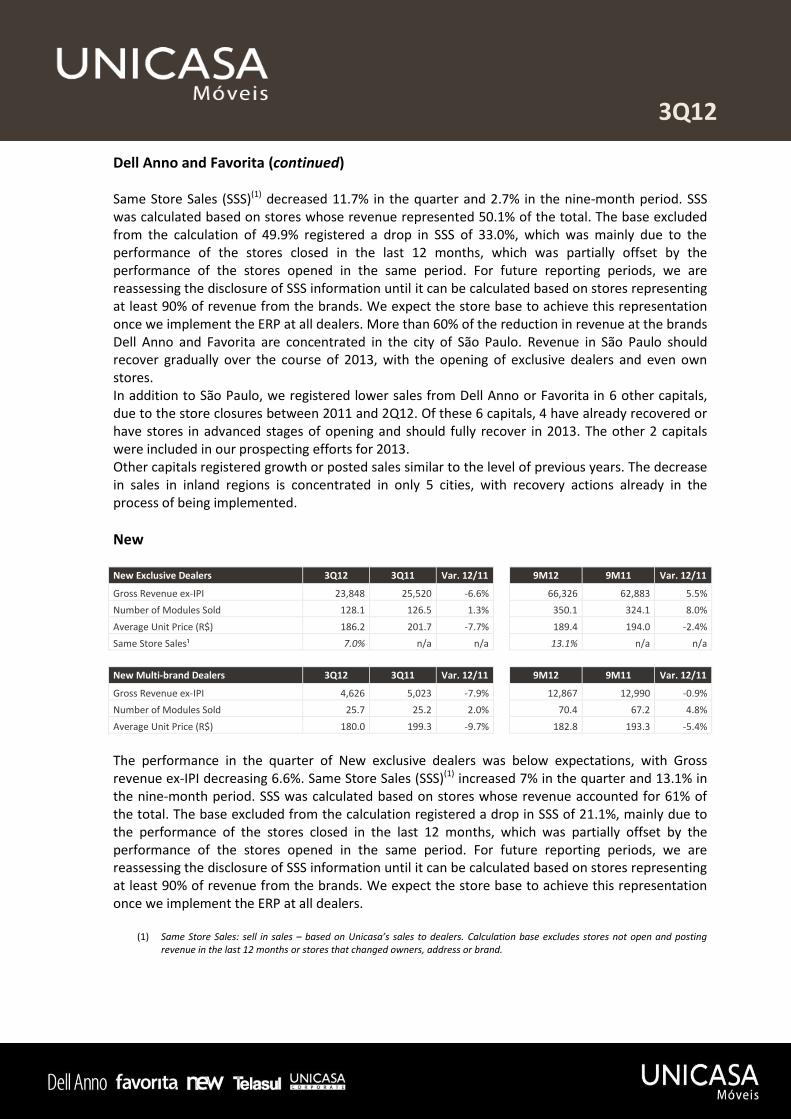
Dell Anno and Favorita (continued) Same Store Sales (SSS)(1) decreased 11.7% in the quarter and 2.7% in the nine-month period. SSS was calculated based on stores whose revenue represented 50.1% of the total. The base excluded from the calculation of 49.9% registered a drop in SSS of 33.0%, which was mainly due to the performance of the stores closed in the last 12 months, which was partially offset by the performance of the stores opened in the same period. For future reporting periods, we are reassessing the disclosure of SSS information until it can be calculated based on stores representing at least 90% of revenue from the brands. We expect the store base to achieve this representation once we implement the ERP at all dealers. More than 60% of the reduction in revenue at the brands Dell Anno and Favorita are concentrated in the city of São Paulo. Revenue in São Paulo should recover gradually over the course of 2013, with the opening of exclusive dealers and even own stores. In addition to São Paulo, we registered lower sales from Dell Anno or Favorita in 6 other capitals, due to the store closures between 2011 and 2Q12. Of these 6 capitals, 4 have already recovered or have stores in advanced stages of opening and should fully recover in 2013. The other 2 capitals were included in our prospecting efforts for 2013. Other capitals registered growth or posted sales similar to the level of previous years. The decrease in sales in inland regions is concentrated in only 5 cities, with recovery actions already in the process of being implemented.
New New Exclusive Dealers 3Q12 3Q11 Var. 12/11 9M12 9M11 Var. 12/11
Gross Revenue ex-IPI 23,848 25,520 -6.6% 66,326 62,883 5.5%
Number of Modules Sold 128.1 126.5 1.3% 350.1 324.1 8.0%
Average Unit Price (R$) 186.2 201.7 -7.7% 189.4 194.0 -2.4%
Same Store Sales¹ 7.0% n/a n/a 13.1% n/a n/a
New Multi-brand Dealers 3Q12 3Q11 Var. 12/11 9M12 9M11 Var. 12/11
Gross Revenue ex-IPI 4,626 5,023 -7.9% 12,867 12,990 -0.9%
Number of Modules Sold 25.7 25.2 2.0% 70.4 67.2 4.8%
Average Unit Price (R$) 180.0 199.3 -9.7% 182.8 193.3 -5.4%
The performance in the quarter of New exclusive dealers was below expectations, with Gross revenue ex-IPI decreasing 6.6%. Same Store Sales (SSS)(1) increased 7% in the quarter and 13.1% in the nine-month period. SSS was calculated based on stores whose revenue accounted for 61% of the total. The base excluded from the calculation registered a drop in SSS of 21.1%, mainly due to the performance of the stores closed in the last 12 months, which was partially offset by the performance of the stores opened in the same period. For future reporting periods, we are reassessing the disclosure of SSS information until it can be calculated based on stores representing at least 90% of revenue from the brands. We expect the store base to achieve this representation once we implement the ERP at all dealers.
(1) Same Store Sales: sell in sales – based on Unicasa’s sales to dealers. Calculation base excludes stores not open and posting revenue in the last 12 months or stores that changed owners, address or brand.
3Q12
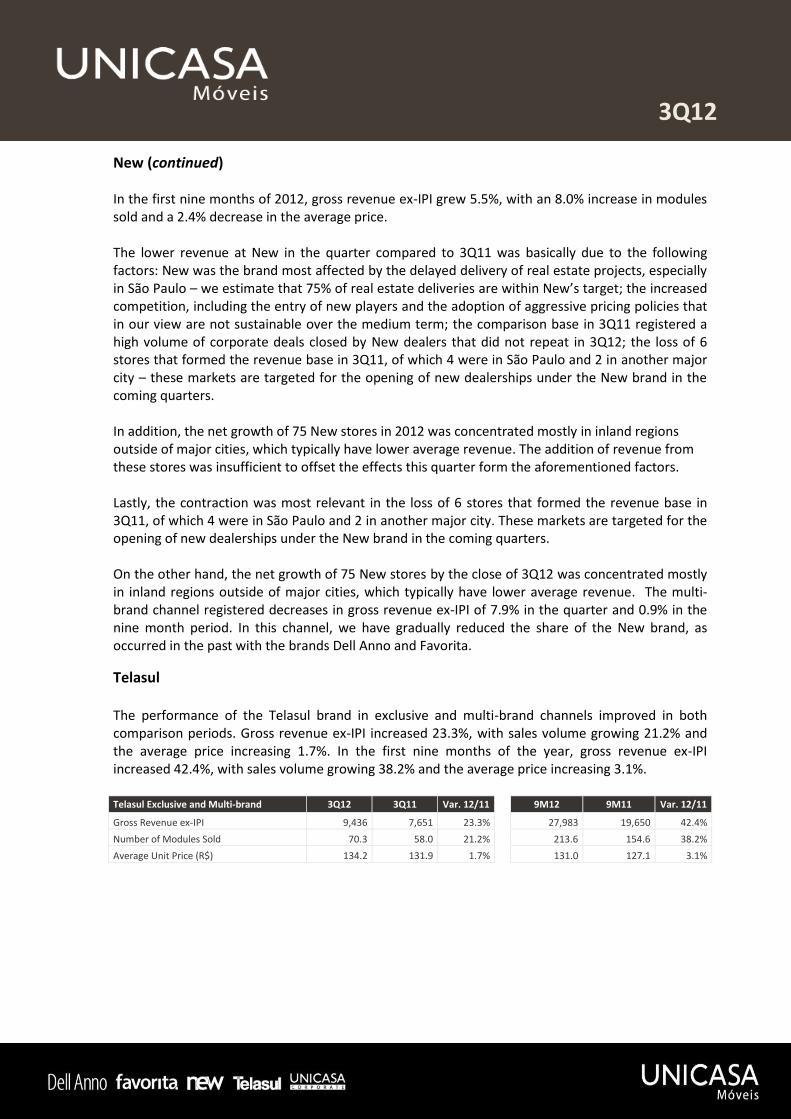
New (continued) In the first nine months of 2012, gross revenue ex-IPI grew 5.5%, with an 8.0% increase in modules sold and a 2.4% decrease in the average price. The lower revenue at New in the quarter compared to 3Q11 was basically due to the following factors: New was the brand most affected by the delayed delivery of real estate projects, especially in São Paulo – we estimate that 75% of real estate deliveries are within New’s target; the increased competition, including the entry of new players and the adoption of aggressive pricing policies that in our view are not sustainable over the medium term; the comparison base in 3Q11 registered a high volume of corporate deals closed by New dealers that did not repeat in 3Q12; the loss of 6 stores that formed the revenue base in 3Q11, of which 4 were in São Paulo and 2 in another major city – these markets are targeted for the opening of new dealerships under the New brand in the coming quarters. In addition, the net growth of 75 New stores in 2012 was concentrated mostly in inland regions outside of major cities, which typically have lower average revenue. The addition of revenue from these stores was insufficient to offset the effects this quarter form the aforementioned factors. Lastly, the contraction was most relevant in the loss of 6 stores that formed the revenue base in 3Q11, of which 4 were in São Paulo and 2 in another major city. These markets are targeted for the opening of new dealerships under the New brand in the coming quarters. On the other hand, the net growth of 75 New stores by the close of 3Q12 was concentrated mostly in inland regions outside of major cities, which typically have lower average revenue. The multi-brand channel registered decreases in gross revenue ex-IPI of 7.9% in the quarter and 0.9% in the nine month period. In this channel, we have gradually reduced the share of the New brand, as occurred in the past with the brands Dell Anno and Favorita.
Telasul The performance of the Telasul brand in exclusive and multi-brand channels improved in both comparison periods. Gross revenue ex-IPI increased 23.3%, with sales volume growing 21.2% and the average price increasing 1.7%. In the first nine months of the year, gross revenue ex-IPI increased 42.4%, with sales volume growing 38.2% and the average price increasing 3.1%. Telasul Exclusive and Multi-brand 3Q12 3Q11 Var. 12/11 9M12 9M11 Var. 12/11
Gross Revenue ex-IPI 9,436 7,651 23.3% 27,983 19,650 42.4%
Number of Modules Sold 70.3 58.0 21.2% 213.6 154.6 38.2%
Average Unit Price (R$) 134.2 131.9 1.7% 131.0 127.1 3.1%
3Q12
Unicasa Corporate
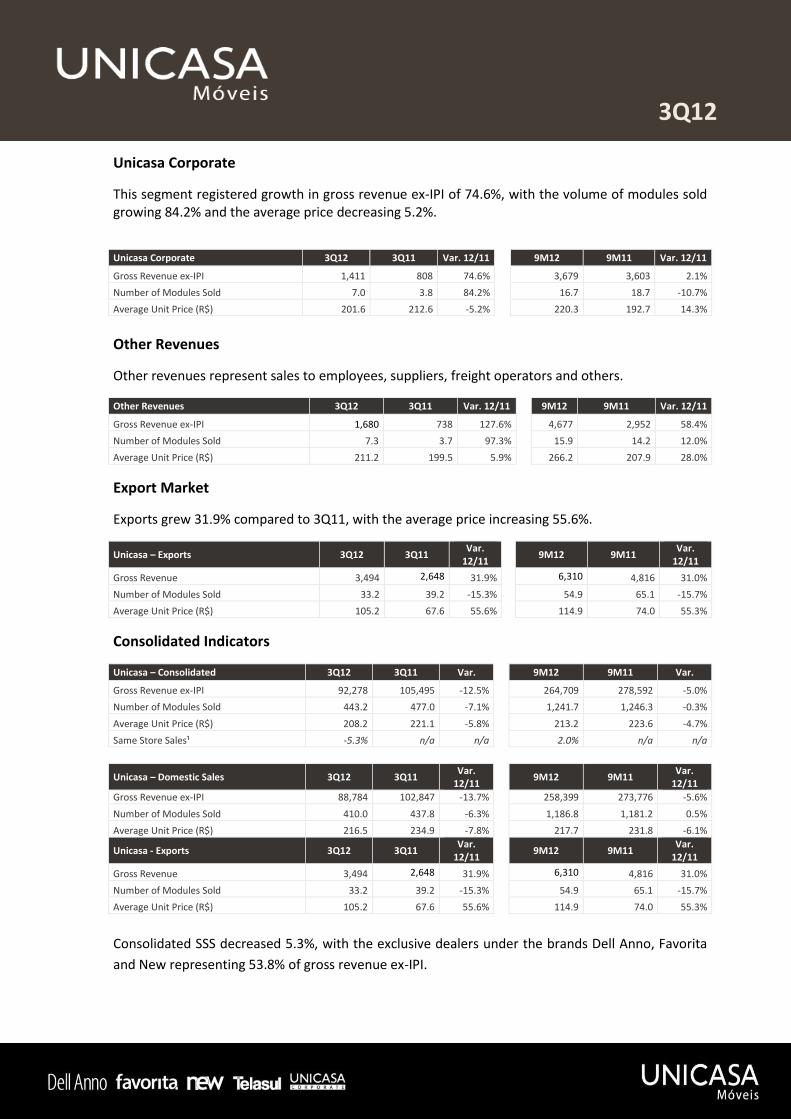
This segment registered growth in gross revenue ex-IPI of 74.6%, with the volume of modules sold growing 84.2% and the average price decreasing 5.2%.
Unicasa Corporate 3Q12 3Q11 Var. 12/11 9M12 9M11 Var. 12/11
Gross Revenue ex-IPI 1,411 808 74.6% 3,679 3,603 2.1%
Number of Modules Sold 7.0 3.8 84.2% 16.7 18.7 -10.7%
Average Unit Price (R$) 201.6 212.6 -5.2% 220.3 192.7 14.3%
Other Revenues
Other revenues represent sales to employees, suppliers, freight operators and others.
Other Revenues 3Q12 3Q11 Var. 12/11 9M12 9M11 Var. 12/11
Gross Revenue ex-IPI 1,680 738 127.6% 4,677 2,952 58.4%
Number of Modules Sold 7.3 3.7 97.3% 15.9 14.2 12.0%
Average Unit Price (R$) 211.2 199.5 5.9% 266.2 207.9 28.0%
Export Market
Exports grew 31.9% compared to 3Q11, with the average price increasing 55.6%.
Unicasa – Exports 3Q12 3Q11 Var.
12/11 9M12 9M11
Var. 12/11
Gross Revenue 3,494 2,648 31.9% 6,310 4,816 31.0%
Number of Modules Sold 33.2 39.2 -15.3% 54.9 65.1 -15.7%
Average Unit Price (R$) 105.2 67.6 55.6% 114.9 74.0 55.3%
Consolidated Indicators
Unicasa – Consolidated 3Q12 3Q11 Var. 9M12 9M11 Var.
Gross Revenue ex-IPI 92,278 105,495 -12.5% 264,709 278,592 -5.0%
Number of Modules Sold 443.2 477.0 -7.1% 1,241.7 1,246.3 -0.3%
Average Unit Price (R$) 208.2 221.1 -5.8% 213.2 223.6 -4.7%
Same Store Sales¹ -5.3% n/a n/a 2.0% n/a n/a
Unicasa – Domestic Sales 3Q12 3Q11 Var.
12/11 9M12 9M11
Var. 12/11
Gross Revenue ex-IPI 88,784 102,847 -13.7% 258,399 273,776 -5.6%
Number of Modules Sold 410.0 437.8 -6.3% 1,186.8 1,181.2 0.5%
Average Unit Price (R$) 216.5 234.9 -7.8% 217.7 231.8 -6.1%
Unicasa - Exports 3Q12 3Q11 Var.
12/11 9M12 9M11
Var. 12/11
Gross Revenue 3,494 2,648 31.9% 6,310 4,816 31.0%
Number of Modules Sold 33.2 39.2 -15.3% 54.9 65.1 -15.7%
Average Unit Price (R$) 105.2 67.6 55.6% 114.9 74.0 55.3%
Consolidated SSS decreased 5.3%, with the exclusive dealers under the brands Dell Anno, Favorita
and New representing 53.8% of gross revenue ex-IPI.
3Q12
Financial Performance
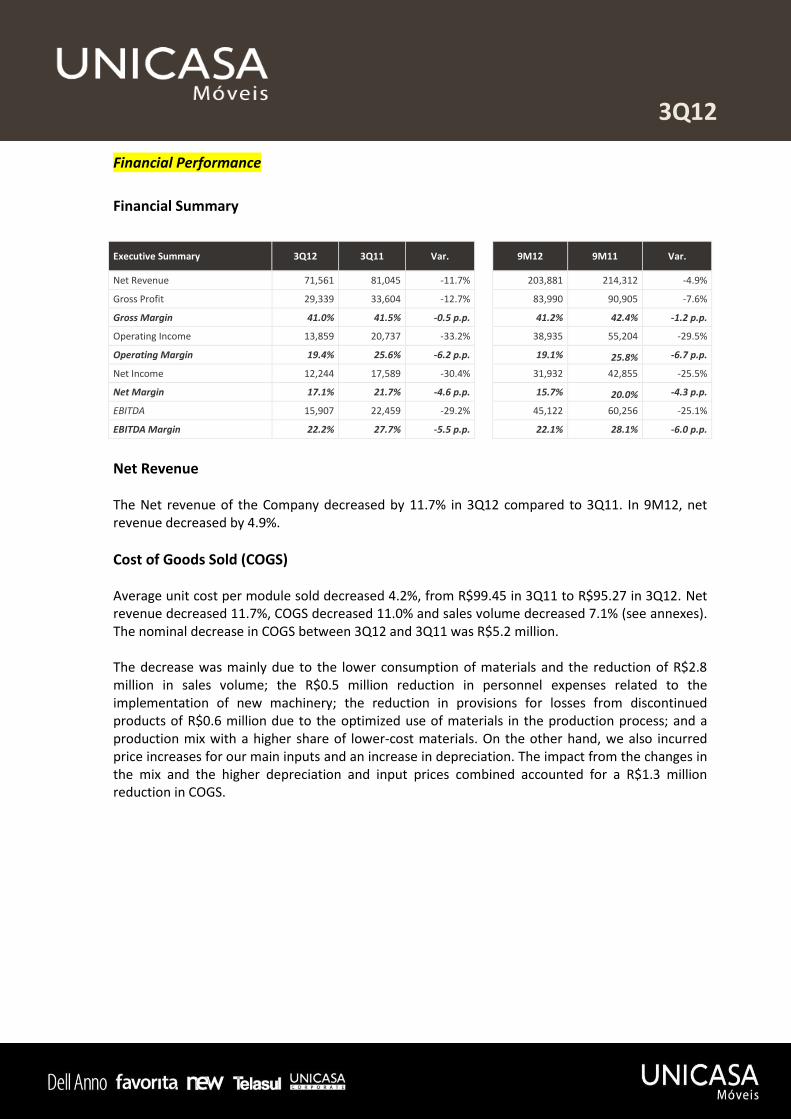
Financial Summary
Executive Summary 3Q12 3Q11 Var. 9M12 9M11 Var.
Net Revenue 71,561 81,045 -11.7% 203,881 214,312 -4.9%
Gross Profit 29,339 33,604 -12.7% 83,990 90,905 -7.6%
Gross Margin 41.0% 41.5% -0.5 p.p. 41.2% 42.4% -1.2 p.p.
Operating Income 13,859 20,737 -33.2% 38,935 55,204 -29.5%
Operating Margin 19.4% 25.6% -6.2 p.p. 19.1% 25.8% -6.7 p.p.
Net Income 12,244 17,589 -30.4% 31,932 42,855 -25.5%
Net Margin 17.1% 21.7% -4.6 p.p. 15.7% 20.0% -4.3 p.p.
EBITDA 15,907 22,459 -29.2% 45,122 60,256 -25.1%
EBITDA Margin 22.2% 27.7% -5.5 p.p. 22.1% 28.1% -6.0 p.p.
Net Revenue The Net revenue of the Company decreased by 11.7% in 3Q12 compared to 3Q11. In 9M12, net revenue decreased by 4.9%.
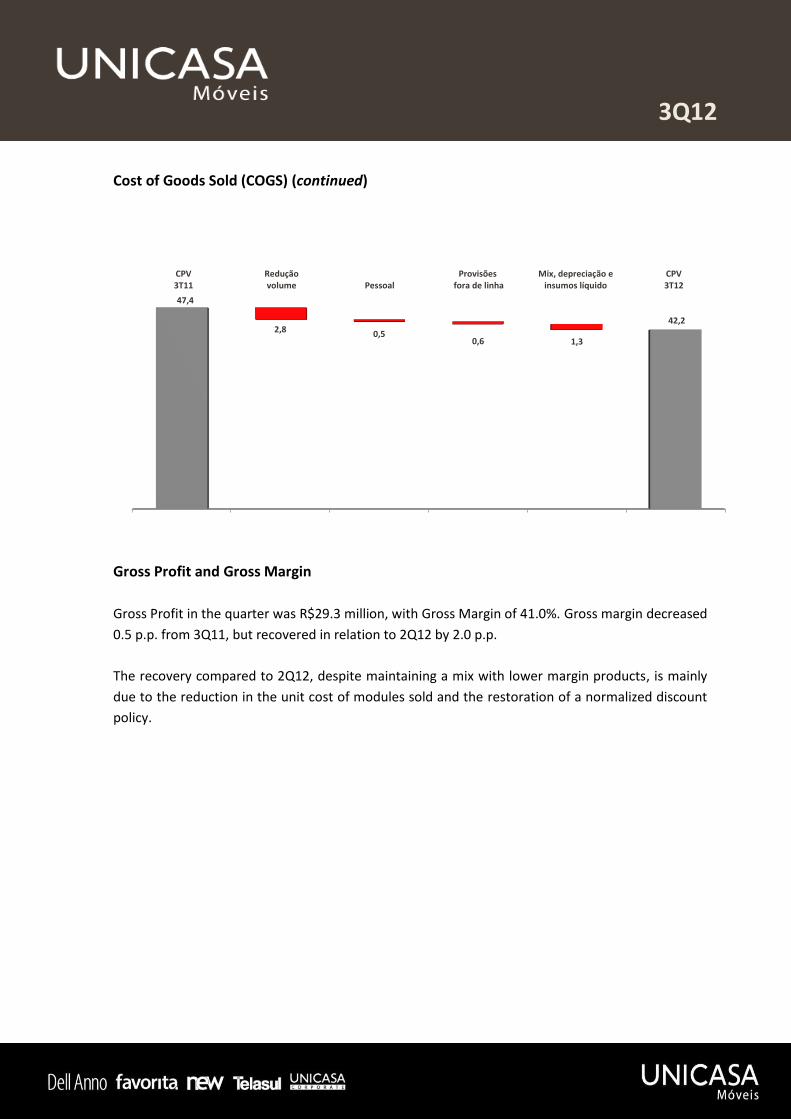
Cost of Goods Sold (COGS) Average unit cost per module sold decreased 4.2%, from R$99.45 in 3Q11 to R$95.27 in 3Q12. Net revenue decreased 11.7%, COGS decreased 11.0% and sales volume decreased 7.1% (see annexes). The nominal decrease in COGS between 3Q12 and 3Q11 was R$5.2 million. The decrease was mainly due to the lower consumption of materials and the reduction of R$2.8 million in sales volume; the R$0.5 million reduction in personnel expenses related to the implementation of new machinery; the reduction in provisions for losses from discontinued products of R$0.6 million due to the optimized use of materials in the production process; and a production mix with a higher share of lower-cost materials. On the other hand, we also incurred price increases for our main inputs and an increase in depreciation. The impact from the changes in the mix and the higher depreciation and input prices combined accounted for a R$1.3 million reduction in COGS.
3Q12
Cost of Goods Sold (COGS) (continued)
Gross Profit and Gross Margin
Gross Profit in the quarter was R$29.3 million, with Gross Margin of 41.0%. Gross margin decreased
0.5 p.p. from 3Q11, but recovered in relation to 2Q12 by 2.0 p.p.
The recovery compared to 2Q12, despite maintaining a mix with lower margin products, is mainly
due to the reduction in the unit cost of modules sold and the restoration of a normalized discount
policy.
CPV3T11
Reduçãovolume Pessoal
Provisões fora de linha
Mix, depreciação einsumos líquido
CPV3T12
47,4
2,8 0,50,6 1,3
42,2
3Q12
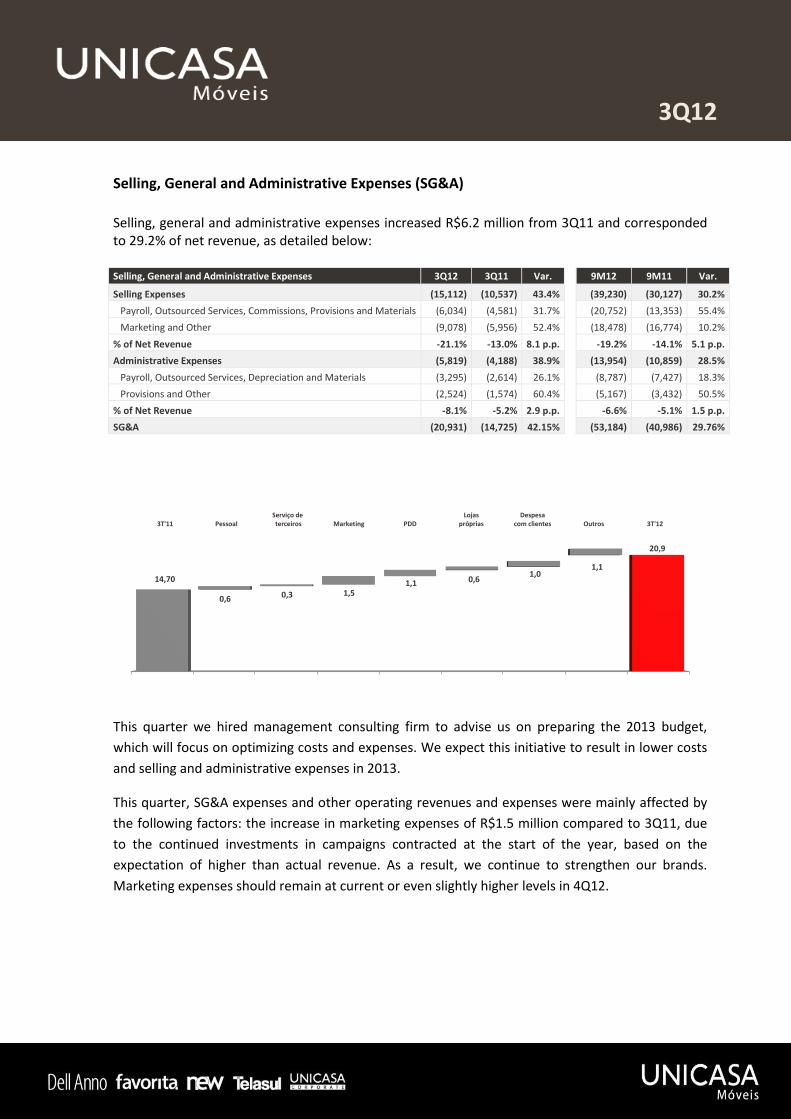
Selling, General and Administrative Expenses (SG&A)
Selling, general and administrative expenses increased R$6.2 million from 3Q11 and corresponded to 29.2% of net revenue, as detailed below: Selling, General and Administrative Expenses 3Q12 3Q11 Var. 9M12 9M11 Var.
Selling Expenses (15,112) (10,537) 43.4% (39,230) (30,127) 30.2%
Payroll, Outsourced Services, Commissions, Provisions and Materials (6,034) (4,581) 31.7% (20,752) (13,353) 55.4%
Marketing and Other (9,078) (5,956) 52.4% (18,478) (16,774) 10.2%
% of Net Revenue -21.1% -13.0% 8.1 p.p. -19.2% -14.1% 5.1 p.p.
Administrative Expenses (5,819) (4,188) 38.9% (13,954) (10,859) 28.5%
Payroll, Outsourced Services, Depreciation and Materials (3,295) (2,614) 26.1% (8,787) (7,427) 18.3%
Provisions and Other (2,524) (1,574) 60.4% (5,167) (3,432) 50.5%
% of Net Revenue -8.1% -5.2% 2.9 p.p. -6.6% -5.1% 1.5 p.p.
SG&A (20,931) (14,725) 42.15%
(53,184) (40,986) 29.76%
This quarter we hired management consulting firm to advise us on preparing the 2013 budget,
which will focus on optimizing costs and expenses. We expect this initiative to result in lower costs
and selling and administrative expenses in 2013.
This quarter, SG&A expenses and other operating revenues and expenses were mainly affected by
the following factors: the increase in marketing expenses of R$1.5 million compared to 3Q11, due
to the continued investments in campaigns contracted at the start of the year, based on the
expectation of higher than actual revenue. As a result, we continue to strengthen our brands.
Marketing expenses should remain at current or even slightly higher levels in 4Q12.
3T'11 PessoalServiço de terceiros Marketing PDD
Lojaspróprias
Despesacom clientes Outros 3T'12
14,70
0,6 0,3 1,5 1,1 0,6
1,0 1,1
20,9
3Q12
Selling, General and Administrative Expenses (SG&A) (continued)
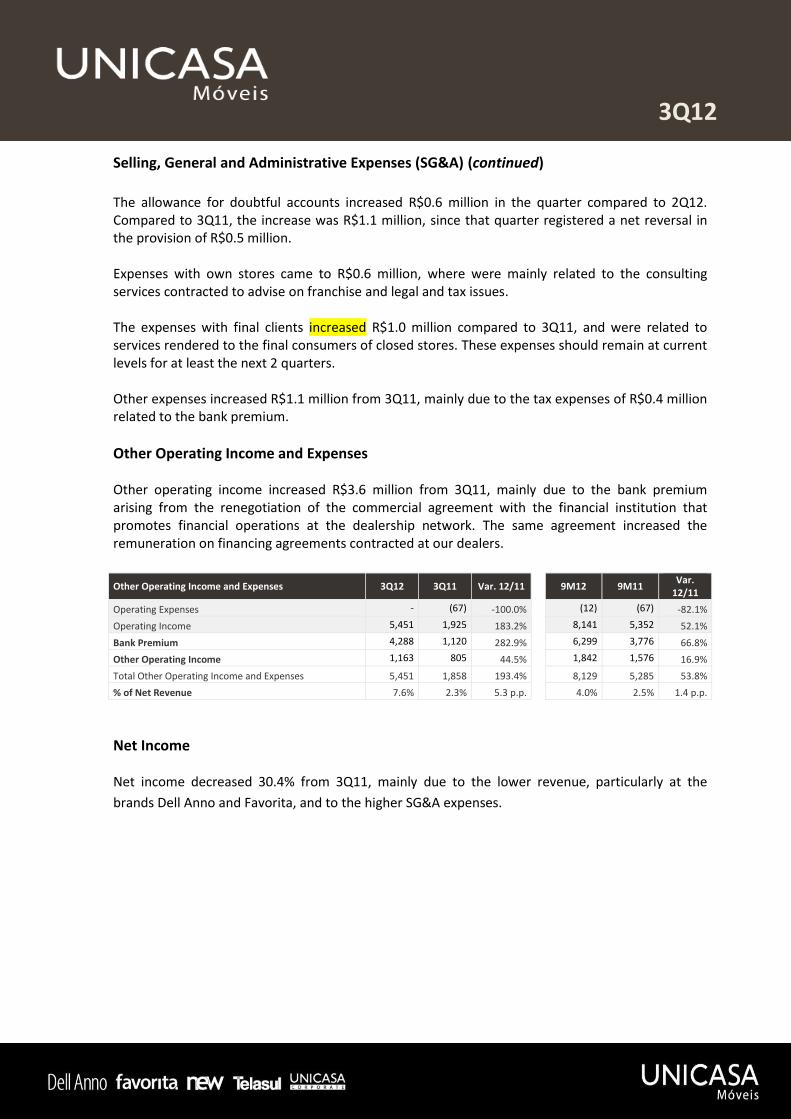
The allowance for doubtful accounts increased R$0.6 million in the quarter compared to 2Q12. Compared to 3Q11, the increase was R$1.1 million, since that quarter registered a net reversal in the provision of R$0.5 million. Expenses with own stores came to R$0.6 million, where were mainly related to the consulting services contracted to advise on franchise and legal and tax issues. The expenses with final clients increased R$1.0 million compared to 3Q11, and were related to services rendered to the final consumers of closed stores. These expenses should remain at current levels for at least the next 2 quarters. Other expenses increased R$1.1 million from 3Q11, mainly due to the tax expenses of R$0.4 million related to the bank premium.
Other Operating Income and Expenses Other operating income increased R$3.6 million from 3Q11, mainly due to the bank premium arising from the renegotiation of the commercial agreement with the financial institution that promotes financial operations at the dealership network. The same agreement increased the remuneration on financing agreements contracted at our dealers.
Other Operating Income and Expenses 3Q12 3Q11 Var. 12/11 9M12 9M11 Var.
12/11
Operating Expenses - (67) -100.0% (12) (67) -82.1%
Operating Income 5,451 1,925 183.2% 8,141 5,352 52.1%
Bank Premium 4,288 1,120 282.9% 6,299 3,776 66.8%
Other Operating Income 1,163 805 44.5% 1,842 1,576 16.9%
Total Other Operating Income and Expenses 5,451 1,858 193.4% 8,129 5,285 53.8%
% of Net Revenue 7.6% 2.3% 5.3 p.p. 4.0% 2.5% 1.4 p.p.
Net Income Net income decreased 30.4% from 3Q11, mainly due to the lower revenue, particularly at the
brands Dell Anno and Favorita, and to the higher SG&A expenses.
3Q12
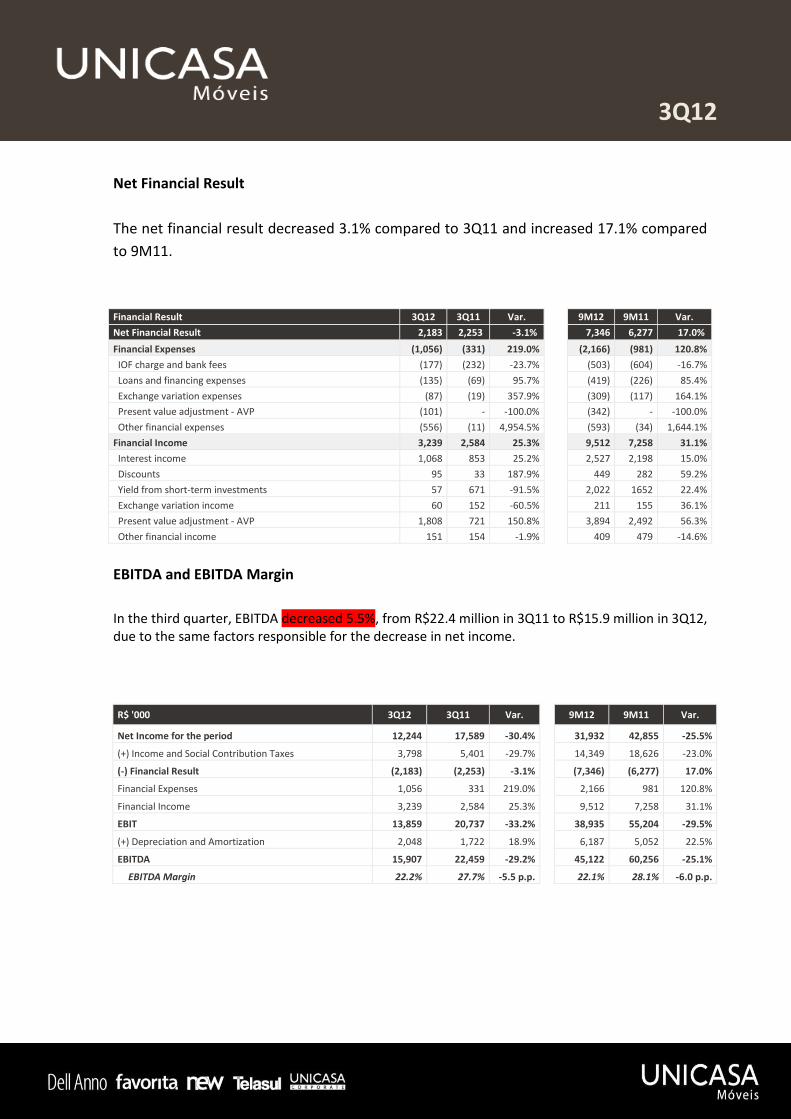
Net Financial Result
The net financial result decreased 3.1% compared to 3Q11 and increased 17.1% compared
to 9M11.
Financial Result 3Q12 3Q11 Var. 9M12 9M11 Var.
Net Financial Result 2,183 2,253 -3.1% 7,346 6,277 17.0%
Financial Expenses (1,056) (331) 219.0% (2,166) (981) 120.8%
IOF charge and bank fees (177) (232) -23.7% (503) (604) -16.7%
Loans and financing expenses (135) (69) 95.7% (419) (226) 85.4%
Exchange variation expenses (87) (19) 357.9% (309) (117) 164.1%
Present value adjustment - AVP (101) - -100.0% (342) - -100.0%
Other financial expenses (556) (11) 4,954.5% (593) (34) 1,644.1%
Financial Income 3,239 2,584 25.3% 9,512 7,258 31.1%
Interest income 1,068 853 25.2% 2,527 2,198 15.0%
Discounts 95 33 187.9% 449 282 59.2%
Yield from short-term investments 57 671 -91.5% 2,022 1652 22.4%
Exchange variation income 60 152 -60.5% 211 155 36.1%
Present value adjustment - AVP 1,808 721 150.8% 3,894 2,492 56.3%
Other financial income 151 154 -1.9% 409 479 -14.6%
EBITDA and EBITDA Margin
In the third quarter, EBITDA decreased 5.5%, from R$22.4 million in 3Q11 to R$15.9 million in 3Q12, due to the same factors responsible for the decrease in net income.
R$ '000 3Q12 3Q11 Var.
9M12 9M11 Var.
Net Income for the period 12,244 17,589 -30.4% 31,932 42,855 -25.5%
(+) Income and Social Contribution Taxes 3,798 5,401 -29.7% 14,349 18,626 -23.0%
(-) Financial Result (2,183) (2,253) -3.1% (7,346) (6,277) 17.0%
Financial Expenses 1,056 331 219.0% 2,166 981 120.8%
Financial Income 3,239 2,584 25.3% 9,512 7,258 31.1%
EBIT 13,859 20,737 -33.2% 38,935 55,204 -29.5%
(+) Depreciation and Amortization 2,048 1,722 18.9% 6,187 5,052 22.5%
EBITDA 15,907 22,459 -29.2% 45,122 60,256 -25.1%
EBITDA Margin 22.2% 27.7% -5.5 p.p. 22.1% 28.1% -6.0 p.p.

3Q12
EBITDA and EBITDA Margin (continued)
Net Cash At the end of 3Q12, the Company had net cash of R$14 million, increasing from the net debt of R$2.4 million in 2Q12. R$ '000 9/30/2012 9/30/2011 Var. 12/31/2011 *Var.
Short-Term Debt 5,127 1,857 176.1% 1,115 359.8%
Long-Term Debt 835 1,951 -57.2% 5,688 -85.3%
Gross Debt 5,962 3,808 56.6% 6,803 -12.4%
Cash and Cash Equivalents and Short-Term Investments 19,966 13,608 46.7% 12,454 60.3%
Net Debt/(Cash surplus) (14,004) (9,800) 42.9% (5,651) 147.8%
EBITDA (last 12 months) 63,897 82,529 -22.6% 80,445 -20.6%
Net Debt/EBITDA (last 12 months) (0.22) (0.12) 10.0% (0.07) 0.15
*Change in 12/31/2011 compared to 9/30/2012.
Return on Invested Capital (ROIC) ROIC in the quarter was 20.6%, down 14.7 p.p. from the same period last year.
R$ '000 3Q12 3Q11 Var.
EBIT (last 12 months) 57,109 75,872 -24.7%
Average of Operating Assets 196,179 156,285 25.5%
ROIC 29.1% 48.5% -19.4 p.p.
Effective Tax Rate (Income + Social Contribution) (LTM) -29.2% -27.2% -2.0 p.p.
ROIC, Net 20.6% 35.3% -14.7 p.p.
EBITDA 3T11 Receita líquida CPV Desp. Vendas Desp. Adm Outras receitas Depreciação EBITDA 3T12
22,5
9,5 5,2 4,6 1,6 3,6
0,3
15,9
3Q12
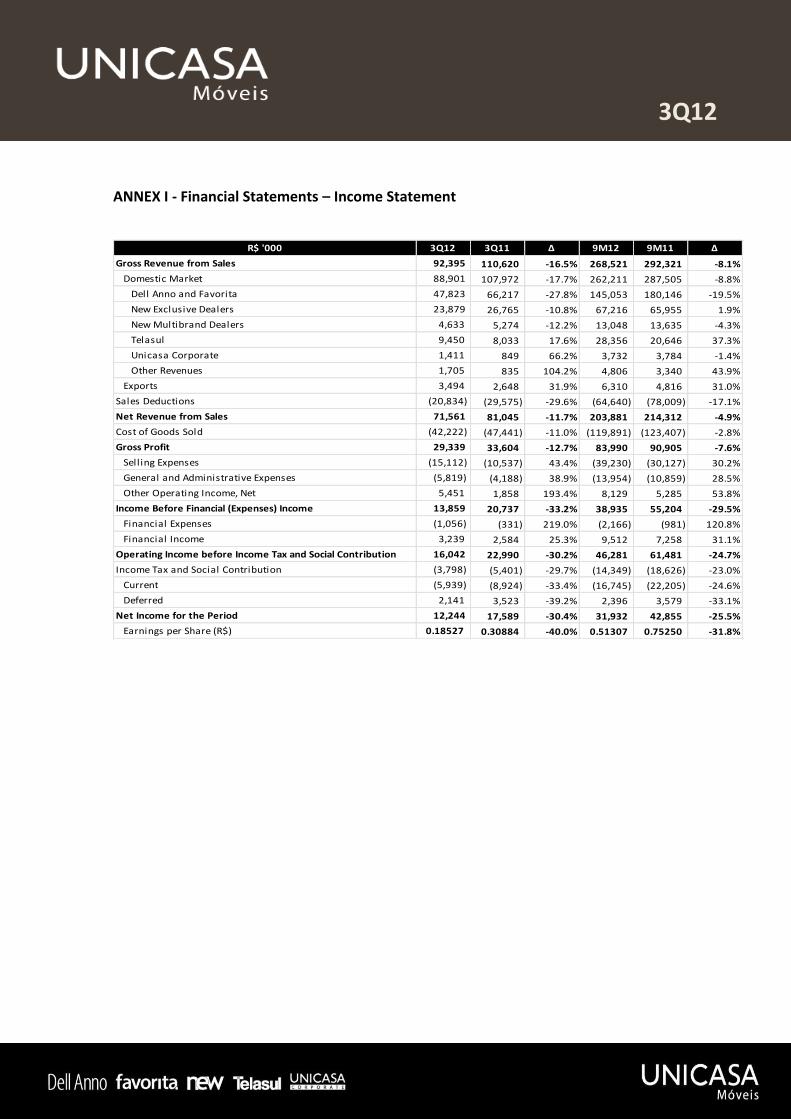
ANNEX I - Financial Statements – Income Statement
R$ '000 3Q12 3Q11 Δ 9M12 9M11 Δ
Gross Revenue from Sales 92,395 110,620 -16.5% 268,521 292,321 -8.1%
Domestic Market 88,901 107,972 -17.7% 262,211 287,505 -8.8%
Dell Anno and Favorita 47,823 66,217 -27.8% 145,053 180,146 -19.5%
New Exclusive Dealers 23,879 26,765 -10.8% 67,216 65,955 1.9%
New Multibrand Dealers 4,633 5,274 -12.2% 13,048 13,635 -4.3%
Telasul 9,450 8,033 17.6% 28,356 20,646 37.3%
Unicasa Corporate 1,411 849 66.2% 3,732 3,784 -1.4%
Other Revenues 1,705 835 104.2% 4,806 3,340 43.9%
Exports 3,494 2,648 31.9% 6,310 4,816 31.0%
Sales Deductions (20,834) (29,575) -29.6% (64,640) (78,009) -17.1%
Net Revenue from Sales 71,561 81,045 -11.7% 203,881 214,312 -4.9%
Cost of Goods Sold (42,222) (47,441) -11.0% (119,891) (123,407) -2.8%
Gross Profit 29,339 33,604 -12.7% 83,990 90,905 -7.6%
Selling Expenses (15,112) (10,537) 43.4% (39,230) (30,127) 30.2%
General and Administrative Expenses (5,819) (4,188) 38.9% (13,954) (10,859) 28.5%
Other Operating Income, Net 5,451 1,858 193.4% 8,129 5,285 53.8%
Income Before Financial (Expenses) Income 13,859 20,737 -33.2% 38,935 55,204 -29.5%
Financial Expenses (1,056) (331) 219.0% (2,166) (981) 120.8%
Financial Income 3,239 2,584 25.3% 9,512 7,258 31.1%
Operating Income before Income Tax and Social Contribution 16,042 22,990 -30.2% 46,281 61,481 -24.7%
Income Tax and Social Contribution (3,798) (5,401) -29.7% (14,349) (18,626) -23.0%
Current (5,939) (8,924) -33.4% (16,745) (22,205) -24.6%
Deferred 2,141 3,523 -39.2% 2,396 3,579 -33.1%
Net Income for the Period 12,244 17,589 -30.4% 31,932 42,855 -25.5%
Earnings per Share (R$) 0.18527 0.30884 -40.0% 0.51307 0.75250 -31.8%
3Q12
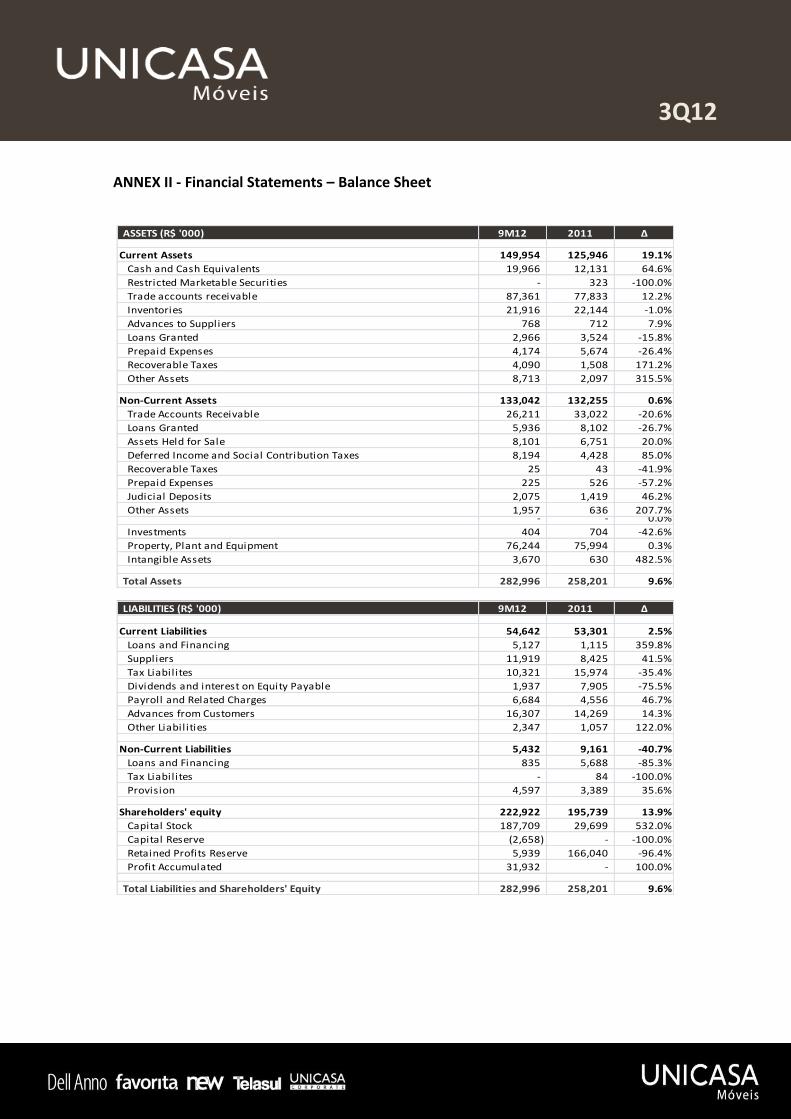
ANNEX II - Financial Statements – Balance Sheet
ASSETS (R$ '000) 9M12 2011 Δ
Current Assets 149,954 125,946 19.1%
Cash and Cash Equivalents 19,966 12,131 64.6%
Restricted Marketable Securities - 323 -100.0%
Trade accounts receivable 87,361 77,833 12.2%
Inventories 21,916 22,144 -1.0%
Advances to Suppliers 768 712 7.9%
Loans Granted 2,966 3,524 -15.8%
Prepaid Expenses 4,174 5,674 -26.4%
Recoverable Taxes 4,090 1,508 171.2%
Other Assets 8,713 2,097 315.5%
Non-Current Assets 133,042 132,255 0.6%
Trade Accounts Receivable 26,211 33,022 -20.6%
Loans Granted 5,936 8,102 -26.7%
Assets Held for Sale 8,101 6,751 20.0%
Deferred Income and Social Contribution Taxes 8,194 4,428 85.0%
Recoverable Taxes 25 43 -41.9%
Prepaid Expenses 225 526 -57.2%
Judicial Deposits 2,075 1,419 46.2%
Other Assets 1,957 636 207.7%- - 0.0%
Investments 404 704 -42.6%
Property, Plant and Equipment 76,244 75,994 0.3%
Intangible Assets 3,670 630 482.5%
Total Assets 282,996 258,201 9.6%
LIABILITIES (R$ '000) 9M12 2011 Δ
Current Liabilities 54,642 53,301 2.5%
Loans and Financing 5,127 1,115 359.8%
Suppliers 11,919 8,425 41.5%
Tax Liabilites 10,321 15,974 -35.4%
Dividends and interest on Equity Payable 1,937 7,905 -75.5%
Payroll and Related Charges 6,684 4,556 46.7%
Advances from Customers 16,307 14,269 14.3%
Other Liabilities 2,347 1,057 122.0%
Non-Current Liabilities 5,432 9,161 -40.7%
Loans and Financing 835 5,688 -85.3%
Tax Liabilites - 84 -100.0%
Provision 4,597 3,389 35.6%
Shareholders' equity 222,922 195,739 13.9%
Capital Stock 187,709 29,699 532.0%
Capital Reserve (2,658) - -100.0%
Retained Profits Reserve 5,939 166,040 -96.4%
Profit Accumulated 31,932 - 100.0%
Total Liabilities and Shareholders' Equity 282,996 258,201 9.6%

3Q12
ANNEX III - Financial Statements – Cash Flow Statement
R$ '000 3Q12 3Q11 Δ 9M12 9M11 ΔCash Flows from Operating Activities
Operating Income Before Income And Social Contribution Taxes 16,042 22,990 -30.2% 46,281 61,481 -24.7%
- - - -
Adjustment to Reconcile the Net Income to Cash from Operating Activities:
Depreciation and Amortization 2,048 1,722 18.9% 6,187 5,052 22.5%
Foreing Exchange Variation 80 (151) -153.0% 223 (182) -222.5%
Interest Apropriation 135 69 95.7% 419 226 85.4%
Provision for Litigation 431 1,371 -68.6% 1,208 1,150 5.0%
Provision for Obsolescence 44 617 -92.9% (459) 468 -198.1%
Allowance for Doubtful Accounts 594 (585) -201.5% 2,341 330 609.4%
- - 0.0% 2,468 - 100.0%
Disposal of Property, Plant and Equipment 1 158 -99.4% 94 170 -44.7%
19,375 26,191 -26.0% 58,762 68,695 -14.5%
Changes in Assets and Liabilities
Trade Accounts Receivable 6,114 (10,623) -157.6% (5,130) (13,839) -62.9%
Inventories 840 (4,694) -117.9% 687 (5,264) -113.1%
Recoverable Taxes (1,351) (1,847) -26.9% (2,564) (1,866) 37.4%
Restricted Short -Term Investiments - (9) -100.0% 323 (25) 1.392%
Loans Grandet 1,605 (2,648) -160.6% 2,724 (1,547) -276.1%
Prepaid Expenses 2,168 646 235.6% 1,801 (361) -598.9%
(4,197) 47 (11,117) (3,459)
Non-Current Assets Available for Sale - - 0.0% (1,350) - 100.0%
Suppliers (499) 1,426 -135.0% 2,816 6,345 -55.6%
(790) 1,136 2,038 4,252
Tax Liabilities 114 (216) -152.8% (1,361) (2,462) -44.7%
1,908 1,835 3,418 3,064
Other Accounts Receivable (4,469) (4,485) -0.4% (21,122) (21,268) -0.7%
Net Cash from Operating Activities 20,818 6,759 208.0% 29,925 32,265 -7.3%
Cash Flows from Investing Activities
Property, Plant and Equipment (1,975) (10,209) -80.7% (5,837) (21,365) -72.7%
Intangible Assets (656) (30) 2.086,7% (2,907) (99) 2.836,4%
Net Cash used in Investing Activities (2,631) (10,239) -74.3% (8,744) (21,464) -59.3%
Cash Flows from Financing Activities
Capital Increases - - 0.0% 127,909 - 0.0%
Spending on issue of shares - - 0.0% (4,027) - 0.0%
Loan and Interest Payments (417) (348) 19.8% (1,260) (1,620) -22.2%
Payment of Interest on Shareholders' Equity (1,642) (199) 725.1% (5,968) (5,780) 3.3%
Dividends Paid (129,700) (10,000) 1.197,0% (130,000) (11,155) 1.065,4% Cash Flows (used in) from Financing Activities (131,759) (9,806) 1.243,7% (13,346) (17,814) -25.1%
Increase (Decrease) in Cash and Cash Equivalents (113,572) (13,286) 754.8% 7,835 (7,013) -211.7%
Changes in Cash and Cash Equivalents
At the Beginning of the Period 133,538 26,894 396.5% 12,131 20,621 -41.2%
At the End of the Period 19,966 13,608 46.7% 19,966 13,608 46.7%
Increase (Decrease) in Cash and Cash Equivalents (113,572) (13,286) 754.8% 7,835 (7,013) -211.7%

3Q12
ANNEX IV – Gross Revenue, Gross Revenue ex-IPI and Modules Sold
R$ '000 1Q12 1Q11 2Q12 2Q11 3Q12 3Q11 6M12 6M11 9M12 9M11
Gross Revenue from Sales 89,173 88,571 86,953 93,130 92,395 110,620 176,126 181,701 268,521 292,321
Domestic Market 88,131 87,459 85,180 92,075 88,901 107,972 173,311 179,534 262,211 287,505
Dell Anno and Favorita 51,311 55,458 45,919 58,472 47,823 66,217 97,230 113,930 145,053 180,146
New Exclusive Dealers 21,575 18,282 21,762 20,908 23,879 26,765 43,337 39,190 67,216 65,955
New Multibrand Dealers 4,341 3,940 4,074 4,421 4,633 5,274 8,415 8,361 13,048 13,635
Telasul 8,540 6,770 10,366 5,843 9,450 8,033 18,906 12,613 28,356 20,646
Unicasa Corporate 1,329 1,637 992 1,299 1,411 849 2,321 2,936 3,732 3,784
Other Revenues 1,035 1,372 2,067 1,132 1,705 835 3,102 2,504 4,806 3,340
Export Market 1,042 1,112 1,773 1,055 3,494 2,648 2,815 2,167 6,310 4,816
R$ '000 1Q12 1Q11 2Q12 2Q11 3Q12 3Q11 6M12 6M11 9M12 9M11
Gross Revenue from Sales (ex-IPI) 85,593 84,392 86,837 88,703 92,278 105,495 172,430 173,095 264,709 278,592
Domestic Market 84,551 83,280 85,064 87,648 88,784 102,847 169,615 170,928 258,399 273,776
Dell Anno and Favorita 49,200 52,867 45,884 55,724 47,783 63,107 95,084 108,591 142,867 171,698
New Exclusive Dealers 20,726 17,427 21,752 19,936 23,848 25,520 42,478 37,363 66,326 62,883
New Multibrand Dealers 4,167 3,753 4,074 4,213 4,626 5,023 8,241 7,966 12,867 12,990
Telasul 8,184 6,445 10,363 5,554 9,436 7,651 18,547 11,999 27,983 19,650
Unicasa Corporate 1,277 1,559 991 1,237 1,411 808 2,268 2,796 3,679 3,603
Other Revenues 997 1,229 2,000 984 1,680 738 2,997 2,213 4,677 2,952
Export Market 1,042 1,112 1,773 1,055 3,494 2,648 2,815 2,167 6,310 4,816
Units 1Q12 1Q11 2Q12 2Q11 3Q12 3Q11 6M12 6M11 9M12 9M11
UEPS Sold 390,841 379,043 407,734 390,159 443,172 477,048 798,575 769,202 1,241,747 1,246,250
Domestic Market 381,466 364,597 395,322 378,752 410,016 437,834 776,788 743,348 1,186,805 1,181,183
Dell Anno and Favorita 179,389 183,918 169,216 197,904 171,477 220,551 348,605 381,821 520,081 602,372
New Exclusive Dealers 109,187 93,907 112,736 103,727 128,130 126,475 221,924 197,634 350,054 324,108
New Multibrand Dealers 22,884 20,580 21,845 21,379 25,710 25,236 44,729 41,959 70,438 67,195
Telasul 61,658 52,881 81,611 43,676 70,323 58,038 143,268 96,557 213,592 154,594
Unicasa Corporate 5,602 8,944 4,062 5,926 7,048 3,845 9,664 14,870 16,712 18,715
Other Revenues 2,747 4,368 5,853 6,140 7,328 3,690 8,600 10,508 15,927 14,198
Export Market 9,375 14,446 12,412 11,408 33,156 39,213 21,787 25,853 54,943 65,067
DISCLAIMER
The forward-looking statements in this document related to the business prospects, projections of operating and
financial results and growth prospects of Unicasa are merely estimates and as such are based exclusively on
Management’s expectations for the future of the business. These expectations depend substantially on market
conditions, the performance of the Brazilian economy, of the industry and of international markets, and are
subject to known and unknown risks and uncertainties, which can cause such expectations not to materialize or
cause actual results to differ materially from those expected and, therefore, are subject to change without prior
notice.