3Q 2016 Financial Results - listed...
28
19 October 2016 3Q 2016 Financial Results
Transcript of 3Q 2016 Financial Results - listed...

19 October 2016
3Q 2016 Financial Results

3Q16 Highlights
2

High demand for data and unmatched customer experience drive financial momentum
Network improvements
drives lower complaints
3Q15 4Q15 1Q16 2Q16 3Q16
60% customer interactions on
digital and self-care platforms
89% 89% 89% 87% 90%
3Q15 4Q15 1Q16 2Q16 3Q16
3Q15 4Q15 1Q16 2Q16 3Q16
2x traffic growth;
Hotspots under control
2x traffic
growth
>16%
reduction
Consistent 4G LTE data
download speed
Solid Q-o-Q momentum
• +2.8% service revenue
• +6.6% prepaid revenue
• +13.2% EBITDA
• +22.1% PAT
3
90% first contact resolutions across
all customer service touch points
Hotspots
YTD 2016
47% 50% 53% 59% 60%
3Q15 4Q15 1Q16 2Q16 3Q16

Financial review
4

11,956 11,579 11,164 11,015 10,903
3Q15 4Q15 1Q16 2Q16 3Q16
• Service revenue improvement from strong prepaid performance; postpaid stable
• New plans launched in previous quarters driving revenue traction; more to come
• More data propositions supporting ARPU; mitigating voice and SMS usage decline
Good revenue momentum
53 54 55 54 56
Blended ARPU (RM/mth)
Total RGS and Blended ARPU Service Revenue (RM mn)
5
Subscriptions (‘000)
2,154 2,055 2,113
6,365 6,290
3Q15 2Q16 3Q16 9M15 9M16
-1.2%
-1.9%
+2.8%
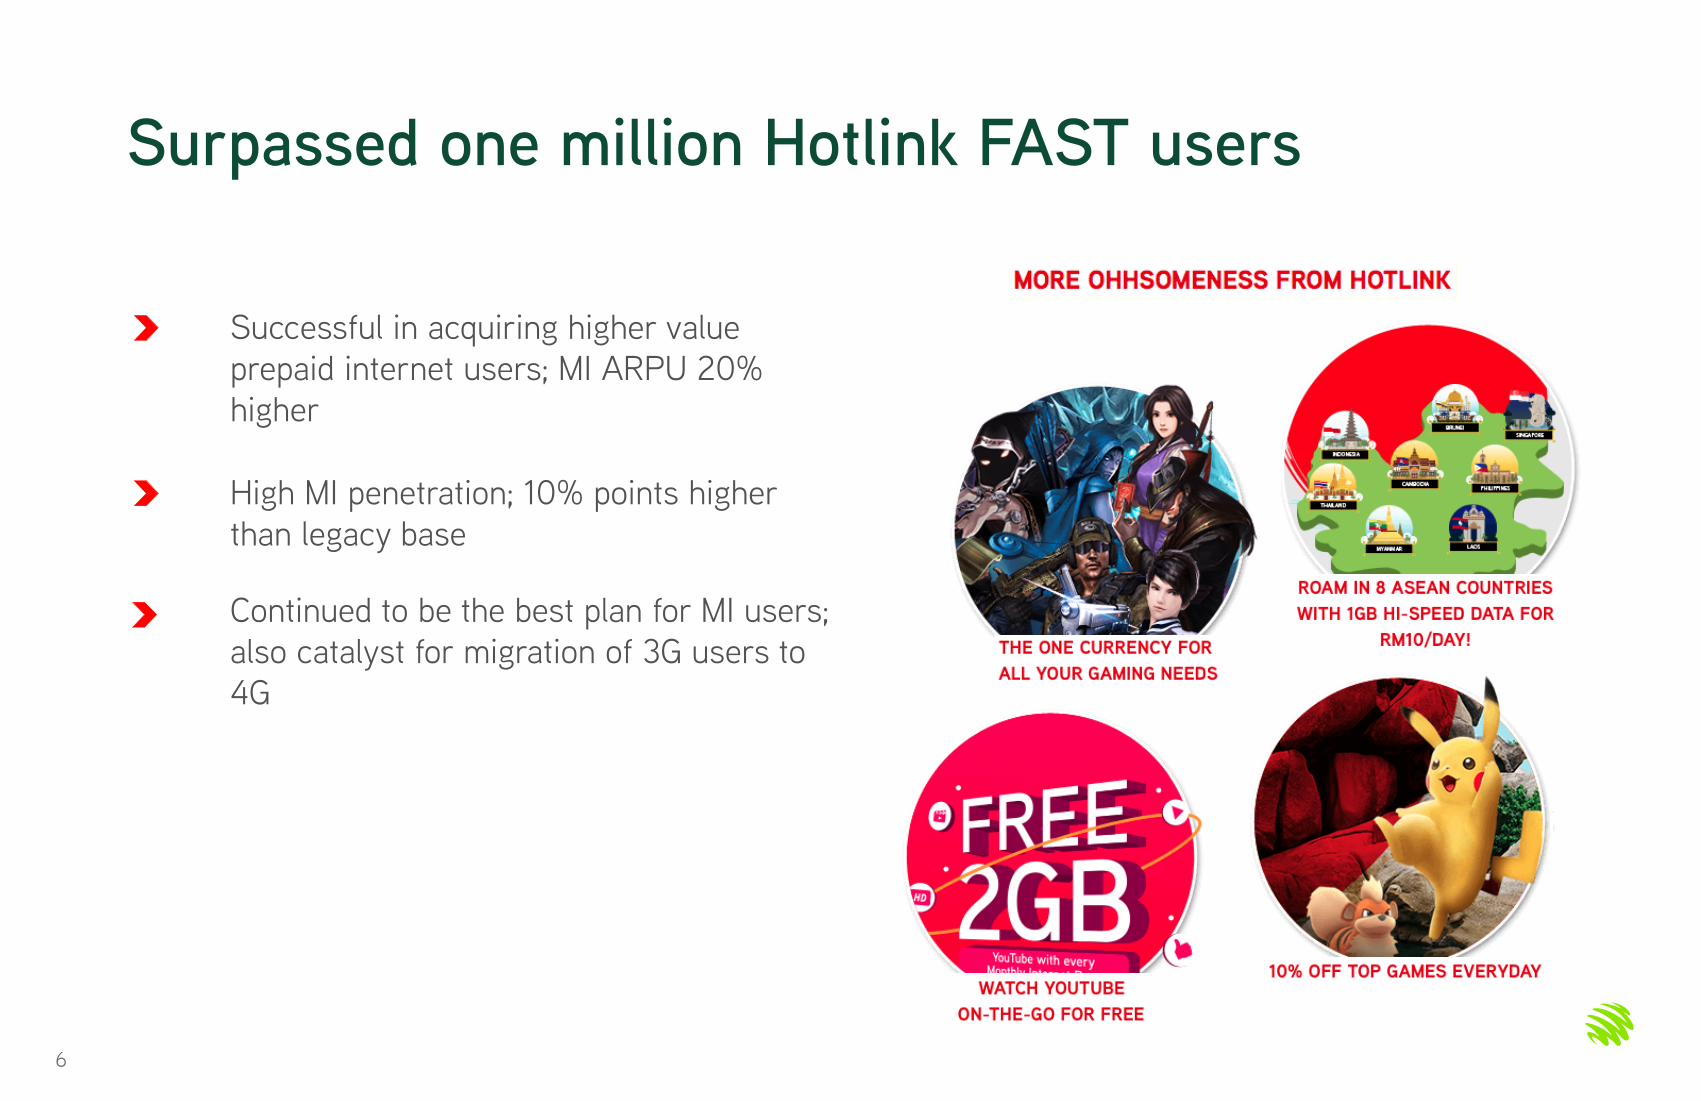
Surpassed one million Hotlink FAST users
Successful in acquiring higher value
prepaid internet users; MI ARPU 20%
higher
High MI penetration; 10% points higher
than legacy base
Continued to be the best plan for MI users;
also catalyst for migration of 3G users to
4G
6

8,850 8,520 8,196 8,108 8,007
3Q15 4Q15 1Q16 2Q16 3Q16
1,074 959 1,022
3,135 2,994
3Q15 2Q16 3Q16 9M15 9M16
Prepaid Revenue (RM mn)
Strong MI ARPU drives good revenue momentum
+6.6%
-4.8%
39 39 39 38 41
Prepaid RGS and ARPU
RGS30 Subscriptions (‘000) Prepaid ARPU (RM/mth)
• RGS traction improving towards end quarter
• Hotlink FAST attracting high MI ARPU users; MI penetration approaching 55%
• Stable contribution from foreign worker segment; focus on growing MI users for better wallet
share and profitability
7
-4.5%
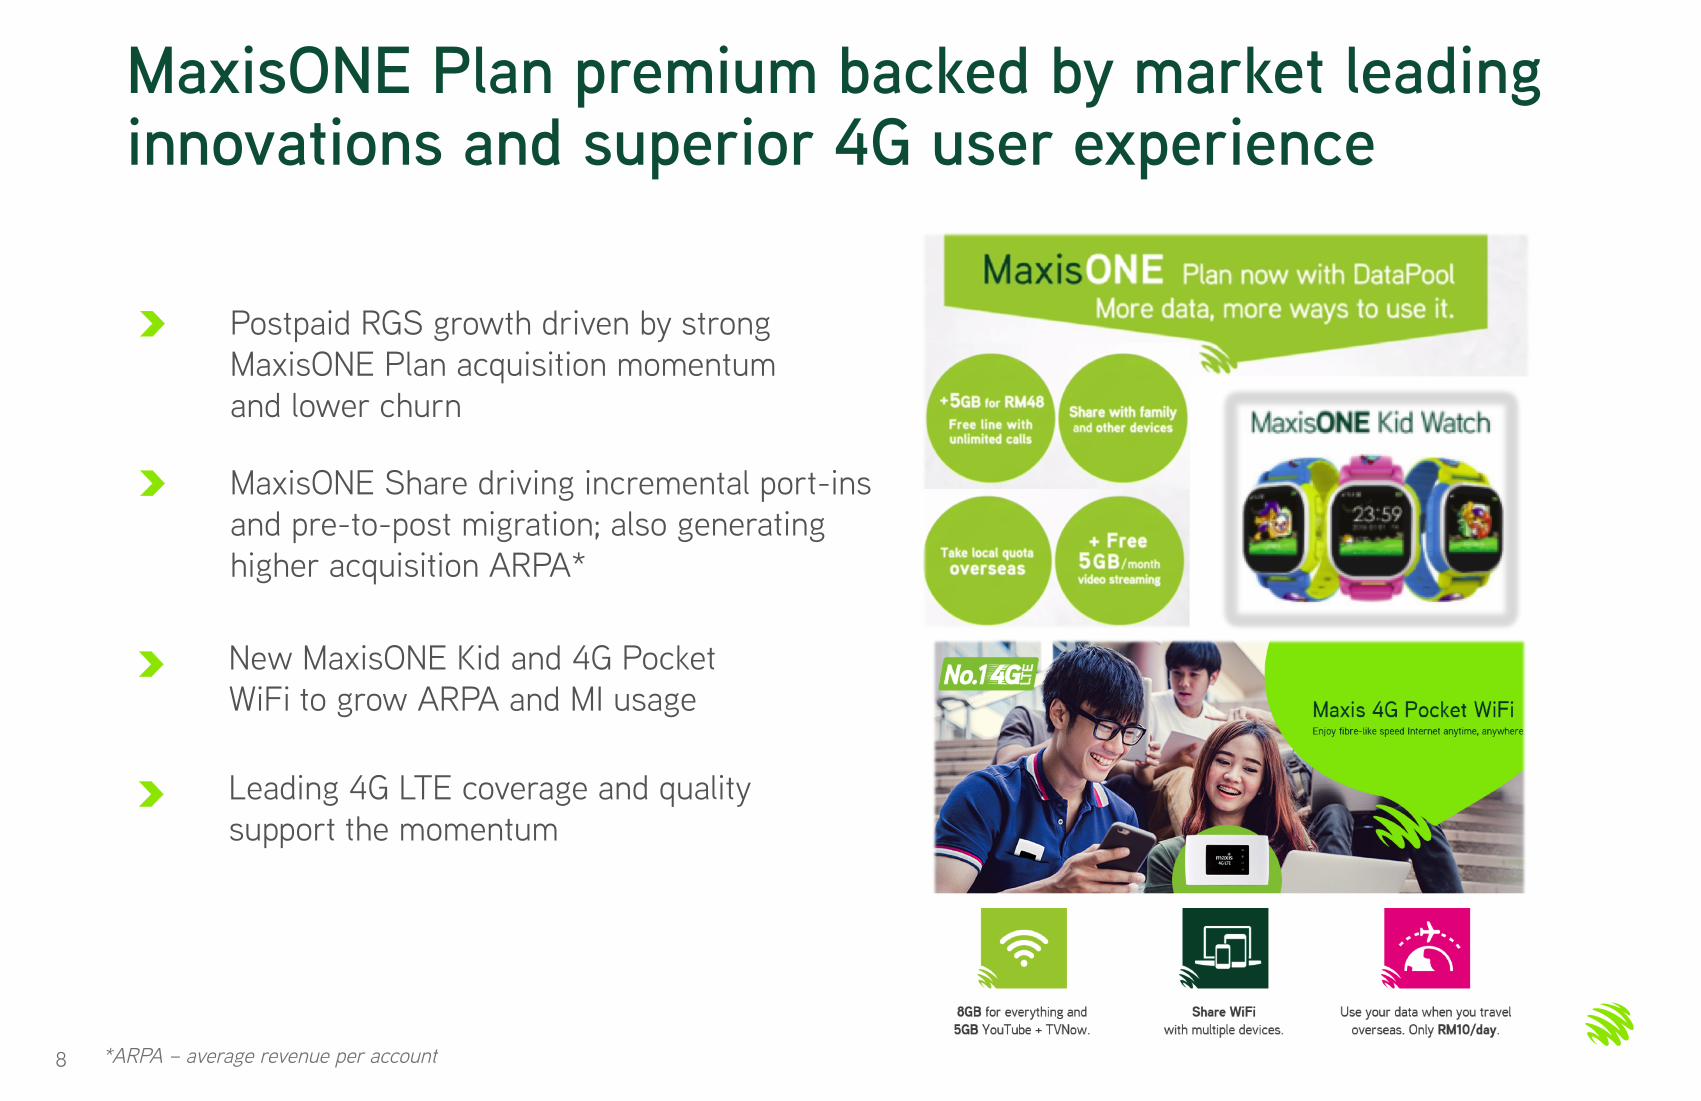
MaxisONE Plan premium backed by market leading innovations and superior 4G user experience
Postpaid RGS growth driven by strong
MaxisONE Plan acquisition momentum
and lower churn
MaxisONE Share driving incremental port-ins
and pre-to-post migration; also generating
higher acquisition ARPA*
8
New MaxisONE Kid and 4G Pocket
WiFi to grow ARPA and MI usage
*ARPA – average revenue per account
Leading 4G LTE coverage and quality
support the momentum

2,784 2,765 2,696 2,660 2,678
3Q15 4Q15 1Q16 2Q16 3Q16
972 975 960
2,914 2,927
3Q15 2Q16 3Q16 9M15 9M16
Postpaid Revenue (RM mn)
MaxisONE Plan subscriptions approaching 1.5 million
-1.2%
-1.5%
98 102 102 102 100
Postpaid RGS and ARPU
• Added 18k new subscriptions this quarter; strong pick-up in subscribers with new device contracts
• MaxisONE Plan subscriptions approaching 1.5 million, ARPU at RM129/month
• Bundled revenue now at 67% of total postpaid revenue
9
+0.4%
RGS30 Subscriptions (‘000) Postpaid ARPU (RM/mth)
636 813 962 1,292 1,492
MaxisONE Plan Subscriptions (‘000)

316 333 249
669 741
3Q15 2Q16 3Q16 9M15 9M16
Capex (RM mn)
Differentiated LTE experience; leadership in network quality
• Leading 4G LTE pop coverage nationwide; at 88% on comparable peer basis
• 2x traffic growth; maintained consistent network quality
10
4G devices
4G average data usage
3Q15
2.4 million 4.2 million
2.3GB/mth 4.4GB/mth
* 4G population coverage based on stringent -98dBm quality criteria; comparable peer basis pop coverage at 88%
Network modernisation 83%
3Q16
93%
Pop coverage: 2G
3G
4G*
95%
91%
55%
96%
94%
81%

71% 72% 71% 70% 72%
3Q15 4Q15 1Q16 2Q16 3Q16
1.26 1.44 1.55
2.00
2.60
1.72 1.88 1.93
2.95
3.67
65% 67% 67% 68% 72%
75% 76% 77% 80% 81%
3Q15 4Q15 1Q16 2Q16 3Q16 3Q15 4Q15 1Q16 2Q16 3Q16
2G 3G 4G
>3x LTE traffic growth; average data usage at 4.4 GB/month
45 50 52 64 83
Growing data usage Higher smart-phone penetration Increasing 4G LTE traffic
Prepaid (GB/mth) Mobile Internet
Penetration
Postpaid (GB/mth) Postpaid Prepaid Data Traffic (‘000 TB)
11
1,111 1,006 1,139
3,304 3,301
3Q15 2Q16 3Q16 9M15 9M16
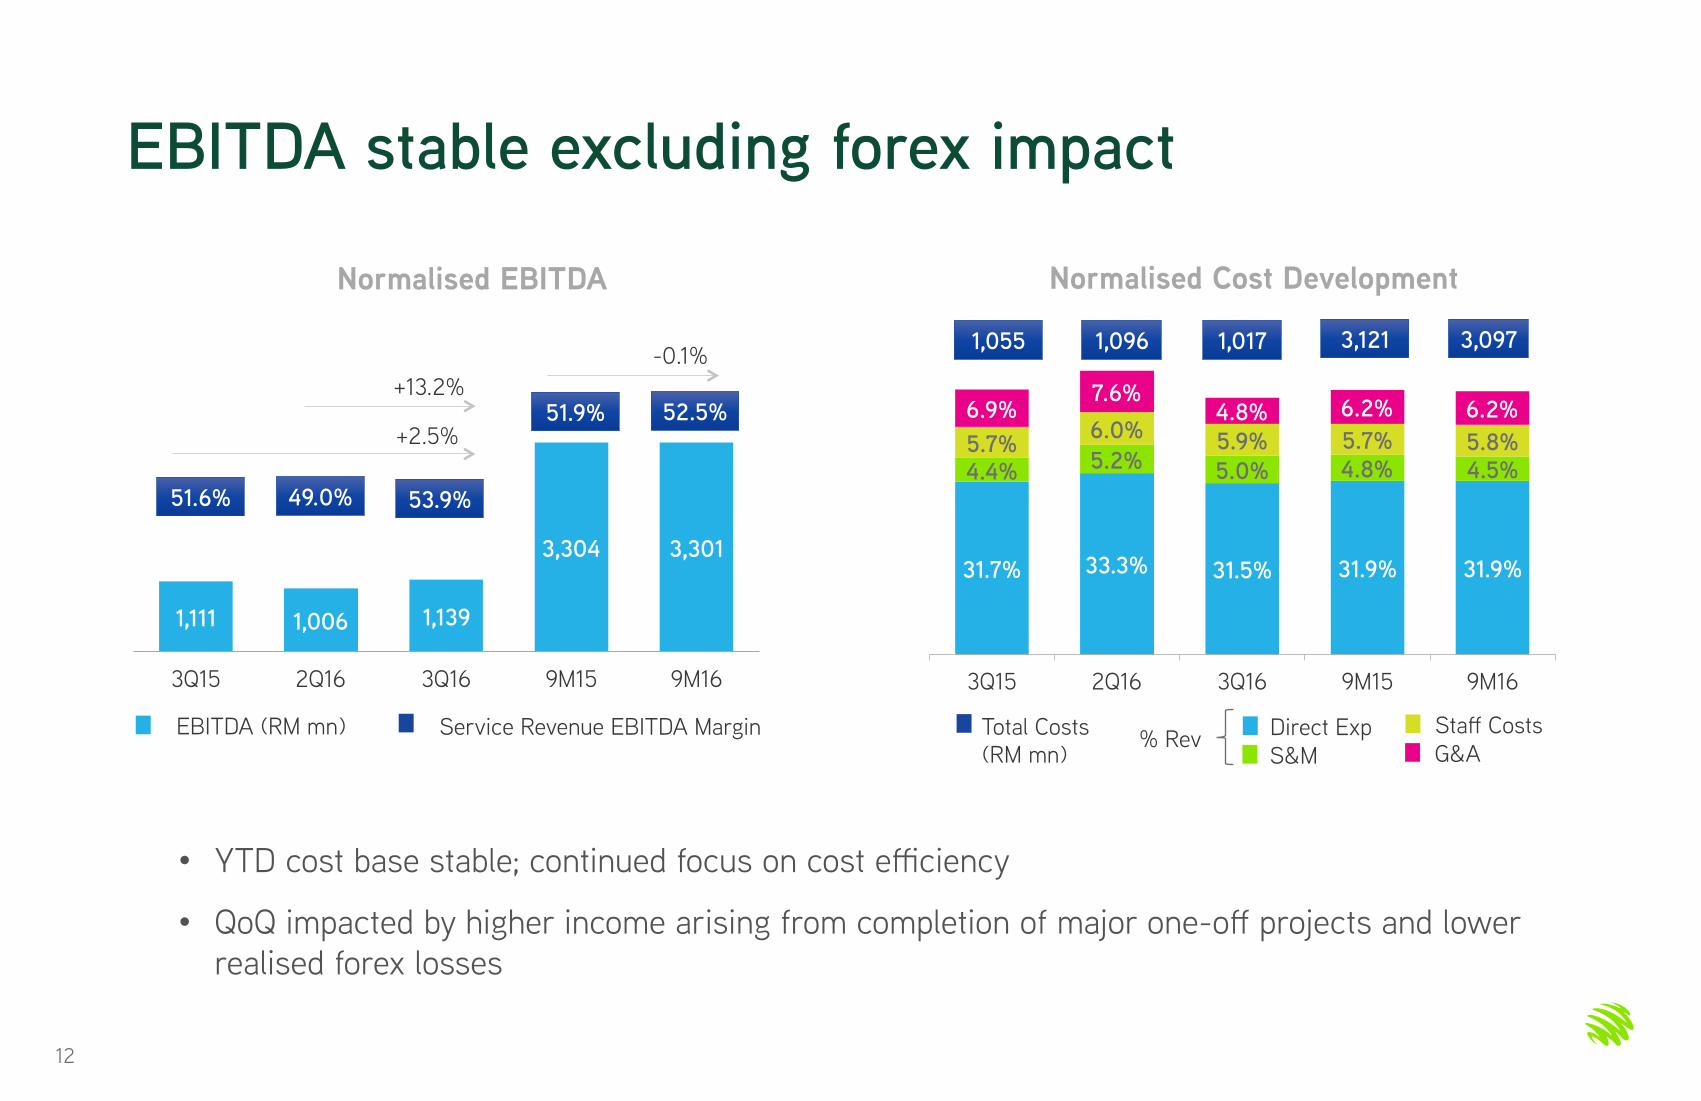
EBITDA stable excluding forex impact
-0.1%
+2.5%
51.6% 49.0% 53.9%
EBITDA (RM mn) Service Revenue EBITDA Margin
Normalised Cost Development Normalised EBITDA
• YTD cost base stable; continued focus on cost efficiency
• QoQ impacted by higher income arising from completion of major one-off projects and lower
realised forex losses
31.7% 33.3% 31.5% 31.9% 31.9%
4.4% 5.2% 5.0% 4.8% 4.5% 5.7%
6.0% 5.9% 5.7% 5.8%
6.9% 7.6%
4.8% 6.2% 6.2%
3Q15 2Q16 3Q16 9M15 9M16
1,055 1,096 1,017
12
51.9% 52.5% +13.2%
3,121 3,097
Total Costs
(RM mn) S&M G&A Direct Exp Staff Costs
% Rev

27 8 4
140
21
3Q15 2Q16 3Q16 9M15 9M16
510 421 514
1,483 1,419
3Q15 2Q16 3Q16 9M15 9M16
Profit after Tax
-4.3%
+0.8%
Accelerated Depreciation (RM mn) Normalised Profit after Tax (RM mn)
• YTD PAT excludes RM71 million Home-related contract obligations reversal and asset impairment,
RM34 million unrealised forex gains (YTD15: RM101 million unrealised forex losses) and RM16
million accelerated depreciation net of tax (YTD15: RM105 million)
• YTD lower accelerated depreciation reflecting near completion of network modernisation
13
+22.1%

Summary: Positive trajectory; guidance reiterated
Service revenue, absolute EBITDA and
base capex at similar levels to FY2015
Business overview Guidance
14
Operational drivers stabilised; solid 3Q
Strengthen product innovation &
differentiation, more to come
Continuous investment in best 4G LTE
connectivity and digital experience
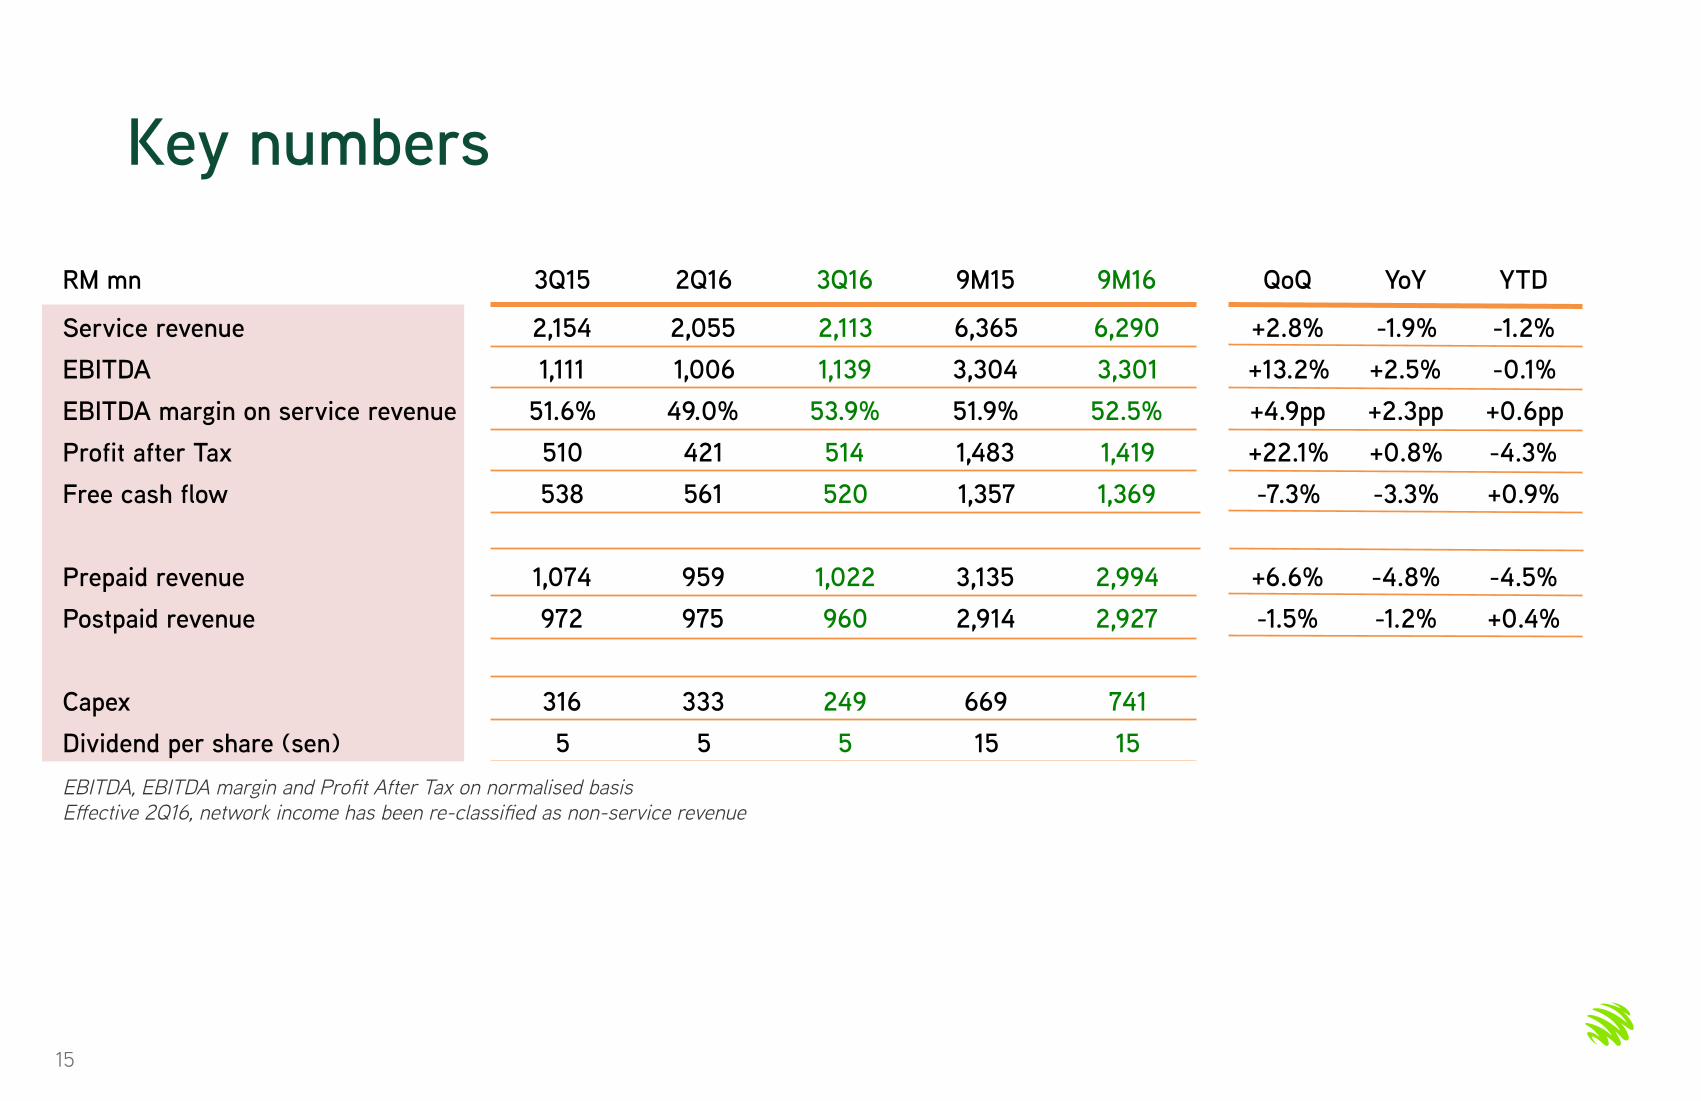
Key numbers
EBITDA, EBITDA margin and Profit After Tax on normalised basis
Effective 2Q16, network income has been re-classified as non-service revenue
RM mn 3Q15 2Q16 3Q16 9M15 9M16 QoQ YoY YTD
Service revenue 2,154 2,055 2,113 6,365 6,290 +2.8% -1.9% -1.2% EBITDA 1,111 1,006 1,139 3,304 3,301 +13.2% +2.5% -0.1% EBITDA margin on service revenue 51.6% 49.0% 53.9% 51.9% 52.5% +4.9pp +2.3pp +0.6pp Profit after Tax 510 421 514 1,483 1,419 +22.1% +0.8% -4.3% Free cash flow 538 561 520 1,357 1,369 -7.3% -3.3% +0.9%
Prepaid revenue 1,074 959 1,022 3,135 2,994 +6.6% -4.8% -4.5% Postpaid revenue 972 975 960 2,914 2,927 -1.5% -1.2% +0.4%
Capex 316 333 249 669 741 Dividend per share (sen) 5 5 5 15 15
15

Q & A
16
Disclaimer This presentation by Maxis Berhad (“Maxis”) contains forward-looking statements. Forward-looking statements can be identified
by the use of forward-looking terminology such as the words “may”, “will”, “would”, “could”, “believe”, “expect”, “anticipate”,
“intend”, “estimate”, “aim”, “plan”, “forecast” or similar expressions and include all statements that are not historical facts.
Forward-looking statements made in this presentation involve known and unknown risks, uncertainties and other factors which
may cause actual future performance, outcomes and results to differ materially from those expressed or implied in such forward-
looking statements. Such forward-looking statements are based on numerous assumptions and reflect Maxis’ current views with
respect to future events and are not a guarantee of future performance. Maxis cannot give any assurance that such forward-
looking statements will be realized.
Factors which could affect actual future performance, outcomes and results include (without limitation) general industry and
economic conditions, interest rate trends, cost of capital and capital availability, availability of real estate properties, competition
from other companies and avenues for the sale/distribution of goods and services, shifts in customer demands, customers and
partners, changes in operating expenses, including employee wages, benefits and training, governmental and public policy
changes and the continued availability of financing in the amounts and the terms necessary to support future business.
Forward-looking statements made in this presentation are made only as at the date of this presentation and Maxis and its
subsidiaries, affiliates, representatives and advisers expressly disclaim any obligation or undertaking to release, publicly or
otherwise, any updates or revisions to any such forward-looking statements to reflect any change in Maxis’ expectations, new
information, future events, change in conditions or circumstances or otherwise.
This presentation has been prepared by Maxis. The information in this presentation, including forward-looking statements, has
not been independently verified. Without limiting any of the foregoing in this disclaimer, no representation or warranty, express
or implied, is made as to, and no reliance should be placed on, the fairness, accuracy or completeness of such information. Maxis
and its subsidiaries, affiliates, representatives and advisers shall have no liability whatsoever (whether in negligence or
otherwise) for any loss, damage, costs or expenses howsoever arising out of or in connection with this presentation.
17

Thank you
18

19
Appendices
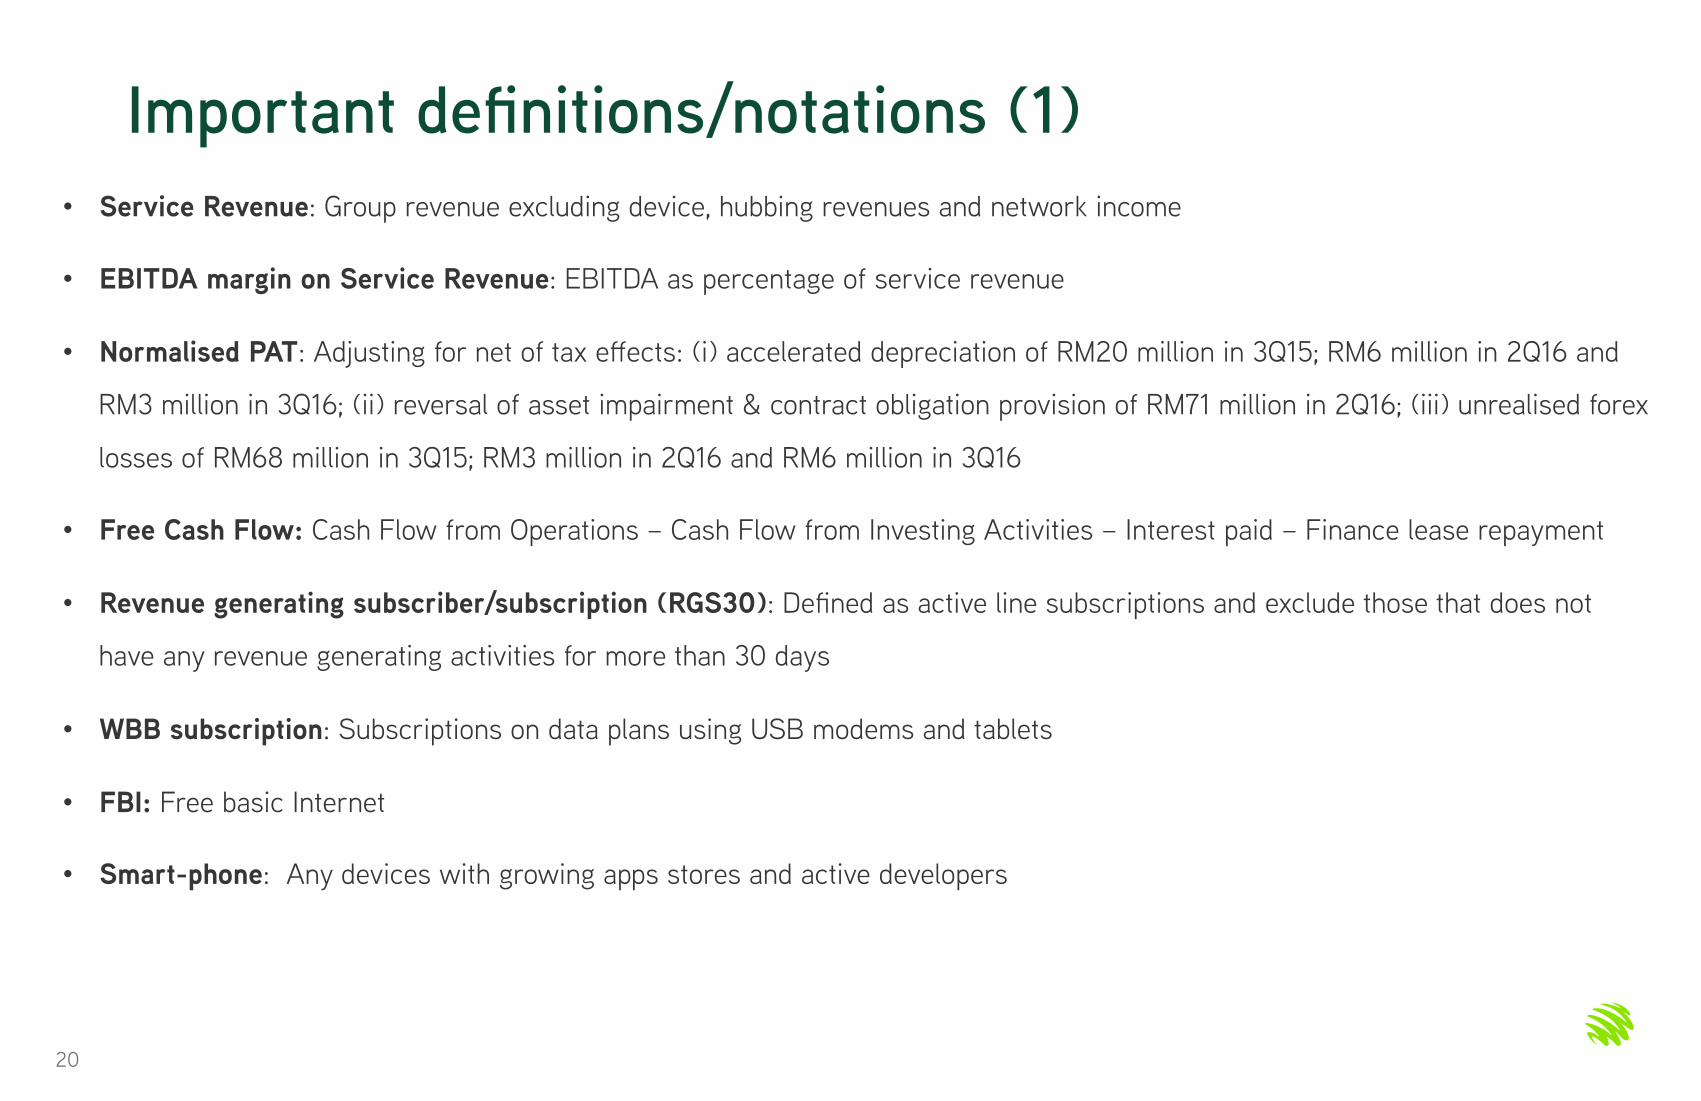
Important definitions/notations (1)
• Service Revenue: Group revenue excluding device, hubbing revenues and network income
• EBITDA margin on Service Revenue: EBITDA as percentage of service revenue
• Normalised PAT: Adjusting for net of tax effects: (i) accelerated depreciation of RM20 million in 3Q15; RM6 million in 2Q16 and
RM3 million in 3Q16; (ii) reversal of asset impairment & contract obligation provision of RM71 million in 2Q16; (iii) unrealised forex
losses of RM68 million in 3Q15; RM3 million in 2Q16 and RM6 million in 3Q16
• Free Cash Flow: Cash Flow from Operations – Cash Flow from Investing Activities – Interest paid – Finance lease repayment
• Revenue generating subscriber/subscription (RGS30): Defined as active line subscriptions and exclude those that does not
have any revenue generating activities for more than 30 days
• WBB subscription: Subscriptions on data plans using USB modems and tablets
• FBI: Free basic Internet
• Smart-phone: Any devices with growing apps stores and active developers
20
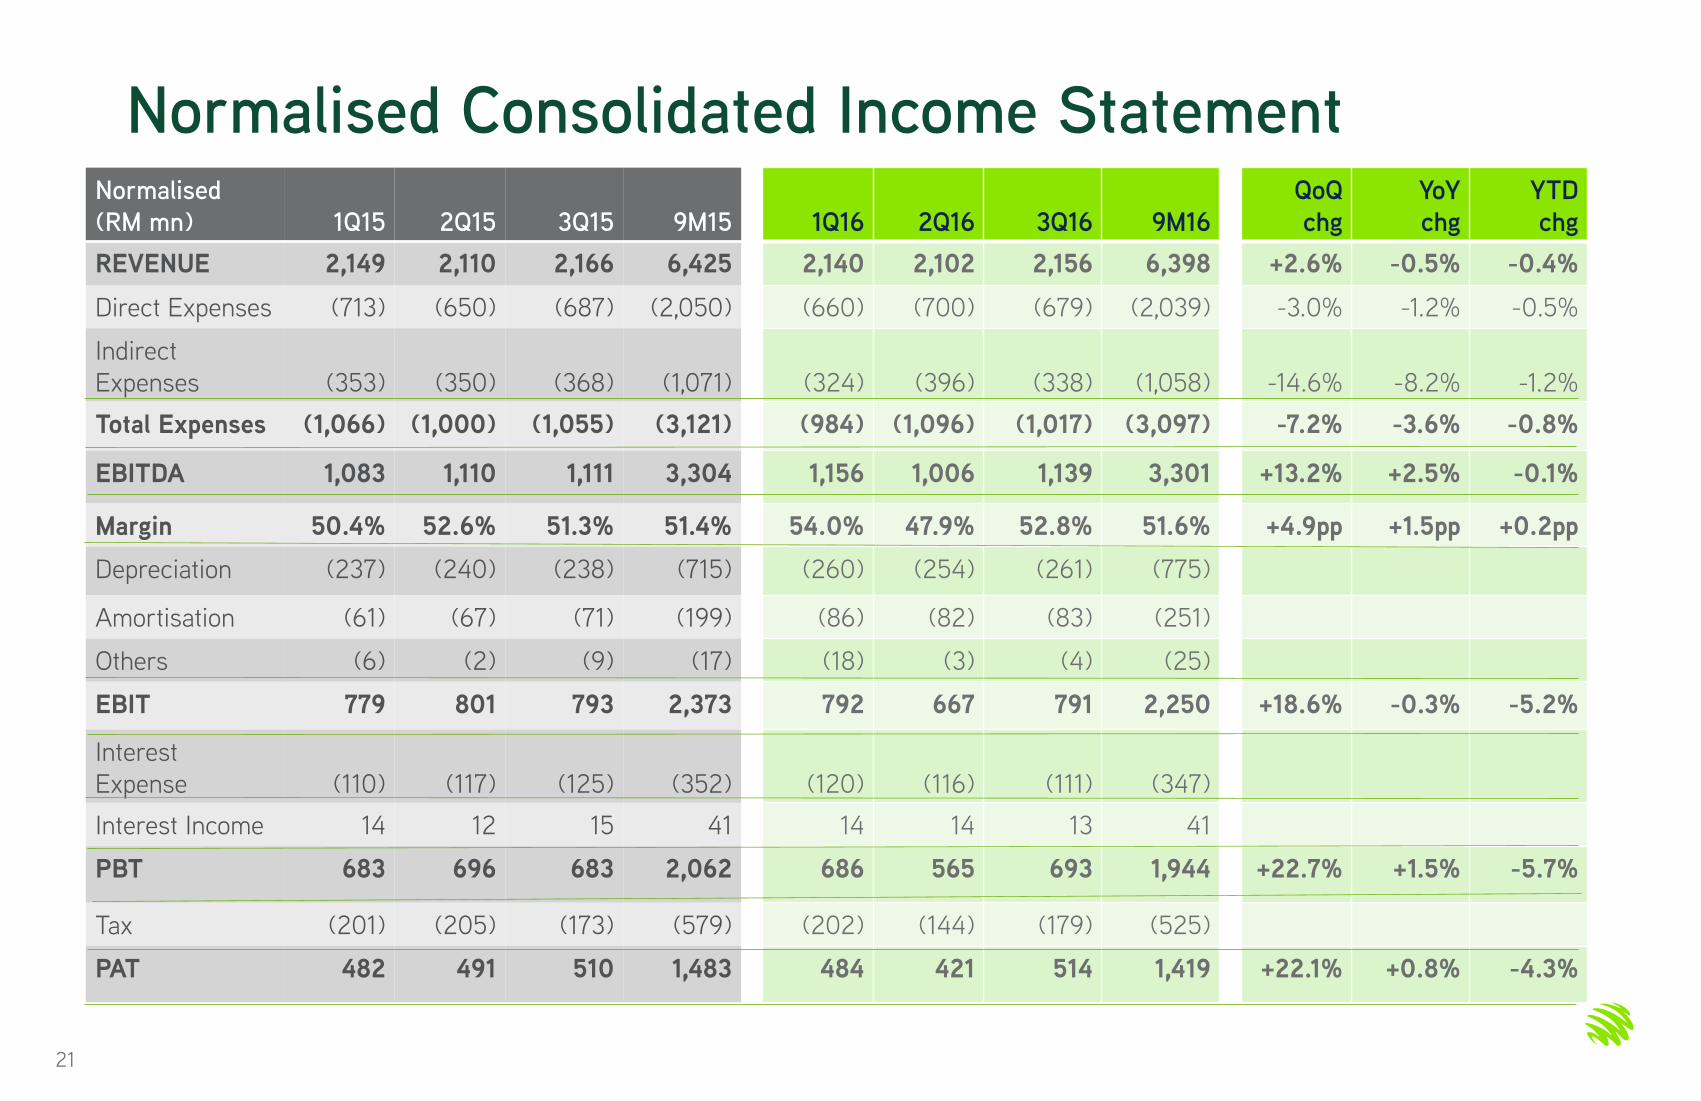
Normalised Consolidated Income Statement Normalised
(RM mn)
1Q15
2Q15
3Q15
9M15
REVENUE 2,149 2,110 2,166 6,425
Direct Expenses (713) (650) (687) (2,050)
Indirect
Expenses
(353)
(350)
(368)
(1,071)
Total Expenses (1,066) (1,000) (1,055) (3,121)
EBITDA 1,083 1,110 1,111 3,304
Margin 50.4% 52.6% 51.3% 51.4%
Depreciation (237) (240) (238) (715)
Amortisation (61) (67) (71) (199)
Others (6) (2) (9) (17)
EBIT 779 801 793 2,373
Interest
Expense
(110)
(117)
(125)
(352)
Interest Income 14 12 15 41
PBT 683 696 683 2,062
Tax (201) (205) (173) (579)
PAT 482 491 510 1,483
21
1Q16
2Q16
3Q16
9M16
2,140 2,102 2,156 6,398
(660) (700) (679) (2,039)
(324)
(396)
(338)
(1,058)
(984) (1,096) (1,017) (3,097)
1,156 1,006 1,139 3,301
54.0% 47.9% 52.8% 51.6%
(260) (254) (261) (775)
(86) (82) (83) (251)
(18) (3) (4) (25)
792 667 791 2,250
(120)
(116)
(111)
(347)
14 14 13 41
686 565 693 1,944
(202) (144) (179) (525)
484 421 514 1,419
QoQ
chg
YoY
chg
YTD
chg
+2.6% -0.5% -0.4%
-3.0% -1.2% -0.5%
-14.6%
-8.2%
-1.2%
-7.2% -3.6% -0.8%
+13.2% +2.5% -0.1%
+4.9pp +1.5pp +0.2pp
+18.6% -0.3% -5.2%
+22.7% +1.5% -5.7%
+22.1% +0.8% -4.3%

Reported Consolidated Income Statement Reported
(RM mn)
1Q15
2Q15
3Q15
9M15
REVENUE 2,149 2,110 2,166 6,425
Direct Expenses (713) (650) (689) (2,052)
Indirect
Expenses
(389)
(359)
(456)
(1,204)
Total Expenses (1,102) (1,009) (1,145) (3,256)
EBITDA 1,047 1,101 1,021 3,169
Margin 48.7% 52.2% 47.1% 49.3%
Depreciation (294) (296) (265) (855)
Amortisation (61) (67) (71) (199)
Others (6) (2) (9) (17)
EBIT 686 736 676 2,098
Interest Expense (110) (117) (125) (352)
Interest Income 14 12 15 41
PBT 590 631 566 1,787
Tax (178) (188) (144) (510)
PAT 412 443 422 1,277
22
1Q16
2Q16
3Q16
9M16
2,140 2,102 2,156 6,398
(656) (700) (682) (2,038)
(271)
(352)
(344)
(967)
(927) (1,052) (1,026) (3,005)
1,213 1,050 1,130 3,393
56.7% 50.0% 52.4% 53.0%
(269) (262) (265) (796)
(86) (82) (83) (251)
(18) 44 (4) 22
840 750 778 2,368
(120) (116) (111) (347)
14 14 13 41
734 648 680 2,062
(214) (165) (175) (554)
520 483 505 1,508
QoQ
chg
YoY
chg
YTD
chg
+2.6% -0.5% -0.4%
-2.6% -1.0% -0.7%
-2.3%
-24.6%
-19.7%
-2.5% -10.4% -7.7%
+7.6% +10.7% +7.1%
+2.4pp +5.3pp +3.7pp
+3.7% +15.1% +12.9%
+4.9% +20.1% +15.4%
+4.6% +19.7% +18.1%

Cash Flow Statement (RM mn) 3Q15 4Q15 1Q16 2Q16 3Q16
Cash flow from operating activities 1,109 1,267 705 1,129 994
Cash flow used in investing activities (429) (796) (259) (486) (345)
Purchase of property, plant &
equipment
(357)
(692)
(183)
(417)
(271)
Proceeds from disposal of PPE - 1 2 - 1
Purchase of intangible assets (72) (105) (78) (69) (75)
Cash flow before financing activities 680 471 446 643 649
Cash flow used in financing activities (934) (478) (956) (456) (926)
Dividends paid (375) (376) (376) (375) (376)
Debt drawdown - - - 3,500 840
Debt repayment (421) - (421) (3,500) (1,261)
Payment of finance costs (139) (101) (156) (80) (128)
Others 1 (1) (3) (1) (1)
Net change in cash (254) (7) (510) 187 (277)
Opening Cash Balance 1,557 1,303 1,296 786 973
Closing Cash Balance 1,303 1,296 786 973 696
RM mn 2Q16 3Q16
Debt# 8,751 8,300
Cash 973 696
Net Debt 7,778 7,604
Total Equity 4,438 4,584
Ratios 2Q16 3Q16
Net debt to
EBITDA*
1.72x 1.68x
Net debt to Equity 1.75x 1.66x
# Includes derivative financial instruments designated for hedging relationship on borrowings; excludes vendor financing
* EBITDA calculated as annualised YTD EBITDA
23

Revenue Composition (RM mn) 3Q14 4Q14 1Q15 2Q15 3Q15 4Q15 1Q16 2Q16 3Q16
Total Revenue
- Service
- Mobile
- EntFixed
- Int. Services
- Non-Service
- Device
- Hubbing
- Network income
2,065
2,041
1,946
64
31
24
2
14
8
2,123
2,090
1,988
68
34
33
7
22
4
2,149
2,122
2,019
65
38
27
9
13
5
2,110
2,089
1,984
64
41
21
6
10
5
2,166
2,154
2,046
63
45
12
4
4
4
2,176
2,155
2,047
61
47
21
12
4
5
2,140
2,122
2,005
67
50
18
12
2
4
2,102
2,055
1,934
67
54
47
12
-
35
2,156
2,113
1,982
74
57
43
23
-
20
Normalised EBITDA
Margin on Service
Revenue
52.9%
49.5%
51.0%
53.1%
51.6%
52.0%
54.5%
49.0%
53.9%
Note:
Commencing 1Q15, further breakdowns of mobile revenue are not disclosed as we are not applying fair value to new bundled plans including the MaxisONE Plan
Commencing 2Q16, retrospectively, network income has been re-classified as non-service revenue. Adjusted service, mobile, prepaid and postpaid revenues are tabled above
24
(‘000) 3Q14 4Q14 1Q15 2Q15 3Q15 4Q15 1Q16 2Q16 3Q16
Mobile Revenue
- Prepaid
- Postpaid
1,946
988
958
1,988
1,005
983
2,019
1,049
970
1,984
1,012
972
2,046
1,074
972
2,047
1,038
1,009
2,005
1,013
992
1,934
959
975
1,982
1,022
960

Normalised Financials and Costs (RM mn) 3Q14 4Q14 1Q15 2Q15 3Q15 4Q15 1Q16 2Q16 3Q16
Total Revenue 2,065 2,123 2,149 2,110 2,166 2,176 2,140 2,102 2,156
Total Expenses
- Direct
- Indirect
986
652
334
1,089
696
393
1,066
713
353
1,000
650
350
1,055
687
368
1,055
678
377
984
660
324
1,096
700
396
1,017
679
338
EBITDA 1,079 1,034 1,083 1,110 1,111 1,121 1,156 1,006 1,139
PBT 709 649 683 696 683 682 686 565 693
PAT 500 445 482 491 510 477 484 421 514
EBITDA Margin 52.3% 48.7% 50.4% 52.6% 51.3% 51.5% 54.0% 47.9% 52.8%
PAT Margin 24.2% 21.0% 22.4% 23.3% 23.5% 21.9% 22.6% 20.0% 23.8%
(RM mn) 3Q14 4Q14 1Q15 2Q15 3Q15 4Q15 1Q16 2Q16 3Q16
Total Expenses 986 1,089 1,066 1,000 1,055 1,055 984 1,096 1,017
Direct Expenses 652 696 713 650 687 678 660 700 679
Indirect Expenses
- S&M
- Staff Costs
- Bad Debts
- G&A
334
107
66
15
146
393
122
116
18
137
353
103
124
4
122
350
110
115
10
115
368
94
124
9
141
377
98
117
6
156
324
76
116
19
113
396
109
126
25
136
338
108
126
22
82
25

Reported Financials and Costs (RM mn) 3Q14 4Q14 1Q15 2Q15 3Q15 4Q15 1Q16 2Q16 3Q16
Total Revenue 2,065 2,123 2,149 2,110 2,166 2,176 2,140 2,102 2,156
Total Expenses
- Direct
- Indirect
995
652
343
1,123
696
427
1,102
713
389
1,009
650
359
1,145
689
456
1,014
676
338
927
656
271
1,052
700
352
1,026
682
344
EBITDA 1,070 1,000 1,047 1,101 1,021 1,162 1,213 1,050 1,130
PBT 643 502 590 631 566 673 734 648 680
PAT 451 335 412 443 422 470 520 483 505
EBITDA Margin 51.8% 47.1% 48.7% 52.2% 47.1% 53.4% 56.7% 50.0% 52.4%
PAT Margin 21.8% 15.8% 19.2% 21.0% 19.5% 21.6% 24.3% 23.0% 23.4%
26
(RM mn) 3Q14 4Q14 1Q15 2Q15 3Q15 4Q15 1Q16 2Q16 3Q16
Total Expenses 995 1,123 1,102 1,009 1,145 1,014 927 1,052 1,026
Direct Expenses 652 696 713 650 689 676 656 700 682
Indirect Expenses
- S&M
- Staff Costs
- Bad Debts
- G&A
343
107
66
15
155
427
122
116
18
171
389
103
124
4
158
359
110
115
10
124
456
94
124
9
229
338
98
117
6
117
271
76
116
19
60
352
109
126
25
92
344
108
126
22
88

RGS30, ARPU and Smart-phone penetration (‘000) 3Q14 4Q14 1Q15 2Q15 3Q15 4Q15 1Q16 2Q16 3Q16
Mobile Subs
- Prepaid
- Postpaid
- WBB
11,338
8,120
2,786
432
11,864
8,656
2,809
398
12,192
8,992
2,823
377
12,214
9,068
2,796
350
11,956
8,850
2,784
322
11,579
8,520
2,765
294
11,164
8,196
2,696
272
11,015
8,108
2,660
247
10,903
8,007
2,678
218
ARPU
(RM/mth)
3Q14
4Q14
1Q15
2Q15
3Q15
4Q15
1Q16
2Q16
3Q16
Blended
- Prepaid
- Postpaid
55
40
95
54
39
98
53
38
96
51
36
97
53
39
98
54
39
102
55
39
102
54
38
102
56
41
100
Notes:
WBB subscriptions defined as subscriptions on data plans using USB modems and tablets Commencing 1Q15, postpaid MOU is no longer disclosed as we are not applying fair value to new bundled plans including the MaxisONE Plan
Smart-phone defined as any devices with growing apps store and active developers
27
Smartphone
Penetration (%)
3Q14
4Q14
1Q15
2Q15
3Q15
4Q15
1Q16
2Q16
3Q16
Blended
- Prepaid
- Postpaid
54
50
67
57
54
67
62
60
72
65
63
73
67
65
75
69
67
76
70
67
77
70
68
80
74
72
81

Market Definition Subscriptions, ARPU and MOU (‘000) 3Q14 4Q14 1Q15 2Q15 3Q15 4Q15 1Q16 2Q16 3Q16
Mobile Subs
- Prepaid
- Postpaid
12,415
9,081
3,334
12,913
9,624
3,289
13,260
9,979
3,280
13,269
10,051
3,218
13,110
9,927
3,174
12,694
9,567
3,127
12,310
9,279
3,031
12,249
9,273
2,976
12,046
9,085
2,961
WBB 495 440 412 385 357 325 302 276 243
Mobile Internet
Users
7,600
8,800
9,000
9,100
9,000
8,800
8,500
8,400
8,500
Home
Connections
72
80
89
99
107
118
126
133
139
Notes
WBB subscriptions defined as subscriptions on data plans using USB modems and tablets – included in postpaid subscriptions Commencing 1Q15, postpaid MOU is no longer disclosed as we are not applying fair value to new bundled plans including the MaxisONE Plan
28
(‘000) 3Q14 4Q14 1Q15 2Q15 3Q15 4Q15 1Q16 2Q16 3Q16
Prepaid
- ARPU
- MOU (min/mth)
35
131
35
133
35
126
33
131
35
134
35
129
35
141
34
162
36
155
Postpaid 94 97 95 96 97 102 101 101 100
Blended 50 50 48 47 49 50 50 49 50