3PAR Vision User Guide - 3PAR Vision monitoring … Vision User Guide AntemetA ... 3PAR Vision is a...
38
User Guide 3PAR Vision v3.2 Decembre 2016
Transcript of 3PAR Vision User Guide - 3PAR Vision monitoring … Vision User Guide AntemetA ... 3PAR Vision is a...

User Guide
3PAR Vision v3.2
Decembre 2016

3PAR Vision User Guide
AntemetA - All rights reserved
3211 Page 1
Disclaimer
The information contained herein is subject to change without notice. The only warranties for
AntemetA products and services are set forth in the express warranty statements accompanying such
products and services. Nothing herein should be construed as constituting an additional warranty.
AntemetA shall not be liable for technical or editorial errors or omissions contained herein.
3PAR Vision User Guide
AntemetA - All rights reserved
3211 Page 2
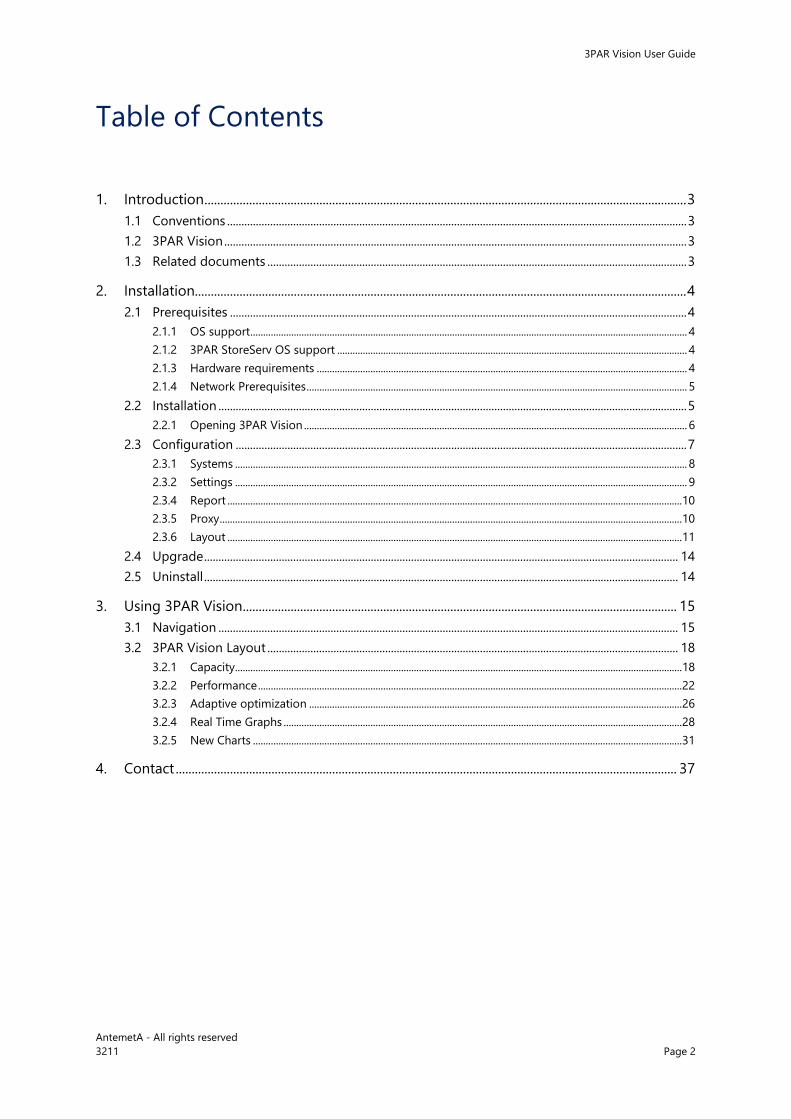
Table of Contents
1. Introduction ....................................................................................................................................................... 3
1.1 Conventions ................................................................................................................................................................ 3
1.2 3PAR Vision ................................................................................................................................................................. 3
1.3 Related documents .................................................................................................................................................. 3
2. Installation.......................................................................................................................................................... 4
2.1 Prerequisites ............................................................................................................................................................... 4
2.1.1 OS support ........................................................................................................................................................................... 4
2.1.2 3PAR StoreServ OS support ......................................................................................................................................... 4
2.1.3 Hardware requirements ................................................................................................................................................. 4
2.1.4 Network Prerequisites ..................................................................................................................................................... 5
2.2 Installation ................................................................................................................................................................... 5
2.2.1 Opening 3PAR Vision ...................................................................................................................................................... 6
2.3 Configuration ............................................................................................................................................................. 7
2.3.1 Systems ................................................................................................................................................................................. 8
2.3.2 Settings ................................................................................................................................................................................. 9
2.3.4 Report .................................................................................................................................................................................. 10
2.3.5 Proxy ..................................................................................................................................................................................... 10
2.3.6 Layout .................................................................................................................................................................................. 11
2.4 Upgrade ..................................................................................................................................................................... 14
2.5 Uninstall ..................................................................................................................................................................... 14
3. Using 3PAR Vision ........................................................................................................................................ 15
3.1 Navigation ................................................................................................................................................................ 15
3.2 3PAR Vision Layout ............................................................................................................................................... 18
3.2.1 Capacity............................................................................................................................................................................... 18
3.2.2 Performance ...................................................................................................................................................................... 22
3.2.3 Adaptive optimization .................................................................................................................................................. 26
3.2.4 Real Time Graphs ............................................................................................................................................................ 28
3.2.5 New Charts ........................................................................................................................................................................ 31
4. Contact ............................................................................................................................................................. 37
3PAR Vision User Guide
AntemetA - All rights reserved
3211 Page 3
1. INTRODUCTION
This document provides the information needed to install and use 3PAR Vision v3.2.1.1
The latest version of this document can be found here:
https://www.3parvision.com/download/userguide.pdf
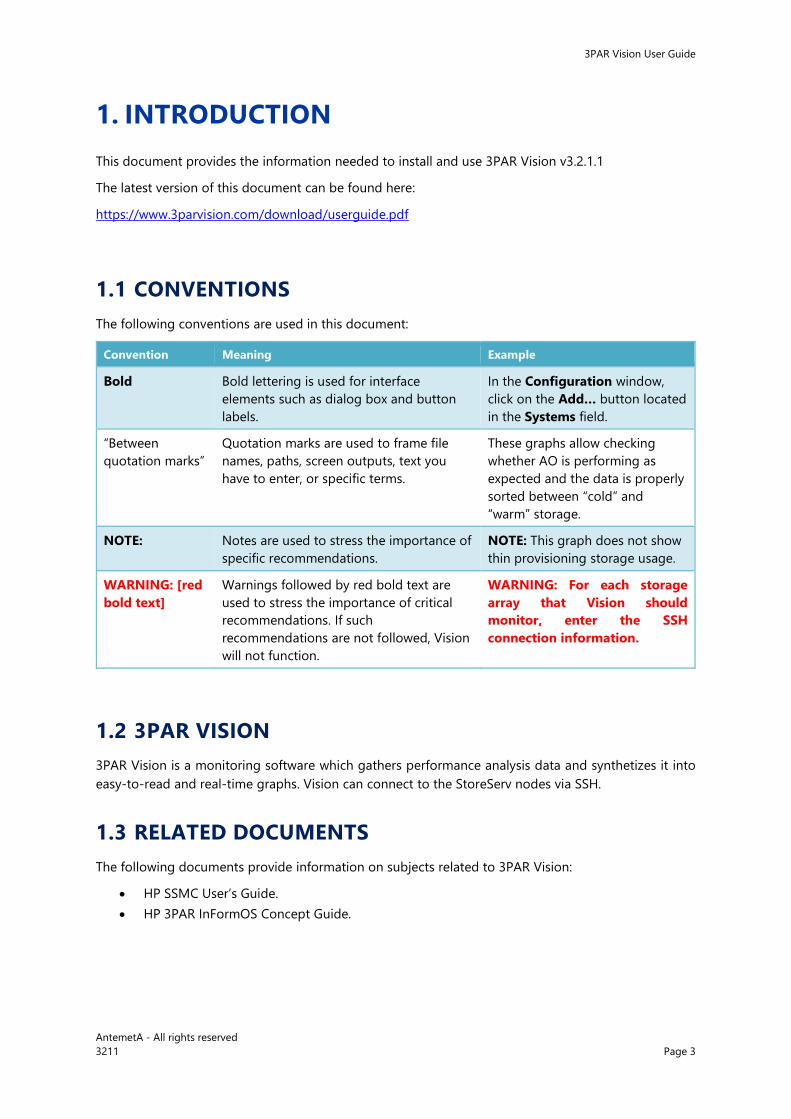
1.1 CONVENTIONS
The following conventions are used in this document:
Convention Meaning Example
Bold Bold lettering is used for interface
elements such as dialog box and button
labels.
In the Configuration window,
click on the Add… button located
in the Systems field.
“Between
quotation marks”
Quotation marks are used to frame file
names, paths, screen outputs, text you
have to enter, or specific terms.
These graphs allow checking
whether AO is performing as
expected and the data is properly
sorted between “cold” and
“warm” storage.
NOTE: Notes are used to stress the importance of
specific recommendations.
NOTE: This graph does not show
thin provisioning storage usage.
WARNING: [red
bold text]
Warnings followed by red bold text are
used to stress the importance of critical
recommendations. If such
recommendations are not followed, Vision
will not function.
WARNING: For each storage
array that Vision should
monitor, enter the SSH
connection information.
1.2 3PAR VISION
3PAR Vision is a monitoring software which gathers performance analysis data and synthetizes it into
easy-to-read and real-time graphs. Vision can connect to the StoreServ nodes via SSH.
1.3 RELATED DOCUMENTS
The following documents provide information on subjects related to 3PAR Vision:
HP SSMC User’s Guide.
HP 3PAR InFormOS Concept Guide.
3PAR Vision User Guide
AntemetA - All rights reserved
3211 Page 4
2. INSTALLATION
This chapter describes the prerequisites and procedures necessary to install 3PAR Vision.
2.1 PREREQUISITES
All the prerequisites below must be met for 3PAR Vision to function properly.
2.1.1 OS SUPPORT
3PAR Vision requires that the .NET Framework 4.5 is installed on the monitoring computer.
3PAR Vision is compatible with Windows versions that support the .NET Framework 4.5. 3PAR Vision
has currently been tested with the following OS:
Windows 7 SP1
Windows 8 / 8.1
Windows 10
Windows 2008
Windows 2012
2.1.2 3PAR STORESERV OS SUPPORT
3PAR Vision release 3.0 does no longer support the connection to external System Reporter servers.
Therefore, 3PAR Vision only supports InFormOS versions 3.1.2 and higher with the SR-On-Nodes
feature.
3PAR Vision requires the System Reporter license to be activated on the targeted storage systems. The
System Reporter service should also be active on the controllers.
3PAR Vision requires to access the HP StoreServ arrays through SSH. A user with “browser” rights shall
be created within each StoreServ to be monitored by the 3PAR Vision software.
2.1.3 HARDWARE REQUIREMENTS
3PAR Vision requires the following machine specifications in order to run:
- 1 core for every 8 arrays monitored
- 1 GB of RAM for every 8 arrays monitored
- 1 GB of disk for every 16 arrays monitored
Those figures are relative to the default display of 3PAR Vision. Depending on how the graphs are
configured through the layout tool, more CPU or Memory resources might be needed for 3PAR Vision
to run properly. The 3PAR Vision software may also need more resources if large arrays are monitored
(>1000 Virtual Volumes).
3PAR Vision User Guide
AntemetA - All rights reserved
3211 Page 5
2.1.4 NETWORK PREREQUISITES
The installation of 3PAR Vision requires an internet connection. It will also later be used to update 3PAR
Vision. 3PAR Vision needs to connect using HTTPS to www.3parvision.com on destination port 443 for
the following needs:
- Automatic fetch of the licenses
- Automatic software update process
3PAR Vision does support downloading its updates through an authenticated proxy. Refer to the Proxy
chapter.
Please contact support to get the latest build of 3PAR Vision (ref Section 5 of this document) in case no
Internet connection is available.
3PAR Vision will connect directly to the StoreServ via an SSH connection through port TCP 22. The
software will connect three SSH sessions per array, one for each of the following charts:
- Historical graphs
- Real-time graphs
- Unusual events
2.2 INSTALLATION
The procedure to install 3PAR Vision is as follows:
1) Using a web browser, connect to the URL:
https://www.3parvision.com/download/3parvision.exe
2) Once the application has been downloaded, execute “3PAR Vision.exe” on the system. The 3PAR
Vision installer requires Administrative Rights on the system to install, as it creates files and
folders in the “Program Files” folder.
3) Follow the installer instructions.
4) If you have not launched the installer with Administrative Right to the system, the installer will
prompt you to authorize the software installation.
5) If the installation was successful, click the close button.
3PAR Vision User Guide
AntemetA - All rights reserved
3211 Page 6
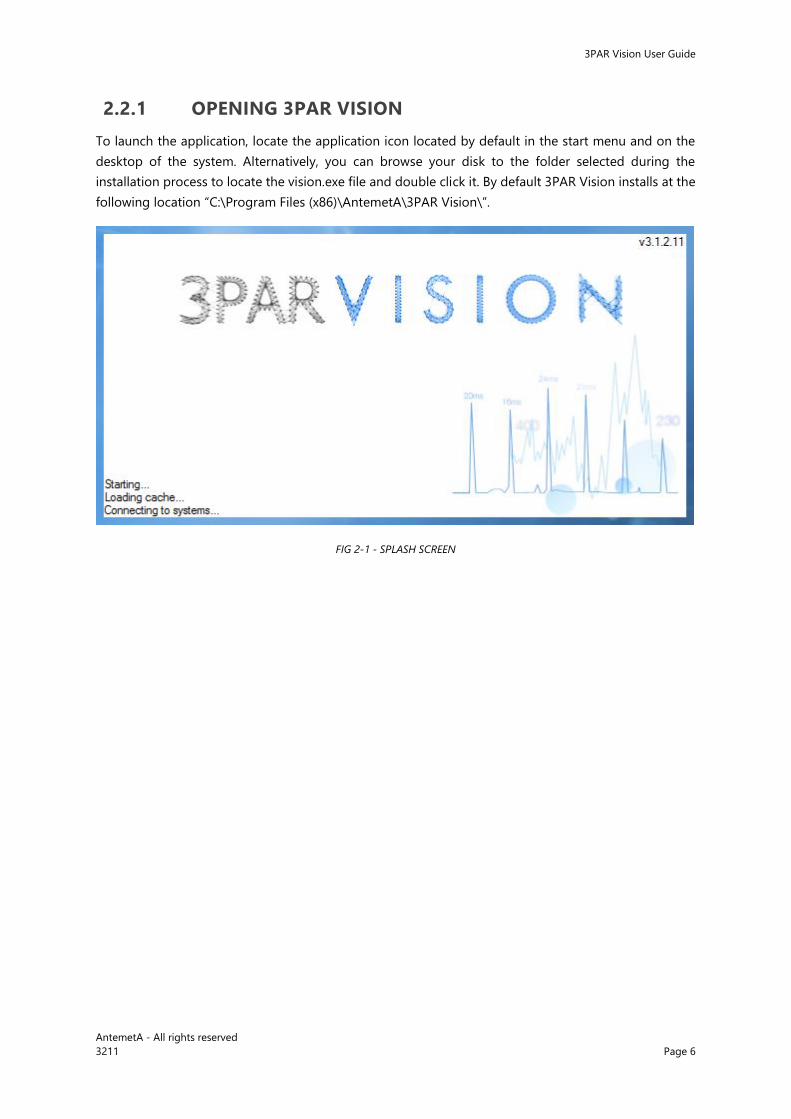
2.2.1 OPENING 3PAR VISION
To launch the application, locate the application icon located by default in the start menu and on the
desktop of the system. Alternatively, you can browse your disk to the folder selected during the
installation process to locate the vision.exe file and double click it. By default 3PAR Vision installs at the
following location “C:\Program Files (x86)\AntemetA\3PAR Vision\”.
FIG 2-1 - SPLASH SCREEN
3PAR Vision User Guide
AntemetA - All rights reserved
3211 Page 7
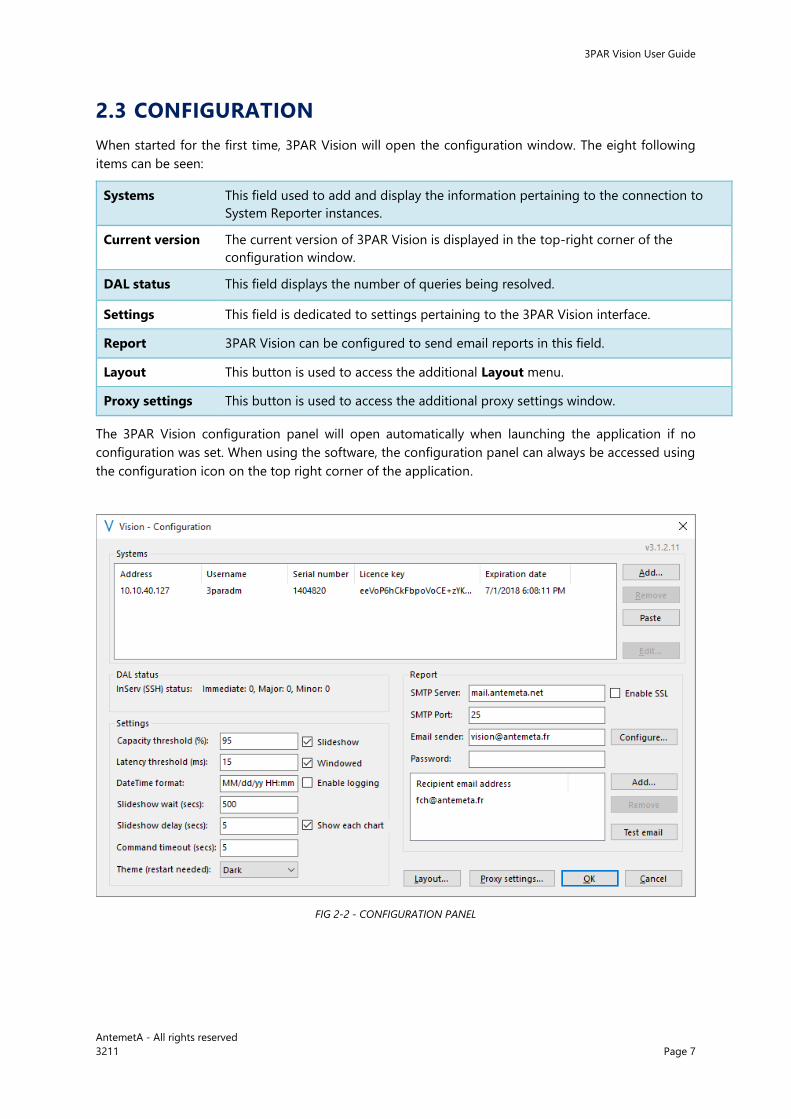
2.3 CONFIGURATION
When started for the first time, 3PAR Vision will open the configuration window. The eight following
items can be seen:
Systems This field used to add and display the information pertaining to the connection to
System Reporter instances.
Current version The current version of 3PAR Vision is displayed in the top-right corner of the
configuration window.
DAL status This field displays the number of queries being resolved.
Settings This field is dedicated to settings pertaining to the 3PAR Vision interface.
Report 3PAR Vision can be configured to send email reports in this field.
Layout This button is used to access the additional Layout menu.
Proxy settings This button is used to access the additional proxy settings window.
The 3PAR Vision configuration panel will open automatically when launching the application if no
configuration was set. When using the software, the configuration panel can always be accessed using
the configuration icon on the top right corner of the application.
FIG 2-2 - CONFIGURATION PANEL
3PAR Vision User Guide
AntemetA - All rights reserved
3211 Page 8
2.3.1 SYSTEMS
The following buttons may be used to perform different actions on the systems registered in the settings
Add Add a new HP StoreServ array to be monitored.
Remove Remove a HP StoreServ array from monitoring.
Paste/Copy Paste/Copy to the clipboard the selected system line with all the settings.
Edit Edit a registered system within 3PAR Vision. This feature may be used to
change the password from a HP StoreServ array for instance.
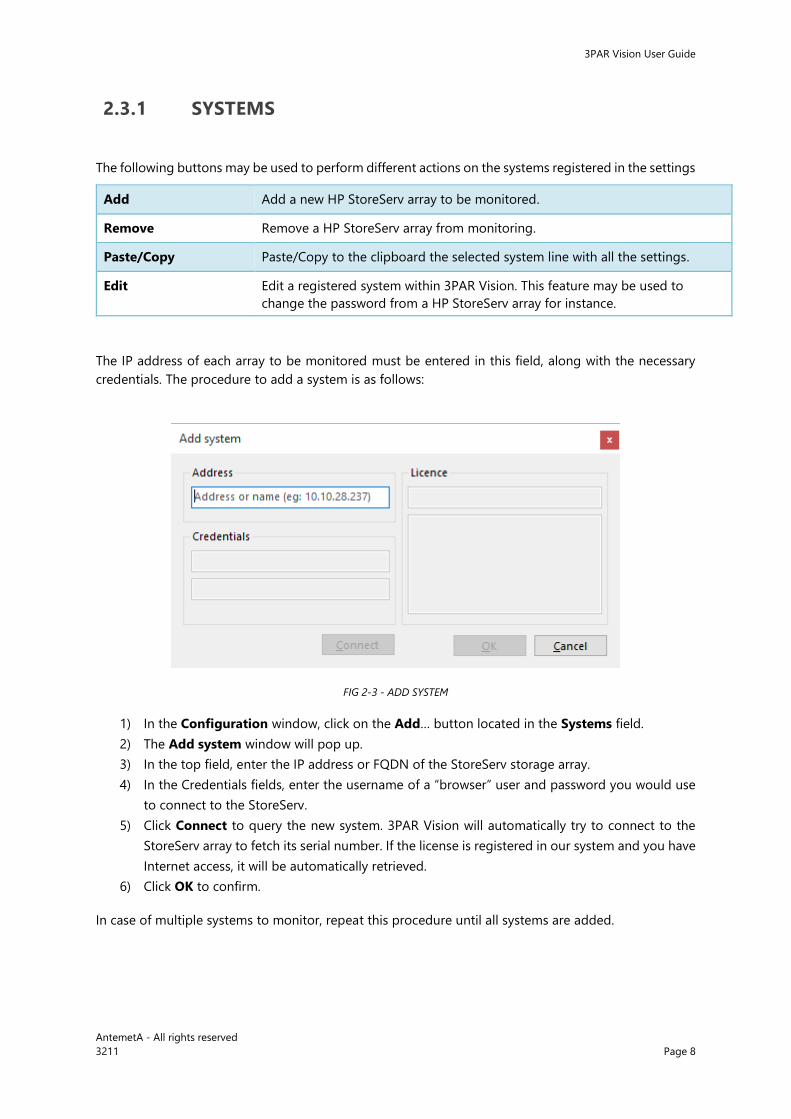
The IP address of each array to be monitored must be entered in this field, along with the necessary
credentials. The procedure to add a system is as follows:
FIG 2-3 - ADD SYSTEM
1) In the Configuration window, click on the Add… button located in the Systems field.
2) The Add system window will pop up.
3) In the top field, enter the IP address or FQDN of the StoreServ storage array.
4) In the Credentials fields, enter the username of a “browser” user and password you would use
to connect to the StoreServ.
5) Click Connect to query the new system. 3PAR Vision will automatically try to connect to the
StoreServ array to fetch its serial number. If the license is registered in our system and you have
Internet access, it will be automatically retrieved.
6) Click OK to confirm.
In case of multiple systems to monitor, repeat this procedure until all systems are added.
3PAR Vision User Guide
AntemetA - All rights reserved
3211 Page 9
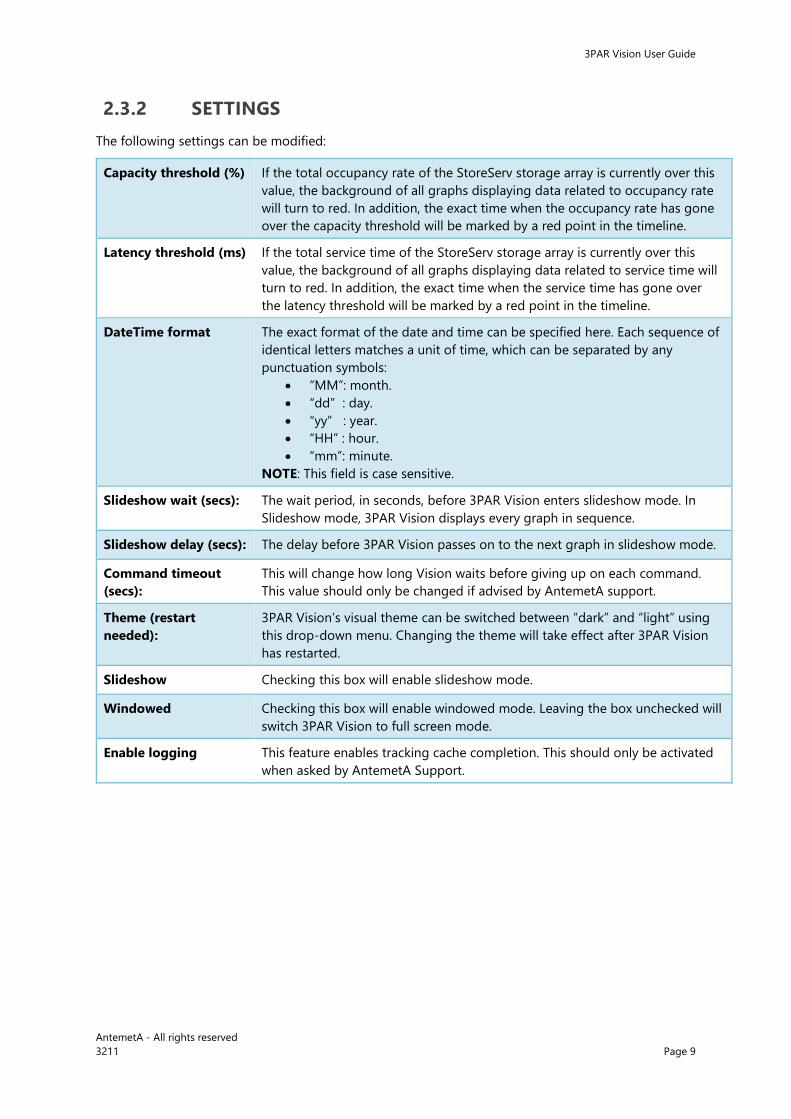
2.3.2 SETTINGS
The following settings can be modified:
Capacity threshold (%) If the total occupancy rate of the StoreServ storage array is currently over this
value, the background of all graphs displaying data related to occupancy rate
will turn to red. In addition, the exact time when the occupancy rate has gone
over the capacity threshold will be marked by a red point in the timeline.
Latency threshold (ms) If the total service time of the StoreServ storage array is currently over this
value, the background of all graphs displaying data related to service time will
turn to red. In addition, the exact time when the service time has gone over
the latency threshold will be marked by a red point in the timeline.
DateTime format The exact format of the date and time can be specified here. Each sequence of
identical letters matches a unit of time, which can be separated by any
punctuation symbols:
“MM”: month.
“dd” : day.
“yy” : year.
“HH” : hour.
“mm”: minute.
NOTE: This field is case sensitive.
Slideshow wait (secs): The wait period, in seconds, before 3PAR Vision enters slideshow mode. In
Slideshow mode, 3PAR Vision displays every graph in sequence.
Slideshow delay (secs): The delay before 3PAR Vision passes on to the next graph in slideshow mode.
Command timeout
(secs):
This will change how long Vision waits before giving up on each command.
This value should only be changed if advised by AntemetA support.
Theme (restart
needed):
3PAR Vision’s visual theme can be switched between “dark” and “light” using
this drop-down menu. Changing the theme will take effect after 3PAR Vision
has restarted.
Slideshow Checking this box will enable slideshow mode.
Windowed Checking this box will enable windowed mode. Leaving the box unchecked will
switch 3PAR Vision to full screen mode.
Enable logging This feature enables tracking cache completion. This should only be activated
when asked by AntemetA Support.
3PAR Vision User Guide
AntemetA - All rights reserved
3211 Page 10
2.3.4 REPORT
3PAR Vision can be configured to send email reports in this field. These reports contain snapshots of all
the graphs, taken at the exact moment the report was sent. The report itself is a Word docx document
displaying the graphs as seen in the 3PAR Vision interface. The report option requires a SMTP server
and a dedicated email account. In order to configure report dispatch, follow the procedure below:
1) In the SMTP Server field, enter the DNS name or IP address of the SMTP server in charge of
handling the dispatching of emails. You can tick the Enable SSL box if your server requires a
secured connection.
2) In the SMTP Port field, enter the port used for SMTP communication. By default, it should be
“25”.
3) In the Email Sender field, enter the email account set up to handle 3PAR Vision reports in the
following format: “[email protected]”.
Example: “[email protected]"
4) In the Password field, enter the password of the email account if your server requires an
authenticated connection from senders.
5) Use the Configure button to access the Schedule/Template settings.
6) Use the Set timer button to define when the next report will be sent.
7) The Next report time window will pop-up. Select the time, then the periodicity of the reports
and click OK.
8) The recipients’ addresses can be added by clicking the Add button.
9) The Add email report recipient window will pop-up. Enter the recipient email address and
click OK. Repeat this step until all intended recipients are added. If needed, addresses can be
removed from the list by selecting it and clicking Remove.
10) The Report configuration window will pop-up. Click on Edit to open the template in Microsoft
Word. If you don’t have Microsoft Word on the machine running Vision, you will have to edit
the template located in: “%APPDATA%\AntemetA\3PAR Vision\ReportTemplate.docx”. Click on
the Test button to create a report locally using the default or custom template. Click on the
Reset button to delete the custom template and use the default.
11) To test the report configuration, click on the Test email button. It will send a sample report to
all the email addresses listed under Recipient email address.
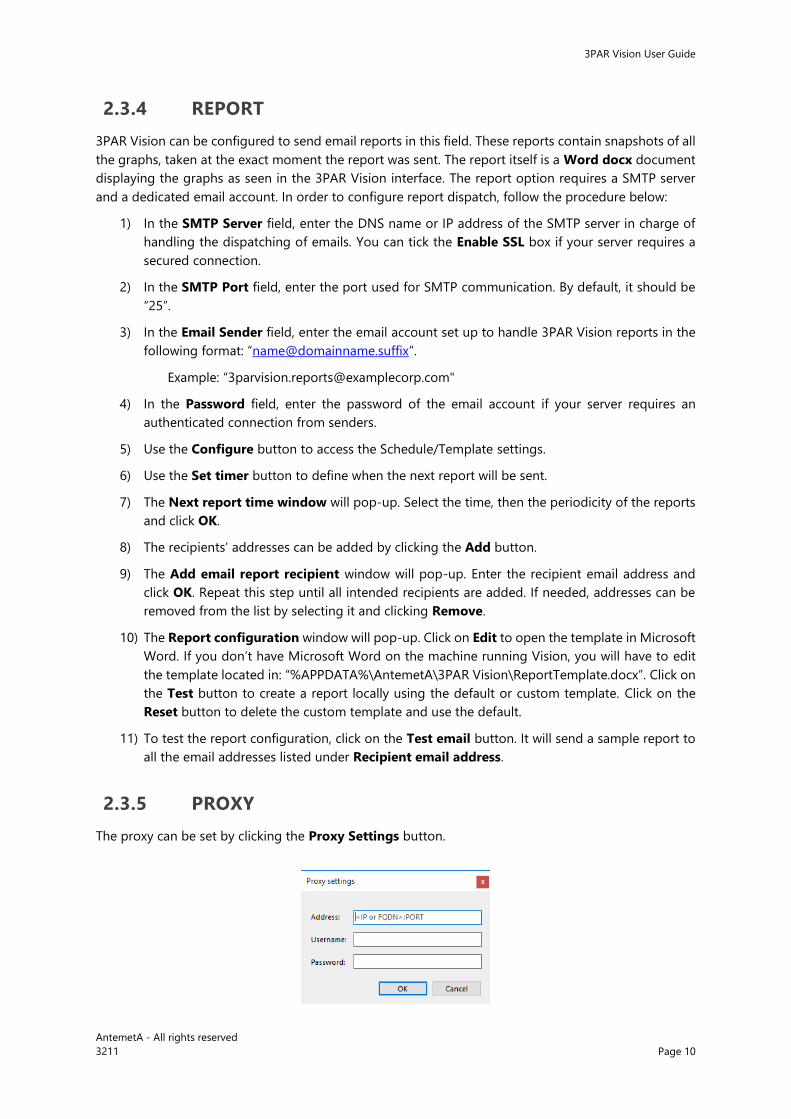
2.3.5 PROXY
The proxy can be set by clicking the Proxy Settings button.
3PAR Vision User Guide
AntemetA - All rights reserved
3211 Page 11
FIG 2-4 - PROXY SETTINGS
1) In the Address field enter the IP address of FQDN of the proxy.
2) In the Username field enter the user name for the authenticated proxy. Depending on the proxy
configuration, you may not need to specify the domain name for this entry.
3) In the Password field enter the password for authentication. This password will be hashed and
stored in a 3PAR Vision configuration file.
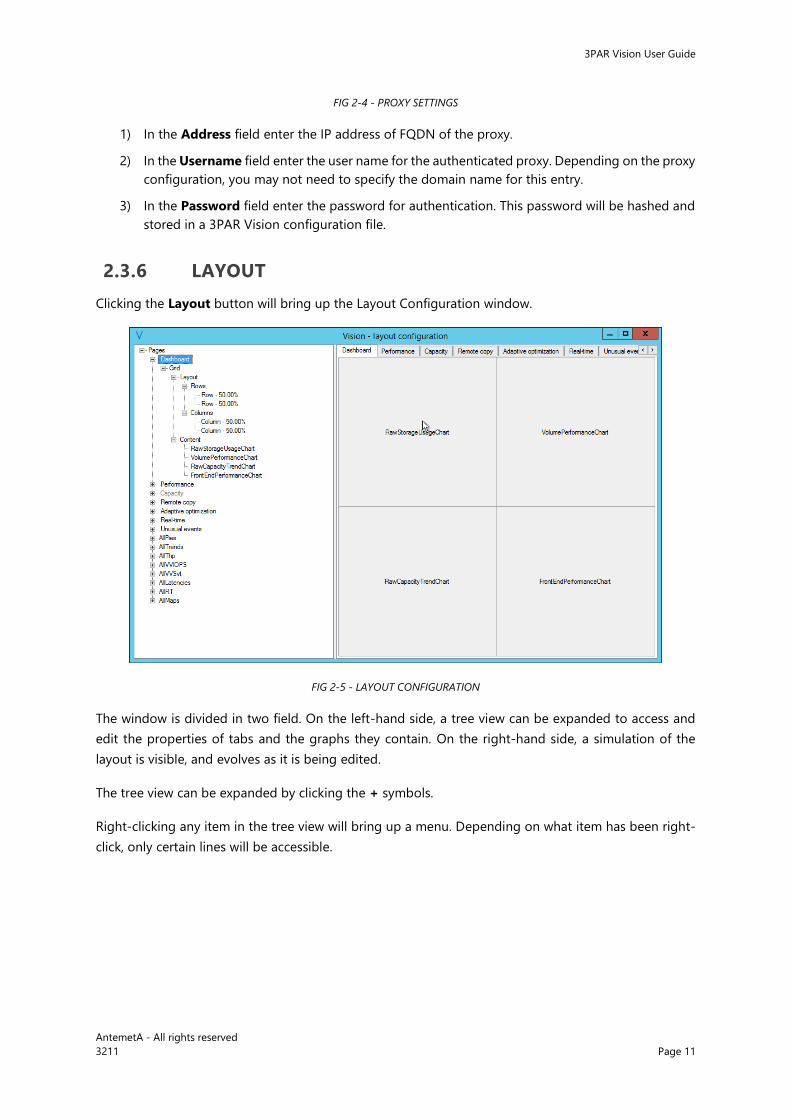
2.3.6 LAYOUT
Clicking the Layout button will bring up the Layout Configuration window.
FIG 2-5 - LAYOUT CONFIGURATION
The window is divided in two field. On the left-hand side, a tree view can be expanded to access and
edit the properties of tabs and the graphs they contain. On the right-hand side, a simulation of the
layout is visible, and evolves as it is being edited.
The tree view can be expanded by clicking the + symbols.
Right-clicking any item in the tree view will bring up a menu. Depending on what item has been right-
click, only certain lines will be accessible.
3PAR Vision User Guide
AntemetA - All rights reserved
3211 Page 12
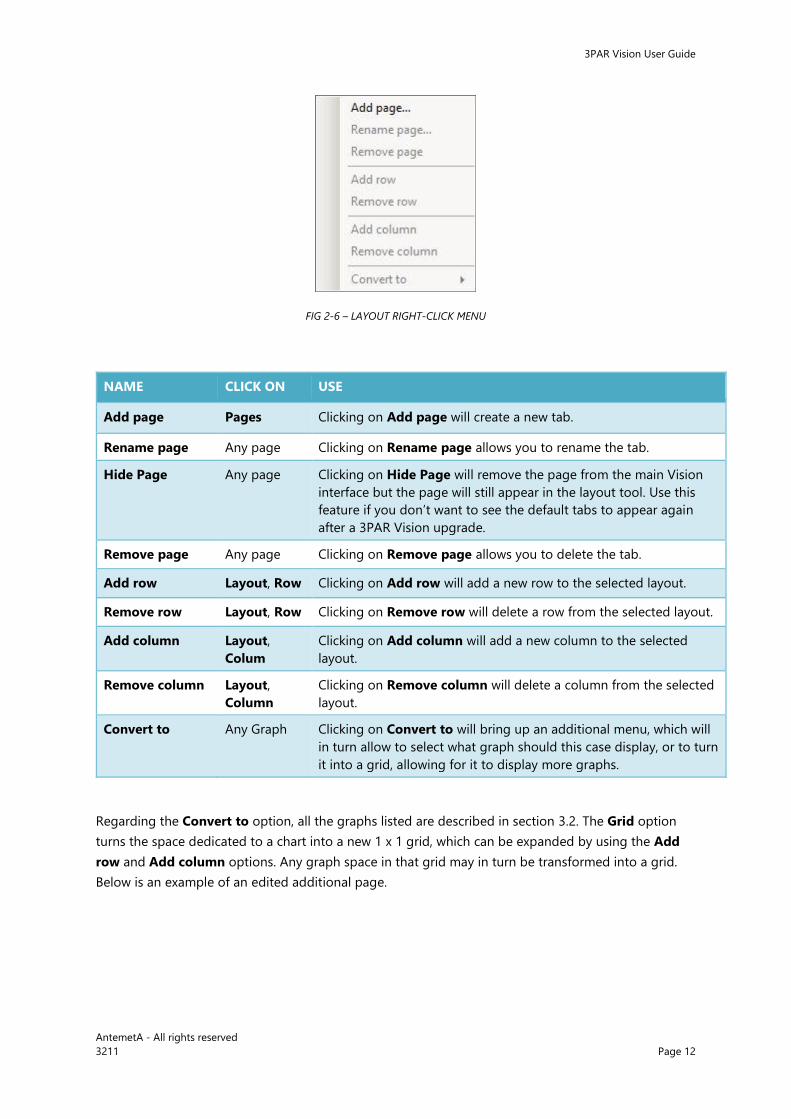
FIG 2-6 – LAYOUT RIGHT-CLICK MENU
NAME CLICK ON USE
Add page Pages Clicking on Add page will create a new tab.
Rename page Any page Clicking on Rename page allows you to rename the tab.
Hide Page Any page Clicking on Hide Page will remove the page from the main Vision
interface but the page will still appear in the layout tool. Use this
feature if you don’t want to see the default tabs to appear again
after a 3PAR Vision upgrade.
Remove page Any page Clicking on Remove page allows you to delete the tab.
Add row Layout, Row Clicking on Add row will add a new row to the selected layout.
Remove row Layout, Row Clicking on Remove row will delete a row from the selected layout.
Add column Layout,
Colum
Clicking on Add column will add a new column to the selected
layout.
Remove column Layout,
Column
Clicking on Remove column will delete a column from the selected
layout.
Convert to Any Graph Clicking on Convert to will bring up an additional menu, which will
in turn allow to select what graph should this case display, or to turn
it into a grid, allowing for it to display more graphs.
Regarding the Convert to option, all the graphs listed are described in section 3.2. The Grid option
turns the space dedicated to a chart into a new 1 x 1 grid, which can be expanded by using the Add
row and Add column options. Any graph space in that grid may in turn be transformed into a grid.
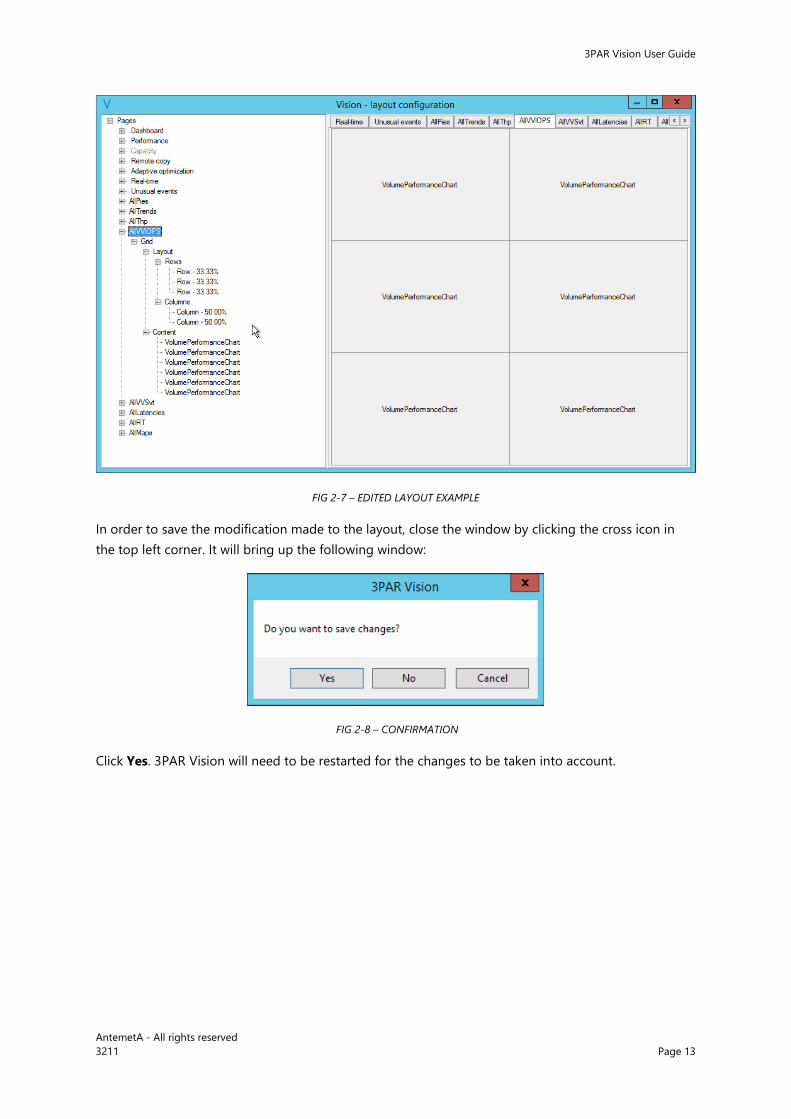
Below is an example of an edited additional page.
3PAR Vision User Guide
AntemetA - All rights reserved
3211 Page 13
FIG 2-7 – EDITED LAYOUT EXAMPLE
In order to save the modification made to the layout, close the window by clicking the cross icon in
the top left corner. It will bring up the following window:
FIG 2-8 – CONFIRMATION
Click Yes. 3PAR Vision will need to be restarted for the changes to be taken into account.
3PAR Vision User Guide
AntemetA - All rights reserved
3211 Page 14
2.4 UPGRADE
Each time 3PAR Vision is launched, the process will try to check online if a new release of the software
is available. 3PAR Vision will check if your arrays have a valid support contract for the software to validate
the upgrade. If at least one array does not have a valid support contract Vision will not upgrade.
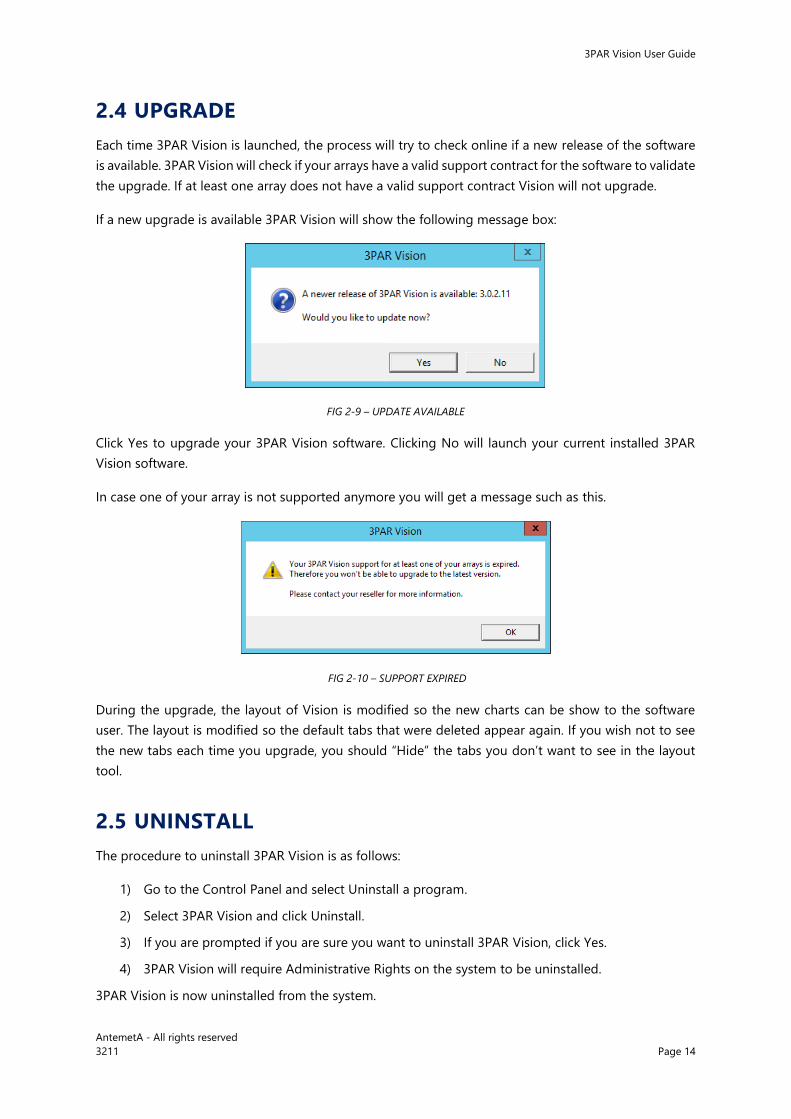
If a new upgrade is available 3PAR Vision will show the following message box:
FIG 2-9 – UPDATE AVAILABLE
Click Yes to upgrade your 3PAR Vision software. Clicking No will launch your current installed 3PAR
Vision software.
In case one of your array is not supported anymore you will get a message such as this.
FIG 2-10 – SUPPORT EXPIRED
During the upgrade, the layout of Vision is modified so the new charts can be show to the software
user. The layout is modified so the default tabs that were deleted appear again. If you wish not to see
the new tabs each time you upgrade, you should “Hide” the tabs you don’t want to see in the layout
tool.
2.5 UNINSTALL
The procedure to uninstall 3PAR Vision is as follows:
1) Go to the Control Panel and select Uninstall a program.
2) Select 3PAR Vision and click Uninstall.
3) If you are prompted if you are sure you want to uninstall 3PAR Vision, click Yes.
4) 3PAR Vision will require Administrative Rights on the system to be uninstalled.
3PAR Vision is now uninstalled from the system.
3PAR Vision User Guide
AntemetA - All rights reserved
3211 Page 15
3. USING 3PAR VISION
3.1 NAVIGATION
This icon is used to access the configuration menu; which options are described in section
2.3.
This icon is used to exit the 3PAR Vision application.
This icon is used to reset the zoom in a graph
This icon is used to toggle a graph in full screen
This icon is used to toggle out of full screen
3PAR Vision can be navigated using the mouse and keyboard. The following actions can be performed:
Left-click Left-clicking on a tab name will bring up that tab. It is also used in zoom mode to
press the arrow buttons.
Escape key Pressing the escape key will cancel full-window mode.
Pointing On line graphs, laying the cursor on a specific point in time will show data about it.
Selecting On line graphs, if the Zoom option is enabled, selecting a section of the graph will
zoom on it.
The Settings menu displays the options below. Changes made in this menu only affect the selected
graph. Not all options are available on all graphs.
System If several HP 3PAR StoreServ systems are configured to be monitored by 3PAR
Vision, you can select which one the selected graph should represent.
Resolution The granularity of the graph can be selected here:
High : Each point in the graph will correspond to a minute (in case of a
SSH connection to an StoreServ storage array).
Hourly : Each point in the graph corresponds to an hour.
Daily : Each point in the graph corresponds to a day.
Highlight It is possible to highlight specific days of the week in this menu, as follows:
None
Weekends
Weekdays
Mondays
Wednesdays
Fridays
3PAR Vision User Guide
AntemetA - All rights reserved
3211 Page 16
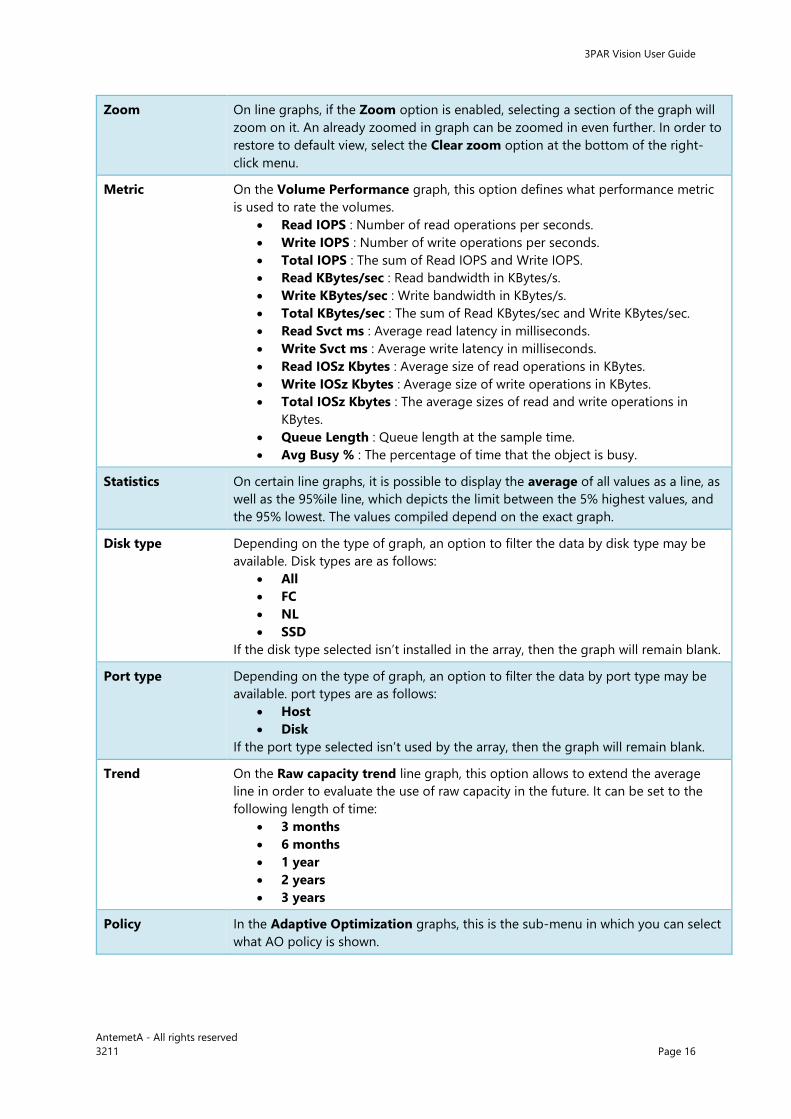
Zoom On line graphs, if the Zoom option is enabled, selecting a section of the graph will
zoom on it. An already zoomed in graph can be zoomed in even further. In order to
restore to default view, select the Clear zoom option at the bottom of the right-
click menu.
Metric On the Volume Performance graph, this option defines what performance metric
is used to rate the volumes.
Read IOPS : Number of read operations per seconds.
Write IOPS : Number of write operations per seconds.
Total IOPS : The sum of Read IOPS and Write IOPS.
Read KBytes/sec : Read bandwidth in KBytes/s.
Write KBytes/sec : Write bandwidth in KBytes/s.
Total KBytes/sec : The sum of Read KBytes/sec and Write KBytes/sec.
Read Svct ms : Average read latency in milliseconds.
Write Svct ms : Average write latency in milliseconds.
Read IOSz Kbytes : Average size of read operations in KBytes.
Write IOSz Kbytes : Average size of write operations in KBytes.
Total IOSz Kbytes : The average sizes of read and write operations in
KBytes.
Queue Length : Queue length at the sample time.
Avg Busy % : The percentage of time that the object is busy.
Statistics On certain line graphs, it is possible to display the average of all values as a line, as
well as the 95%ile line, which depicts the limit between the 5% highest values, and
the 95% lowest. The values compiled depend on the exact graph.
Disk type Depending on the type of graph, an option to filter the data by disk type may be
available. Disk types are as follows:
All
FC
NL
SSD
If the disk type selected isn’t installed in the array, then the graph will remain blank.
Port type Depending on the type of graph, an option to filter the data by port type may be
available. port types are as follows:
Host
Disk
If the port type selected isn’t used by the array, then the graph will remain blank.
Trend On the Raw capacity trend line graph, this option allows to extend the average
line in order to evaluate the use of raw capacity in the future. It can be set to the
following length of time:
3 months
6 months
1 year
2 years
3 years
Policy In the Adaptive Optimization graphs, this is the sub-menu in which you can select
what AO policy is shown.

3PAR Vision User Guide
AntemetA - All rights reserved
3211 Page 17
Display type The Virtual volume tiers graph allows to select between displaying percentage or
gigabytes.
3PAR Vision User Guide
AntemetA - All rights reserved
3211 Page 18
3.2 3PAR VISION LAYOUT
What is described in this section is the default layout of 3PAR Vision. It can be customized by using the
Layout configuration menu, as explained in section “Layout” 3PAR Vision graphs are presented within
those tabs:
Dashboard
Performances
Capacity
Remote copy
Adaptive optimization
Real-time
Unusual events
New Charts
3.2.1 CAPACITY
3PAR Vision comprises several capacity oriented charts. Those are meant to help the storage
administrator report quickly on the past, current and future capacity usage for all the storage tiers within
the storage systems of the SAN.
3PAR Vision comprises the following capacity oriented charts:
Raw storage Data
Raw capacity trend
Consolidated capacity
Physical capacity by disk type
Volume capacity
These charts are retailed below.
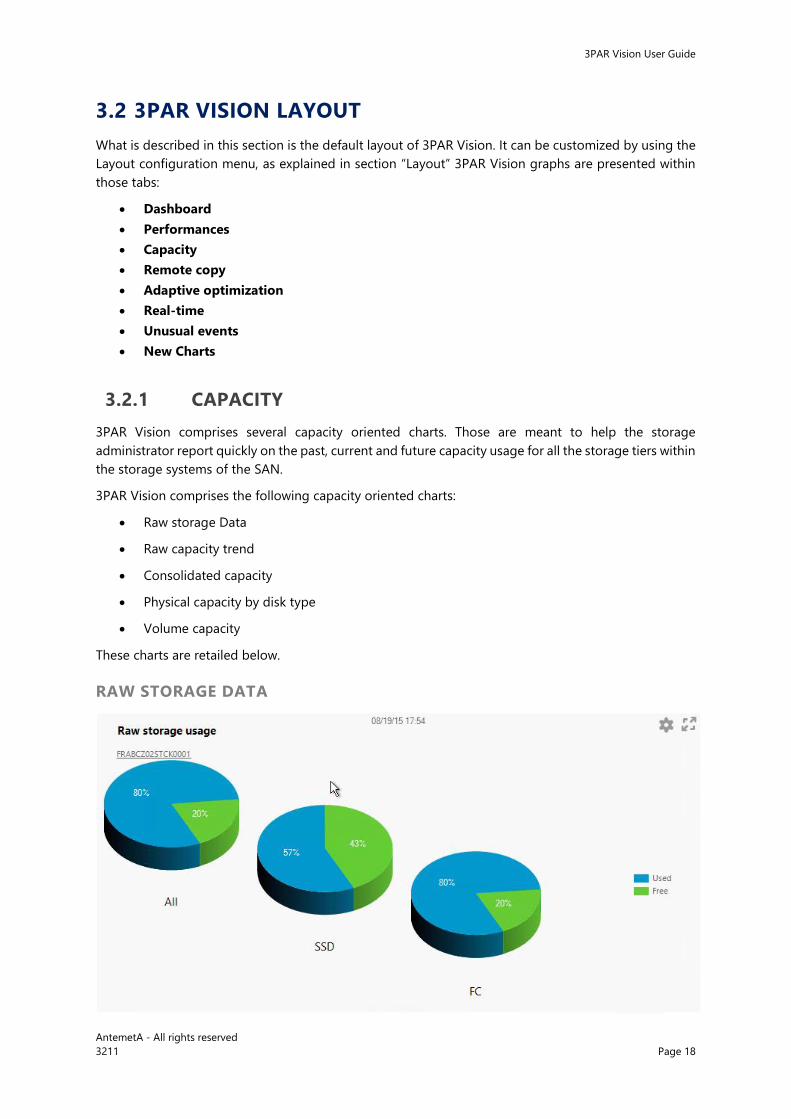
RAW STORAGE DATA
3PAR Vision User Guide
AntemetA - All rights reserved
3211 Page 19
FIG 3-1 – RAW STORAGE USAGE
This graph shows the occupancy rate on the storage array, in general and by disk type. It is calculated
by counting and comparing free chunklets against Used and spare chunklets. The space in blue is used,
and the one in green is available for growth.
NOTE: This graph does not show thin provisioning storage usage.
RAW CAPACITY TREND
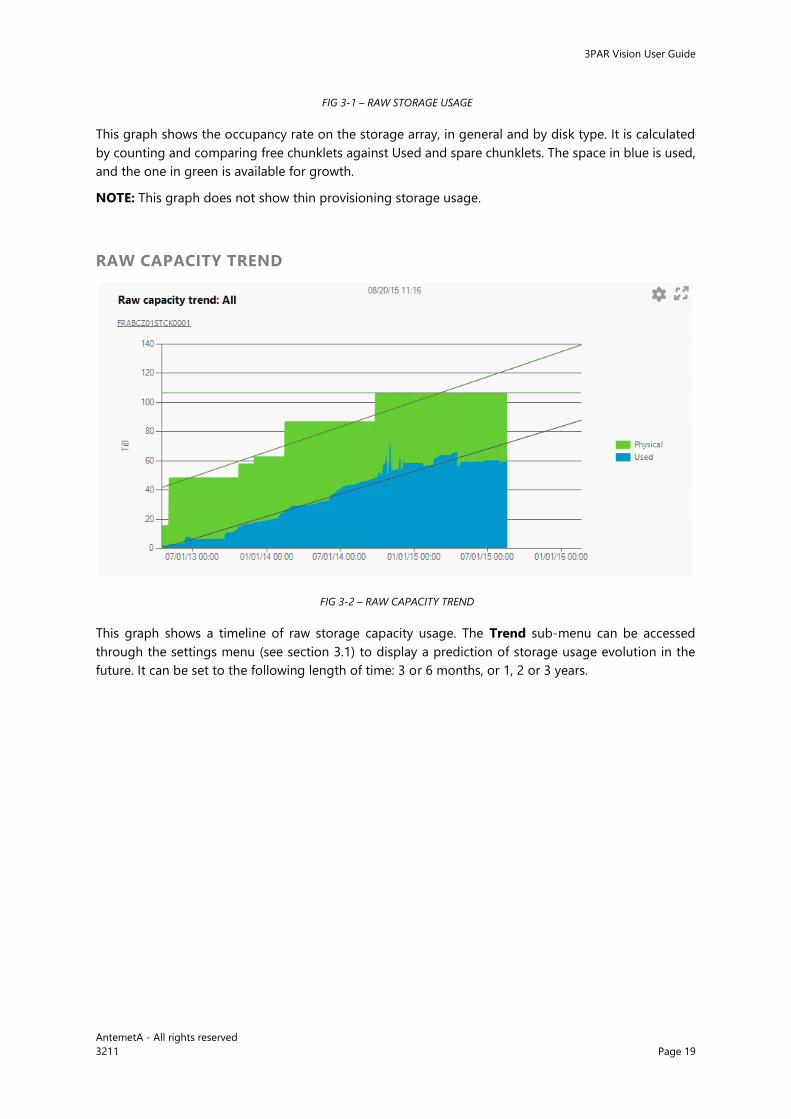
FIG 3-2 – RAW CAPACITY TREND
This graph shows a timeline of raw storage capacity usage. The Trend sub-menu can be accessed
through the settings menu (see section 3.1) to display a prediction of storage usage evolution in the
future. It can be set to the following length of time: 3 or 6 months, or 1, 2 or 3 years.
3PAR Vision User Guide
AntemetA - All rights reserved
3211 Page 20
CONSOLIDATED CAPACITY
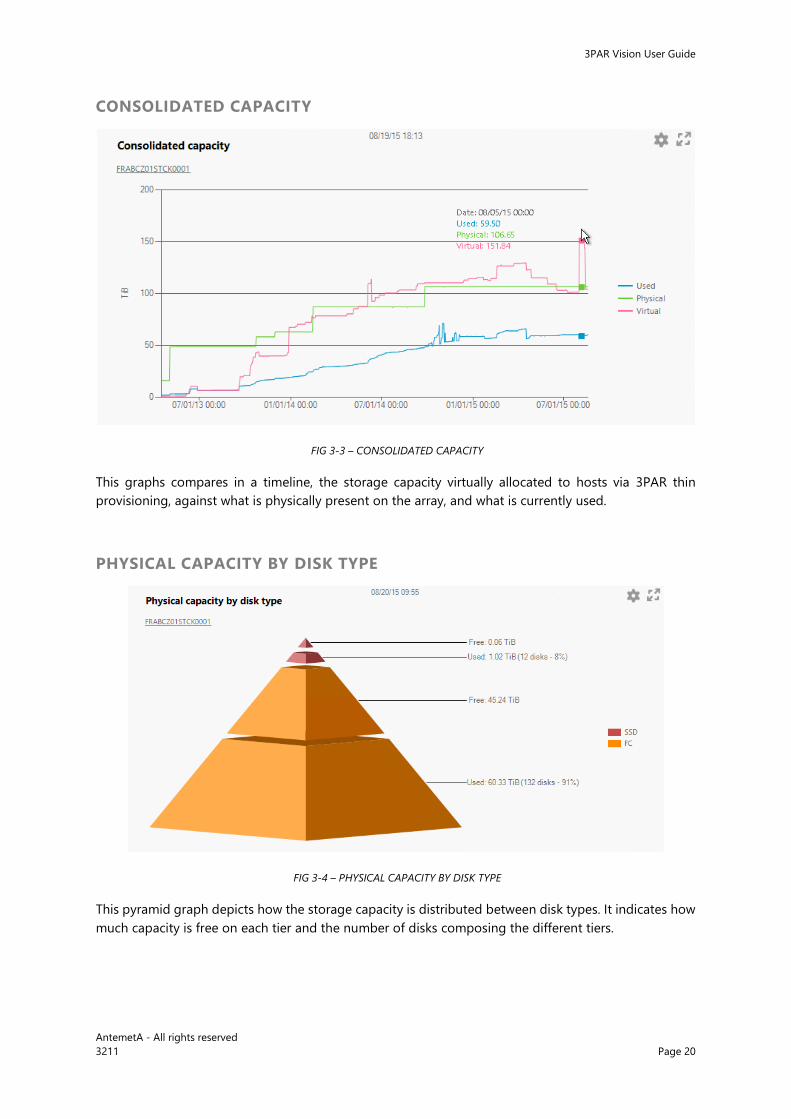
FIG 3-3 – CONSOLIDATED CAPACITY
This graphs compares in a timeline, the storage capacity virtually allocated to hosts via 3PAR thin
provisioning, against what is physically present on the array, and what is currently used.
PHYSICAL CAPACITY BY DISK TYPE
FIG 3-4 – PHYSICAL CAPACITY BY DISK TYPE
This pyramid graph depicts how the storage capacity is distributed between disk types. It indicates how
much capacity is free on each tier and the number of disks composing the different tiers.
3PAR Vision User Guide
AntemetA - All rights reserved
3211 Page 21
VOLUME CAPACITY
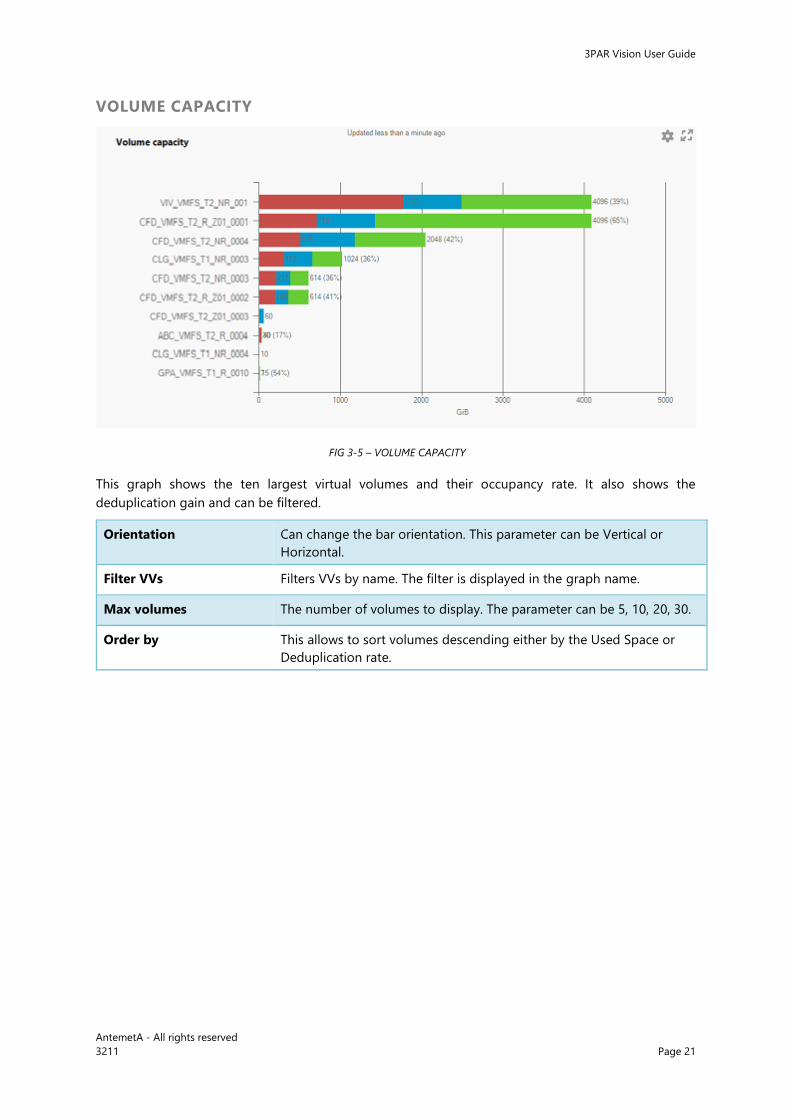
FIG 3-5 – VOLUME CAPACITY
This graph shows the ten largest virtual volumes and their occupancy rate. It also shows the
deduplication gain and can be filtered.
Orientation Can change the bar orientation. This parameter can be Vertical or
Horizontal.
Filter VVs Filters VVs by name. The filter is displayed in the graph name.
Max volumes The number of volumes to display. The parameter can be 5, 10, 20, 30.
Order by This allows to sort volumes descending either by the Used Space or
Deduplication rate.
3PAR Vision User Guide
AntemetA - All rights reserved
3211 Page 22
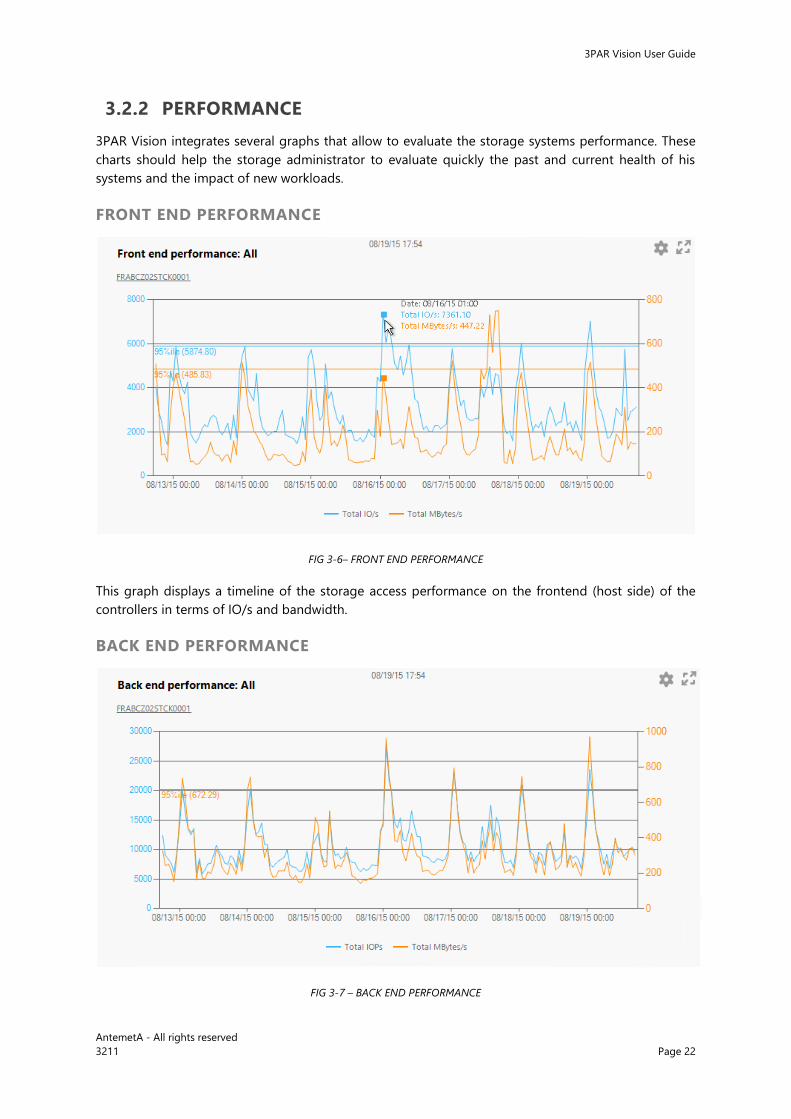
3.2.2 PERFORMANCE
3PAR Vision integrates several graphs that allow to evaluate the storage systems performance. These
charts should help the storage administrator to evaluate quickly the past and current health of his
systems and the impact of new workloads.
FRONT END PERFORMANCE
FIG 3-6– FRONT END PERFORMANCE
This graph displays a timeline of the storage access performance on the frontend (host side) of the
controllers in terms of IO/s and bandwidth.
BACK END PERFORMANCE
FIG 3-7 – BACK END PERFORMANCE
3PAR Vision User Guide
AntemetA - All rights reserved
3211 Page 23
This graph displays a timeline of the backend (disk side) access performance on the storage array in
terms of IO/s and bandwidth.
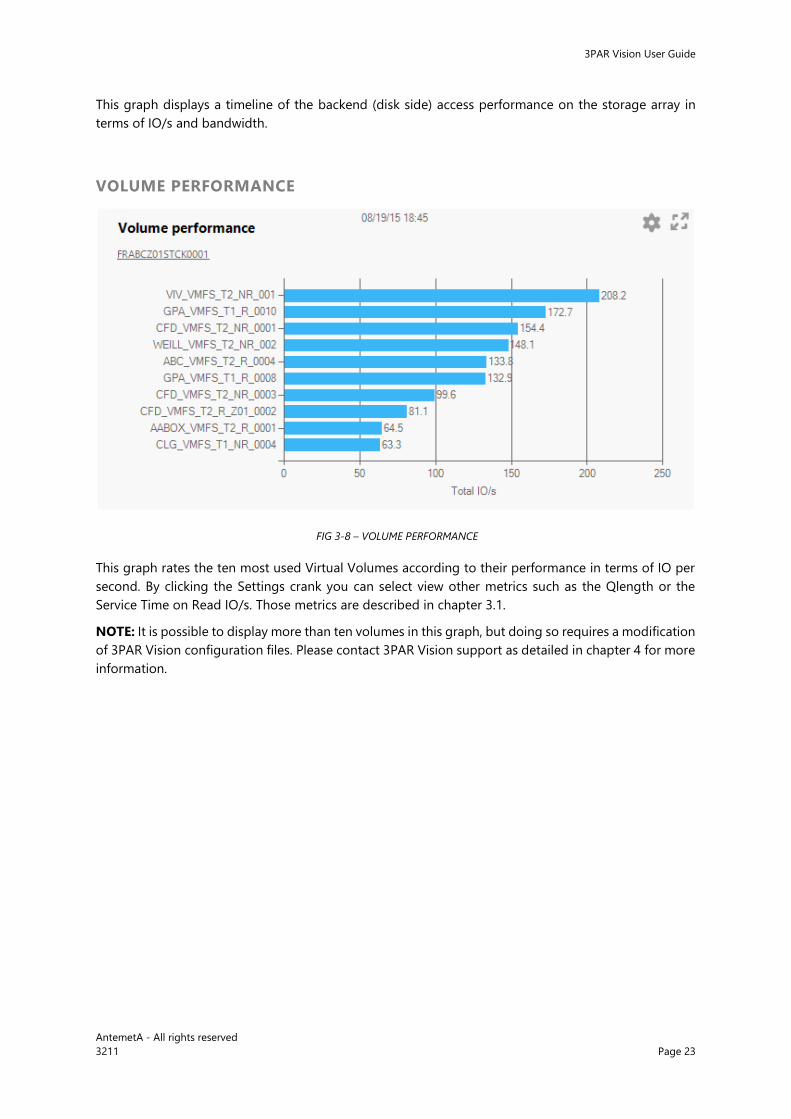
VOLUME PERFORMANCE
FIG 3-8 – VOLUME PERFORMANCE
This graph rates the ten most used Virtual Volumes according to their performance in terms of IO per
second. By clicking the Settings crank you can select view other metrics such as the Qlength or the
Service Time on Read IO/s. Those metrics are described in chapter 3.1.
NOTE: It is possible to display more than ten volumes in this graph, but doing so requires a modification
of 3PAR Vision configuration files. Please contact 3PAR Vision support as detailed in chapter 4 for more
information.
3PAR Vision User Guide
AntemetA - All rights reserved
3211 Page 24
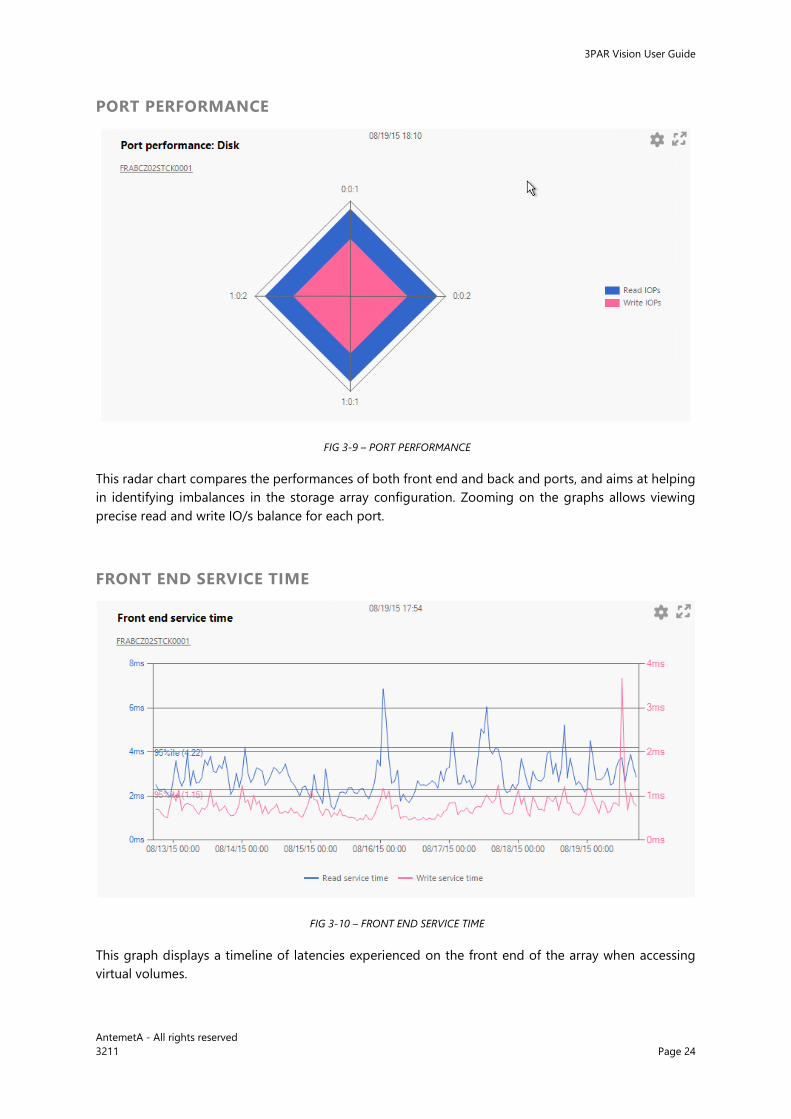
PORT PERFORMANCE
FIG 3-9 – PORT PERFORMANCE
This radar chart compares the performances of both front end and back and ports, and aims at helping
in identifying imbalances in the storage array configuration. Zooming on the graphs allows viewing
precise read and write IO/s balance for each port.
FRONT END SERVICE TIME
FIG 3-10 – FRONT END SERVICE TIME
This graph displays a timeline of latencies experienced on the front end of the array when accessing
virtual volumes.
3PAR Vision User Guide
AntemetA - All rights reserved
3211 Page 25
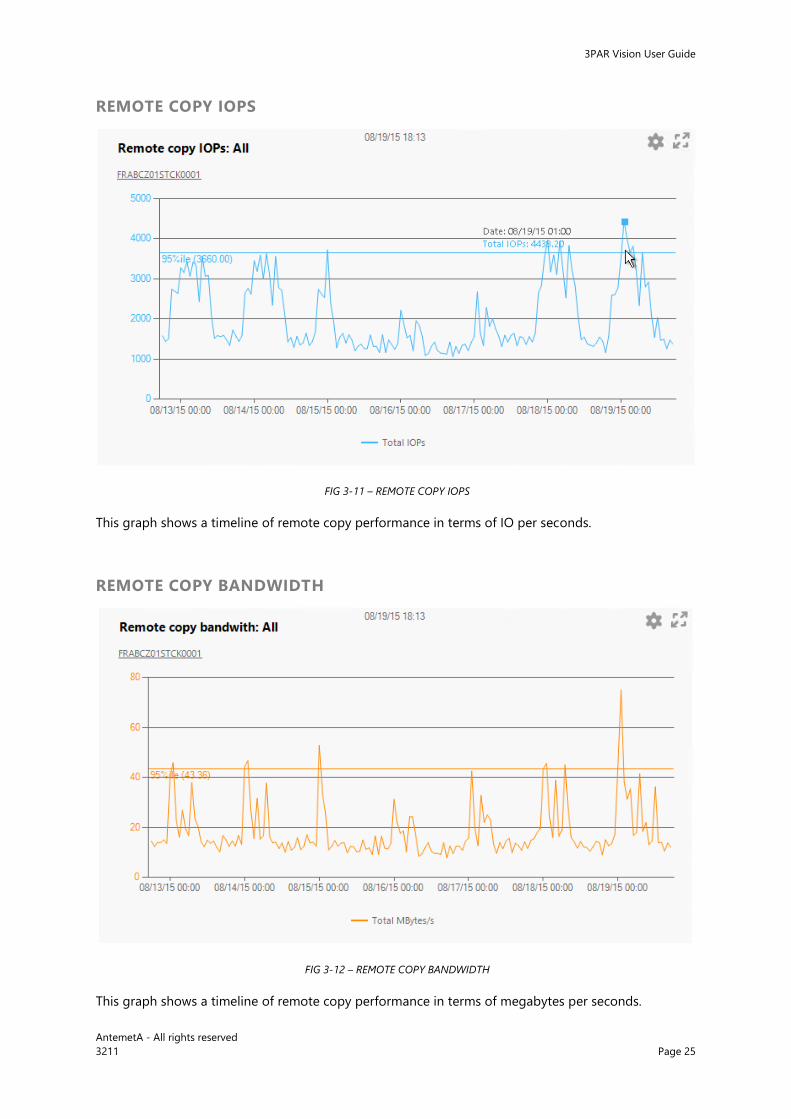
REMOTE COPY IOPS
FIG 3-11 – REMOTE COPY IOPS
This graph shows a timeline of remote copy performance in terms of IO per seconds.
REMOTE COPY BANDWIDTH
FIG 3-12 – REMOTE COPY BANDWIDTH
This graph shows a timeline of remote copy performance in terms of megabytes per seconds.
3PAR Vision User Guide
AntemetA - All rights reserved
3211 Page 26
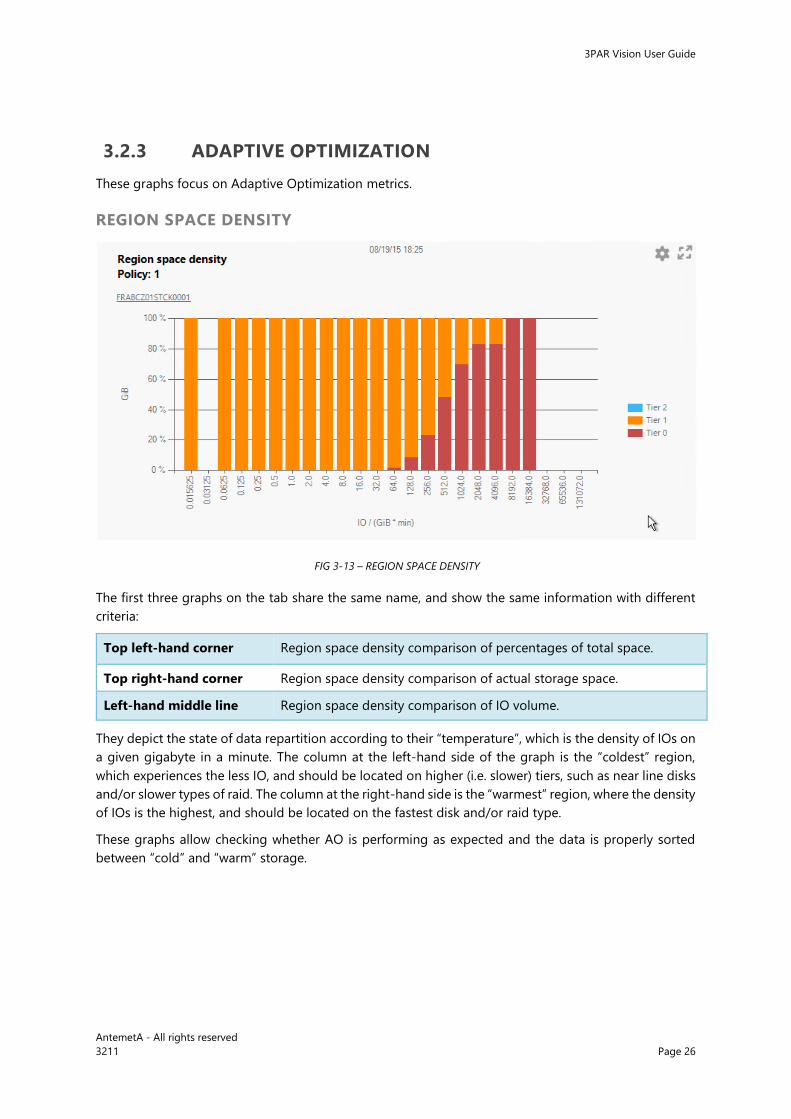
3.2.3 ADAPTIVE OPTIMIZATION
These graphs focus on Adaptive Optimization metrics.
REGION SPACE DENSITY
FIG 3-13 – REGION SPACE DENSITY
The first three graphs on the tab share the same name, and show the same information with different
criteria:
Top left-hand corner Region space density comparison of percentages of total space.
Top right-hand corner Region space density comparison of actual storage space.
Left-hand middle line Region space density comparison of IO volume.
They depict the state of data repartition according to their “temperature”, which is the density of IOs on
a given gigabyte in a minute. The column at the left-hand side of the graph is the “coldest” region,
which experiences the less IO, and should be located on higher (i.e. slower) tiers, such as near line disks
and/or slower types of raid. The column at the right-hand side is the “warmest” region, where the density
of IOs is the highest, and should be located on the fastest disk and/or raid type.
These graphs allow checking whether AO is performing as expected and the data is properly sorted
between “cold” and “warm” storage.
3PAR Vision User Guide
AntemetA - All rights reserved
3211 Page 27
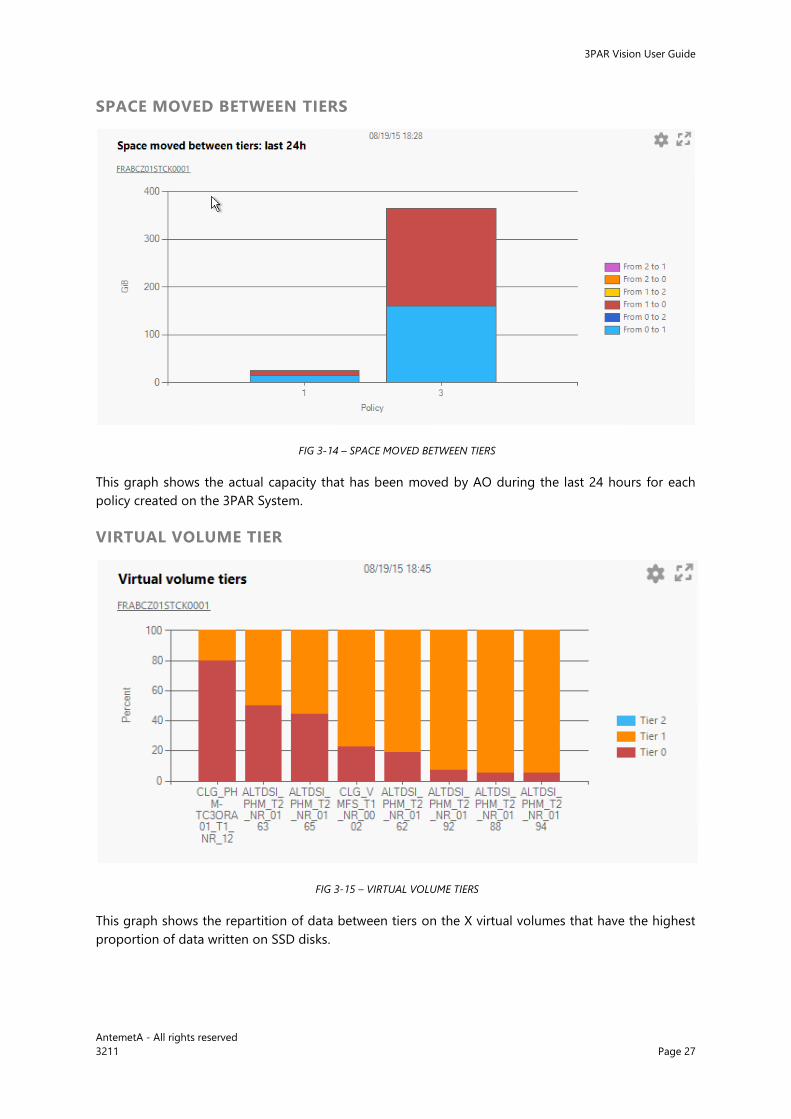
SPACE MOVED BETWEEN TIERS
FIG 3-14 – SPACE MOVED BETWEEN TIERS
This graph shows the actual capacity that has been moved by AO during the last 24 hours for each
policy created on the 3PAR System.
VIRTUAL VOLUME TIER
FIG 3-15 – VIRTUAL VOLUME TIERS
This graph shows the repartition of data between tiers on the X virtual volumes that have the highest
proportion of data written on SSD disks.
3PAR Vision User Guide
AntemetA - All rights reserved
3211 Page 28
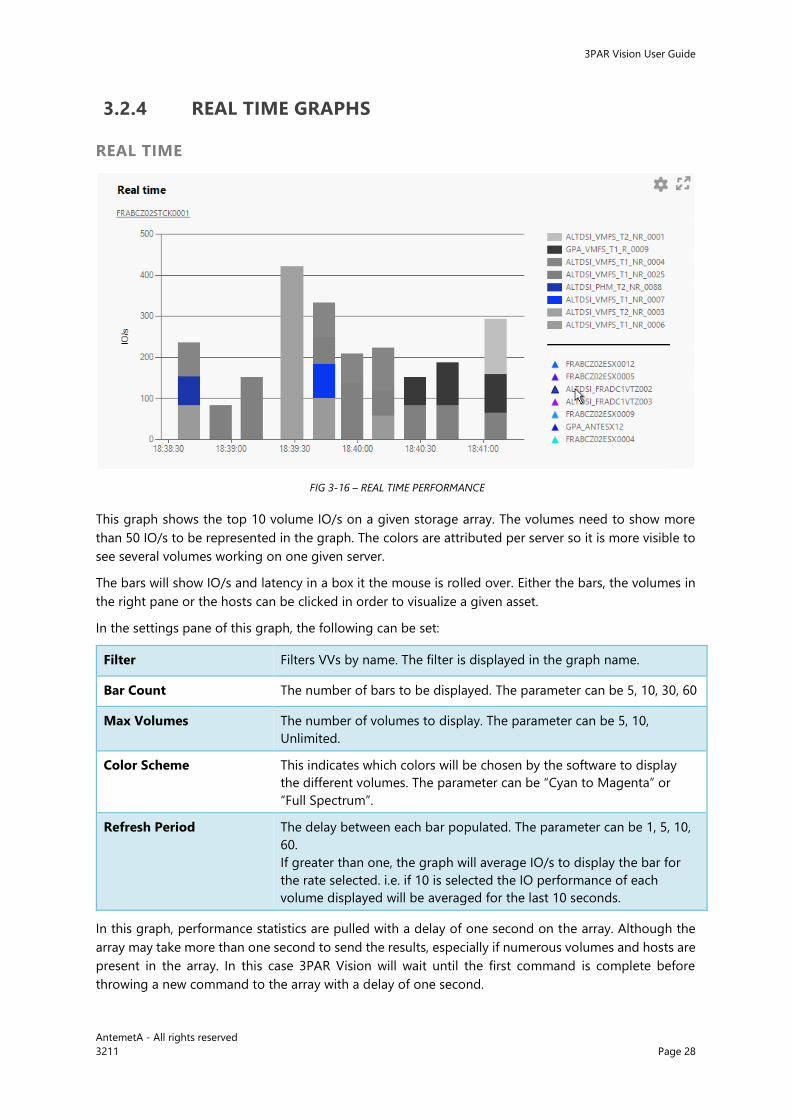
3.2.4 REAL TIME GRAPHS
REAL TIME
FIG 3-16 – REAL TIME PERFORMANCE
This graph shows the top 10 volume IO/s on a given storage array. The volumes need to show more
than 50 IO/s to be represented in the graph. The colors are attributed per server so it is more visible to
see several volumes working on one given server.
The bars will show IO/s and latency in a box it the mouse is rolled over. Either the bars, the volumes in
the right pane or the hosts can be clicked in order to visualize a given asset.
In the settings pane of this graph, the following can be set:
Filter Filters VVs by name. The filter is displayed in the graph name.
Bar Count The number of bars to be displayed. The parameter can be 5, 10, 30, 60
Max Volumes The number of volumes to display. The parameter can be 5, 10,
Unlimited.
Color Scheme This indicates which colors will be chosen by the software to display
the different volumes. The parameter can be “Cyan to Magenta” or
“Full Spectrum”.
Refresh Period The delay between each bar populated. The parameter can be 1, 5, 10,
60.
If greater than one, the graph will average IO/s to display the bar for
the rate selected. i.e. if 10 is selected the IO performance of each
volume displayed will be averaged for the last 10 seconds.
In this graph, performance statistics are pulled with a delay of one second on the array. Although the
array may take more than one second to send the results, especially if numerous volumes and hosts are
present in the array. In this case 3PAR Vision will wait until the first command is complete before
throwing a new command to the array with a delay of one second.
3PAR Vision User Guide
AntemetA - All rights reserved
3211 Page 29
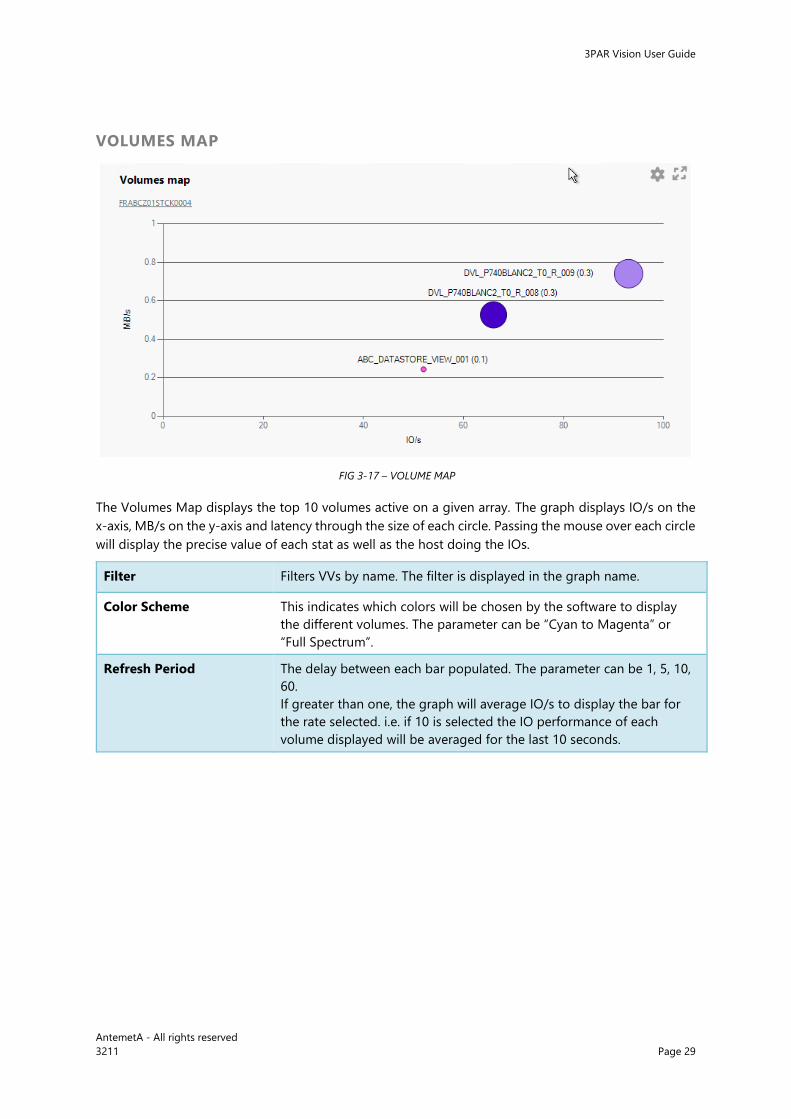
VOLUMES MAP
FIG 3-17 – VOLUME MAP
The Volumes Map displays the top 10 volumes active on a given array. The graph displays IO/s on the
x-axis, MB/s on the y-axis and latency through the size of each circle. Passing the mouse over each circle
will display the precise value of each stat as well as the host doing the IOs.
Filter Filters VVs by name. The filter is displayed in the graph name.
Color Scheme This indicates which colors will be chosen by the software to display
the different volumes. The parameter can be “Cyan to Magenta” or
“Full Spectrum”.
Refresh Period The delay between each bar populated. The parameter can be 1, 5, 10,
60.
If greater than one, the graph will average IO/s to display the bar for
the rate selected. i.e. if 10 is selected the IO performance of each
volume displayed will be averaged for the last 10 seconds.
3PAR Vision User Guide
AntemetA - All rights reserved
3211 Page 30
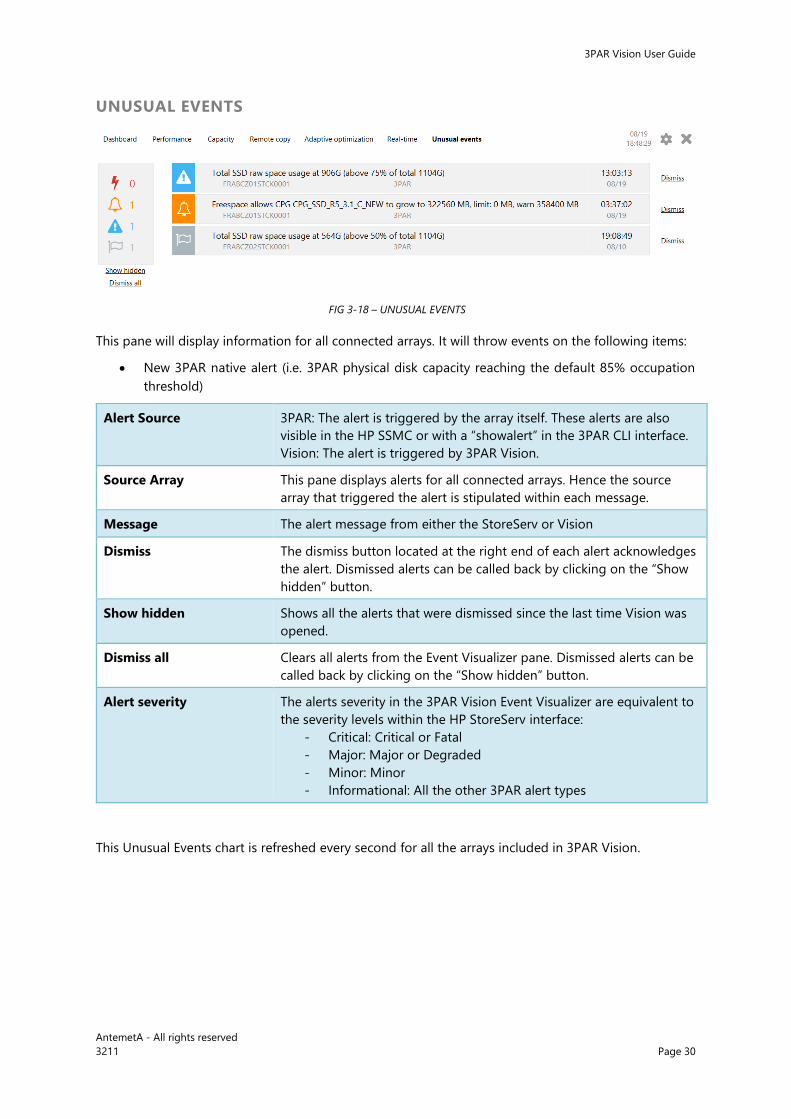
UNUSUAL EVENTS
FIG 3-18 – UNUSUAL EVENTS
This pane will display information for all connected arrays. It will throw events on the following items:
New 3PAR native alert (i.e. 3PAR physical disk capacity reaching the default 85% occupation
threshold)
Alert Source 3PAR: The alert is triggered by the array itself. These alerts are also
visible in the HP SSMC or with a “showalert” in the 3PAR CLI interface.
Vision: The alert is triggered by 3PAR Vision.
Source Array This pane displays alerts for all connected arrays. Hence the source
array that triggered the alert is stipulated within each message.
Message The alert message from either the StoreServ or Vision
Dismiss The dismiss button located at the right end of each alert acknowledges
the alert. Dismissed alerts can be called back by clicking on the “Show
hidden” button.
Show hidden Shows all the alerts that were dismissed since the last time Vision was
opened.
Dismiss all Clears all alerts from the Event Visualizer pane. Dismissed alerts can be
called back by clicking on the “Show hidden” button.
Alert severity The alerts severity in the 3PAR Vision Event Visualizer are equivalent to
the severity levels within the HP StoreServ interface:
- Critical: Critical or Fatal
- Major: Major or Degraded
- Minor: Minor
- Informational: All the other 3PAR alert types
This Unusual Events chart is refreshed every second for all the arrays included in 3PAR Vision.
3PAR Vision User Guide
AntemetA - All rights reserved
3211 Page 31
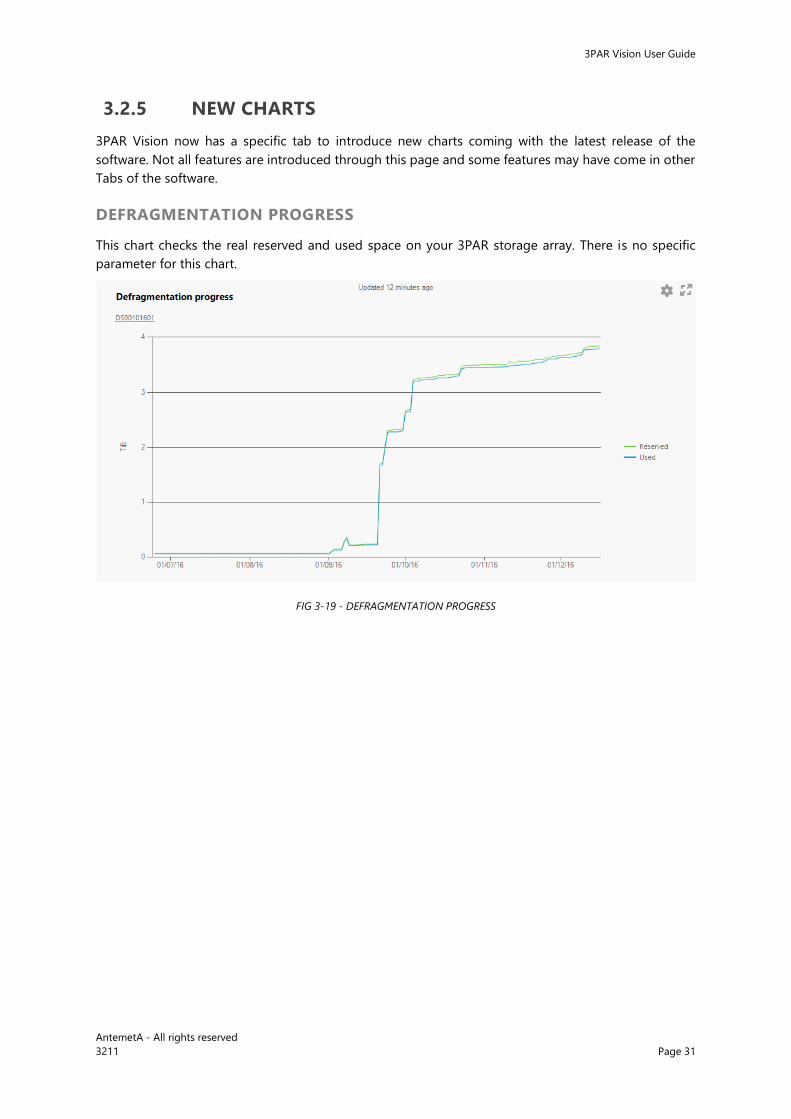
3.2.5 NEW CHARTS
3PAR Vision now has a specific tab to introduce new charts coming with the latest release of the
software. Not all features are introduced through this page and some features may have come in other
Tabs of the software.
DEFRAGMENTATION PROGRESS
This chart checks the real reserved and used space on your 3PAR storage array. There is no specific
parameter for this chart.
FIG 3-19 - DEFRAGMENTATION PROGRESS
3PAR Vision User Guide
AntemetA - All rights reserved
3211 Page 32
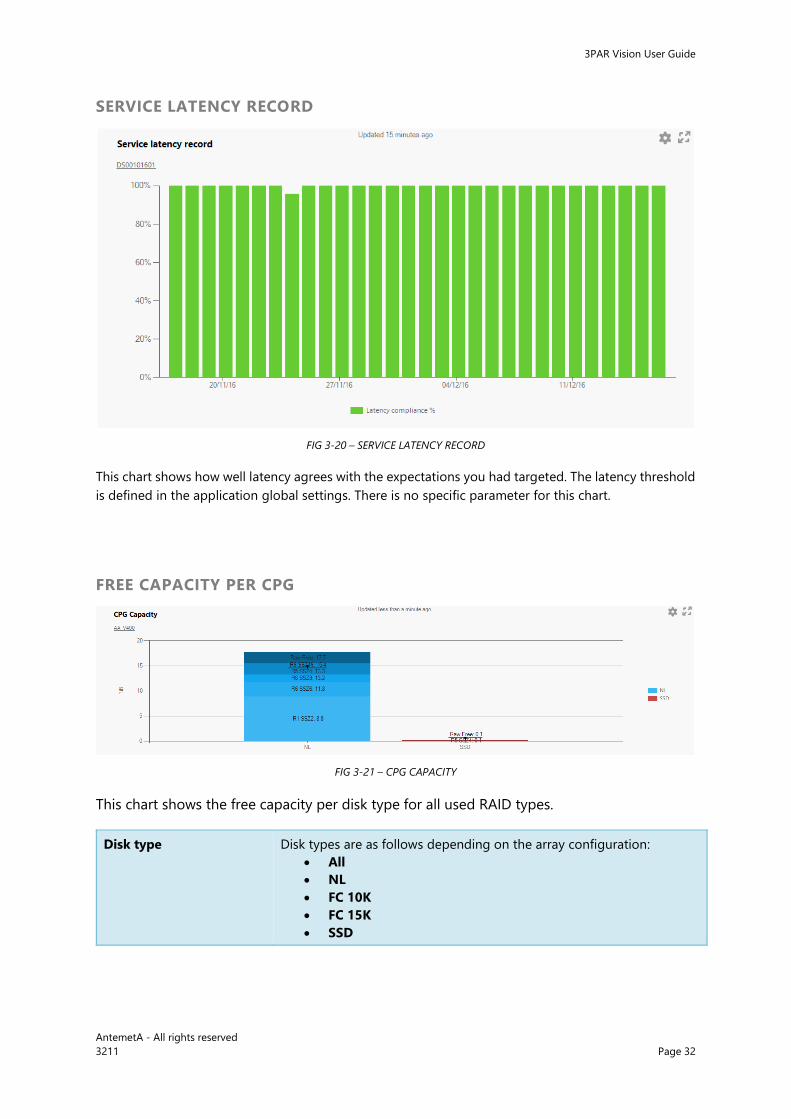
SERVICE LATENCY RECORD
FIG 3-20 – SERVICE LATENCY RECORD
This chart shows how well latency agrees with the expectations you had targeted. The latency threshold
is defined in the application global settings. There is no specific parameter for this chart.
FREE CAPACITY PER CPG
FIG 3-21 – CPG CAPACITY
This chart shows the free capacity per disk type for all used RAID types.
Disk type Disk types are as follows depending on the array configuration:
All
NL
FC 10K
FC 15K
SSD
3PAR Vision User Guide
AntemetA - All rights reserved
3211 Page 33
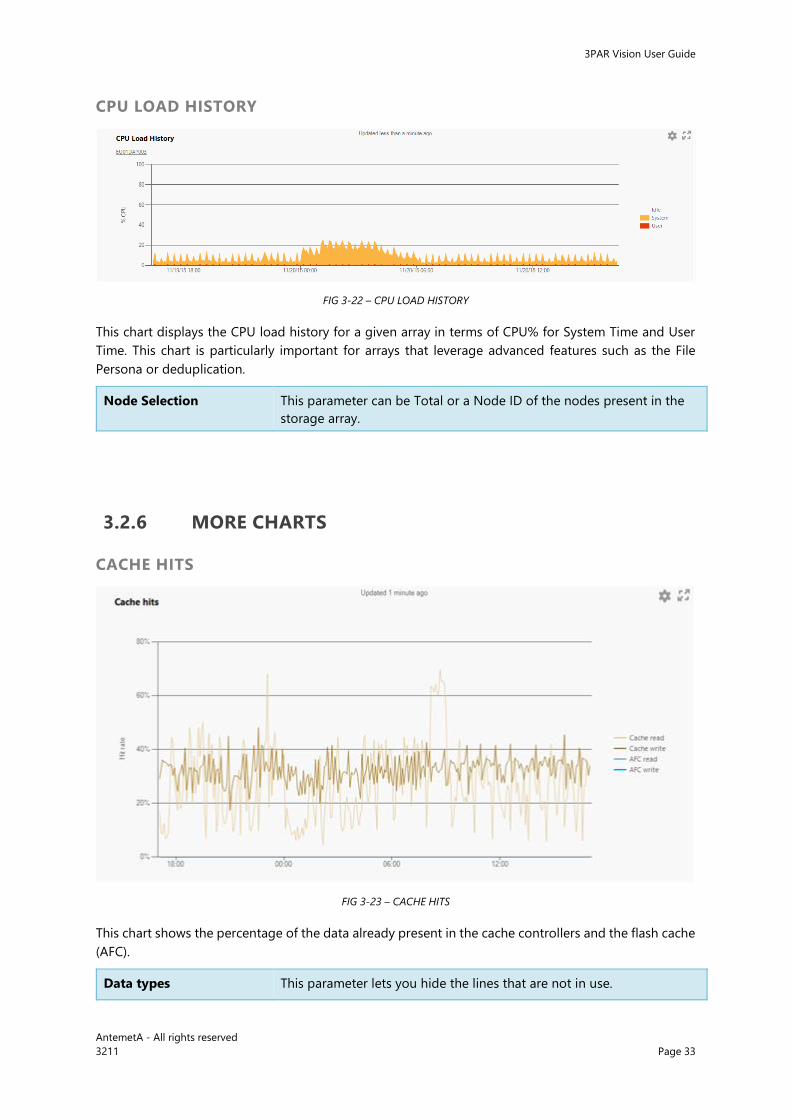
CPU LOAD HISTORY
FIG 3-22 – CPU LOAD HISTORY
This chart displays the CPU load history for a given array in terms of CPU% for System Time and User
Time. This chart is particularly important for arrays that leverage advanced features such as the File
Persona or deduplication.
Node Selection This parameter can be Total or a Node ID of the nodes present in the
storage array.
3.2.6 MORE CHARTS
CACHE HITS
FIG 3-23 – CACHE HITS
This chart shows the percentage of the data already present in the cache controllers and the flash cache
(AFC).
Data types This parameter lets you hide the lines that are not in use.
3PAR Vision User Guide
AntemetA - All rights reserved
3211 Page 34
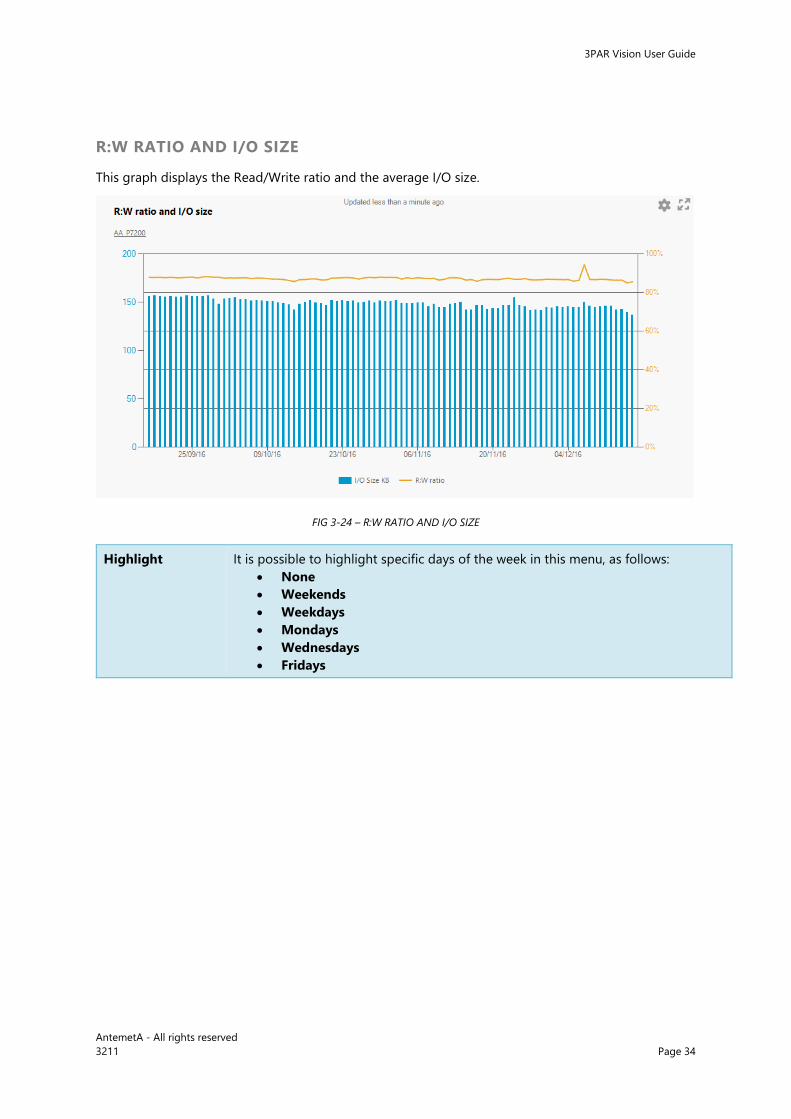
R:W RATIO AND I/O SIZE
This graph displays the Read/Write ratio and the average I/O size.
FIG 3-24 – R:W RATIO AND I/O SIZE
Highlight It is possible to highlight specific days of the week in this menu, as follows:
None
Weekends
Weekdays
Mondays
Wednesdays
Fridays
3PAR Vision User Guide
AntemetA - All rights reserved
3211 Page 35
3.3 SCHEDULED REPORT
Vision can be used to generate off-screen reports. You need to setup the “Report” group in
the settings panel before using this feature (see: 2.3.4 – Report). All the settings are used when
generating an off-screen report;, if you removed or hid some charts from the “Layouter”, those
won’t appear in the final report.
MANUALLY
You need to call “Vision.exe” with the “/report” parameter from a command line or a shortcut.
Example: “C:\Program Files (x86)\AntemetA\3PAR Vision\Vision.exe' /report”
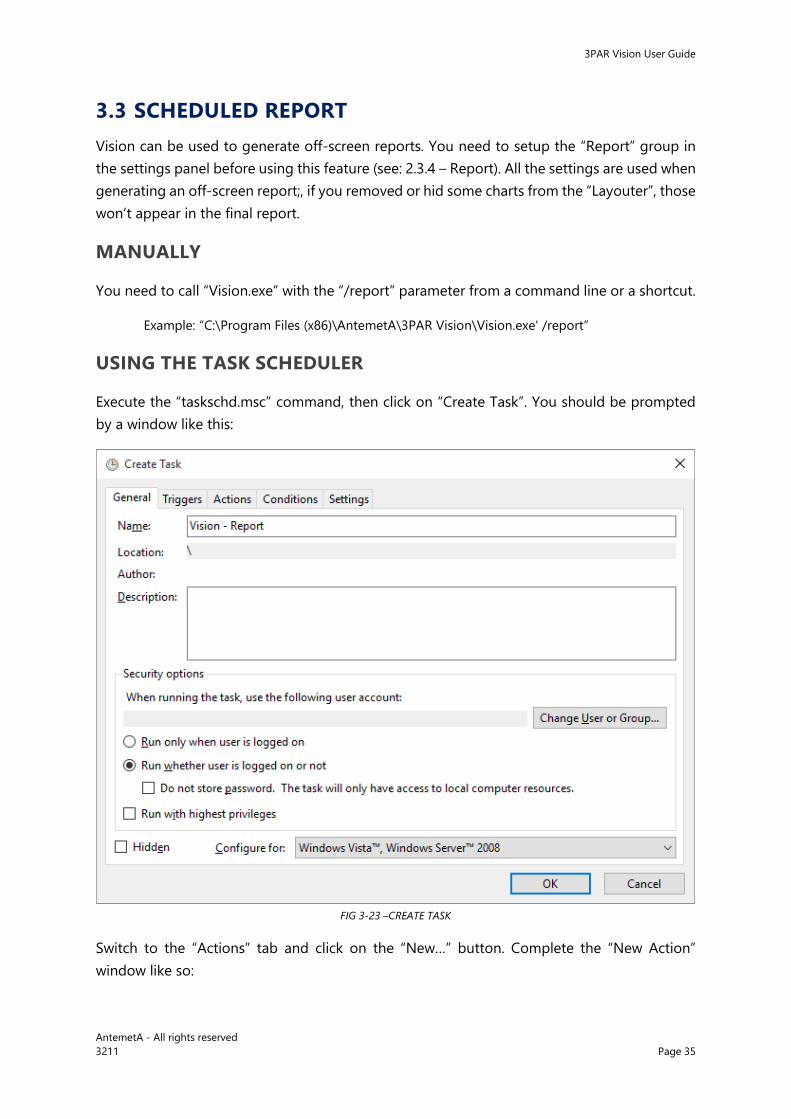
USING THE TASK SCHEDULER
Execute the “taskschd.msc” command, then click on “Create Task”. You should be prompted
by a window like this:
FIG 3-23 –CREATE TASK
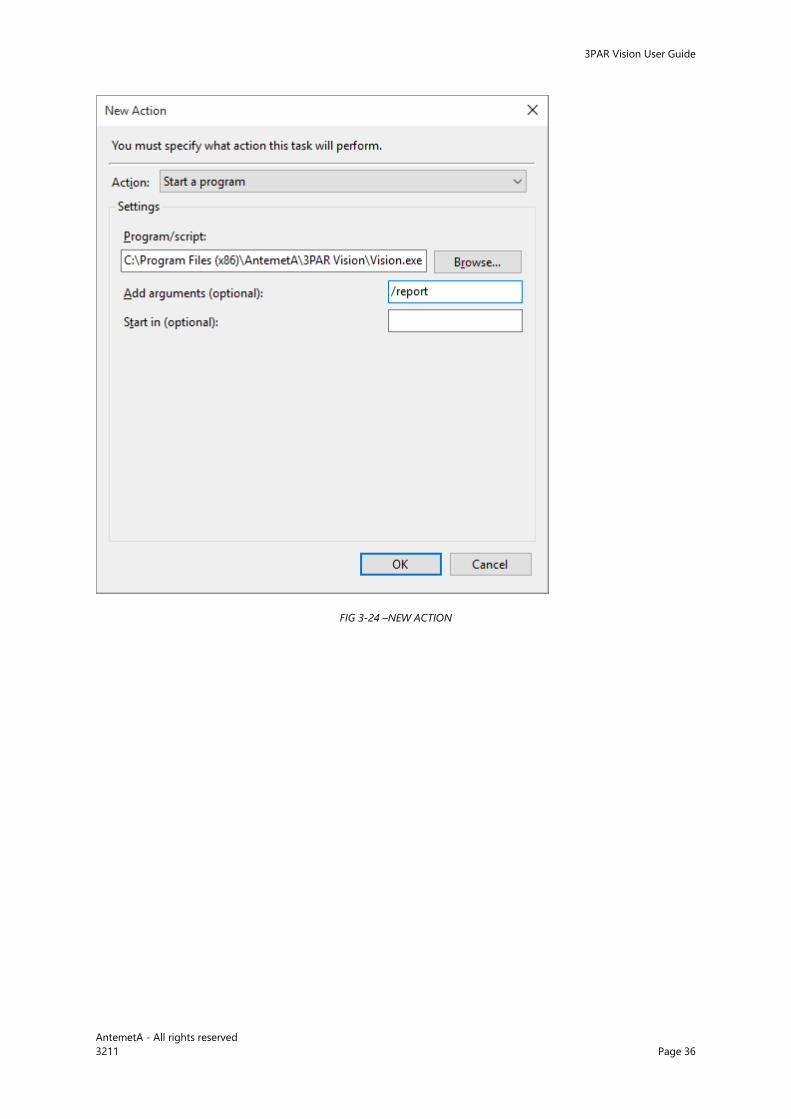
Switch to the “Actions” tab and click on the “New…” button. Complete the “New Action”
window like so:
3PAR Vision User Guide
AntemetA - All rights reserved
3211 Page 36
FIG 3-24 –NEW ACTION

3PAR Vision User Guide
AntemetA - All rights reserved
3211 Page 37
4. CONTACT
3PAR Vision comes with a standard 5/7 next business day support agreement.
For all support related questions please contact [email protected]
For all sales related questions please contact [email protected]
Some specific support agreement may have been provided by your local reseller. In that case, please
contact your sales representative.