
3G.3 FUEL BUILDING The objective of this subsection is to ...
248
3-1276 Revision 0 October 2015 Fermi 3 Updated Final Safety Analysis Report 3G.3 FUEL BUILDING 3G.3.1 Objective and Scope The objective of this subsection is to document the structural design details, inputs and analytical results from the analysis of the FB of the standard ESBWR plant. The scope includes the design and analysis of the structure for normal, severe environmental, extreme environmental, and construction loads. 3G.3.2 Conclusions The following are the major summary conclusions on the design and analysis of the FB. • Based on the results of finite element analyses performed in accordance with the design conditions identified in Subsection 3G.3.5, stresses in concrete and reinforcement are less than the allowable stresses per the applicable regulations, codes or standards listed in Section 3.8.4. • The factors of safety against floatation, sliding, and overturning of the structure under various loading combinations are higher than the required minimum. • The thickness of the roof slabs and exterior walls are more than the minimum required to preclude penetration, perforation or spalling resulting from impact of design basis tornado missiles. 3G.3.3 Structural Description The FB is integrated with the RB, sharing a common wall between the RB and the FB and a large common foundation mat (see Subsection 3.8.4.1.3). The FB houses the spent fuel pool facilities and their supporting system, and HVAC equipment. The FB is a Seismic Category I structure except for the penthouse that covers HVAC equipment. The penthouse is a Seismic Category II structure. The FB is a reinforced concrete box type shear wall structure consisting of walls and slabs and is supported by a foundation mat. Concrete framing (steel beams can be used partially) is composite with concrete slab and used to support the slabs for vertical loads. The FB is a shear wall structure designed to accommodate all seismic loads with its walls and the connected floors. Therefore, frame members such as beams or columns are designed to accommodate deformations of the walls in case of earthquake conditions. The key dimensions of the FB are summarized in Table 3.8-8. Figures 3G.1-1 through 3G.1-4 and Figure 3G.1-6. show the outline plans of the FB. 3G.3.4 Analytical Models Because the FB is integrated with the RB, the finite element model which integrates the RB and FB is used for the stress analysis of the FB. The analysis model is described in Subsection 3G.1.4.1.
Transcript of 3G.3 FUEL BUILDING The objective of this subsection is to ...

3-1276 Revision 0October 2015
Fermi 3Updated Final Safety Analysis Report
3G.3 FUEL BUILDING
3G.3.1 Objective and Scope
The objective of this subsection is to document the structural design details, inputs and analytical
results from the analysis of the FB of the standard ESBWR plant. The scope includes the design
and analysis of the structure for normal, severe environmental, extreme environmental, and
construction loads.
3G.3.2 Conclusions
The following are the major summary conclusions on the design and analysis of the FB.
• Based on the results of finite element analyses performed in accordance with the design
conditions identified in Subsection 3G.3.5, stresses in concrete and reinforcement are less than
the allowable stresses per the applicable regulations, codes or standards listed in Section 3.8.4.
• The factors of safety against floatation, sliding, and overturning of the structure under various
loading combinations are higher than the required minimum.
• The thickness of the roof slabs and exterior walls are more than the minimum required to
preclude penetration, perforation or spalling resulting from impact of design basis tornado
missiles.
3G.3.3 Structural Description
The FB is integrated with the RB, sharing a common wall between the RB and the FB and a large
common foundation mat (see Subsection 3.8.4.1.3). The FB houses the spent fuel pool facilities
and their supporting system, and HVAC equipment. The FB is a Seismic Category I structure
except for the penthouse that covers HVAC equipment. The penthouse is a Seismic Category II
structure.
The FB is a reinforced concrete box type shear wall structure consisting of walls and slabs and is
supported by a foundation mat. Concrete framing (steel beams can be used partially) is composite
with concrete slab and used to support the slabs for vertical loads. The FB is a shear wall structure
designed to accommodate all seismic loads with its walls and the connected floors. Therefore,
frame members such as beams or columns are designed to accommodate deformations of the
walls in case of earthquake conditions.
The key dimensions of the FB are summarized in Table 3.8-8. Figures 3G.1-1 through 3G.1-4 and
Figure 3G.1-6. show the outline plans of the FB.
3G.3.4 Analytical Models
Because the FB is integrated with the RB, the finite element model which integrates the RB and FB
is used for the stress analysis of the FB. The analysis model is described in Subsection 3G.1.4.1.

3-1277 Revision 0October 2015
Fermi 3Updated Final Safety Analysis Report
3G.3.5 Structural Analysis and Design
3G.3.5.1 Site Design Parameters
The key site design parameters are referenced in Subsection 3G.1.5.1.
3G.3.5.2 Design Loads, Load Combinations, and Material Properties
3G.3.5.2.1 Design Loads
This section presents only the loads which are applied to the FB directly. Other loads which are
applied to the RCCV only but have effects on FB structures because of common foundation mat,
like Pa and Ta, are also considered in the FB design. The containment hydrodynamic loads are also
considered but their effects are negligibly small on the FB design.
3G.3.5.2.1.1 Dead Load (D) and Live Load (L and Lo)
The weights of structures are evaluated using the following unit weights.
• reinforced concrete: 23.5 kN/m3 (150 lbf/ft3)
• steel: 77.0 kN/m3 (490 lbf/ft3)
Weights of major equipment, miscellaneous structures, piping, and commodities are summarized in
Tables 3G.3-1 and 3G.3-2.
Live loads on the FB floor and roof slabs are described in Subsection 3.8.4.3.3.
3G.3.5.2.1.2 Snow and Rain Load
The snow and rain load is applied to the roof slab and is taken as shown in Table 3G.1-2.
3G.3.5.2.1.3 Lateral Soil Pressure at Rest
The lateral soil pressure at rest is applied to the walls below grade and is based on soil properties
given in Table 3G.1-2. Pressures to be applied to the walls are provided in Figure 3G.1-19..
3G.3.5.2.1.4 Wind Load (W)
The wind load is applied to the roof slab and external walls above grade and is based on basic wind
speed given in Table 3G.1-2.
3G.3.5.2.1.5 Tornado Load (Wt)
The tornado load is applied to roof slab and external walls above grade and its characteristics are
given in Table 3G.1-2. The tornado load, Wt is further defined by the combinations described in
Subsection 3G.1.5.2.1.5.
3G.3.5.2.1.6 Thermal Load
Thermal loads for the FB are evaluated for the normal operating conditions and accident conditions.
The accident thermal load, Ta, includes the thermal effects in the spent fuel pool which may occur

3-1278 Revision 0October 2015
Fermi 3Updated Final Safety Analysis Report
due to loss of the Fuel and Auxiliary Pools Cooling System (FAPCS). The effect is included in the
load combination Nos. 8 and 9 in Table 3.8-15. Figure 3G.3-1. shows the section location for
temperature distributions for various structural elements of the FB, and Table 3G.3-3 shows the
magnitude of equivalent linear temperature distribution.
The evaluation method of temperature effect on the concrete design is based on ACI 349-01
Commentary Figure RA.1.
Two cases, winter and summer, are considered in the analysis.
Stress-free temperature is 15.5°C (60°F).
3G.3.5.2.1.7 Design Seismic Loads
The design seismic loads applied to the FB are provided in Subsection 3G.1.5.2.1.13.
Seismic lateral soil pressure for the FB is provided in Subsection 3G.1.5.2.1.13.
3G.3.5.2.2 Load Combinations and Acceptance Criteria
Load combinations and acceptance criteria for the FB concrete structures are described in
Subsections 3.8.4.3.3 and 3.8.4.5.3, respectively. Based on previous experience, critical load
combinations are selected for the FB design. They are mainly combinations including LOCA loads
and seismic loads as shown in Table 3G.3-4. The acceptance criteria for the selected combinations
are also included in Table 3G.3-4.
3G.3.5.2.3 Material Properties
Properties of the materials used for the FB design analyses are the same as those for the RB, and
they are described in Subsection 3G.1.5.2.3.
3G.3.5.3 Stability Requirements
The stability requirements for the FB foundation are the same as the RB and are described in
Subsections 3G.1.5.3 and 3G.1.5.5.
3G.3.5.4 Structural Design Evaluation
The evaluation of the seismic Category I structures in the FB is performed with the same procedure
as the RB, which is described in Subsection 3G.1.5.4.
Figure 3G.3-2. shows the location of the sections that are selected for evaluation. They are
selected, in principle, from the center and both ends of wall and slab, where it is reasonably
expected that the critical stresses appear based on engineering experience and judgment.
Tables 3G.3-5 through 3G.3-9 show the forces and moments at the selected sections from
NASTRAN analysis. Element forces and moments listed in the tables are defined with relation to
the element coordinate system shown in Figure 3G.3-3.. Tables 3G.3-10 through 3G.3-12 show the

3-1279 Revision 0October 2015
Fermi 3Updated Final Safety Analysis Report
combined forces and moments in accordance with the selected load combinations listed in
Table 3G.3-4.
Figures 3G.3-4 and 3G.3-5 present the design drawings used for the evaluation of the FB structural
design. Table 3G.3-13 lists the sectional thicknesses and rebar ratios used in the evaluation.
Tables 3G.3-14 through 3G.3-16 show the rebar and concrete stresses at these sections for the
representative elements. Table 3G.3-17 summarizes evaluation results for transverse shear in
accordance with ACI 349, Chapter 11.
3G.3.5.4.1 Shear Walls and Spent Fuel Pool Walls
The maximum rebar stress of 322.8 MPa (46.82 ksi) is found in the vertical rebar at Section 2 due
to the load combination FB-9 as shown in Table 3G.3-16. The maximum horizontal rebar stress is
found to be 316.9 MPa (45.96 ksi) at Section 2 for the combination FB-9. The maximum transverse
shear force is found to be 3.91 MN/m (22.3kips/in) against the shear strength of 5.96 MN/m
(34.0 kips/in) at Section 4, Spent Fuel Pool wall.
3G.3.5.4.2 Floor Slabs
The maximum rebar stress of 156.2 MPa (22.65 ksi) is found due to the load combination FB-9 as
shown in Table 3G.3-16. The maximum transverse shear force is found to be 1.08 MN/m
(6.17 kips/in) against the shear strength of 4.44 MN/m (25.4 kips/in).
3G.3.5.4.3 Foundation Mat
The maximum rebar stress is found to be 333.0 MPa (48.30 ksi) due to the load combination FB-9
as shown in Table 3G.3-16. The maximum transverse shear force is found to be 11.99 MN/m
(68.50 kips/in) against the shear strength of 16.29 MN/m (93.00 kips/in).
3G.3.5.5 Foundation Stability
The FB shares the foundation mat with the RB. Evaluation results of the foundation stability are
described in Subsection 3G.1.5.5.
3G.3.5.6 Tornado Missile Evaluation
The minimum thickness required to prevent penetration, concrete spalling and scabbing is
evaluated. The methods and procedures are shown in Subsection 3.5.3.1.1. The minimum
thickness required is less than the minimum 1000 mm (39.4 in) and 700 mm (27.6 in) thickness
provided for the FB external walls and slab at EL 22500, respectively.

3-1280 Revision 0October 2015
Fermi 3Updated Final Safety Analysis Report
SI to U.S. Customary units conversion (SI units are the controlling units and U.S. Customary units are for reference only):1 kN = 224.809 lbf1 kN/m2 = 20.885 psf1 m = 3.28 ft
Table 3G.3-1 Miscellaneous Structures and Commodities in Spent Fuel Pool
Description Weight
Fuel Pool
a. Spent Fuel Storage Racks 102 kN/m2
b. Floor Liner 1.6 kN/m2
c. Wall Liner 1.0 kN/m2
d. Water (14.35 m) 141 kN/m2
Pool Gate
a. Spent Fuel Pool Gate 70 kN
b. Cask Pit Gate 70 kN
Spent Fuel Cask Pool
a. Spent Fuel Cask 120 kN/m2
b. Floor Liner 1.6 kN/m2
c. Wall Liner 1.0 kN/m2
d. Water (14.35 m) 141 kN/m2
e. Cask Lid 100 kN
f. Cask bearing Plate 20 kN
Inclined Fuel Transfer Tube Pool
a. Floor Liner 1.6 kN/m2
b. Wall Liner 1.0 kN/m2
c. Water (14.35 m) 141 kN/m2
d. Transfer Tube Equipment 160 kN

3-1281 Revision 0October 2015
Fermi 3Updated Final Safety Analysis Report
SI to U.S. Customary units conversion (SI units are the controlling units and U.S. Customary units are for reference only):1 kN = 224.809 lbf1 kN/m2 = 20.885 psf1 m = 3.28 ft
(1) See Figure 3G.3-1. for the location of sections.(2) FP: Spent Fuel Pool, RM: FB Room, GR: Ground(3) Td: Average Temperature, Tg: Surface Temperature Difference (positive when temperature at Side 1 is higher)(4) These temperatures correspond to the spent fuel pool temperature at 100°C (212°F), which is slightly less than
the 104°C (219°F) water boiling temperature specified in Subsection 3.8.4.3.3. The slight 4% increase in the spent fuel pool temperature is negligible to the design of the spent fuel pool structure. This is because there are sufficient stress margins in accordance with Tables 3G.3-16 and 3G.3-17, even if the total combined stresses were increased by 4%, which would be very conservative since stresses other than thermal in the load combination do not increase.
SI to U.S. Customary units conversion (SI units are the controlling units and U.S. Customary units are for reference only):1°C = (°F - 32)/1.8
Table 3G.3-2 Miscellaneous Structures, Piping, and Commodity Load on FB Floor
Elevation (mm) Area Load
22,500 2.4 kN/m2 (50psf)
4,650 2.4 kN/m2 (50psf)
-1,000 2.4 kN/m2 (50psf)
-6,400 2.4 kN/m2 (50psf)
-11,500 2.4 kN/m2 (50psf)
Table 3G.3-3 Equivalent Linear Temperature Distributions at Various Sections
Section(1)Side(2)
Equivalent Linear Temperature(3) ( C)
Normal Operation (Winter) Accident Condition (Winter)(4)
1 2 Td Tg Td Tg
W1 FP RM 32.1 33.6 48.7 83.1
W2 FP RM 31.6 34.6 44.7 81.7
W3 FP GR 32.2 33.4 44.7 79.6
W4 FP GR 32.2 33.4 39.1 66.2

3-1282 Revision 0October 2015
Fermi 3Updated Final Safety Analysis Report
(1) U = Envelope of “Allowable Stress as in ASME B&PV Code Section III, Div. 2, Subsection CC-3420 for Factored
Load Combination” and “Required section strength based on the strength design method per ACI 349-01.”(2) Based on Table 3.8-15.(3) Pa and Ta are accident pressure load within the containment and thermal load generated by LOCA, respectively.
Ta includes the thermal effects in the spent fuel pool due to loss of FAPCS cooling function.
Pa and Ta are indirect loads, but their effects are considered in the FB design.(4) In load combinations that combine SSE with SRV, Chugging and CO, the loads are combined by SRSS.
Table 3G.3-4 Selected Load Combinations for the FB
CategoryLoad Combination
Acceptance Criteria(1)
No.(2) D L Pa(3) To Ta
(3) E’(4) W Ra(4) SRV(4) Chugging(4)
Severe Environmental
FB-4 1.05 1.3 1.3 1.3 U
LOCA (1.5Pa) 72 hours
FB-8 1.0 1.0 1.5 1.0 1.0 1.25 1.5 U
LOCA + SSE 72 hours
FB-9 1.0 1.0 1.0 1.0 1.0 1.0 1.0 1.0 U

3-1283 Revision 0October 2015
Fermi 3Updated Final Safety Analysis Report
Table 3G.3-5 Results of NASTRAN Analysis: Dead Load
SI to U.S. Customary units conversion (SI units are the controlling units and U.S. Customary units are for reference only):1 MN/m = 6.852x10⁴ lbf/ft1 MNm/m = 2.248x10⁵ lbf-ft/ft
LocationElement
IDNx
(MN/m)Ny
(MN/m)Nxy
(MN/m)Mx
(MNm/m)My
(MNm/m)Mxy
(MNm/m)Qx
(MN/m)Qy
(MN/m)1 Exterior Wall 60011 -0.479 -1.785 -0.532 -0.160 -1.149 -0.028 -0.097 -0.366 and Pool Wall 60219 0.337 -1.565 -0.302 -0.653 -0.826 -0.169 0.032 0.289 Bottom 70201 0.298 -0.173 0.002 0.499 -0.014 0.116 -0.273 0.072
70204 0.424 -1.004 0.031 -0.227 -0.052 0.121 -0.003 -0.358110718 0.324 -1.355 -0.066 -0.050 0.084 0.008 0.036 0.190
2 Exterior Wall 62011 0.088 -1.037 0.069 0.043 0.146 0.010 0.010 0.056 @ EL4.65 62019 0.125 -0.627 -0.190 -0.032 0.048 -0.031 -0.001 0.021 to 6.60m 72001 0.110 -0.171 0.108 0.106 0.020 -0.006 -0.015 -0.005
72004 0.146 -0.451 0.200 -0.038 0.004 0.001 -0.016 0.0143 Exterior Wall 64011 0.099 -0.287 -0.092 -0.111 -0.534 -0.004 -0.005 0.075 @ EL22.50 64019 -0.108 -0.369 -0.064 -0.061 -0.371 0.053 0.063 0.063 to 24.60m 74001 -0.015 -0.050 0.092 0.049 -0.045 -0.046 -0.020 -0.030
74004 -0.050 -0.212 0.088 -0.078 -0.336 -0.061 0.019 -0.0694 Spent Fuel 60819 0.603 -1.253 -0.492 -1.105 -0.818 -0.249 -0.006 -0.070 Pool Wall 70801 0.676 -0.156 0.012 1.074 0.074 -0.015 -0.548 0.031 @ EL-5.10 70804 0.581 -0.750 0.133 -0.561 -0.466 0.064 -0.097 0.045 to -3.30m 110748 0.225 -1.009 -0.441 -0.184 -0.081 -0.008 0.073 -0.0255 Basemat 90306 -1.089 -0.434 0.519 0.939 -0.124 0.175 -0.535 1.186
90310 -0.134 -0.121 -0.043 -0.153 -0.152 -0.696 0.171 -0.06790410 -0.454 -0.918 0.533 -0.712 0.164 1.499 1.396 -0.066
5 Basemat 90486 0.294 0.023 0.095 3.606 2.368 0.278 -0.180 0.125 @ Spent 90490 0.430 0.193 0.284 1.432 1.257 0.506 1.197 0.261 Fuel Pool 90526 0.517 0.487 0.018 1.983 2.122 0.126 -0.227 -0.7946 Slab EL4.65m 93306 0.189 0.018 0.025 0.048 -0.003 0.005 0.031 -0.099
93310 0.039 0.055 0.231 0.032 0.008 0.034 -0.023 0.00693410 0.313 0.318 -0.450 0.013 0.013 -0.069 0.001 -0.010

3-1284 Revision 0October 2015
Fermi 3Updated Final Safety Analysis Report
Table 3G.3-6 Results of NASTRAN Analysis: Thermal Load (Winter)
SI to U.S. Customary units conversion (SI units are the controlling units and U.S. Customary units are for reference only):1 MN/m = 6.852x10⁴ lbf/ft1 MNm/m = 2.248x10⁵ lbf-ft/ft
LocationElement
IDNx
(MN/m)Ny
(MN/m)Nxy
(MN/m)Mx
(MNm/m)My
(MNm/m)Mxy
(MNm/m)Qx
(MN/m)Qy
(MN/m)1 Exterior Wall 60011 -1.384 0.477 -0.339 1.280 1.116 0.111 -0.386 -0.113 and Pool Wall 60219 0.346 -3.904 1.390 -22.210 -29.543 -0.705 0.040 -3.334 Bottom 70201 1.886 3.103 -2.082 -9.857 -9.800 0.485 0.113 0.812
70204 0.054 1.309 -1.353 -8.600 -9.704 0.357 0.163 0.084110718 -5.215 -5.510 -2.744 -4.390 -4.955 0.047 0.412 -0.504
2 Exterior Wall 62011 5.792 2.205 0.857 -1.050 -1.212 0.013 -0.038 -0.053 @ EL4.65 62019 8.979 0.020 -2.349 -1.303 -1.808 -0.089 0.056 -0.166 to 6.60m 72001 6.347 -1.049 3.952 0.062 -0.998 0.052 -1.303 0.473
72004 8.900 0.584 3.462 -1.667 -2.299 0.138 -0.101 0.3383 Exterior Wall 64011 4.711 0.191 0.358 -0.959 -0.381 -0.033 -0.012 -0.085 @ EL22.50 64019 5.437 1.415 1.717 -1.028 -0.428 0.049 0.002 -0.056 to 24.60m 74001 2.923 -0.822 -3.513 -0.721 -0.452 0.098 -0.293 0.081
74004 4.106 0.207 -3.618 -0.945 -0.256 -0.054 0.039 0.0934 Spent Fuel 60819 -2.264 -4.358 -0.357 -18.258 -17.484 -1.137 -0.079 -1.940 Pool Wall 70801 -0.192 3.118 -0.554 -9.534 -8.830 0.036 0.338 0.094 @ EL-5.10 70804 -1.696 0.628 0.018 -8.487 -8.519 0.490 0.004 0.347 to -3.30m 110748 -1.028 -5.130 -1.753 -3.188 -4.057 -0.239 0.788 -0.2805 Basemat 90306 -0.891 -0.104 0.374 1.773 0.777 0.094 -0.041 0.263
90310 0.146 0.250 0.330 1.230 1.339 0.636 0.137 -0.03090410 -0.178 -1.176 0.355 0.552 2.044 0.015 -0.255 -0.326
5 Basemat 90486 -4.328 -1.550 0.543 -31.929 -31.367 2.927 -0.234 0.718 @ Spent 90490 -4.114 1.286 0.657 -38.413 -34.888 0.923 2.994 2.034 Fuel Pool 90526 5.653 0.288 -0.632 -32.497 -12.815 0.082 -1.429 2.3326 Slab EL4.65m 93306 -0.809 -0.029 -1.613 -0.049 0.041 -0.014 0.079 -0.032
93310 -2.213 -2.170 -3.182 -0.748 -0.783 -0.241 0.266 0.29193410 -0.508 -2.745 -0.501 -0.023 -0.030 0.015 -0.142 -0.048

3-1285 Revision 0October 2015
Fermi 3Updated Final Safety Analysis Report
Table 3G.3-7 Results of NASTRAN Analysis: Seismic Load (Horizontal: North to South Direction)
SI to U.S. Customary units conversion (SI units are the controlling units and U.S. Customary units are for reference only):1 MN/m = 6.852x10⁴ lbf/ft1 MNm/m = 2.248x10⁵ lbf-ft/ft
LocationElement
IDNx
(MN/m)Ny
(MN/m)Nxy
(MN/m)Mx
(MNm/m)My
(MNm/m)Mxy
(MNm/m)Qx
(MN/m)Qy
(MN/m)1 Exterior Wall 60011 -4.974 -4.132 -0.842 -0.159 -1.012 -0.064 0.041 -0.353 and Pool Wall 60219 -4.331 -5.856 -1.554 0.787 0.466 0.306 -0.110 0.204 Bottom 70201 0.098 -1.657 -2.673 -0.129 -0.589 -0.046 -0.254 0.097
70204 1.149 -4.630 -5.158 -0.556 -1.110 -0.136 -0.019 0.242110718 1.846 -2.400 1.147 -0.012 0.047 -0.020 0.025 -0.081
2 Exterior Wall 62011 0.817 -1.295 -0.355 0.134 0.666 0.005 -0.018 0.279 @ EL4.65 62019 0.763 -1.209 -2.124 0.042 0.223 -0.121 0.037 0.083 to 6.60m 72001 -0.117 -1.352 -3.519 -0.073 -0.058 0.010 -0.006 0.052
72004 -0.286 -1.706 -4.128 -0.025 -0.029 -0.001 0.017 0.0063 Exterior Wall 64011 3.618 -0.192 -0.226 -0.054 -0.114 0.010 0.003 -0.157 @ EL22.50 64019 2.638 0.004 -0.653 -0.049 -0.130 0.137 0.039 -0.014 to 24.60m 74001 0.144 -0.106 -1.085 0.035 0.046 -0.047 0.037 -0.013
74004 -1.324 -0.219 -1.583 0.033 0.018 -0.033 0.015 0.0084 Spent Fuel 60819 -0.913 -4.138 -2.609 0.331 0.200 0.267 0.118 0.047 Pool Wall 70801 -0.017 -1.691 -4.182 -0.245 -0.135 -0.132 -0.087 -0.051 @ EL-5.10 70804 0.627 -2.998 -5.007 -0.420 -0.178 -0.204 0.033 0.098 to -3.30m 110748 0.603 -0.359 1.101 0.041 0.094 -0.130 -0.020 0.0345 Basemat 90306 -1.332 -1.353 5.050 2.387 -0.476 4.931 -4.168 3.147
90310 0.229 -1.746 0.216 0.850 -0.443 -1.007 -0.684 2.15690410 -0.863 -9.238 -0.135 1.318 1.178 2.207 3.061 -0.507
5 Basemat 90486 -1.353 -2.884 -2.052 15.253 8.966 -2.179 -2.169 -0.054 @ Spent 90490 -0.501 -8.792 0.829 5.706 7.080 0.667 4.700 -0.518 Fuel Pool 90526 0.726 -0.593 -5.563 7.413 1.750 -6.090 -2.498 -3.7736 Slab EL4.65m 93306 2.047 0.394 -0.788 0.335 -0.448 -0.005 -0.048 0.039
93310 0.713 0.293 0.983 0.434 -0.367 0.012 -0.420 0.41593410 0.095 0.998 0.837 0.256 0.087 0.062 -0.079 0.009

3-1286 Revision 0October 2015
Fermi 3Updated Final Safety Analysis Report
Table 3G.3-8 Results of NASTRAN Analysis: Seismic Load (Horizontal: East to West Direction)
SI to U.S. Customary units conversion (SI units are the controlling units and U.S. Customary units are for reference only):1 MN/m = 6.852x10⁴ lbf/ft1 MNm/m = 2.248x10⁵ lbf-ft/ft
LocationElement
IDNx
(MN/m)Ny
(MN/m)Nxy
(MN/m)Mx
(MNm/m)My
(MNm/m)Mxy
(MNm/m)Qx
(MN/m)Qy
(MN/m)1 Exterior Wall 60011 -0.106 -0.140 -6.111 -0.048 -0.651 -0.131 0.089 -0.103 and Pool Wall 60219 0.613 6.980 -4.243 1.345 4.113 -0.307 -0.076 0.670 Bottom 70201 -0.012 2.514 -0.894 -0.093 0.289 -0.131 0.053 -0.148
70204 0.847 7.253 0.948 0.119 0.399 -0.099 0.002 0.083110718 -0.397 3.726 0.193 0.338 0.757 0.044 0.044 0.453
2 Exterior Wall 62011 0.192 0.091 -3.939 0.030 0.060 -0.005 -0.028 0.015 @ EL4.65 62019 -0.299 1.564 -2.102 0.020 0.016 0.007 -0.004 -0.003 to 6.60m 72001 -0.053 1.982 -0.527 -0.080 -0.083 -0.082 -0.017 0.031
72004 -0.162 2.433 0.328 -0.013 -0.308 -0.065 -0.016 0.1693 Exterior Wall 64011 -0.165 -0.013 -2.022 0.000 -0.012 0.010 0.004 0.003 @ EL22.50 64019 -0.602 0.128 -1.312 0.005 0.014 -0.020 -0.009 -0.002 to 24.60m 74001 -0.170 0.249 0.183 -0.099 -0.019 0.112 0.009 0.027
74004 -1.056 0.192 0.792 0.035 0.004 0.071 -0.035 -0.1234 Spent Fuel 60819 -0.667 4.624 -3.578 1.101 1.127 -0.074 -0.069 0.331 Pool Wall 70801 -0.408 2.734 -0.990 -0.491 -0.030 -0.031 0.296 -0.070 @ EL-5.10 70804 -0.379 4.938 0.402 0.273 0.250 -0.064 0.025 -0.063 to -3.30m 110748 -0.573 1.976 0.272 -0.059 -0.145 -0.057 0.106 0.0555 Basemat 90306 -7.362 -1.887 2.309 4.493 1.341 1.350 -2.147 4.891
90310 -1.100 -0.668 0.422 -0.184 0.640 -1.514 1.882 0.11790410 0.099 0.337 4.867 -0.357 -1.797 7.909 -0.067 -3.731
5 Basemat 90486 1.939 1.517 0.910 -15.652 -16.364 -0.601 0.601 -1.861 @ Spent 90490 0.971 3.631 4.022 0.429 -7.892 4.397 -6.383 -1.813 Fuel Pool 90526 5.573 0.814 1.711 -11.621 -5.948 1.135 1.546 5.6526 Slab EL4.65m 93306 1.734 0.127 -0.674 0.335 -0.163 -0.027 0.105 0.081
93310 0.348 0.464 0.447 -0.137 0.095 -0.014 0.131 -0.07593410 -0.271 0.703 0.410 0.094 -0.067 0.121 -0.217 -0.007

3-1287 Revision 0October 2015
Fermi 3Updated Final Safety Analysis Report
Table 3G.3-9 Results of NASTRAN Analysis: Seismic Load (Vertical: Upward Direction)
SI to U.S. Customary units conversion (SI units are the controlling units and U.S. Customary units are for reference only):1 MN/m = 6.852x10⁴ lbf/ft1 MNm/m = 2.248x10⁵ lbf-ft/ft
LocationElement
IDNx
(MN/m)Ny
(MN/m)Nxy
(MN/m)Mx
(MNm/m)My
(MNm/m)Mxy
(MNm/m)Qx
(MN/m)Qy
(MN/m)1 Exterior Wall 60011 0.347 1.444 0.295 0.151 0.929 0.026 0.063 0.284 and Pool Wall 60219 0.028 1.529 0.165 0.479 0.708 0.106 -0.021 -0.150 Bottom 70201 -0.036 0.252 -0.081 -0.321 0.046 -0.078 0.190 -0.076
70204 -0.074 1.039 -0.038 0.142 0.070 -0.087 -0.001 0.233110718 -0.173 1.169 0.284 0.063 -0.016 -0.035 -0.020 -0.093
2 Exterior Wall 62011 -0.051 0.992 -0.111 -0.057 -0.254 -0.012 -0.009 -0.085 @ EL4.65 62019 -0.052 0.677 0.047 0.017 -0.116 0.045 -0.002 -0.038 to 6.60m 72001 -0.056 0.232 -0.064 -0.083 -0.016 0.003 0.005 0.002
72004 -0.058 0.481 -0.097 0.021 -0.027 -0.011 0.010 -0.0043 Exterior Wall 64011 0.055 0.424 0.030 0.184 0.895 0.006 0.006 -0.122 @ EL22.50 64019 0.151 0.524 0.057 0.106 0.631 -0.084 -0.102 -0.100 to 24.60m 74001 0.013 0.028 -0.112 -0.083 0.074 0.075 0.037 0.049
74004 0.074 0.313 -0.072 0.132 0.561 0.097 -0.029 0.1144 Spent Fuel 60819 -0.130 1.235 0.305 0.809 0.422 0.189 -0.011 0.076 Pool Wall 70801 -0.114 0.355 -0.035 -0.737 -0.067 0.018 0.367 -0.018 @ EL-5.10 70804 -0.140 0.742 -0.091 0.356 0.296 -0.048 0.066 -0.040 to -3.30m 110748 -0.119 0.789 0.347 0.104 0.033 0.013 -0.047 0.0335 Basemat 90306 0.831 0.342 -0.377 -0.717 0.087 -0.126 0.414 -0.937
90310 0.113 0.081 0.038 0.113 0.109 0.556 -0.161 0.05590410 0.352 0.666 -0.331 0.551 -0.129 -1.083 -1.131 -0.053
5 Basemat 90486 0.223 0.456 0.032 -3.144 -2.174 -0.332 0.173 -0.142 @ Spent 90490 0.289 0.317 -0.118 -0.405 -1.037 -0.309 -1.235 -0.234 Fuel Pool 90526 0.239 0.271 0.059 -1.710 -1.031 -0.079 0.226 0.8866 Slab EL4.65m 93306 -0.124 0.014 -0.053 -0.040 -0.064 -0.010 -0.027 0.132
93310 -0.021 -0.040 -0.208 -0.041 -0.028 -0.042 0.018 0.00293410 -0.284 -0.289 0.275 -0.088 -0.020 0.074 0.047 0.017

3-1288 Revision 0October 2015
Fermi 3Updated Final Safety Analysis Report
Table 3G.3-10 Combined Forces and Moments: Selected Load Combination FB-4
OTHR: Loads other than thermal loadsTEMP: Thermal loadsSI to U.S. Customary units conversion (SI units are the controlling units and U.S. Customary units are for reference only):1 MN/m = 6.852x10⁴ lbf/ft1 MNm/m = 2.248x10⁵ lbf-ft/ft
LocationElement
IDNx
(MN/m)Ny
(MN/m)Nxy
(MN/m)Mx
(MNm/m)My
(MNm/m)Mxy
(MNm/m)Qx
(MN/m)Qy
(MN/m)1 Exterior Wall 60011 OTHR -2.758 -2.156 -0.833 -0.154 -1.181 0.019 -0.066 -0.940 and Pool Wall TEMP -1.399 0.244 -0.150 1.389 1.248 0.082 -0.323 -0.124 Bottom 60219 OTHR -2.519 -1.987 -0.576 0.103 -0.752 0.146 0.026 -0.857
TEMP 2.141 -3.473 1.526 -16.532 -22.653 -0.638 -0.009 -2.74470201 OTHR -0.927 -0.381 0.021 -1.345 -0.893 -0.609 0.588 -0.045
TEMP 2.590 3.915 -1.049 -5.504 -5.911 0.402 -0.198 0.75770204 OTHR -1.295 -1.774 -0.209 0.449 -1.950 -0.415 -0.086 1.941
TEMP 1.973 1.474 -0.981 -5.183 -6.088 0.322 0.084 0.078110718 OTHR -0.744 -1.072 -0.846 -0.079 0.018 0.047 0.072 0.103
TEMP -2.857 -4.097 -1.806 -2.527 -2.904 0.015 0.243 -0.3242 Exterior Wall 62011 OTHR -0.206 -1.133 -0.108 0.033 0.189 0.008 0.000 0.075 @ EL4.65 TEMP 7.429 2.426 0.697 -1.402 -1.563 0.008 -0.029 -0.075 to 6.60m 62019 OTHR -0.339 -0.713 -0.077 0.018 0.120 -0.030 0.012 0.059
TEMP 10.022 0.294 -2.625 -1.562 -1.942 -0.063 0.045 -0.13772001 OTHR -0.073 -0.262 -0.055 -0.268 -0.039 0.054 0.145 0.026
TEMP 5.610 -1.657 3.481 -0.530 -1.166 0.047 -0.963 0.33272004 OTHR -0.277 -0.665 -0.069 0.390 0.266 0.053 0.061 -0.165
TEMP 8.962 1.077 3.662 -1.724 -2.091 0.110 -0.068 0.2133 Exterior Wall 64011 OTHR 0.261 -0.308 -0.066 -0.123 -0.586 0.002 -0.002 0.068 @ EL22.50 TEMP 5.619 0.223 0.312 -1.261 -0.544 -0.026 -0.006 -0.099 to 24.60m 64019 OTHR 0.005 -0.413 -0.082 -0.069 -0.408 0.056 0.067 0.054
TEMP 6.640 1.810 1.921 -1.323 -0.590 0.031 -0.009 -0.06874001 OTHR -0.023 -0.057 0.119 0.057 -0.051 -0.042 -0.032 -0.029
TEMP 3.770 -0.975 -4.229 -0.993 -0.606 0.162 -0.381 0.12974004 OTHR -0.024 -0.227 0.085 -0.084 -0.383 -0.062 0.018 -0.061
TEMP 5.254 0.289 -4.060 -1.230 -0.396 -0.031 0.029 0.1154 Spent Fuel 60819 OTHR -2.105 -1.486 -0.681 0.638 1.076 0.113 0.184 -0.012 Pool Wall TEMP -2.782 -4.484 -0.289 -13.307 -12.914 -1.206 -0.062 -1.487 @ EL-5.10 70801 OTHR -1.408 -0.700 -0.086 -3.528 -0.259 -0.424 2.180 -0.351 to -3.30m TEMP 0.397 4.656 -0.384 -5.261 -5.277 0.027 0.021 -0.027
70804 OTHR -1.218 -1.095 -0.090 2.790 1.830 -0.341 0.325 0.256TEMP -0.972 0.944 0.201 -5.140 -5.323 0.365 -0.042 0.181
110748 OTHR -0.545 -0.664 -0.428 -0.053 -0.042 -0.068 0.102 -0.059TEMP -0.574 -3.683 -1.399 -1.735 -2.298 -0.112 0.476 -0.198
5 Basemat 90306 OTHR -4.303 -3.072 0.792 0.964 -0.800 0.428 -0.607 1.572TEMP -0.551 -0.079 0.609 2.135 1.086 0.301 -0.278 0.264
90310 OTHR -2.506 -2.554 0.254 -0.649 -0.532 -0.047 0.392 0.183TEMP 0.239 0.313 0.518 1.691 1.777 0.959 0.054 -0.064
90410 OTHR -3.284 -5.447 0.721 -2.048 -0.018 1.721 1.708 -0.343TEMP -0.173 -0.844 0.141 0.811 2.381 -0.132 -0.103 -0.121
5 Basemat 90486 OTHR -3.441 -5.730 -0.324 3.049 1.537 -0.129 -0.140 -0.216 @ Spent TEMP -4.244 -2.720 0.470 -24.557 -25.455 2.673 -0.139 0.534 Fuel Pool 90490 OTHR -3.543 -4.698 0.200 -1.337 0.792 0.349 1.532 -0.327
TEMP -3.300 3.303 0.448 -29.781 -29.188 0.728 2.617 2.05190526 OTHR -4.261 -6.627 -0.403 0.647 -5.564 -0.297 -0.207 -1.875
TEMP 3.535 0.045 -0.194 -25.792 -9.116 0.463 -1.405 2.0156 Slab EL4.65m 93306 OTHR 0.041 -0.230 -0.085 0.099 0.165 0.016 0.034 -0.158
TEMP -1.235 -0.073 -1.154 -0.070 0.029 -0.024 0.086 -0.03893310 OTHR -0.038 -0.035 0.139 0.092 0.042 0.011 -0.050 0.004
TEMP -2.819 -2.798 -3.576 -0.996 -1.005 -0.291 0.362 0.36593410 OTHR -0.052 -0.174 0.009 0.221 0.058 -0.047 -0.099 -0.017
TEMP -0.718 -3.379 -0.128 -0.172 -0.035 0.000 -0.089 -0.038

3-1289 Revision 0October 2015
Fermi 3Updated Final Safety Analysis Report
Table 3G.3-11 Combined Forces and Moments: Selected Load Combination FB-8
LocationElement
IDNx
(MN/m)Ny
(MN/m)Nxy
(MN/m)Mx
(MNm/m)My
(MNm/m)Mxy
(MNm/m)Qx
(MN/m)Qy
(MN/m)
1 Exterior Wall 60011 OTHR -2.174 -2.012 -0.749 -0.156 -1.171 0.013 -0.079 -0.817 and Pool Wall TEMP -1.384 0.477 -0.339 1.280 1.116 0.111 -0.386 -0.113 Bottom HYDR 0.343 0.293 0.291 0.021 0.118 0.009 0.011 0.040
60219 OTHR -1.833 -1.807 -0.485 -0.058 -0.764 0.069 0.027 -0.605TEMP 0.346 -3.904 1.390 -22.210 -29.543 -0.705 0.040 -3.334HYDR 0.317 0.588 0.207 0.084 0.203 0.013 0.007 0.035
70201 OTHR -0.655 -0.305 0.030 -0.934 -0.688 -0.446 0.399 -0.021TEMP 1.886 3.103 -2.082 -9.857 -9.800 0.485 0.113 0.812HYDR 0.010 0.175 0.191 0.016 0.053 0.003 0.023 0.017
70204 OTHR -0.910 -1.539 -0.121 0.304 -1.512 -0.294 -0.067 1.423TEMP 0.054 1.309 -1.353 -8.600 -9.704 0.357 0.163 0.084HYDR 0.094 0.569 0.366 0.044 0.100 0.012 0.002 0.023
110718 OTHR -0.528 -1.089 -0.693 -0.070 0.032 0.037 0.062 0.118TEMP -5.215 -5.510 -2.744 -4.390 -4.955 0.047 0.412 -0.504HYDR 0.159 0.275 0.063 0.016 0.037 0.002 0.004 0.018
2 Exterior Wall 62011 OTHR -0.166 -1.130 -0.068 0.029 0.147 0.007 0.002 0.055 @ EL4.65 TEMP 5.792 2.205 0.857 -1.050 -1.212 0.013 -0.038 -0.053 to 6.60m HYDR 0.101 0.076 0.187 0.003 0.012 0.001 0.004 0.003
62019 OTHR -0.258 -0.686 -0.077 0.008 0.087 -0.026 0.008 0.040TEMP 8.979 0.020 -2.349 -1.303 -1.808 -0.089 0.056 -0.166HYDR 0.061 0.126 0.193 0.003 0.011 0.001 0.001 0.002
72001 OTHR -0.044 -0.183 -0.013 -0.199 -0.029 0.034 0.117 0.018TEMP 6.347 -1.049 3.952 0.062 -0.998 0.052 -1.303 0.473HYDR 0.023 0.198 0.270 0.007 0.005 0.001 0.002 0.004
72004 OTHR -0.200 -0.583 -0.013 0.302 0.201 0.036 0.044 -0.113TEMP 8.900 0.584 3.462 -1.667 -2.299 0.138 -0.101 0.338HYDR 0.052 0.190 0.321 0.004 0.006 0.001 0.001 0.001
3 Exterior Wall 64011 OTHR -0.006 -0.326 -0.057 -0.121 -0.598 0.001 -0.002 0.083 @ EL22.50 TEMP 4.711 0.191 0.358 -0.959 -0.381 -0.033 -0.012 -0.085 to 24.60m HYDR 0.344 0.002 0.133 0.005 0.015 0.002 0.001 0.002
64019 OTHR -0.160 -0.426 -0.136 -0.067 -0.419 0.052 0.067 0.067TEMP 5.437 1.415 1.717 -1.028 -0.428 0.049 0.002 -0.056HYDR 0.254 0.011 0.101 0.005 0.011 0.004 0.002 0.002
74001 OTHR -0.036 -0.042 0.156 0.045 -0.056 -0.036 -0.028 -0.028TEMP 2.923 -0.822 -3.513 -0.721 -0.452 0.098 -0.293 0.081HYDR 0.020 0.018 0.092 0.009 0.004 0.004 0.005 0.003
74004 OTHR -0.105 -0.239 0.176 -0.084 -0.400 -0.055 0.014 -0.080TEMP 4.106 0.207 -3.618 -0.945 -0.256 -0.054 0.039 0.093HYDR 0.118 0.009 0.173 0.003 0.004 0.004 0.001 0.001
4 Spent Fuel 60819 OTHR -1.496 -1.381 -0.595 0.277 0.635 0.027 0.139 -0.023 Pool Wall TEMP -2.264 -4.358 -0.357 -18.258 -17.484 -1.137 -0.079 -1.940 @ EL-5.10 HYDR 0.057 0.403 0.247 0.083 0.054 0.022 0.009 0.015 to -3.30m 70801 OTHR -0.949 -0.537 -0.044 -2.507 -0.190 -0.332 1.569 -0.269
TEMP -0.192 3.118 -0.554 -9.534 -8.830 0.036 0.338 0.094HYDR 0.028 0.219 0.302 0.036 0.010 0.009 0.012 0.005
70804 OTHR -0.811 -0.983 -0.028 2.046 1.302 -0.251 0.231 0.205TEMP -1.696 0.628 0.018 -8.487 -8.519 0.490 0.004 0.347HYDR 0.051 0.378 0.366 0.033 0.015 0.017 0.003 0.010
110748 OTHR -0.380 -0.726 -0.446 -0.079 -0.049 -0.053 0.092 -0.050TEMP -1.028 -5.130 -1.753 -3.188 -4.057 -0.239 0.788 -0.280HYDR 0.060 0.095 0.068 0.010 0.010 0.015 0.002 0.006

3-1290 Revision 0October 2015
Fermi 3Updated Final Safety Analysis Report
Table 3G.3-11 Combined Forces and Moments: Selected Load Combination FB-8 (Continued)
OTHR: Loads other than thermal and hydrodynamic loadsTEMP: Thermal loadsHYDR: Hydrodynamic loadsSI to U.S. Customary units conversion (SI units are the controlling units and U.S. Customary units are for reference only):1 MN/m = 6.852x10⁴ lbf/ft1 MNm/m = 2.248x10⁵ lbf-ft/ft
LocationElement
IDNx
(MN/m)Ny
(MN/m)Nxy
(MN/m)Mx
(MNm/m)My
(MNm/m)Mxy
(MNm/m)Qx
(MN/m)Qy
(MN/m)5 Basemat 90306 OTHR -3.553 -2.445 0.667 0.917 -0.660 0.318 -0.535 1.428
TEMP -0.891 -0.104 0.374 1.773 0.777 0.094 -0.041 0.263HYDR 0.379 0.165 0.412 0.357 0.091 0.349 0.331 0.408
90310 OTHR -1.959 -1.980 0.183 -0.545 -0.443 -0.171 0.345 0.118TEMP 0.146 0.250 0.330 1.230 1.339 0.636 0.137 -0.030HYDR 0.052 0.139 0.022 0.062 0.063 0.144 0.111 0.142
90410 OTHR -2.639 -4.291 0.681 -1.812 -0.001 1.618 1.590 -0.271TEMP -0.178 -1.176 0.355 0.552 2.044 0.015 -0.255 -0.326HYDR 0.071 0.650 0.200 0.146 0.116 0.471 0.230 0.146
5 Basemat 90486 OTHR -2.601 -4.362 -0.196 3.036 1.609 0.001 -0.098 -0.152 @ Spent TEMP -4.328 -1.550 0.543 -31.929 -31.367 2.927 -0.234 0.718 Fuel Pool HYDR 0.158 0.207 0.127 1.680 1.236 0.208 0.129 0.088
90490 OTHR -2.642 -3.498 0.202 -0.805 0.804 0.383 1.388 -0.178TEMP -4.114 1.286 0.657 -38.413 -34.888 0.923 2.994 2.034HYDR 0.057 0.699 0.167 0.334 0.711 0.173 0.524 0.090
90526 OTHR -3.184 -4.998 -0.258 0.875 -3.886 -0.137 -0.182 -1.581TEMP 5.653 0.288 -0.632 -32.497 -12.815 0.082 -1.429 2.332HYDR 0.271 0.062 0.398 0.923 0.352 0.426 0.198 0.477
6 Slab EL4.65m 93306 OTHR 0.053 -0.186 -0.138 0.087 0.129 0.012 0.034 -0.142TEMP -0.809 -0.029 -1.613 -0.049 0.041 -0.014 0.079 -0.032HYDR 0.184 0.036 0.234 0.034 0.041 0.003 0.008 0.008
93310 OTHR -0.037 -0.027 0.108 0.078 0.036 0.013 -0.045 0.002TEMP -2.213 -2.170 -3.182 -0.748 -0.783 -0.241 0.266 0.291HYDR 0.035 0.026 0.060 0.032 0.030 0.004 0.034 0.031
93410 OTHR -0.016 -0.085 -0.074 0.165 0.045 -0.049 -0.073 -0.015TEMP -0.508 -2.745 -0.501 -0.023 -0.030 0.015 -0.142 -0.048HYDR 0.017 0.128 0.106 0.023 0.007 0.012 0.016 0.001

3-1291 Revision 0October 2015
Fermi 3Updated Final Safety Analysis Report
Table 3G.3-12 Combined Forces and Moments: Selected Load Combination FB-9
LocationElement
IDNx
(MN/m)Ny
(MN/m)Nxy
(MN/m)Mx
(MNm/m)My
(MNm/m)Mxy
(MNm/m)Qx
(MN/m)Qy
(MN/m)1 Exterior Wall 60011 OTHR -2.173 -2.002 -0.745 -0.154 -1.158 0.012 -0.076 -0.809 and Pool Wall TEMP -1.384 0.477 -0.339 1.280 1.116 0.111 -0.386 -0.113 Bottom SEIS 5.340 4.432 6.312 0.268 1.599 0.163 0.152 0.708
HYDR 0.241 0.207 0.204 0.015 0.085 0.007 0.008 0.02960219 OTHR -1.833 -1.806 -0.485 -0.058 -0.764 0.071 0.027 -0.605
TEMP 0.346 -3.904 1.390 -22.210 -29.543 -0.705 0.040 -3.334SEIS 5.241 9.790 4.701 2.774 5.361 0.727 0.311 2.090HYDR 0.224 0.415 0.145 0.059 0.141 0.008 0.005 0.024
70201 OTHR -0.655 -0.308 0.033 -0.935 -0.688 -0.446 0.400 -0.021TEMP 1.886 3.103 -2.082 -9.857 -9.800 0.485 0.113 0.812SEIS 0.521 3.113 3.160 1.159 1.102 0.682 0.583 0.327HYDR 0.007 0.122 0.136 0.011 0.038 0.002 0.016 0.012
70204 OTHR -0.915 -1.537 -0.118 0.305 -1.510 -0.295 -0.067 1.422TEMP 0.054 1.309 -1.353 -8.600 -9.704 0.357 0.163 0.084SEIS 2.326 9.215 5.539 0.822 2.462 0.477 0.077 1.441HYDR 0.067 0.403 0.260 0.031 0.071 0.008 0.001 0.016
110718 OTHR -0.527 -1.086 -0.689 -0.070 0.031 0.038 0.062 0.117TEMP -5.215 -5.510 -2.744 -4.390 -4.955 0.047 0.412 -0.504SEIS 3.270 4.733 2.813 0.389 0.835 0.103 0.088 0.532HYDR 0.114 0.194 0.045 0.011 0.026 0.002 0.003 0.013
2 Exterior Wall 62011 OTHR -0.164 -1.119 -0.067 0.030 0.151 0.008 0.002 0.056 @ EL4.65 TEMP 5.792 2.205 0.857 -1.050 -1.212 0.013 -0.038 -0.053 to 6.60m SEIS 1.289 1.695 4.101 0.198 0.724 0.030 0.041 0.303
HYDR 0.072 0.054 0.130 0.002 0.008 0.000 0.003 0.00262019 OTHR -0.257 -0.685 -0.076 0.008 0.089 -0.026 0.009 0.040
TEMP 8.979 0.020 -2.349 -1.303 -1.808 -0.089 0.056 -0.166SEIS 1.107 2.253 3.383 0.249 0.470 0.146 0.051 0.144HYDR 0.043 0.088 0.135 0.002 0.008 0.001 0.000 0.001
72001 OTHR -0.044 -0.199 -0.005 -0.199 -0.029 0.034 0.117 0.018TEMP 6.347 -1.049 3.952 0.062 -0.998 0.052 -1.303 0.473SEIS 0.741 2.589 4.297 0.472 0.159 0.128 0.214 0.078HYDR 0.016 0.138 0.191 0.005 0.004 0.001 0.001 0.003
72004 OTHR -0.197 -0.588 0.000 0.302 0.201 0.036 0.044 -0.113TEMP 8.900 0.584 3.462 -1.667 -2.299 0.138 -0.101 0.338SEIS 1.039 3.209 4.682 0.481 0.640 0.091 0.085 0.336HYDR 0.037 0.133 0.227 0.002 0.004 0.001 0.001 0.001
3 Exterior Wall 64011 OTHR 0.046 -0.326 -0.060 -0.123 -0.604 0.001 -0.002 0.084 @ EL22.50 TEMP 4.711 0.191 0.358 -0.959 -0.381 -0.033 -0.012 -0.085 to 24.60m SEIS 3.879 0.468 2.053 0.194 0.906 0.035 0.018 0.201
HYDR 0.242 0.001 0.092 0.004 0.011 0.001 0.001 0.00164019 OTHR -0.130 -0.425 -0.116 -0.068 -0.422 0.052 0.067 0.068
TEMP 5.437 1.415 1.717 -1.028 -0.428 0.049 0.002 -0.056SEIS 2.950 0.539 1.577 0.118 0.656 0.185 0.114 0.103HYDR 0.178 0.008 0.070 0.004 0.008 0.002 0.002 0.002
74001 OTHR -0.032 -0.047 0.145 0.046 -0.055 -0.037 -0.029 -0.028TEMP 2.923 -0.822 -3.513 -0.721 -0.452 0.098 -0.293 0.081SEIS 0.238 0.290 1.163 0.139 0.098 0.175 0.075 0.060HYDR 0.014 0.013 0.064 0.006 0.003 0.003 0.003 0.002
74004 OTHR -0.081 -0.240 0.152 -0.085 -0.401 -0.056 0.014 -0.080TEMP 4.106 0.207 -3.618 -0.945 -0.256 -0.054 0.039 0.093SEIS 1.903 0.434 1.829 0.141 0.564 0.135 0.055 0.175HYDR 0.083 0.006 0.121 0.002 0.003 0.003 0.001 0.001

3-1292 Revision 0October 2015
Fermi 3Updated Final Safety Analysis Report
Table 3G.3-12 Combined Forces and Moments: Selected Load Combination FB-9 (Continued)
OTHR: Loads other than thermal, seismic and hydrodynamic loadsTEMP: Thermal loadsSEIS: Seismic loadsHYDR: Hydrodynamic loadsSI to U.S. Customary units conversion (SI units are the controlling units and U.S. Customary units are for reference only):1 MN/m = 6.852x10⁴ lbf/ft1 MNm/m = 2.248x10⁵ lbf-ft/ft
LocationElement
IDNx
(MN/m)Ny
(MN/m)Nxy
(MN/m)Mx
(MNm/m)My
(MNm/m)Mxy
(MNm/m)Qx
(MN/m)Qy
(MN/m)4 Spent Fuel 60819 OTHR -1.497 -1.379 -0.595 0.276 0.636 0.030 0.139 -0.023 Pool Wall TEMP -2.264 -4.358 -0.357 -18.258 -17.484 -1.137 -0.079 -1.940 @ EL-5.10 SEIS 2.656 6.814 4.604 5.026 2.489 0.669 0.362 0.792 to -3.30m HYDR 0.039 0.284 0.174 0.058 0.037 0.016 0.006 0.011
70801 OTHR -0.950 -0.543 -0.038 -2.509 -0.190 -0.332 1.570 -0.269TEMP -0.192 3.118 -0.554 -9.534 -8.830 0.036 0.338 0.094SEIS 1.892 3.601 4.599 3.498 0.454 0.671 2.033 0.503HYDR 0.019 0.153 0.214 0.025 0.007 0.006 0.009 0.003
70804 OTHR -0.818 -0.980 -0.018 2.046 1.302 -0.251 0.231 0.205TEMP -1.696 0.628 0.018 -8.487 -8.519 0.490 0.004 0.347SEIS 2.282 6.197 5.211 2.893 1.577 0.494 0.308 0.468HYDR 0.036 0.267 0.261 0.023 0.011 0.012 0.002 0.007
110748 OTHR -0.380 -0.723 -0.443 -0.078 -0.049 -0.053 0.092 -0.050TEMP -1.028 -5.130 -1.753 -3.188 -4.057 -0.239 0.788 -0.280SEIS 1.832 2.310 2.172 0.219 0.198 0.216 0.130 0.104HYDR 0.043 0.066 0.049 0.007 0.007 0.011 0.001 0.004
5 Basemat 90306 OTHR -3.543 -2.443 0.668 0.916 -0.652 0.320 -0.537 1.426TEMP -0.891 -0.104 0.374 1.773 0.777 0.094 -0.041 0.263SEIS 7.568 2.347 5.652 5.383 2.007 5.199 4.883 6.009HYDR 0.266 0.117 0.292 0.253 0.065 0.246 0.234 0.289
90310 OTHR -1.959 -1.978 0.184 -0.542 -0.440 -0.170 0.344 0.114TEMP 0.146 0.250 0.330 1.230 1.339 0.636 0.137 -0.030SEIS 1.160 1.886 0.486 1.285 1.047 2.093 2.187 2.493HYDR 0.036 0.099 0.016 0.044 0.045 0.102 0.078 0.100
90410 OTHR -2.629 -4.289 0.675 -1.785 0.001 1.614 1.583 -0.271TEMP -0.178 -1.176 0.355 0.552 2.044 0.015 -0.255 -0.326SEIS 0.937 9.268 5.001 2.443 2.322 8.518 3.315 3.953HYDR 0.050 0.457 0.140 0.106 0.081 0.332 0.163 0.102
5 Basemat 90486 OTHR -2.595 -4.368 -0.203 3.007 1.602 -0.006 -0.107 -0.148 @ Spent TEMP -4.328 -1.550 0.543 -31.929 -31.367 2.927 -0.234 0.718 Fuel Pool SEIS 2.384 3.292 2.327 23.723 19.662 2.721 2.561 2.077
HYDR 0.113 0.145 0.089 1.198 0.875 0.148 0.090 0.06190490 OTHR -2.642 -3.498 0.201 -0.806 0.803 0.375 1.387 -0.183
TEMP -4.114 1.286 0.657 -38.413 -34.888 0.923 2.994 2.034SEIS 1.131 9.545 4.262 12.359 11.532 4.673 8.620 2.290HYDR 0.040 0.495 0.117 0.237 0.504 0.121 0.370 0.063
90526 OTHR -3.186 -4.998 -0.260 0.863 -3.884 -0.142 -0.183 -1.579TEMP 5.653 0.288 -0.632 -32.497 -12.815 0.082 -1.429 2.332SEIS 5.718 1.045 5.949 15.115 11.110 6.772 3.246 7.506HYDR 0.192 0.044 0.282 0.655 0.248 0.301 0.141 0.339
6 Slab EL4.65m 93306 OTHR 0.051 -0.187 -0.110 0.086 0.128 0.012 0.034 -0.141TEMP -0.809 -0.029 -1.613 -0.049 0.041 -0.014 0.079 -0.032SEIS 2.686 0.414 1.040 0.523 0.628 0.036 0.125 0.195HYDR 0.129 0.026 0.171 0.024 0.029 0.002 0.005 0.006
93310 OTHR -0.034 -0.026 0.124 0.076 0.036 0.014 -0.043 0.002TEMP -2.213 -2.170 -3.182 -0.748 -0.783 -0.241 0.266 0.291SEIS 0.796 0.550 1.111 0.582 0.441 0.065 0.528 0.489HYDR 0.024 0.018 0.044 0.023 0.022 0.003 0.024 0.022
93410 OTHR -0.010 -0.086 -0.080 0.163 0.045 -0.050 -0.072 -0.015TEMP -0.508 -2.745 -0.501 -0.023 -0.030 0.015 -0.142 -0.048SEIS 0.404 1.269 0.975 0.532 0.150 0.196 0.294 0.022HYDR 0.013 0.091 0.076 0.017 0.005 0.008 0.011 0.001

3-1293 Revision 0October 2015
Fermi 3Updated Final Safety Analysis Report
Table 3G.3-13 Sectional Thicknesses and Rebar Ratios Used in the Evaluation
LocationElement
ID
Thickness(m)
Primary ReinforcementShear Tie
PositionDirection 1*1 Direction 2*1
Arrangement*2 Ratio(%) Arrangement*2 Ratio
(%)Arrangement
Ratio(%)
1 Exterior Wall and Pool WallBottom
60011 2.0
Inside 3-#11@200 0.7551-#11@100
#6@200x200 0.710
Outside1-#11@100
2-#11@100+2-#11@200
1.510
60219 3.6
Inside 6-#11@200 0.839 6-#11@200 0.839
#6@200x200 0.710Outside
1-#11@100+7-#11@200
1.2581-#11@100
7020170204
2.0
Inside3-#11@100
3-#11@100+1-#11@200
1.761
#6@200x200 0.710
Outside3-#11@100
+1-#[email protected] 5-#11@100 2.516
110718 1.5
Inside 2-#11@200 0.6713-#11@200
(+1-#11@200)1.342
#6@400x200 0.355
Outside 2-#11@200 0.6713-#11@200
(+1-#11@200)1.342
2 Exterior Wall@ EL4.65to 6.60m
6201162019
1.0Inside 2-#11@200 1.006 2-#11@200 1.006
#5@400x400 0.125Outside 3-#11@200 1.510 3-#11@200 1.510
72001 1.0Inside 2-#11@200 1.006 2-#11@200 1.006
#5@400x200 0.250Outside 3-#11@200 1.510 3-#11@200 1.510
72004 1.0Inside 2-#11@200 1.006
2-#11@200(+1-#11@200)
1.510#5@400x400 0.125
Outside 3-#11@200 1.510 3-#11@200 1.510
3 Exterior Wall@ EL22.50to 24.60m
64011 1.0
Inside 2-#11@200 1.006 2-#11@200 1.006
#5@400x400 0.125Outside
2-#11@200(+1-#11@200)
1.5102-#11@200
(+1-#11@200)1.510
64019 1.0Inside 2-#11@200 1.006 2-#11@200 1.006
#5@400x400 0.125Outside 2-#11@200 1.006 2-#11@200 1.006
7400174004
1.0 Inside 2-#11@200 1.006 2-#11@200 1.006#5@400x400 0.125
Outside 3-#11@200 1.510 3-#11@200 1.510

3-1294 Revision 0October 2015
Fermi 3Updated Final Safety Analysis Report
Note *1.: Exterior Wall, Pool Wall Direction 1: Horizontal, Direction 2: Vertical
Basemat, Slab Direction 1: N-S, Direction 2: E-W
Note *1.: Rebar in parentheses indicates additional bars locally required.
SI to U.S. Customary units conversion (SI units are the controlling units and U.S. Customary units are for reference only):1 m = 3.28 ft
4 Spent FuelPool Wall@ EL-5.10to -3.30m
60819 3.6
Inside 6-#11@200 0.839 6-#11@200 0.839
#6@200x200 0.710Outside
1-#11@100+7-#11@200
1.2581-#11@100
7080170804
2.0
Inside3-#11@100
3-#11@100+1-#11@200
1.761
#6@200x200 0.710
Outside3-#11@100
+1-#[email protected] 5-#11@100 2.516
110748 1.5Inside 2-#11@200 0.671 3-#11@200 1.006
#6@400x400 0.177Outside 2-#11@200 0.671 3-#11@200 1.006
5 Basemat903069031090410
4.0Top 4-#11@200 0.503 4-#11@200 0.503
#11@400x400 0.629Bottom 5-#11@200 0.629 5-#11@200 0.629
6 Basemat@ SpentFuel Pool
90486 5.5Top
4-#11@200(+2-#11@200)
0.5494-#11@200
(+2-#11@200)0.549
#11@600x400 0.419
Bottom 5-#11@200 0.457 5-#11@200 0.457
9049090526
5.5Top
4-#11@200(+2-#11@200)
0.5494-#11@200
(+2-#11@200)0.549
#11@400x400 0.629
Bottom 5-#11@200 0.457 5-#11@200 0.457
7 Slab EL4.65m
933069331093410
1.3Top 2-#11@200 0.774 2-#11@200 0.774
#5@200x200 0.500Bottom 2-#11@200 0.774 2-#11@200 0.774
Table 3G.3-13 Sectional Thicknesses and Rebar Ratios Used in the Evaluation
LocationElement
ID
Thickness(m)
Primary ReinforcementShear Tie
PositionDirection 1*1 Direction 2*1
Arrangement*2 Ratio(%) Arrangement*2 Ratio
(%)Arrangement
Ratio(%)

3-1295 Revision 0October 2015
Fermi 3Updated Final Safety Analysis Report
Table 3G.3-14 Rebar and Concrete Stresses: Selected Load Combination FB-4
Note: Negative value means compression.Note *: Exterior Wall, Pool Wall Direction 1: Horizontal, Direction 2: Vertical
Basemat, Slab Direction 1: N-S, Direction 2: E-WSI to U.S. Customary units conversion (SI units are the controlling units and U.S. Customary units are for reference only):1 MPa = 145.038 psi
In/Top Out/Bottom In/Top Out/Bottom1 Exterior Wall 60011 -3.4 -29.3 -4.4 -19.2 -4.5 -3.3 372.2 and Pool Wall 60219 -7.8 -29.3 -9.6 30.5 -33.2 56.7 372.2 Bottom 70201 -9.9 -29.3 -12.0 90.3 -10.1 85.1 372.2
70204 -9.2 -29.3 -4.6 31.0 -30.4 67.6 372.2110718 -11.3 -29.3 -16.3 84.8 -26.2 48.4 372.2
2 Exterior Wall 62011 -3.0 -29.3 36.5 84.3 -11.2 27.7 372.2 @ EL4.65 62019 -10.2 -29.3 51.9 114.9 -26.3 77.7 372.2 to 6.60m 72001 -9.5 -29.3 22.5 108.5 -20.1 80.1 372.2
72004 -6.7 -29.3 62.5 44.5 5.2 26.8 372.23 Exterior Wall 64011 -8.4 -29.3 25.7 101.7 -18.6 66.4 372.2 @ EL22.50 64019 -8.4 -29.3 41.2 152.5 -9.1 117.7 372.2 to 24.60m 74001 -4.6 -29.3 23.6 93.7 3.3 80.3 372.2
74004 -7.5 -29.3 13.7 108.2 1.8 116.5 372.24 Spent Fuel 60819 -5.2 -29.3 -18.5 19.2 -21.7 17.2 372.2 Pool Wall 70801 -11.7 -29.3 -32.2 102.5 1.9 58.7 372.2 @ EL-5.10 70804 -2.9 -29.3 -12.2 4.0 -5.7 12.9 372.2 to -3.30m 110748 -8.8 -29.3 0.6 57.8 -32.1 33.7 372.25 Basemat 90306 -2.1 -23.5 -2.5 -13.7 -5.0 -3.8 372.2
90310 -0.8 -23.5 -2.6 -4.6 -2.1 -4.9 372.290410 -2.3 -23.5 -7.7 -1.3 -5.7 -15.4 372.2
5 Basemat 90486 -4.0 -23.5 -12.9 8.3 -16.1 8.6 372.2 @ Spent 90490 -4.2 -23.5 -13.2 23.1 -4.7 11.7 372.2 Fuel Pool 90526 -3.1 -23.5 -3.2 12.8 -14.0 4.4 372.26 Slab EL4.65m 93306 -1.8 -29.3 18.0 3.9 41.7 4.9 372.2
93310 -7.5 -29.3 -12.4 53.3 -14.1 56.6 372.293410 -2.6 -29.3 -0.4 -1.8 -16.8 -17.3 372.2
Primary Reinforcement Stress (MPa)
LocationElement
ID Calculated AllowableCalculated
Direction 1* Direction 2* Allowable
Concrete Stress (MPa)

3-1296 Revision 0October 2015
Fermi 3Updated Final Safety Analysis Report
Table 3G.3-15 Rebar and Concrete Stresses: Selected Load Combination FB-8
Note: Negative value means compression.Note *: Exterior Wall, Pool Wall Direction 1: Horizontal, Direction 2: Vertical
Basemat, Slab Direction 1: N-S, Direction 2: E-WSI to U.S. Customary units conversion (SI units are the controlling units and U.S. Customary units are for reference only):1 MPa = 145.038 psi
In/Top Out/Bottom In/Top Out/Bottom1 Exterior Wall 60011 -3.3 -29.3 -4.0 -18.1 -5.7 -1.9 372.2 and Pool Wall 60219 -9.9 -28.5 -16.6 55.0 -39.8 85.5 366.4 Bottom 70201 -12.7 -28.3 -20.5 113.1 -20.5 101.0 364.6
70204 -12.3 -28.3 -16.4 69.5 -39.4 98.0 364.6110718 -17.9 -28.1 -32.7 146.0 -34.3 91.8 363.3
2 Exterior Wall 62011 -3.7 -29.3 40.2 65.6 -19.6 26.9 372.2 @ EL4.65 62019 -10.4 -29.3 53.7 105.7 -28.0 80.0 372.2 to 6.60m 72001 -7.4 -29.3 40.8 92.8 -23.4 89.2 372.2
72004 -11.3 -29.3 86.6 83.2 -49.9 99.2 372.23 Exterior Wall 64011 -8.5 -29.3 29.0 92.7 -17.8 68.7 372.2 @ EL22.50 64019 -6.6 -29.3 37.4 94.6 -5.8 75.2 372.2 to 24.60m 74001 -4.0 -29.3 23.5 77.3 4.8 67.8 372.2
74004 -6.1 -29.3 13.0 100.0 4.0 97.9 372.24 Spent Fuel 60819 -6.4 -28.5 -19.4 43.7 -25.3 36.1 366.4 Pool Wall 70801 -14.4 -28.3 -36.3 132.6 -11.8 84.4 364.6 @ EL-5.10 70804 -7.3 -28.3 -18.7 33.6 -18.9 50.9 364.6 to -3.30m 110748 -13.8 -28.1 1.0 102.5 -44.9 70.3 363.35 Basemat 90306 -2.2 -23.5 -2.4 -14.3 -3.9 -3.3 372.2
90310 -0.7 -23.5 -2.1 -3.9 -1.4 -4.3 372.290410 -2.2 -23.5 -6.9 -0.8 -5.9 -14.9 372.2
5 Basemat 90486 -4.3 -22.9 -11.8 21.9 -12.0 19.9 367.2 @ Spent 90490 -4.7 -22.9 -10.9 39.2 -6.7 18.0 367.2 Fuel Pool 90526 -2.8 -22.9 0.4 24.4 -11.1 10.2 367.26 Slab EL4.65m 93306 -2.4 -29.3 49.8 27.5 70.5 33.0 372.2
93310 -6.1 -29.3 -5.7 55.3 -7.6 59.6 372.293410 -2.4 -29.3 14.9 -2.5 -12.2 -14.9 372.2
LocationElement
ID
Concrete Stress (MPa) Primary Reinforcement Stress (MPa)
Calculated AllowableCalculated
AllowableDirection 1* Direction 2*

3-1297 Revision 0October 2015
Fermi 3Updated Final Safety Analysis Report
Table 3G.3-16 Rebar and Concrete Stresses: Selected Load Combination FB-9
Note: Negative value means compression.Note *: Exterior Wall, Pool Wall Direction 1: Horizontal, Direction 2: Vertical
Basemat, Slab Direction 1: N-S, Direction 2: E-WSI to U.S. Customary units conversion (SI units are the controlling units and U.S. Customary units are for reference only):1 MPa = 145.038 psi
In/Top Out/Bottom In/Top Out/Bottom1 Exterior Wall 60011 -8.5 -29.3 244.8 107.4 217.4 108.8 372.2 and Pool Wall 60219 -13.9 -28.5 74.8 137.0 -63.4 192.8 366.4 Bottom 70201 -10.4 -28.3 -9.9 174.4 -20.5 169.1 364.6
70204 -18.4 -28.3 36.2 150.7 84.4 202.9 364.6110718 -22.7 -28.1 -44.5 151.5 -55.4 90.9 363.3
2 Exterior Wall 62011 -9.3 -29.3 214.9 241.9 322.8 240.7 372.2 @ EL4.65 62019 -13.2 -29.3 165.6 252.3 144.1 195.7 372.2 to 6.60m 72001 -15.3 -29.3 158.9 276.9 75.8 198.1 372.2
72004 -16.1 -29.3 255.1 316.9 130.3 283.0 372.23 Exterior Wall 64011 -26.7 -29.3 161.9 301.7 91.9 274.6 372.2 @ EL22.50 64019 -7.1 -29.3 233.3 284.5 105.5 231.4 372.2 to 24.60m 74001 -8.2 -29.3 68.5 103.3 52.9 89.5 372.2
74004 -9.4 -29.3 139.1 217.4 -31.1 222.5 372.24 Spent Fuel 60819 -9.5 -28.5 -30.9 83.3 -36.4 122.8 366.4 Pool Wall 70801 -19.0 -28.3 -47.6 228.3 29.2 157.6 364.6 @ EL-5.10 70804 -13.4 -28.3 85.5 121.0 92.6 139.7 364.6 to -3.30m 110748 -16.3 -28.1 9.2 114.5 -53.2 78.0 363.35 Basemat 90306 -10.4 -23.5 197.2 116.9 198.3 56.1 372.2
90310 -3.2 -23.5 13.2 21.5 24.1 23.1 372.290410 -11.1 -23.5 264.6 -25.0 235.6 113.2 372.2
5 Basemat 90486 -12.8 -22.9 121.5 163.6 116.2 122.0 367.2 @ Spent 90490 -9.7 -22.9 94.8 127.7 268.3 41.0 367.2 Fuel Pool 90526 -8.4 -22.9 333.0 100.3 190.0 106.8 367.26 Slab EL4.65m 93306 -5.5 -29.3 56.7 156.2 125.0 80.1 372.2
93310 -9.2 -29.3 22.9 119.8 11.9 120.6 372.293410 -5.8 -29.3 84.8 42.8 13.1 -19.8 372.2
LocationElement
ID
Concrete Stress (MPa) Primary Reinforcement Stress (MPa)
Calculated AllowableCalculated
AllowableDirection 1* Direction 2*

3-1298 Revision 0October 2015
Fermi 3Updated Final Safety Analysis Report
Table 3G.3-17 Transverse Shear of FB
SI to U.S. Customary units conversion (SI units are the controlling units and U.S. Customary units are for reference only):1 MN/m = 6.852x10⁴ lbf/ft1 m = 3.28 ft
Element Load d pvID ID (m) (%) Vu Vc Vs Vn
1 Exterior Wall 60011 FB-9 1.73 0.710 0.38 0.00 5.07 4.31 0.087 and Pool Wall 60219 FB-9 3.07 0.710 0.33 0.39 9.03 8.01 0.042 Bottom 70201 FB-9 1.66 0.710 1.28 1.73 4.88 5.63 0.227
70204 FB-4 1.59 0.710 1.99 2.09 4.67 5.75 0.346110718 FB-9 1.10 0.355 1.02 1.41 1.61 2.56 0.397
2 Exterior Wall 62011 FB-9 0.78 0.125 0.27 0.23 0.40 0.54 0.499 @ EL4.65 62019 FB-9 0.72 0.125 0.11 0.13 0.37 0.42 0.256 to 6.60m 72001 FB-9 0.72 0.250 0.45 0.10 0.75 0.72 0.620
72004 FB-9 0.72 0.125 0.23 0.00 0.37 0.32 0.7343 Exterior Wall 64011 FB-9 0.72 0.125 0.29 0.72 0.37 0.92 0.310 @ EL22.50 64019 FB-9 0.80 0.125 0.24 0.00 0.41 0.35 0.680 to 24.60m 74001 FB-4 0.72 0.125 0.10 0.12 0.37 0.42 0.249
74004 FB-4 0.72 0.125 0.06 0.08 0.37 0.38 0.1684 Spent Fuel 60819 FB-9 3.06 0.710 0.55 0.65 8.99 8.19 0.067 Pool Wall 70801 FB-9 1.71 0.710 3.91 1.98 5.03 5.96 0.655 @ EL-5.10 70804 FB-9 1.71 0.710 0.08 0.09 5.03 4.35 0.017 to -3.30m 110748 FB-9 1.22 0.177 1.09 1.38 0.89 1.93 0.5635 Basemat 90306 FB-9 3.49 0.629 6.11 1.70 9.07 9.15 0.667
90310 FB-9 3.48 0.629 3.70 5.75 9.06 12.59 0.29490410 FB-9 3.50 0.629 3.90 1.76 9.09 9.23 0.423
5 Basemat 90486 FB-9 3.92 0.419 2.91 3.66 6.79 8.89 0.327 @ Spent 90490 FB-9 5.05 0.629 11.99 6.04 13.13 16.29 0.736 Fuel Pool 90526 FB-9 3.94 0.629 6.45 3.16 10.25 11.40 0.5666 Slab EL4.65m 93306 FB-8 1.10 0.500 0.22 0.26 2.27 2.15 0.101
93310 FB-9 1.10 0.500 1.08 2.95 2.27 4.44 0.24493410 FB-9 1.10 0.500 0.46 2.15 2.27 3.75 0.121
LocationShear Force (MN/m)
Vu/Vn

3-1299 Revision 0October 2015
Fermi 3Updated Final Safety Analysis Report
Figure 3G.3-1. Sections Where Thermal Loads Are Defined{{{Security-Related Information - Withhold Under 10 CFR 2.390}}}

3-1300 Revision 0October 2015
Fermi 3Updated Final Safety Analysis Report
Figure 3G.3-2. Section Considered for Analysis
Figure 3G.3-2. Section Considered for Analysis
5
1
2
3
4
6
Selected Sections (FB)

3-1301 Revision 0October 2015
Fermi 3Updated Final Safety Analysis Report
Figure 3G.3-3. Force and Moment in Shell Element
z
x
y
z
x
y
Definition of Element Coordinate System
z
outwardExternal Wall
x
horizontal
y
vertical
toward West
Wall in E-W Direction
Wall in N-S Direction
toward South
horizontal vertical
horizontal vertical
Foundation MatFloor Slab downwardtoward Westtoward South
Structure
Nx
Nxy
Qx
Nx
Nxy
Qx
Ny
Nxy
Qy
Ny
Nxy
Qy
Membrane and Shear Forces
MxyMxy
Mxy
My
Mxy
My
Moments
Mx
Mx
Figure 3G 3-3 Force and Moment in Shell Element

Fermi 3 3-1302 Revision 0Updated Final Safety Analysis Report October 2015
Figure 3G.3-4. Reinforcing Steel of Spent Fuel PoolNote: All dimensions are in mm unless otherwise noted
{{{Security-Related Information - Withhold Under 10 CFR 2.390}}}
Fermi 3 3-1303 Revision 0Updated Final Safety Analysis Report October 2015
Figure 3G.3-5. List of FB Wall and Slab ReinforcementNote: All dimensions are in mm unless otherwise noted
{{{Security-Related Information - Withhold Under 10 CFR 2.390}}}

3-1304 Revision 0October 2015
Fermi 3Updated Final Safety Analysis Report
3G.4 FIREWATER SERVICE COMPLEX
3G.4.1 Objective and Scope
The objective of this subsection is to document the structural design details, inputs and analytical
results from the analysis of the FWSC of the standard ESBWR plant. The scope includes the
design and analysis of the structure for normal, severe environmental, extreme environmental, and
construction loads.
3G.4.2 Conclusion
The following are the major summary conclusions on the design and analysis of the FWSC.
• Based on the results of finite element analyses performed in accordance with the design
conditions identified in Subsection 3G.4.3, stresses in concrete and reinforcement are less than
the allowable stresses per the applicable regulations, codes and standards listed in Section 3.8.
• The factors of safety against floatation, sliding, and overturning of the structure under various
loading combinations are higher than the required minimum.
• The thickness of the roof slabs and exterior walls are more than the minimum required to
preclude penetration, perforation and spalling resulting from impact of design basis tornado
missiles.
3G.4.3 Structural Description
The FWSC consists of two Firewater Storage Tanks (FWS) and a Fire Pump Enclosure (FPE) that
share a common basemat. Each FWS is capable of storing 2082 m3 (550000 gallons) of water. The
FPE provides enclosure and protection for the Electric Pump, RPV Makeup Water Pump, Diesel
Pump, Tank Recirculation Pump, and Diesel Fuel Oil Storage Tank.
The FWS is designed with a cylindrical reinforced concrete wall and a dome-shaped reinforced
concrete roof. The FWS is lined with a stainless steel plate to prevent leakage of the stored water.
The liner plate is not designed to provide structural integrity to the FWS. The FPE is a reinforced
concrete box type structure with shear walls and a roof slab.
The key dimensions of the FWSC are summarized in Table 3.8-8. Figure 3G.4-1. shows the
concrete outline drawing of the FWSC.
3G.4.4 Analytical Models
3G.4.4.1 Structural Model
The FWSC is analyzed utilizing the finite element computer program NASTRAN. The finite element
model consists of quadrilateral and triangular elements to represent the slabs and walls. The model
is shown in Figures 3G.4-2 through 3G.4-6. The model includes the whole portion of the FWSC
taking the application of nonaxisymmetrical loads into consideration.

3-1305 Revision 0October 2015
Fermi 3Updated Final Safety Analysis Report
The nodal points are defined by a right hand Cartesian coordinate system X, Y, Z. This system,
called the global coordinate system, has its origin located at the center of the FWSC at EL 0 mm.
The positive X axis is in the south direction; the Y axis is in the east direction; the Z axis is vertical
upward. This coordinate system is shown in Figure 3G.4-2.
3G.4.4.2 Foundation Models
The foundation soil is represented by soil springs. The spring constants for rocking and translations
are determined based on the following soil parameters which correspond to the Soft Site conditions
described in Appendix 3A:
• Shear wave velocity: 300 m/s (1000 ft/s)
• Unit weight: 0.0196 MN/m3 (125 lbf/ft3)
• Shear modulus: 180 MN/m2 (26110 psi)
• Poisson’s Ratio: 0.478
Soil springs are attached to the bottom of the foundation mat, and the constraints by side soil are
not included in the model. The values of the soil springs used in the analysis are shown in Table
3G.4-1. The springs have perfectly elastic stiffness.
These spring values are multiplied by the foundation mat nodal point tributary areas to compute the
spring constants assigned to the base slab nodal points.
3G.4.5 Structural Analysis and Design
3G.4.5.1 Site Design Parameters
The key site design parameters are located in Table 3G.1-2.
3G.4.5.2 Design Loads, Load Combinations, and Material Properties
3G.4.5.2.1 Design Loads
3G.4.5.2.1.1 Dead Load (D) and Live Load (L and Lo)
The weights of structures are evaluated using the following unit weights.
• reinforced concrete: 23.5 kN/m3 (150 lbf/ft3)
• steel: 77.0 kN/m3 (490 lbf/ft3)
Weights of major equipment, miscellaneous structures, piping, and commodities are summarized in
Tables 3G.4-2 and 3G.4-3.
Live loads on the FWSC floor and roof slabs are described in Subsection 3.8.4.3.5.
3G.4.5.2.1.2 Snow and Rain Load
The snow and rain load is applied to the roof slab and is taken as shown in Table 3G.1-2.

3-1306 Revision 0October 2015
Fermi 3Updated Final Safety Analysis Report
3G.4.5.2.1.3 Lateral Soil Pressure
Lateral soil pressure is not considered since the effect of lateral soil pressure against the solid
concrete basemat is negligible.
3G.4.5.2.1.4 Wind Load (W)
Wind load is applied to the roof slab and external walls above grade and is based on basic wind
speed given in Table 3G.1-2.
3G.4.5.2.1.5 Tornado Load (Wt)
The tornado load is applied to the roof slab and external walls above grade and its characteristics
are given in Table 3G.1-2. The tornado load, Wt, is further defined by the combinations described in
Subsection 3G.1.5.2.1.5.
3G.4.5.2.1.6 Thermal Load (To)
Thermal load for the FWSC is evaluated for the normal operating condition. Figure 3G.4-7. shows
the section location for temperature distributions for various structural elements of the FWSC, and
Table 3G.4-4 shows the magnitude of equivalent linear temperature distribution.
Stress-free temperature is 15.5°C (60°F).
3G.4.5.2.1.7 Design Seismic Loads
The design seismic loads are obtained by soil–structure interaction analyses, which are described
in Appendix 3A. The seismic loads used for design are as follows:
• Figures 3G.4-8, 3G.4-9: design seismic shears and moments
• Table 3G.4-5: maximum vertical acceleration
The seismic loads are composed of two perpendicular horizontal and one vertical components. The
effects of the three components are combined based on the SRSS method as described in
Subsection 3.8.1.3.6.
3G.4.5.2.2 Load Combinations and Acceptance Criteria
Table 3.8-15 gives load combinations for the safety-related reinforced concrete structure. Based on
previous experience, critical load combinations are selected for the FWSC design as shown in
Table 3G.4-6. The acceptance criteria for the selected combinations are also included in
Table 3G.4-6.
3G.4.5.2.3 Material Properties
Properties of the materials used for the FWSC design analyses are the same as those for the RB,
and they are described in Subsection 3G.1.5.2.3.

3-1307 Revision 0October 2015
Fermi 3Updated Final Safety Analysis Report
3G.4.5.3 Stability Requirements
The stability requirements for the FWSC foundation are same as those for the RB, and they are
described in Subsection 3G.1.5.3.
3G.4.5.4 Structural Design Evaluation
The evaluation of the Seismic Category I structures in the FWSC is performed using the same
procedure as the RB, which is described in Subsection 3G.1.5.4.
The locations of the sections that are selected for evaluation are indicated in Figures 3G.4-3
through 3G.4-6. They are selected, in principle, from the center and both ends of wall and slab,
where it is reasonably expected that the critical stresses appear based on engineering experience
and judgment. Tables 3G.4-7 through 3G.4-11 show the forces and moments at the selected
sections from NASTRAN analysis. Element forces and moments listed in the tables are defined with
relation to the element coordinate system shown in Figure 3G.4-10.. Tables 3G.4-12 through
3G.4-15 show the combined forces and moments in accordance with the selected load
combinations listed in Table 3G.4-6.
Table 3G.4-16 lists the sectional thicknesses and rebar ratios used in the evaluation. The values are
retrieved from the outline drawings shown in Figure 3G.4-1..
Tables 3G.4-17 through 3G.4-20 compares the rebar and concrete stresses at these sections for the
representative elements with the allowable stresses, which are conservatively taken to be the more
limiting of ACI 349-01 and ASME Section III Division 2. Table 3G.4-21 summarizes evaluation
results for transverse shear in accordance with ACI 349, Chapter 11.
3G.4.5.4.1 Shear Walls
The maximum rebar stress of 264.5 MPa (38.36 ksi) is found in the vertical rebar of FWS cylindrical
wall due to the load combination FWSC-6 as shown in Table 3G.4-19. The maximum horizontal
rebar stress is found to be 155.4 MPa (22.54 ksi) in FWS cylindrical wall due to the load
combination FWSC-6. The maximum transverse shear force is found to be 0.563 MN/m (3.21
kips/in) against the shear strength of 1.550 MN/m (8.85 kips/in) in the FWS cylindrical wall.
As for the FPE, the maximum rebar stress of 238.7 MPa (34.62 ksi) is found in the horizontal rebar
of east wall due to the load combination FWSC-6. The maximum vertical rebar stress is found to be
200.9 MPa (29.14 ksi) in east wall in the same load combination. The maximum transverse shear
force is found to be 0.730 MN/m (4.17 kips/in) against the shear strength of 1.313 MN/m
(7.50 kips/in).
3G.4.5.4.2 Roof Floor Slabs
As for the FPE roof slab, the maximum rebar stress of 260.7 MPa (37.81 ksi) is found due to the
load combination FWSC-6 as shown in Table 3G.4-19. The maximum transverse shear force is

3-1308 Revision 0October 2015
Fermi 3Updated Final Safety Analysis Report
found to be 0.237 MN/m (1.35 kips/in) against the shear strength of 0.364 MN/m (2.08 kips/in) in
the roof of FPE.
On the FWS roof slab, the maximum rebar stress of 191.8 MPa (27.82 ksi) is found due to the load
combination FWSC-6. The maximum transverse shear force is found to be 0.103 MN/m
(0.59 kips/in) against the shear strength of 0.399 MN/m (2.28 kips/in).
3G.4.5.4.3 Foundation Mat
The maximum rebar stress is found to be 294.4 MPa (42.70 ksi) due to the load combination
FWSC-6 as shown in Table 3G.4-19. The maximum transverse shear force is found to be
2.674 MN/m (15.27 kips/in) against the shear strength of 4.452 MN/m (25.42 kips/in).
3G.4.5.4.4 Shear Key
The maximum rebar stress of 81.9 MPa (11.88 ksi) is found in the horizontal rebar of shear key due
to the load combination FWSC-6 as shown in Table 3G.4-19. The maximum vertical rebar stress is
found to be 68.0 MPa (9.86 ksi) in the same load combination. The maximum transverse shear
force is found to be 0.376 MN/m (2.15 kips/in) against the shear strength of 1.253 MN/m
(7.15 kips/in).
3G.4.5.5 Foundation Stability
The stabilities of the FWSC foundation against overturning, sliding and floatation are evaluated.
The energy approach is used in calculating the factor of safety against overturning.
The factors of safety against overturning, sliding and floatation are given in Table 3G.4-22. All of
these meet the acceptance criteria given in Table 3.8-14. Shear keys under the basemat shown in
Figure 3G.4-1. are used to resist sliding.
Maximum soil bearing stress is found to be 165 kPa (3450 psf) due to dead plus live loads.
Maximum bearing stresses for load combinations involving SSE are shown in Table 3G.4-23 for
various site conditions.
3G.4.5.5.1 Foundation Settlement
The basemat design is checked against the normal and differential settlement of the FWSC. It is
found that the basemat can resist the maximum settlement at mat foundation corner of 17 mm
(0.7 in.) and the settlement averaged at four corners of 10 mm (0.4 in.). The relative displacement
between two corners along the longest dimension of the building basemat calculated under linearly
varying soil stiffness is 12 mm (0.5 in). These values are specified as maximum settlements in
Table 2.0-1.

3-1309 Revision 0October 2015
Fermi 3Updated Final Safety Analysis Report
3G.4.5.6 Tornado Missile Evaluation
The FWSC is shown in Figure 3G.4-1.. The minimum thickness required to prevent penetration,
concrete spalling and scabbing is evaluated. The methods and procedures are shown in
Subsection 3.5.3.1.1.

3-1310 Revision 0October 2015
Fermi 3Updated Final Safety Analysis Report
SI to U.S. Customary units conversion (SI units are the controlling units and U.S. Customary units are for reference only):1 MN/m/m2= 6.366x10³ lbf/ft/ft2
SI to U.S. Customary units conversion (SI units are the controlling units and U.S. Customary units are for reference only):1 kN = 224.809 lbf
SI to U.S. Customary units conversion (SI units are the controlling units and U.S. Customary units are for reference only):1 kN/m2 = 20.885 psf
Table 3G.4-1 Soil Spring Constants for FWSC Analysis Model
Direction of Spring LoadsStiffness(MN/m/m2)
Horizontal X-direction All 15.303
Y-direction All 17.591
Vertical Horizontal Seismic Loads 63.417
Other Loads 23.861
Table 3G.4-2 Equipment Load of FWSC
Description Weight Remarks
Diesel Pump Skid 106.8 kN (24,000 lbf)
RPV Makeup Water Pump Skid
106.8 kN (24,000 lbf)
Electric Pump Skid 89.0 kN (20,000 lbf)
Diesel Fuel Oil Storage Tank 44.5 kN (10,000 lbf) Each Tank
Tank Recirculation Pump 2.2 kN (500 lbf) Each Pump
Table 3G.4-3 Miscellaneous Structures, Piping, and Commodity Load of FWSC
Region Area Load
Roof of FPE 2.4 kN/m2 (50 psf)

3-1311 Revision 0October 2015
Fermi 3Updated Final Safety Analysis Report
(1) See Figure 3G.4-7. for the location of sections.(2) FWS: Firewater Storage Tank,
FPE: Fire Pump Enclosure,AT: Air,GR: Ground
(3) Td: Average Temperature,Tg: Surface Temperature Difference (positive when temperature at Side 1 is higher)
SI to U.S. Customary units conversion (SI units are the controlling units and U.S. Customary units are for reference only):1°C = (°F - 32)/1.8
Table 3G.4-4 Equivalent Linear Temperature Distributions at Various Sections
Section(1) Side(2)
Equivalent Linear
Temperature(3)(°C)
Normal Operation
1 2 Td Tg
W1 FWS AT -16.9 42.8
W2 FPE AT -22.4 31.3
S1 GR FWS 10.0 11.0
S2 GR FPE 10.5 10.1
S3 GR AT -11.8 54.6
S4 AT FWS -16.4 -41.7
S5 AT FPE -22.7 -30.6
S6 GR GR 15.5 0.0

3-1312 Revision 0October 2015
Fermi 3Updated Final Safety Analysis Report
Table 3G.4-5 Maximum Vertical Acceleration
See Figure 3A.7-7 for the node numbers.SI to U.S. Customary units conversion (SI units are the controlling units and U.S. Customary units are for reference only):1 m = 3.28 ft
19.70 10 FWS 1.69
17.25 9 FWS 1.64
15.53 8 FWS 1.58
13.81 7 FWS 1.58
12.10 6 FWS 1.43
11.00 5 FWS 1.23
9.90 4 FWS 1.13
8.81 3 FWS 1.05
6.73 2 FWS 1.00
4.65 8002 FWSC 0.78
2.15 8001 FWSC 0.78
19.70 11 Oscillator 3.26
8.25 405 FPE 1.12
6.45 402 FPE 1.09
Max. VerticalAcceleration (g)
Elevation(m)
NodeNo.
Stick ModelMax. Vertical
Acceleration (g)
Stick ModelElevation
(m)NodeNo.

3-1313 Revision 0October 2015
Fermi 3Updated Final Safety Analysis Report
*1: U = Conservatively taken as envelope of “Allowable Stress as in ASME B&PV Code Section III, Div. 2, Subsection CC-3420 for Factored Load Combination” and “Required section strength based on the strength design method per ACI 349-01”.
*2: Based on Table 3.8-15.
Table 3G.4-6 Selected Load Combinations for FWSC
CategoryLoad Combination Acceptance
Criteria*1No. *2 D L H To E’ W Wt Ro
Severe FWSC-3 1.4 1.7 1.7 1.7 1.7 U
Environmental FWSC-4 1.05 1.3 1.3 1.3 1.3 1.3 U
SSE FWSC-6 1.0 1.0 1.0 1.0 1.0 1.0 U
Tornado FWSC-7 1.0 1.0 1.0 1.0 1.0 1.0 U

3-1314 Revision 0October 2015
Fermi 3Updated Final Safety Analysis Report
Table 3G.4-7 Results of NASTRAN Analysis: Dead Load
SI to U.S. Customary units conversion (SI units are the controlling units and U.S. Customary units are for reference only):1 MN/m = 6.852x10⁴ lbf/ft1 MNm/m = 2.248x10⁵ lbf-ft/ft
LocationElement
IDNx
(MN/m)Ny
(MN/m)Nxy
(MN/m)Mx
(MNm/m)My
(MNm/m)Mxy
(MNm/m)Qx
(MN/m)Qy
(MN/m)18 0.054 -0.019 -0.036 -0.236 0.112 0.065 -0.073 -0.084
227 -0.042 0.132 0.089 0.046 0.129 0.077 -0.145 -0.022
237 0.049 -0.003 -0.042 0.084 0.199 -0.132 -0.190 0.133
16085 -0.030 0.105 0.052 0.065 0.087 0.053 0.063 0.024
51556 -0.036 -0.011 0.004 0.066 0.082 -0.005 0.007 0.011
51558 -0.040 -0.156 -0.002 -0.040 0.014 -0.011 0.062 -0.003
51576 0.125 -0.048 0.024 0.000 -0.065 -0.009 -0.004 0.078
51578 0.029 -0.066 0.023 -0.010 -0.020 -0.025 0.002 0.019
26007 -0.160 -0.145 -0.005 0.008 0.008 0.000 0.000 0.000
26079 0.086 -0.084 0.021 -0.001 -0.021 0.002 -0.003 0.022
26082 -0.007 0.010 0.091 -0.012 -0.011 0.011 -0.017 0.016
26085 -0.040 0.045 -0.082 -0.016 -0.007 -0.009 -0.020 -0.012
66004 -0.084 -0.071 0.032 -0.001 -0.006 0.000 0.002 0.032
66006 -0.078 -0.002 0.174 -0.002 -0.022 -0.003 -0.007 -0.024
66024 -0.215 -0.107 0.016 -0.014 -0.081 0.003 0.001 0.034
67004 0.084 -0.253 -0.035 -0.006 -0.045 0.001 -0.001 -0.064
67006 0.116 -0.080 -0.195 -0.006 -0.022 0.002 -0.002 -0.038
67024 0.179 -0.148 -0.033 0.020 0.102 -0.002 0.000 -0.068
35007 -0.106 -0.264 0.037 -0.006 0.008 -0.002 -0.005 0.016
35010 -0.064 -0.436 -0.015 0.008 0.023 0.001 0.004 0.018
36507 -0.018 -0.218 0.007 -0.007 -0.003 0.001 -0.002 -0.006
36510 0.000 -0.258 0.000 0.005 0.000 -0.001 0.001 -0.003
38507 0.164 -0.087 0.000 -0.004 -0.016 0.000 0.000 0.027
38510 0.171 -0.090 0.004 -0.002 -0.016 0.000 0.000 0.029
45001 -0.081 -0.323 0.010 -0.004 0.006 -0.002 -0.004 0.012
46501 -0.016 -0.241 0.004 -0.004 -0.001 0.001 -0.001 -0.005
48501 0.173 -0.091 -0.001 -0.003 -0.016 0.000 0.000 0.029
Shear Key 72008 0.007 0.115 -0.059 0.002 0.001 0.000 0.000 -0.001
73017 -0.157 0.004 -0.222 0.002 0.003 0.002 0.001 -0.001
East Wallof FPE
BasematEL 4.65
Roof ofFPE EL8.25
Roof ofTank
South Wallof FPE
Wall ofSouth Tank

3-1315 Revision 0October 2015
Fermi 3Updated Final Safety Analysis Report
Table 3G.4-8 Results of NASTRAN Analysis: Thermal Load (Winter)
SI to U.S. Customary units conversion (SI units are the controlling units and U.S. Customary units are for reference only):1 MN/m = 6.852x10⁴ lbf/ft1 MNm/m = 2.248x10⁵ lbf-ft/ft
LocationElement
IDNx
(MN/m)Ny
(MN/m)Nxy
(MN/m)Mx
(MNm/m)My
(MNm/m)Mxy
(MNm/m)Qx
(MN/m)Qy
(MN/m)18 8.599 0.057 2.492 -8.171 -0.926 -0.375 0.060 0.553
227 -2.901 11.308 -0.088 -3.679 -5.852 0.556 0.159 0.124
237 3.271 4.954 2.362 -6.091 -3.626 -1.039 -0.492 -0.446
16085 -4.574 -1.873 1.031 -1.132 -0.048 0.345 -0.640 0.006
51556 0.100 0.156 0.014 -0.286 -0.237 0.001 -0.006 0.007
51558 0.190 -0.460 -0.038 -0.194 -0.238 -0.008 -0.031 -0.001
51576 0.794 0.118 0.100 -0.295 -0.301 0.000 -0.002 0.025
51578 0.192 -0.230 0.013 -0.256 -0.299 -0.018 -0.031 0.043
26007 0.023 -0.036 -0.006 -0.392 -0.393 0.000 0.001 0.001
26079 0.417 0.111 0.038 -0.446 -0.535 0.011 -0.010 0.079
26082 0.322 0.147 0.076 -0.485 -0.483 0.042 -0.051 0.051
26085 0.240 0.181 -0.005 -0.496 -0.461 -0.035 -0.056 -0.035
66004 2.916 -0.130 -0.123 -0.414 -0.717 0.005 -0.005 -0.184
66006 1.811 0.944 -0.412 -0.378 -0.693 -0.024 -0.203 -0.618
66024 -0.091 0.007 -0.037 -0.349 -0.277 0.002 0.016 -0.217
67004 3.209 -0.623 -0.268 0.380 0.424 -0.001 0.002 0.026
67006 3.333 0.484 -2.062 0.317 0.398 0.006 0.135 0.170
67024 1.582 -0.137 -0.254 0.372 0.346 0.002 -0.007 0.044
35007 3.012 -0.603 0.194 -1.162 -1.081 -0.009 -0.072 -0.324
35010 2.650 0.030 -0.198 -1.253 -1.254 0.033 0.015 -0.396
36507 -0.295 -0.327 0.040 -1.147 -1.126 0.000 -0.011 0.082
36510 -0.284 -0.025 -0.256 -1.181 -1.126 -0.005 0.015 0.078
38507 0.103 -0.062 0.007 -1.105 -0.771 0.004 0.000 -0.181
38510 -0.050 0.003 -0.154 -1.112 -0.771 -0.018 -0.005 -0.205
45001 3.490 0.717 -0.047 -1.173 -1.294 -0.017 0.003 -0.402
46501 -0.329 0.464 0.093 -1.200 -1.154 -0.002 -0.004 0.080
48501 -0.195 0.079 0.049 -1.123 -0.772 0.006 0.002 -0.229
Shear Key 72008 0.030 -0.442 0.322 0.098 0.107 0.033 0.018 -0.058
73017 -6.179 -0.445 -0.899 0.020 0.028 0.034 0.011 -0.015
South Wallof FPE
East Wallof FPE
Wall ofSouth Tank
BasematEL 4.65
Roof ofFPE EL8.25
Roof ofTank

3-1316 Revision 0October 2015
Fermi 3Updated Final Safety Analysis Report
Table 3G.4-9 Results of NASTRAN Analysis: Seismic Load (Horizontal: North to South Direction)
SI to U.S. Customary units conversion (SI units are the controlling units and U.S. Customary units are for reference only):1 MN/m = 6.852x10⁴ lbf/ft1 MNm/m = 2.248x10⁵ lbf-ft/ft
LocationElement
IDNx
(MN/m)Ny
(MN/m)Nxy
(MN/m)Mx
(MNm/m)My
(MNm/m)Mxy
(MNm/m)Qx
(MN/m)Qy
(MN/m)18 0.593 0.091 0.022 -1.324 -0.118 0.229 0.540 0.107
227 2.664 0.037 -0.677 -3.349 -1.025 -0.205 2.090 -0.375
237 1.515 -0.244 0.179 -3.887 -0.772 0.404 0.772 -0.676
16085 1.538 0.080 0.030 -2.242 -0.799 0.004 -0.710 -0.678
51556 0.027 0.050 -0.097 -0.001 -0.003 -0.003 0.003 0.000
51558 0.052 0.429 -0.042 -0.019 -0.011 0.000 0.008 -0.001
51576 0.025 0.018 -0.353 0.000 0.002 -0.004 -0.002 -0.002
51578 0.017 0.123 -0.139 -0.008 0.003 -0.003 0.006 -0.010
26007 0.083 -0.075 0.006 -0.002 -0.002 0.000 -0.003 0.000
26079 0.169 -0.104 -0.023 -0.006 -0.015 0.005 -0.001 0.009
26082 0.075 -0.286 -0.086 0.003 0.000 -0.002 0.012 -0.007
26085 -0.011 -0.315 0.185 0.016 0.006 0.008 0.023 0.013
66004 0.090 -0.141 0.067 -0.006 -0.018 -0.005 -0.014 0.004
66006 0.143 0.007 -0.313 -0.009 -0.043 -0.012 -0.003 -0.097
66024 0.521 -0.048 0.004 -0.011 -0.024 -0.002 -0.004 0.005
67004 0.110 -0.097 0.577 0.001 0.005 -0.003 0.001 0.003
67006 0.515 -0.082 0.035 0.001 0.021 -0.004 0.007 0.036
67024 0.060 -0.024 0.460 -0.001 -0.002 -0.001 0.000 0.004
35007 0.619 -0.601 -0.978 -0.002 -0.136 -0.018 0.006 -0.155
35010 1.208 1.697 -1.154 -0.078 -0.518 0.027 0.002 -0.460
36507 -0.085 -0.429 -1.056 0.041 0.059 -0.007 -0.023 0.016
36510 -0.572 0.729 -1.061 0.035 0.088 -0.016 0.020 0.037
38507 0.167 -0.078 -0.226 0.012 0.005 0.010 0.001 0.040
38510 -0.487 0.209 -0.372 0.011 0.027 -0.027 -0.008 0.013
45001 1.153 3.799 0.624 -0.171 -0.688 -0.009 0.006 -0.535
46501 -0.831 1.548 0.283 -0.048 0.065 0.007 -0.012 0.028
48501 -0.804 0.361 0.101 -0.007 0.035 0.010 0.003 -0.021
Shear Key 72008 -0.203 -0.025 -0.364 0.101 -0.304 0.094 0.128 0.316
73017 -3.697 1.584 1.701 -0.006 -0.007 0.003 -0.004 0.002
BasematEL 4.65
Roof ofFPE EL8.25
Roof ofTank
South Wallof FPE
East Wallof FPE
Wall ofSouth Tank

3-1317 Revision 0October 2015
Fermi 3Updated Final Safety Analysis Report
Table 3G.4-10 Results of NASTRAN Analysis: Seismic Load (Horizontal: West to East Direction)
SI to U.S. Customary units conversion (SI units are the controlling units and U.S. Customary units are for reference only):1 MN/m = 6.852x10⁴ lbf/ft1 MNm/m = 2.248x10⁵ lbf-ft/ft
LocationElement
IDNx
(MN/m)Ny
(MN/m)Nxy
(MN/m)Mx
(MNm/m)My
(MNm/m)Mxy
(MNm/m)Qx
(MN/m)Qy
(MN/m)18 0.800 0.595 0.472 1.071 -0.398 -0.681 0.524 0.306
227 -0.010 0.186 1.103 -0.105 -0.555 -1.480 0.412 0.297
237 -0.135 -0.546 0.240 1.105 1.704 -1.255 -1.153 0.983
16085 0.067 0.055 -0.142 -0.441 -0.396 -0.583 -0.156 0.043
51556 0.082 0.035 -0.085 -0.009 -0.007 -0.008 -0.001 0.010
51558 0.021 -0.112 -0.268 0.009 0.004 -0.014 -0.010 -0.010
51576 0.827 -0.008 0.031 -0.033 -0.073 0.002 -0.001 0.027
51578 0.249 -0.109 -0.015 0.014 -0.023 0.003 -0.033 0.031
26007 -0.004 0.004 0.037 0.000 -0.001 -0.001 0.000 -0.003
26079 0.202 0.065 0.082 0.003 0.002 0.002 -0.003 0.014
26082 0.126 0.074 0.140 -0.011 -0.003 0.006 -0.012 0.011
26085 -0.116 0.069 0.091 0.004 0.001 0.001 0.002 0.004
66004 -0.132 0.151 -0.153 -0.006 -0.019 0.006 0.002 -0.015
66006 -0.367 0.296 0.628 -0.028 -0.088 0.002 -0.003 -0.125
66024 -0.181 0.015 0.142 0.003 0.011 -0.003 -0.007 -0.015
67004 0.294 -0.447 -0.157 -0.035 -0.180 0.001 -0.004 -0.108
67006 0.374 -0.117 -0.863 -0.008 -0.099 -0.001 -0.040 -0.122
67024 1.030 -0.143 -0.112 0.011 0.045 0.005 0.004 -0.104
35007 -0.982 -1.785 0.030 -0.003 0.317 -0.022 -0.025 0.356
35010 -0.396 -2.459 -0.962 0.121 0.371 -0.016 0.027 0.264
36507 0.770 -0.853 0.028 -0.079 -0.092 0.005 -0.014 -0.036
36510 0.591 -1.094 -0.891 0.058 -0.019 -0.006 -0.015 -0.005
38507 0.576 -0.266 0.082 -0.025 -0.037 0.016 0.005 -0.033
38510 0.501 -0.250 -0.181 0.009 -0.025 0.011 0.002 0.014
45001 0.183 0.655 -1.590 -0.032 -0.096 0.021 0.032 -0.066
46501 -0.142 0.304 -1.419 -0.021 0.001 -0.023 0.018 0.001
48501 -0.124 0.064 -0.362 -0.005 0.006 -0.018 -0.005 -0.007
Shear Key 72008 0.258 0.178 -0.032 -0.013 0.000 0.021 0.015 0.002
73017 -0.047 0.013 0.029 -0.025 0.219 -0.344 -0.085 -0.239
BasematEL 4.65
Roof ofFPE EL8.25
Roof ofTank
South Wallof FPE
East Wallof FPE
Wall ofSouth Tank

3-1318 Revision 0October 2015
Fermi 3Updated Final Safety Analysis Report
Table 3G.4-11 Results of NASTRAN Analysis: Seismic Load (Vertical: Upward Direction)
SI to U.S. Customary units conversion (SI units are the controlling units and U.S. Customary units are for reference only):1 MN/m = 6.852x10⁴ lbf/ft1 MNm/m = 2.248x10⁵ lbf-ft/ft
LocationElement
IDNx
(MN/m)Ny
(MN/m)Nxy
(MN/m)Mx
(MNm/m)My
(MNm/m)Mxy
(MNm/m)Qx
(MN/m)Qy
(MN/m)18 -0.236 0.036 0.135 0.943 -0.181 -0.154 0.252 0.113
227 -0.084 -0.365 -0.358 0.152 -0.268 -0.261 0.677 0.092
237 -0.221 -0.014 0.056 -0.064 -0.453 0.267 0.604 -0.349
16085 -0.326 -0.406 -0.359 0.289 -0.190 -0.239 0.405 -0.026
51556 0.018 -0.053 -0.009 -0.079 -0.119 0.006 -0.006 -0.017
51558 0.019 0.386 0.009 0.026 -0.031 0.016 -0.069 0.004
51576 -0.508 0.044 -0.076 0.011 0.102 0.011 0.006 -0.113
51578 -0.134 0.164 -0.091 0.001 0.030 0.035 0.012 -0.037
26007 0.344 0.307 0.010 -0.016 -0.016 0.000 0.001 0.000
26079 -0.158 0.182 -0.043 0.001 0.039 -0.005 0.005 -0.044
26082 0.033 -0.016 -0.191 0.023 0.020 -0.021 0.033 -0.031
26085 0.098 -0.091 0.177 0.031 0.013 0.018 0.039 0.024
66004 0.187 -0.009 -0.070 0.013 0.086 -0.002 -0.004 0.000
66006 0.147 -0.255 -0.428 0.012 0.098 0.007 0.027 0.129
66024 0.541 0.119 -0.029 0.014 0.091 -0.005 -0.004 -0.001
67004 -0.357 0.551 0.144 0.012 0.084 -0.002 0.003 0.105
67006 -0.493 -0.011 0.741 0.014 0.045 -0.002 0.003 0.071
67024 -0.706 0.241 0.128 -0.030 -0.149 0.001 -0.001 0.109
35007 -0.116 0.226 -0.103 -0.005 -0.126 0.004 0.012 -0.217
35010 -0.212 0.719 0.009 -0.036 -0.159 -0.004 -0.012 -0.221
36507 -0.773 0.317 -0.016 0.024 0.046 -0.002 0.004 0.041
36510 -0.824 0.448 -0.016 -0.006 0.037 0.003 -0.003 0.034
38507 -0.381 0.166 -0.002 0.007 0.020 -0.001 0.000 -0.063
38510 -0.410 0.181 -0.022 0.001 0.021 -0.001 -0.001 -0.069
45001 -0.170 0.472 -0.032 -0.006 -0.102 0.008 0.018 -0.200
46501 -0.787 0.428 -0.007 0.016 0.038 -0.002 0.004 0.040
48501 -0.425 0.187 0.006 0.004 0.020 -0.001 0.000 -0.070
Shear Key 72008 -0.225 -0.068 -0.221 -0.011 -0.010 0.002 0.000 0.005
73017 0.888 -0.073 0.845 -0.008 -0.013 -0.009 -0.005 0.006
Roof ofFPE EL8.25
East Wallof FPE
Wall ofSouth Tank
BasematEL 4.65
Roof ofTank
South Wallof FPE

3-1319 Revision 0October 2015
Fermi 3Updated Final Safety Analysis Report
Table 3G.4-12 Combined Forces and Moments: Selected Load Combination FWSC-3
OTHR: Loads other than thermal loadsTEMP: Thermal loadsSI to U.S. Customary units conversion (SI units are the controlling units and U.S. Customary units are for reference only):1 MN/m = 6.852x10⁴ lbf/ft1 MNm/m = 2.248x10⁵ lbf-ft/ft
Location Element ID Nx
(MN/m)Ny
(MN/m)Nxy
(MN/m)Mx
(MNm/m)My
(MNm/m)Mxy
(MNm/m)Qx
(MN/m)Qy
(MN/m)18 OTHR 0.220 -0.029 -0.115 -0.849 0.185 0.149 -0.185 -0.125
TEMP 0.000 0.000 0.000 0.000 0.000 0.000 0.000 0.000227 OTHR 0.166 0.374 0.255 -0.232 0.217 0.212 -0.430 -0.114
TEMP 0.000 0.000 0.000 0.000 0.000 0.000 0.000 0.000237 OTHR 0.265 -0.003 -0.040 -0.102 0.394 -0.246 -0.483 0.296
TEMP 0.000 0.000 0.000 0.000 0.000 0.000 0.000 0.00016085 OTHR 0.284 0.396 0.281 -0.271 0.152 0.190 -0.290 -0.027
TEMP 0.000 0.000 0.000 0.000 0.000 0.000 0.000 0.00051556 OTHR -0.039 0.031 0.006 0.101 0.138 -0.008 0.009 0.020
TEMP 0.000 0.000 0.000 0.000 0.000 0.000 0.000 0.00051558 OTHR -0.037 -0.341 -0.008 -0.047 0.030 -0.019 0.092 -0.005
TEMP 0.000 0.000 0.000 0.000 0.000 0.000 0.000 0.00051576 OTHR 0.410 -0.058 0.057 -0.007 -0.113 -0.014 -0.007 0.131
TEMP 0.000 0.000 0.000 0.000 0.000 0.000 0.000 0.00051578 OTHR 0.107 -0.145 0.071 -0.009 -0.033 -0.042 -0.006 0.037
TEMP 0.000 0.000 0.000 0.000 0.000 0.000 0.000 0.00026007 OTHR -0.265 -0.204 -0.014 0.011 0.011 0.000 -0.002 0.000
TEMP 0.000 0.000 0.000 0.000 0.000 0.000 0.000 0.00026079 OTHR 0.107 -0.123 0.041 -0.001 -0.028 0.004 -0.004 0.032
TEMP 0.000 0.000 0.000 0.000 0.000 0.000 0.000 0.00026082 OTHR -0.037 0.030 0.139 -0.017 -0.014 0.014 -0.022 0.021
TEMP 0.000 0.000 0.000 0.000 0.000 0.000 0.000 0.00026085 OTHR -0.076 0.077 -0.135 -0.023 -0.009 -0.013 -0.026 -0.016
TEMP 0.000 0.000 0.000 0.000 0.000 0.000 0.000 0.00066004 OTHR -0.173 -0.049 0.076 -0.009 -0.061 0.001 0.004 0.028
TEMP 0.000 0.000 0.000 0.000 0.000 0.000 0.000 0.00066006 OTHR -0.134 0.168 0.383 -0.009 -0.081 -0.007 -0.023 -0.103
TEMP 0.000 0.000 0.000 0.000 0.000 0.000 0.000 0.00066024 OTHR -0.478 -0.157 0.030 -0.020 -0.122 0.005 0.003 0.024
TEMP 0.000 0.000 0.000 0.000 0.000 0.000 0.000 0.00067004 OTHR 0.289 -0.539 -0.091 -0.012 -0.087 0.002 -0.003 -0.121
TEMP 0.000 0.000 0.000 0.000 0.000 0.000 0.000 0.00067006 OTHR 0.430 -0.048 -0.615 -0.014 -0.044 0.003 -0.002 -0.073
TEMP 0.000 0.000 0.000 0.000 0.000 0.000 0.000 0.00067024 OTHR 0.574 -0.264 -0.091 0.034 0.173 -0.002 0.001 -0.116
TEMP 0.000 0.000 0.000 0.000 0.000 0.000 0.000 0.00035007 OTHR 0.059 -0.269 0.029 0.001 0.097 -0.005 -0.011 0.169
TEMP 0.000 0.000 0.000 0.000 0.000 0.000 0.000 0.00035010 OTHR 0.202 -0.655 -0.110 0.027 0.103 0.003 0.012 0.149
TEMP 0.000 0.000 0.000 0.000 0.000 0.000 0.000 0.00036507 OTHR 0.595 -0.270 -0.040 -0.023 -0.038 0.001 -0.005 -0.031
TEMP 0.000 0.000 0.000 0.000 0.000 0.000 0.000 0.00036510 OTHR 0.607 -0.373 -0.054 0.008 -0.023 -0.005 0.002 -0.024
TEMP 0.000 0.000 0.000 0.000 0.000 0.000 0.000 0.00038507 OTHR 0.281 -0.120 0.003 -0.007 -0.016 0.002 0.000 0.042
TEMP 0.000 0.000 0.000 0.000 0.000 0.000 0.000 0.00038510 OTHR 0.291 -0.134 0.025 0.000 -0.012 0.003 0.001 0.050
TEMP 0.000 0.000 0.000 0.000 0.000 0.000 0.000 0.00045001 OTHR 0.171 -0.295 0.077 -0.005 0.039 -0.007 -0.015 0.120
TEMP 0.000 0.000 0.000 0.000 0.000 0.000 0.000 0.00046501 OTHR 0.557 -0.328 0.025 -0.010 -0.021 0.003 -0.002 -0.030
TEMP 0.000 0.000 0.000 0.000 0.000 0.000 0.000 0.00048501 OTHR 0.306 -0.143 -0.007 0.000 -0.009 0.000 0.000 0.054
TEMP 0.000 0.000 0.000 0.000 0.000 0.000 0.000 0.00072008 OTHR 0.165 0.148 0.126 0.012 0.008 0.002 0.005 -0.004
TEMP 0.000 0.000 0.000 0.000 0.000 0.000 0.000 0.00073017 OTHR -0.854 0.175 -0.613 0.006 0.010 0.007 0.004 -0.005
TEMP 0.000 0.000 0.000 0.000 0.000 0.000 0.000 0.000
Basemat EL4.65
Roof of FPEEL 8.25
Roof of Tank
South Wall ofFPE
East Wall ofFPE
Wall of SouthTank
Shear Key
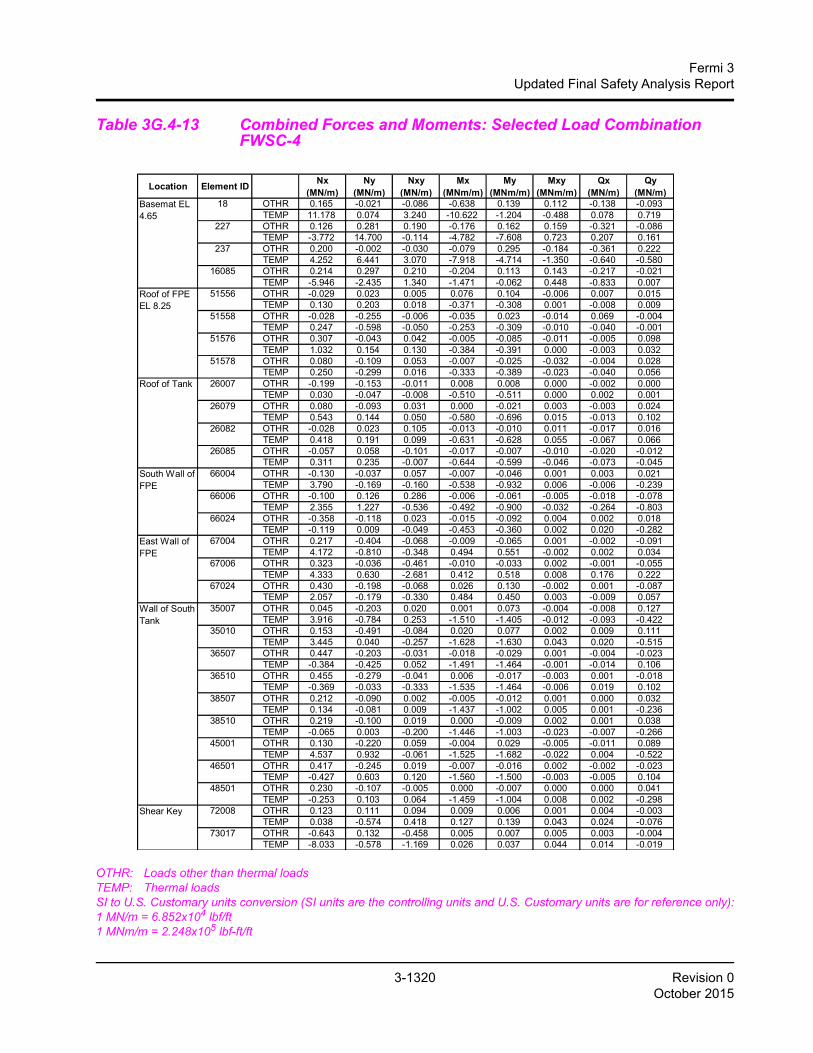
3-1320 Revision 0October 2015
Fermi 3Updated Final Safety Analysis Report
Table 3G.4-13 Combined Forces and Moments: Selected Load Combination FWSC-4
OTHR: Loads other than thermal loadsTEMP: Thermal loads SI to U.S. Customary units conversion (SI units are the controlling units and U.S. Customary units are for reference only):1 MN/m = 6.852x10⁴ lbf/ft1 MNm/m = 2.248x10⁵ lbf-ft/ft
Location Element ID Nx
(MN/m)Ny
(MN/m)Nxy
(MN/m)Mx
(MNm/m)My
(MNm/m)Mxy
(MNm/m)Qx
(MN/m)Qy
(MN/m)18 OTHR 0.165 -0.021 -0.086 -0.638 0.139 0.112 -0.138 -0.093
TEMP 11.178 0.074 3.240 -10.622 -1.204 -0.488 0.078 0.719227 OTHR 0.126 0.281 0.190 -0.176 0.162 0.159 -0.321 -0.086
TEMP -3.772 14.700 -0.114 -4.782 -7.608 0.723 0.207 0.161237 OTHR 0.200 -0.002 -0.030 -0.079 0.295 -0.184 -0.361 0.222
TEMP 4.252 6.441 3.070 -7.918 -4.714 -1.350 -0.640 -0.58016085 OTHR 0.214 0.297 0.210 -0.204 0.113 0.143 -0.217 -0.021
TEMP -5.946 -2.435 1.340 -1.471 -0.062 0.448 -0.833 0.00751556 OTHR -0.029 0.023 0.005 0.076 0.104 -0.006 0.007 0.015
TEMP 0.130 0.203 0.018 -0.371 -0.308 0.001 -0.008 0.00951558 OTHR -0.028 -0.255 -0.006 -0.035 0.023 -0.014 0.069 -0.004
TEMP 0.247 -0.598 -0.050 -0.253 -0.309 -0.010 -0.040 -0.00151576 OTHR 0.307 -0.043 0.042 -0.005 -0.085 -0.011 -0.005 0.098
TEMP 1.032 0.154 0.130 -0.384 -0.391 0.000 -0.003 0.03251578 OTHR 0.080 -0.109 0.053 -0.007 -0.025 -0.032 -0.004 0.028
TEMP 0.250 -0.299 0.016 -0.333 -0.389 -0.023 -0.040 0.05626007 OTHR -0.199 -0.153 -0.011 0.008 0.008 0.000 -0.002 0.000
TEMP 0.030 -0.047 -0.008 -0.510 -0.511 0.000 0.002 0.00126079 OTHR 0.080 -0.093 0.031 0.000 -0.021 0.003 -0.003 0.024
TEMP 0.543 0.144 0.050 -0.580 -0.696 0.015 -0.013 0.10226082 OTHR -0.028 0.023 0.105 -0.013 -0.010 0.011 -0.017 0.016
TEMP 0.418 0.191 0.099 -0.631 -0.628 0.055 -0.067 0.06626085 OTHR -0.057 0.058 -0.101 -0.017 -0.007 -0.010 -0.020 -0.012
TEMP 0.311 0.235 -0.007 -0.644 -0.599 -0.046 -0.073 -0.04566004 OTHR -0.130 -0.037 0.057 -0.007 -0.046 0.001 0.003 0.021
TEMP 3.790 -0.169 -0.160 -0.538 -0.932 0.006 -0.006 -0.23966006 OTHR -0.100 0.126 0.286 -0.006 -0.061 -0.005 -0.018 -0.078
TEMP 2.355 1.227 -0.536 -0.492 -0.900 -0.032 -0.264 -0.80366024 OTHR -0.358 -0.118 0.023 -0.015 -0.092 0.004 0.002 0.018
TEMP -0.119 0.009 -0.049 -0.453 -0.360 0.002 0.020 -0.28267004 OTHR 0.217 -0.404 -0.068 -0.009 -0.065 0.001 -0.002 -0.091
TEMP 4.172 -0.810 -0.348 0.494 0.551 -0.002 0.002 0.03467006 OTHR 0.323 -0.036 -0.461 -0.010 -0.033 0.002 -0.001 -0.055
TEMP 4.333 0.630 -2.681 0.412 0.518 0.008 0.176 0.22267024 OTHR 0.430 -0.198 -0.068 0.026 0.130 -0.002 0.001 -0.087
TEMP 2.057 -0.179 -0.330 0.484 0.450 0.003 -0.009 0.05735007 OTHR 0.045 -0.203 0.020 0.001 0.073 -0.004 -0.008 0.127
TEMP 3.916 -0.784 0.253 -1.510 -1.405 -0.012 -0.093 -0.42235010 OTHR 0.153 -0.491 -0.084 0.020 0.077 0.002 0.009 0.111
TEMP 3.445 0.040 -0.257 -1.628 -1.630 0.043 0.020 -0.51536507 OTHR 0.447 -0.203 -0.031 -0.018 -0.029 0.001 -0.004 -0.023
TEMP -0.384 -0.425 0.052 -1.491 -1.464 -0.001 -0.014 0.10636510 OTHR 0.455 -0.279 -0.041 0.006 -0.017 -0.003 0.001 -0.018
TEMP -0.369 -0.033 -0.333 -1.535 -1.464 -0.006 0.019 0.10238507 OTHR 0.212 -0.090 0.002 -0.005 -0.012 0.001 0.000 0.032
TEMP 0.134 -0.081 0.009 -1.437 -1.002 0.005 0.001 -0.23638510 OTHR 0.219 -0.100 0.019 0.000 -0.009 0.002 0.001 0.038
TEMP -0.065 0.003 -0.200 -1.446 -1.003 -0.023 -0.007 -0.26645001 OTHR 0.130 -0.220 0.059 -0.004 0.029 -0.005 -0.011 0.089
TEMP 4.537 0.932 -0.061 -1.525 -1.682 -0.022 0.004 -0.52246501 OTHR 0.417 -0.245 0.019 -0.007 -0.016 0.002 -0.002 -0.023
TEMP -0.427 0.603 0.120 -1.560 -1.500 -0.003 -0.005 0.10448501 OTHR 0.230 -0.107 -0.005 0.000 -0.007 0.000 0.000 0.041
TEMP -0.253 0.103 0.064 -1.459 -1.004 0.008 0.002 -0.298Shear Key 72008 OTHR 0.123 0.111 0.094 0.009 0.006 0.001 0.004 -0.003
TEMP 0.038 -0.574 0.418 0.127 0.139 0.043 0.024 -0.07673017 OTHR -0.643 0.132 -0.458 0.005 0.007 0.005 0.003 -0.004
TEMP -8.033 -0.578 -1.169 0.026 0.037 0.044 0.014 -0.019
Roof of Tank
South Wall ofFPE
East Wall ofFPE
Wall of SouthTank
Basemat EL4.65
Roof of FPEEL 8.25

3-1321 Revision 0October 2015
Fermi 3Updated Final Safety Analysis Report
Table 3G.4-14 Combined Forces and Moments: Selected Load CombinationFWSC-6
Location Element ID Nx
(MN/m)Ny
(MN/m)Nxy
(MN/m)Mx
(MNm/m)My
(MNm/m)Mxy
(MNm/m)Qx
(MN/m)Qy
(MN/m)18 OTHR 0.136 -0.025 -0.082 -0.547 0.146 0.101 -0.151 -0.099
TEMP 8.599 0.057 2.492 -8.171 -0.926 -0.375 0.060 0.553SEIS 1.026 0.603 0.495 1.947 0.453 0.735 0.794 0.343
227 OTHR 0.015 0.250 0.212 -0.033 0.201 0.158 -0.382 -0.064TEMP -2.901 11.308 -0.088 -3.679 -5.852 0.556 0.159 0.124SEIS 2.665 0.412 1.364 3.354 1.197 1.518 2.235 0.488
237 OTHR 0.125 0.007 -0.044 0.072 0.311 -0.187 -0.371 0.229TEMP 3.271 4.954 2.362 -6.091 -3.626 -1.039 -0.492 -0.446SEIS 1.544 0.600 0.321 4.042 1.925 1.345 1.513 1.244
16085 OTHR 0.156 0.258 0.200 -0.119 0.146 0.136 -0.186 0.007TEMP -4.574 -1.873 1.031 -1.132 -0.048 0.345 -0.640 0.006SEIS 1.574 0.418 0.397 2.303 0.912 0.630 0.833 0.681
51556 OTHR -0.033 0.013 0.006 0.080 0.108 -0.006 0.008 0.015TEMP 0.100 0.156 0.014 -0.286 -0.237 0.001 -0.006 0.007SEIS 0.088 0.081 0.130 0.079 0.120 0.010 0.007 0.020
51558 OTHR -0.036 -0.265 -0.005 -0.039 0.023 -0.015 0.073 -0.004TEMP 0.190 -0.460 -0.038 -0.194 -0.238 -0.008 -0.031 -0.001SEIS 0.060 0.588 0.272 0.033 0.033 0.022 0.071 0.011
51576 OTHR 0.292 -0.052 0.047 -0.004 -0.088 -0.011 -0.005 0.102TEMP 0.794 0.118 0.100 -0.295 -0.301 0.000 -0.002 0.025SEIS 0.971 0.048 0.363 0.035 0.125 0.012 0.006 0.116
51578 OTHR 0.074 -0.112 0.053 -0.008 -0.026 -0.032 -0.003 0.028TEMP 0.192 -0.230 0.013 -0.256 -0.299 -0.018 -0.031 0.043SEIS 0.283 0.233 0.167 0.016 0.038 0.036 0.036 0.049
26007 OTHR -0.217 -0.194 -0.006 0.010 0.010 0.000 0.000 0.000TEMP 0.023 -0.036 -0.006 -0.392 -0.393 0.000 0.001 0.001SEIS 0.354 0.316 0.038 0.016 0.016 0.001 0.003 0.003
26079 OTHR 0.103 -0.115 0.028 -0.001 -0.025 0.003 -0.003 0.028TEMP 0.417 0.111 0.038 -0.446 -0.535 0.011 -0.010 0.079SEIS 0.307 0.220 0.095 0.007 0.042 0.007 0.006 0.047
26082 OTHR -0.019 0.010 0.121 -0.015 -0.013 0.013 -0.021 0.020TEMP 0.322 0.147 0.076 -0.485 -0.483 0.042 -0.051 0.051SEIS 0.151 0.296 0.252 0.026 0.020 0.022 0.037 0.034
26085 OTHR -0.061 0.058 -0.111 -0.020 -0.008 -0.012 -0.025 -0.015TEMP 0.240 0.181 -0.005 -0.496 -0.461 -0.035 -0.056 -0.035SEIS 0.152 0.335 0.272 0.035 0.014 0.020 0.046 0.028
Basemat EL4.65
Roof of FPEEL 8.25
Roof of Tank

3-1322 Revision 0October 2015
Fermi 3Updated Final Safety Analysis Report
Table 3G.4-14 Combined Forces and Moments: Selected Load Combination FWSC-6 (Continued)
OTHR: Loads other than thermal and seismic loadsTEMP: Thermal loadsSEIS: Seismic loads SI to U.S. Customary units conversion (SI units are the controlling units and U.S. Customary units
are for reference only):1 MN/m = 6.852x10⁴ lbf/ft1 MNm/m = 2.248x10⁵ lbf-ft/ft
Location Element ID Nx
(MN/m)Ny
(MN/m)Nxy
(MN/m)Mx
(MNm/m)My
(MNm/m)Mxy
(MNm/m)Qx
(MN/m)Qy
(MN/m)66004 OTHR -0.132 -0.039 0.053 -0.006 -0.040 0.001 0.003 0.023
TEMP 2.916 -0.130 -0.123 -0.414 -0.717 0.005 -0.005 -0.184SEIS 0.246 0.207 0.204 0.015 0.090 0.008 0.014 0.015
66006 OTHR -0.109 0.109 0.291 -0.006 -0.055 -0.005 -0.016 -0.069TEMP 1.811 0.944 -0.412 -0.378 -0.693 -0.024 -0.203 -0.618SEIS 0.420 0.392 0.825 0.032 0.139 0.014 0.027 0.204
66024 OTHR -0.367 -0.122 0.023 -0.016 -0.095 0.004 0.002 0.025TEMP -0.091 0.007 -0.037 -0.349 -0.277 0.002 0.016 -0.217SEIS 0.772 0.129 0.167 0.018 0.095 0.006 0.009 0.016
67004 OTHR 0.205 -0.394 -0.083 -0.009 -0.065 0.001 -0.002 -0.088TEMP 3.209 -0.623 -0.268 0.380 0.424 -0.001 0.002 0.026SEIS 0.475 0.716 0.617 0.037 0.199 0.004 0.005 0.150
67006 OTHR 0.283 -0.042 -0.435 -0.010 -0.033 0.002 -0.002 -0.054TEMP 3.333 0.484 -2.062 0.317 0.398 0.006 0.135 0.170SEIS 0.805 0.146 1.139 0.016 0.110 0.005 0.040 0.146
67024 OTHR 0.410 -0.200 -0.075 0.026 0.133 -0.002 0.001 -0.092TEMP 1.582 -0.137 -0.254 0.372 0.346 0.002 -0.007 0.044SEIS 1.250 0.281 0.492 0.032 0.156 0.005 0.005 0.151
35007 OTHR 0.019 -0.186 0.072 0.000 0.070 -0.003 -0.008 0.121TEMP 3.012 -0.603 0.194 -1.162 -1.081 -0.009 -0.072 -0.324SEIS 1.167 1.897 0.991 0.006 0.368 0.029 0.028 0.445
35010 OTHR 0.088 -0.517 -0.014 0.022 0.093 0.003 0.008 0.123TEMP 2.650 0.030 -0.198 -1.253 -1.254 0.033 0.015 -0.396SEIS 1.289 3.073 1.507 0.149 0.657 0.032 0.030 0.575
36507 OTHR 0.401 -0.211 0.011 -0.016 -0.026 0.002 -0.003 -0.023TEMP -0.295 -0.327 0.040 -1.147 -1.126 0.000 -0.011 0.082SEIS 1.094 1.006 1.059 0.092 0.119 0.009 0.027 0.057
36510 OTHR 0.436 -0.296 0.006 0.005 -0.020 -0.002 0.002 -0.019TEMP -0.284 -0.025 -0.256 -1.181 -1.126 -0.005 0.015 0.078SEIS 1.165 1.389 1.387 0.068 0.098 0.017 0.026 0.051
38507 OTHR 0.237 -0.106 0.001 -0.005 -0.014 0.001 0.000 0.039TEMP 0.103 -0.062 0.007 -1.105 -0.771 0.004 0.000 -0.181SEIS 0.711 0.323 0.242 0.029 0.042 0.019 0.005 0.082
38510 OTHR 0.254 -0.115 0.012 -0.001 -0.015 0.001 0.000 0.043TEMP -0.050 0.003 -0.154 -1.112 -0.771 -0.018 -0.005 -0.205SEIS 0.810 0.372 0.415 0.015 0.043 0.029 0.009 0.071
45001 OTHR 0.057 -0.328 0.025 0.002 0.058 -0.005 -0.011 0.111TEMP 3.490 0.717 -0.047 -1.173 -1.294 -0.017 0.003 -0.402SEIS 1.180 3.884 1.713 0.174 0.702 0.024 0.037 0.575
46501 OTHR 0.409 -0.273 0.006 -0.010 -0.021 0.002 -0.003 -0.023TEMP -0.329 0.464 0.093 -1.200 -1.154 -0.002 -0.004 0.080SEIS 1.154 1.634 1.448 0.054 0.075 0.024 0.022 0.048
48501 OTHR 0.262 -0.117 -0.003 -0.003 -0.014 0.000 0.000 0.043TEMP -0.195 0.079 0.049 -1.123 -0.772 0.006 0.002 -0.229SEIS 0.918 0.412 0.377 0.009 0.041 0.020 0.005 0.073
72008 OTHR 0.130 0.104 0.106 0.006 0.005 -0.001 0.000 -0.003TEMP 0.030 -0.442 0.322 0.098 0.107 0.033 0.018 -0.058SEIS 0.398 0.192 0.427 0.102 0.304 0.096 0.129 0.316
73017 OTHR -0.472 0.064 -0.497 0.005 0.007 0.005 0.003 -0.003TEMP -6.179 -0.445 -0.899 0.020 0.028 0.034 0.011 -0.015SEIS 3.802 1.586 1.899 0.032 0.219 0.344 0.085 0.239
East Wall ofFPE
South Wall ofFPE
Shear Key
Wall of SouthTank

3-1323 Revision 0October 2015
Fermi 3Updated Final Safety Analysis Report
Table 3G.4-15 Combined Forces and Moments: Selected Load CombinationFWSC-7
Location Element ID Nx
(MN/m)Ny
(MN/m)Nxy
(MN/m)Mx
(MNm/m)My
(MNm/m)Mxy
(MNm/m)Qx
(MN/m)Qy
(MN/m)18 OTHR 0.182 -0.015 -0.085 -0.690 0.111 0.118 -0.114 -0.073
TEMP 8.599 0.057 2.492 -8.171 -0.926 -0.375 0.060 0.553227 OTHR 0.259 0.286 0.149 -0.352 0.101 0.147 -0.228 -0.107
TEMP -2.901 11.308 -0.088 -3.679 -5.852 0.556 0.159 0.124237 OTHR 0.269 -0.015 -0.012 -0.258 0.245 -0.158 -0.316 0.189
TEMP 3.271 4.954 2.362 -6.091 -3.626 -1.039 -0.492 -0.44616085 OTHR 0.267 0.311 0.209 -0.294 0.070 0.142 -0.250 -0.054
TEMP -4.574 -1.873 1.031 -1.132 -0.048 0.345 -0.640 0.00651556 OTHR -0.015 0.042 0.002 0.046 0.070 -0.004 0.004 0.010
TEMP 0.100 0.156 0.014 -0.286 -0.237 0.001 -0.006 0.00751558 OTHR -0.004 -0.215 -0.008 -0.014 0.018 -0.010 0.040 -0.002
TEMP 0.190 -0.460 -0.038 -0.194 -0.238 -0.008 -0.031 -0.00151576 OTHR 0.306 -0.017 0.032 -0.007 -0.059 -0.006 -0.003 0.066
TEMP 0.794 0.118 0.100 -0.295 -0.301 0.000 -0.002 0.02551578 OTHR 0.086 -0.089 0.046 0.000 -0.017 -0.021 -0.008 0.022
TEMP 0.192 -0.230 0.013 -0.256 -0.299 -0.018 -0.031 0.04326007 OTHR -0.124 -0.051 -0.015 0.003 0.004 0.000 -0.004 0.000
TEMP 0.023 -0.036 -0.006 -0.392 -0.393 0.000 0.001 0.00126079 OTHR 0.023 -0.033 0.030 0.000 -0.008 0.003 -0.001 0.010
TEMP 0.417 0.111 0.038 -0.446 -0.535 0.011 -0.010 0.07926082 OTHR -0.034 0.036 0.053 -0.006 -0.003 0.004 -0.005 0.005
TEMP 0.322 0.147 0.076 -0.485 -0.483 0.042 -0.051 0.05126085 OTHR -0.037 0.044 -0.059 -0.008 -0.003 -0.004 -0.006 -0.004
TEMP 0.240 0.181 -0.005 -0.496 -0.461 -0.035 -0.056 -0.035
Roof of Tank
Basemat EL4.65
Roof of FPEEL 8.25

3-1324 Revision 0October 2015
Fermi 3Updated Final Safety Analysis Report
Table 3G.4-15 Combined Forces and Moments: Selected Load Combination FWSC-7 (Continued)
OTHR: Loads other than thermal loadsTEMP: Thermal loadsSI to U.S. Customary units conversion (SI units are the controlling units and U.S. Customary units are for reference only):1 MN/m = 6.852x10⁴ lbf/ft1 MNm/m = 2.248x10⁵ lbf-ft/ft
Location Element ID Nx
(MN/m)Ny
(MN/m)Nxy
(MN/m)Mx
(MNm/m)My
(MNm/m)Mxy
(MNm/m)Qx
(MN/m)Qy
(MN/m)66004 OTHR -0.114 -0.002 0.058 -0.008 -0.054 0.001 0.002 0.005
TEMP 2.916 -0.130 -0.123 -0.414 -0.717 0.005 -0.005 -0.18466006 OTHR -0.082 0.139 0.253 -0.008 -0.064 -0.005 -0.017 -0.084
TEMP 1.811 0.944 -0.412 -0.378 -0.693 -0.024 -0.203 -0.61866024 OTHR -0.309 -0.074 0.021 -0.008 -0.055 0.003 0.002 -0.006
TEMP -0.091 0.007 -0.037 -0.349 -0.277 0.002 0.016 -0.21767004 OTHR 0.215 -0.353 -0.045 -0.008 -0.055 0.001 -0.002 -0.073
TEMP 3.209 -0.623 -0.268 0.380 0.424 -0.001 0.002 0.02667006 OTHR 0.341 -0.019 -0.454 -0.009 -0.028 0.002 -0.001 -0.047
TEMP 3.333 0.484 -2.062 0.317 0.398 0.006 0.135 0.17067024 OTHR 0.426 -0.150 -0.053 0.018 0.090 -0.001 0.001 -0.059
TEMP 1.582 -0.137 -0.254 0.372 0.346 0.002 -0.007 0.04435007 OTHR 0.060 -0.180 -0.040 0.001 0.071 -0.005 -0.007 0.123
TEMP 3.012 -0.603 0.194 -1.162 -1.081 -0.009 -0.072 -0.32435010 OTHR 0.209 -0.397 -0.158 0.016 0.052 0.001 0.010 0.086
TEMP 2.650 0.030 -0.198 -1.253 -1.254 0.033 0.015 -0.39636507 OTHR 0.451 -0.152 -0.075 -0.019 -0.031 0.001 -0.005 -0.020
TEMP -0.295 -0.327 0.040 -1.147 -1.126 0.000 -0.011 0.08236510 OTHR 0.428 -0.216 -0.091 0.008 -0.013 -0.005 0.000 -0.014
TEMP -0.284 -0.025 -0.256 -1.181 -1.126 -0.005 0.015 0.07838507 OTHR 0.115 -0.043 0.005 -0.005 -0.004 0.003 0.000 0.012
TEMP 0.103 -0.062 0.007 -1.105 -0.771 0.004 0.000 -0.18138510 OTHR 0.112 -0.056 0.026 0.003 0.003 0.004 0.001 0.021
TEMP -0.050 0.003 -0.154 -1.112 -0.771 -0.018 -0.005 -0.20545001 OTHR 0.195 -0.053 0.094 -0.011 -0.009 -0.004 -0.011 0.054
TEMP 3.490 0.717 -0.047 -1.173 -1.294 -0.017 0.003 -0.40246501 OTHR 0.379 -0.173 0.032 -0.003 -0.007 0.003 -0.001 -0.019
TEMP -0.329 0.464 0.093 -1.200 -1.154 -0.002 -0.004 0.08048501 OTHR 0.126 -0.068 -0.007 0.004 0.006 -0.001 0.000 0.026
TEMP -0.195 0.079 0.049 -1.123 -0.772 0.006 0.002 -0.229Shear Key 72008 OTHR 0.112 0.106 0.084 0.012 0.007 0.004 0.007 -0.003
TEMP 0.030 -0.442 0.322 0.098 0.107 0.033 0.018 -0.05873017 OTHR -0.800 0.216 -0.375 0.004 0.007 0.005 0.003 -0.003
TEMP -6.179 -0.445 -0.899 0.020 0.028 0.034 0.011 -0.015
South Wall ofFPE
East Wall ofFPE
Wall of SouthTank

3-1325 Revision 0October 2015
Fermi 3Updated Final Safety Analysis Report
Table 3G.4-16 Sectional Thicknesses and Rebar Ratios Used in the Evaluation
Ratio Ratio Ratio (%) (%) (%)
51556 51558 51576 51578 26007 26079 26082 26085
18
227 237
16085
- - 1-#11@200 0.839 1-#11@200 0.839
1-#11@200 Roof of FPE EL 8.25
Bottom 3-#11@200 0.604 3-#11@200
Top 3-#11@200 + 1-#11@400 0.705 3-#11@200
+ 1-#11@400
Roof of Tank
2.50
Basemat EL 4.65
Top 1-#11@200 0.839
Bottom
Bottom
0.839
Top 1-#9@200
0.538 1-#9@200 - -
0.538
0.538
0.604
3-#11@200 0.604 0.604
0.538 1-#9@200
1-#9@200
Location Element ID
Thickness (m) Position
Primary Reinforcement
Arrangement Arrangement
Top
Bottom
0.705 #7@400x200 0.484
0.604
Direction 1 *1 Direction 2 *1
Arrangement
0.604
Shear Tie
3-#11@200 #7@400x400 0.242
3-#11@200
3-#11@200 2.50
0.60
0.60

3-1326 Revision 0October 2015
Fermi 3Updated Final Safety Analysis Report
Table 3G.4-16 Sectional Thicknesses and Rebar Ratios Used in the Evaluation (Continued)
SI to U.S. Customary units conversion (SI units are the controlling units and U.S. Customary units are for reference only):1 m = 3.28 ft
Ratio Ratio Ratio
(%) (%) (%)
Note *1: Wall Direction 1:Horizontal, Direction 2:Vertical
Basemat, Slab ,Roof Direction 1:N-S, Direction 2:E-W
Note *2: Rebar described as @150 is arranged by @1o
Note *3: Rebar described as @300 is arranged by @2o
#6@400x400 0.177
Outside 3-#11@200 0.7552-#11@200
+ 1-#[email protected]
3-#11@200 0.7552-#11@200
+ 1-#11@400
- -
Outside1-#11@200
+ 1-#[email protected]
1-#11@200+ 1-#11@400
0.377
1-#11@200+ 1-#11@400
0.3771-#11@200
+ 1-#[email protected]
Shear key
72008 2.00
Inside
73017 2.00
Inside 0.629
0.671
0.65
0.65
1.00
Inside 1-#11@150
1-#11@150+ 1-#11@300
Inside 1-#11@150
1-#11@150
385073851048501
1.00
Outside
Outside
365073651046501 2-#11@150
1.00
1.006
Outside2-#11@150
+ 1-#[email protected]
Inside 1.342
0.774Inside 1-#11@200
Arrangement
1-#11@200
Position
Directtion 2*1 Shear Tie
Arrangement Arrangement
Directtion 1*1
0.774
Primary Reinforcement
0.631
2-#11@200
2-#11@200 1.5481.548
1-#11@200 0.774
2-#11@200
1.164
2-#11@150*2350073501045001
66004
Inside
Outside
Outside
67004 0.65
Inside
67006 0.65
0.671 1-#11@150*2 0.671
2-#11@150*2
+ 1-#11@300*3 1.677
1.342 2-#11@150*2
0.671
1.342
1-#11@150*2
0.671 1-#11@150*2
#6@200x200
#6@150*2x300
1.5481-#11@133
+ 1-#[email protected]
1-#11@133
0.774 1-#11@200 0.774
- -
-
0.671
- -
- -
0.710
- -
66006
LocationElement
IDThickness
(m)
East Wallof FPE
Wall ofSouth Tank
1.1611-#11@200
+ 1-#[email protected]
South Wallof FPE
66024 0.65
Inside 1-#11@200
Outside1-#11@200
+ 1-#11@400
1-#11@133 1.164
-
1.548 2-#11@200 1.548
0.774
0.710
Outside 2-#11@200 1.5481-#11@133
+ 1-#[email protected]
0.774 1-#11@133 1.164
#6@200x200
67024 0.65Inside 1-#11@200
-
Outside1-#11@200
+ 1-#[email protected]
1-#11@200+ 1-#11@400
1.161
0.774 1-#11@133 1.164-
Inside 1-#11@200
1-#11@200
Outside 2-#11@200
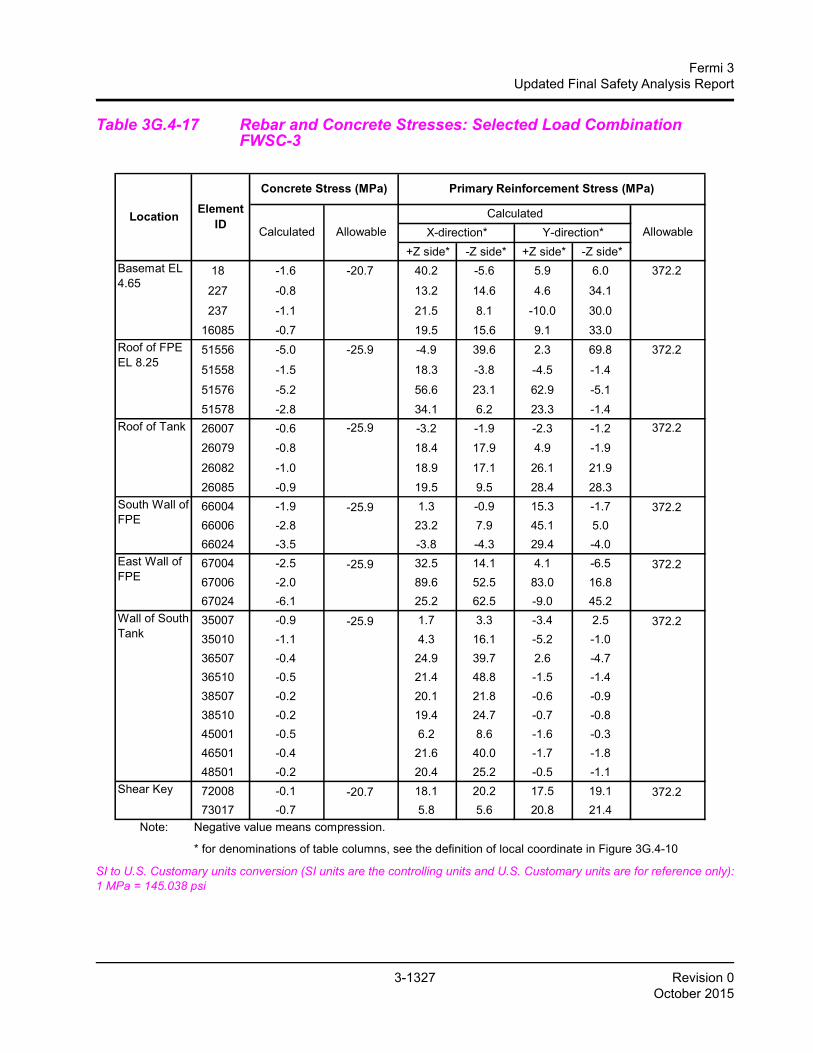
3-1327 Revision 0October 2015
Fermi 3Updated Final Safety Analysis Report
Table 3G.4-17 Rebar and Concrete Stresses: Selected Load Combination FWSC-3
SI to U.S. Customary units conversion (SI units are the controlling units and U.S. Customary units are for reference only):1 MPa = 145.038 psi
+Z side* -Z side* +Z side* -Z side*
18 -1.6 -20.7 40.2 -5.6 5.9 6.0 372.2
227 -0.8 13.2 14.6 4.6 34.1
237 -1.1 21.5 8.1 -10.0 30.0
16085 -0.7 19.5 15.6 9.1 33.0
51556 -5.0 -25.9 -4.9 39.6 2.3 69.8 372.2
51558 -1.5 18.3 -3.8 -4.5 -1.4
51576 -5.2 56.6 23.1 62.9 -5.1
51578 -2.8 34.1 6.2 23.3 -1.4
26007 -0.6 -25.9 -3.2 -1.9 -2.3 -1.2 372.2
26079 -0.8 18.4 17.9 4.9 -1.9
26082 -1.0 18.9 17.1 26.1 21.9
26085 -0.9 19.5 9.5 28.4 28.3
66004 -1.9 -25.9 1.3 -0.9 15.3 -1.7 372.2
66006 -2.8 23.2 7.9 45.1 5.0
66024 -3.5 -3.8 -4.3 29.4 -4.0
67004 -2.5 -25.9 32.5 14.1 4.1 -6.5 372.2
67006 -2.0 89.6 52.5 83.0 16.8
67024 -6.1 25.2 62.5 -9.0 45.2
35007 -0.9 -25.9 1.7 3.3 -3.4 2.5 372.2
35010 -1.1 4.3 16.1 -5.2 -1.0
36507 -0.4 24.9 39.7 2.6 -4.7
36510 -0.5 21.4 48.8 -1.5 -1.4
38507 -0.2 20.1 21.8 -0.6 -0.9
38510 -0.2 19.4 24.7 -0.7 -0.8
45001 -0.5 6.2 8.6 -1.6 -0.3
46501 -0.4 21.6 40.0 -1.7 -1.8
48501 -0.2 20.4 25.2 -0.5 -1.1
72008 -0.1 -20.7 18.1 20.2 17.5 19.1 372.2
73017 -0.7 5.8 5.6 20.8 21.4 Note: Negative value means compression.
* for denominations of table columns, see the definition of local coordinate in Figure 3G.4-10
Wall of SouthTank
Calculated
Roof of Tank
X-direction* Y-direction*
Shear Key
LocationElement
IDCalculated Allowable
South Wall ofFPE
East Wall ofFPE
Primary Reinforcement Stress (MPa)
Allowable
Basemat EL4.65
Roof of FPEEL 8.25
Concrete Stress (MPa)
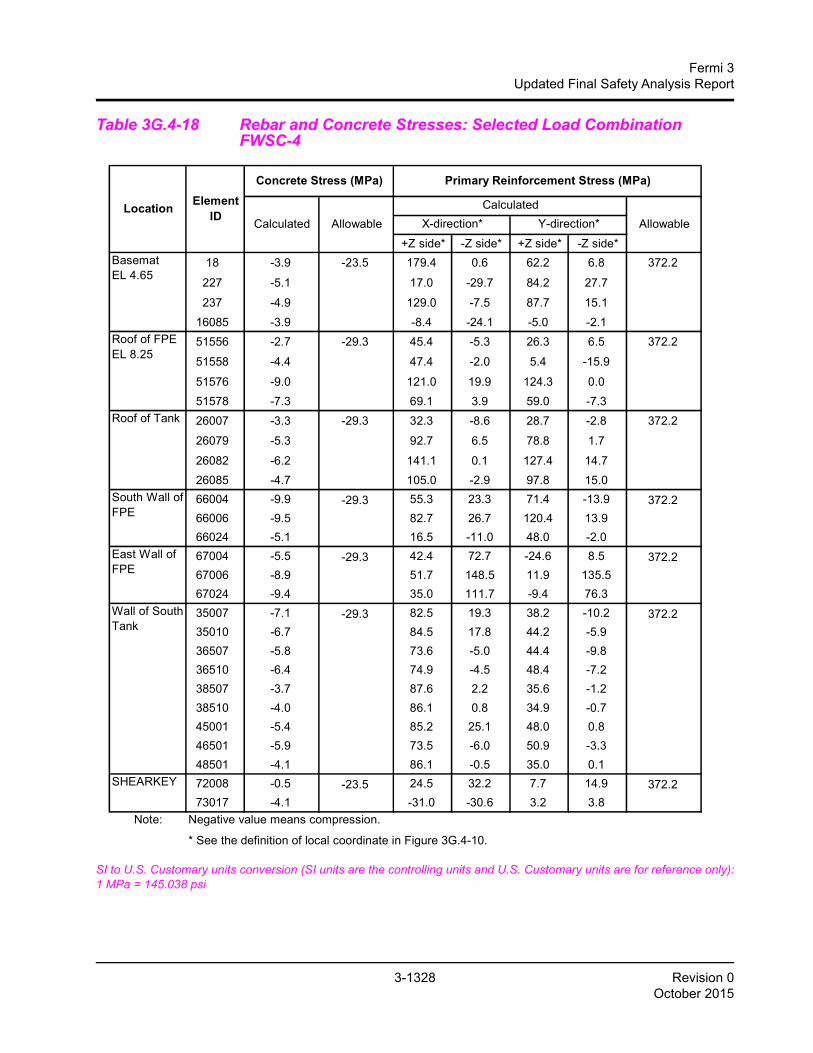
3-1328 Revision 0October 2015
Fermi 3Updated Final Safety Analysis Report
Table 3G.4-18 Rebar and Concrete Stresses: Selected Load Combination FWSC-4
SI to U.S. Customary units conversion (SI units are the controlling units and U.S. Customary units are for reference only):1 MPa = 145.038 psi
+Z side* -Z side* +Z side* -Z side*
18 -3.9 -23.5 179.4 0.6 62.2 6.8 372.2
227 -5.1 17.0 -29.7 84.2 27.7
237 -4.9 129.0 -7.5 87.7 15.1
16085 -3.9 -8.4 -24.1 -5.0 -2.1
51556 -2.7 -29.3 45.4 -5.3 26.3 6.5 372.2
51558 -4.4 47.4 -2.0 5.4 -15.9
51576 -9.0 121.0 19.9 124.3 0.0
51578 -7.3 69.1 3.9 59.0 -7.3
26007 -3.3 -29.3 32.3 -8.6 28.7 -2.8 372.2
26079 -5.3 92.7 6.5 78.8 1.7
26082 -6.2 141.1 0.1 127.4 14.7
26085 -4.7 105.0 -2.9 97.8 15.0
66004 -9.9 -29.3 55.3 23.3 71.4 -13.9 372.2
66006 -9.5 82.7 26.7 120.4 13.9
66024 -5.1 16.5 -11.0 48.0 -2.0
67004 -5.5 -29.3 42.4 72.7 -24.6 8.5 372.2
67006 -8.9 51.7 148.5 11.9 135.5
67024 -9.4 35.0 111.7 -9.4 76.3
35007 -7.1 -29.3 82.5 19.3 38.2 -10.2 372.2
35010 -6.7 84.5 17.8 44.2 -5.9
36507 -5.8 73.6 -5.0 44.4 -9.8
36510 -6.4 74.9 -4.5 48.4 -7.2
38507 -3.7 87.6 2.2 35.6 -1.2
38510 -4.0 86.1 0.8 34.9 -0.7
45001 -5.4 85.2 25.1 48.0 0.8
46501 -5.9 73.5 -6.0 50.9 -3.3
48501 -4.1 86.1 -0.5 35.0 0.1
72008 -0.5 -23.5 24.5 32.2 7.7 14.9 372.2
73017 -4.1 -31.0 -30.6 3.2 3.8 Note: Negative value means compression.
* See the definition of local coordinate in Figure 3G.4-10.
Roof of Tank
South Wall ofFPE
BasematEL 4.65
Roof of FPEEL 8.25
East Wall ofFPE
Wall of SouthTank
Primary Reinforcement Stress (MPa)
Calculated Allowable
Calculated
AllowableX-direction*
ElementID
Concrete Stress (MPa)
Y-direction*
SHEARKEY
Location

3-1329 Revision 0October 2015
Fermi 3Updated Final Safety Analysis Report
Table 3G.4-19 Rebar and Concrete Stresses: Selected Load Combination FWSC-6
SI to U.S. Customary units conversion (SI units are the controlling units and U.S. Customary units are for reference only):1 MPa = 145.038 psi
+Z side* -Z side* +Z side* -Z side*
18 -5.7 -23.5 229.9 3.9 43.4 33.9 372.2
227 -12.4 30.2 124.9 111.0 117.3
237 -13.7 294.4 97.7 195.0 98.8
16085 -5.8 -12.6 -35.5 -11.0 9.3
51556 -10.2 -29.3 33.5 16.8 33.5 108.2 372.2
51558 -4.9 63.9 5.2 51.2 -19.6
51576 -15.1 260.7 78.9 246.7 6.2
51578 -8.8 123.1 15.9 67.8 -11.6
26007 -2.4 -29.3 64.6 -10.9 57.4 9.7 372.2
26079 -6.1 140.6 29.6 72.5 11.5
26082 -4.4 179.2 21.9 191.8 42.9
26085 -3.3 171.9 13.6 180.0 63.5
66004 -10.0 -29.3 75.9 31.6 72.8 -13.7 372.2
66006 -12.8 145.4 66.3 192.4 14.6
66024 -7.4 70.6 -16.1 67.4 7.1
67004 -12.8 -29.3 60.1 121.3 -35.5 43.2 372.2
67006 -7.4 157.1 222.4 9.1 200.9
67024 -17.4 103.2 238.7 -17.5 159.2
35007 -11.4 -29.3 121.6 58.6 74.1 35.0 372.2
35010 -11.3 141.1 51.9 61.5 194.1
36507 -6.9 139.3 31.1 92.4 22.8
36510 -4.7 149.4 41.5 115.3 70.9
38507 -2.8 137.9 27.9 50.7 9.6
38510 -3.5 149.9 42.5 64.8 15.4
45001 -11.9 138.0 102.7 83.3 264.5
46501 -4.5 147.8 39.0 131.3 122.2
48501 -3.0 155.4 39.6 64.1 16.5
72008 -1.2 -23.5 66.1 81.9 22.2 41.1 372.2
73017 -5.8 -36.4 -36.2 68.0 39.5 Note: Negative value means compression.
* See the definition of local coordinate in Figure 3G.4-10.
Roof of FPEEL 8.25
Roof of Tank
South Wall ofFPE
Wall of SouthTank
BasematEL 4.65
East Wall ofFPE
ElementID
Concrete Stress (MPa) Primary Reinforcement Stress (MPa)
Calculated Allowable
Calculated
AllowableX-direction* Y-direction*
SHEARKEY
Location

3-1330 Revision 0October 2015
Fermi 3Updated Final Safety Analysis Report
Table 3G.4-20 Rebar and Concrete Stresses: Selected Load Combination FWSC-7
SI to U.S. Customary units conversion (SI units are the controlling units and U.S. Customary units are for reference only):1 MPa = 145.038 psi
+Z side* -Z side* +Z side* -Z side*
18 -3.2 -23.5 144.8 -0.3 46.0 5.7 372.2
227 -4.2 20.6 -23.0 67.6 22.6
237 -4.3 114.4 -6.3 79.4 11.2
16085 -3.1 -5.6 -18.9 -3.7 -1.4
51556 -2.7 -29.3 7.0 -6.4 -1.9 25.9 372.2
51558 -3.3 32.2 -0.2 3.4 -12.8
51576 -5.8 93.7 18.9 79.8 -0.1
51578 -5.3 50.8 3.9 41.9 -5.7
26007 -2.9 -29.3 32.7 -5.9 34.0 0.8 372.2
26079 -3.8 67.8 4.6 64.3 3.4
26082 -4.8 105.3 -1.6 95.9 12.0
26085 -4.6 97.0 -4.1 84.9 12.9
66004 -10.3 -29.3 44.6 26.6 57.3 -14.5 372.2
66006 -7.8 67.6 16.8 101.5 9.3
66024 -3.5 10.7 -9.1 33.2 -1.0
67004 -4.3 -29.3 37.3 58.1 -19.0 4.3 372.2
67006 -6.9 44.3 124.3 10.8 109.8
67024 -7.4 30.8 94.2 -8.2 58.5
35007 -4.7 -29.3 61.2 14.0 19.6 -9.0 372.2
35010 -5.5 71.2 16.8 37.6 -4.3
36507 -5.1 63.3 -1.3 38.7 -6.8
36510 -5.9 69.4 -1.3 55.4 -3.9
38507 -2.9 64.0 0.6 28.3 -0.4
38510 -3.1 62.1 -0.6 26.2 0.2
45001 -4.8 72.7 21.1 52.5 4.4
46501 -4.5 59.1 -3.5 40.0 -1.9
48501 -3.2 61.9 -1.5 25.7 0.5
72008 -0.4 -23.5 20.4 27.6 6.9 13.4 372.2
73017 -3.3 -23.9 -24.1 11.8 12.8 Note: Negative value means compression.
* See the definition of local coordinate in Figure 3G.4-10.
BasematEL 4.65
ElementID
Roof of Tank
Roof of FPEEL 8.25
Concrete Stress (MPa) Primary Reinforcement Stress (MPa)
Calculated Allowable
Calculated
AllowableX-direction* Y-direction*
SHEARKEY
South Wall ofFPE
East Wall ofFPE
Wall of SouthTank
Location

3-1331 Revision 0October 2015
Fermi 3Updated Final Safety Analysis Report
Table 3G.4-21 Calculation Results for Transverse Shear
SI to U.S. Customary units conversion (SI units are the controlling units and U.S. Customary units are for reference only):1 MN/m=6.852x104 lbf/ft
Element Load d w v
ID ID (m) (%) (%) Vu Vc Vs Vn Vu/Vn18 FWSC-6 2.243 0.673 0.242 1.036 1.362 2.247 3.067 0.338
227 FWSC-6 2.055 0.858 0.484 2.674 1.120 4.118 4.452 0.601
237 FWSC-6 2.045 0.862 0.484 2.432 1.217 4.098 4.517 0.538
16085 FWSC-6 2.044 0.862 0.242 1.228 1.609 2.048 3.108 0.395
51556 FWSC-6 0.465 1.082 0.000 0.039 0.406 0.000 0.345 0.113
51558 FWSC-6 0.499 1.008 0.000 0.132 0.453 0.000 0.385 0.343
51576 FWSC-6 0.450 1.118 0.000 0.237 0.428 0.000 0.364 0.651
51578 FWSC-6 0.462 1.090 0.000 0.078 0.442 0.000 0.375 0.208
26007 FWSC-6 0.473 0.682 0.000 0.005 0.427 0.000 0.363 0.013
26079 FWSC-6 0.451 0.716 0.000 0.094 0.454 0.000 0.386 0.243
26082 FWSC-6 0.476 0.678 0.000 0.102 0.457 0.000 0.389 0.263
26085 FWSC-6 0.486 0.664 0.000 0.103 0.469 0.000 0.399 0.258
66004 FWSC-4 0.422 2.387 0.000 0.215 0.459 0.000 0.390 0.551
66006 FWSC-6 0.436 2.873 0.710 0.730 0.263 1.282 1.313 0.556
66024 FWSC-4 0.443 1.701 0.000 0.192 0.491 0.000 0.418 0.460
67004 FWSC-6 0.485 1.037 0.000 0.226 0.826 0.000 0.702 0.322
67006 FWSC-6 0.436 2.862 0.710 0.206 0.257 1.282 1.308 0.158
67024 FWSC-6 0.443 1.702 0.000 0.243 0.494 0.000 0.420 0.579
35007 FWSC-6 0.735 2.285 0.631 0.553 0.282 1.920 1.871 0.295
35010 FWSC-6 0.698 1.919 0.631 0.452 0.155 1.823 1.682 0.269
36507 FWSC-6 0.779 1.721 0.000 0.049 0.499 0.000 0.424 0.116
36510 FWSC-4 0.772 1.735 0.000 0.084 0.753 0.000 0.640 0.132
38507 FWSC-6 0.835 0.804 0.000 0.122 1.075 0.000 0.914 0.133
38510 FWSC-4 0.835 0.804 0.000 0.228 0.896 0.000 0.762 0.299
45001 FWSC-6 0.698 1.918 0.631 0.563 0.000 1.823 1.550 0.363
46501 FWSC-6 0.780 1.718 0.000 0.039 0.270 0.000 0.229 0.170
48501 FWSC-7 0.835 0.804 0.000 0.089 0.810 0.000 0.688 0.130
72008 FWSC-6 1.798 0.419 0.000 0.376 1.474 0.000 1.253 0.300
73017 FWSC-6 1.737 0.741 0.177 0.259 0.966 1.273 1.903 0.136
South Wallof FPE
East Wall ofFPE
Wall ofSouth Tank
Shear Key
Shear Forces (MN/m)
Basemat EL4.65
Roof of FPEEL 8.25
Roof ofTank
Location

3-1332 Revision 0October 2015
Fermi 3Updated Final Safety Analysis Report
Where,D = Dead LoadH = Lateral soil pressureE’ = Safe Shutdown EarthquakeF’ = Buoyant force of design basis flood
*: See Table 3A.3-1 for site properties. For site specific application, use the larger value or a linearly interpolated value of the applicable range of shear wave velocities at the foundation level.
SI to U.S. Customary units conversion (SI units are the controlling units and U.S. Customary units are for reference only):1 MPa = 145.038 psi1 m/sec = 3.28 ft/sec
Table 3G.4-22 Factors of Safety for Foundation Stability
Load Combination
Overturning Sliding Floatation
Required Actual Required Actual Required Actual
D + H + E’ 1.1 129.1 1.1 1.10 -- --
D + F’ -- -- -- -- 1.1 7.4
Table 3G.4-23 Maximum Dynamic Soil Bearing Pressure Involving SSE + Static
Site Condition*
Soft(Vs = 300 m/sec)
Medium(Vs = 800 m/sec)
Hard(Vs ≥ 1700 m/sec)
Bearing Stress (MPa) 0.46 0.69 1.2

Fermi 3 3-1333 Revision 0Updated Final Safety Analysis Report October 2015
Note: All dimensions are in mm unless otherwise noted.
Figure 3G.4-1. FWSC Concrete Outline and Typical Rebar Arrangement{{{Security-Related Information - Withhold Under 10 CFR 2.390}}}

3-1334 Revision 0October 2015
Fermi 3Updated Final Safety Analysis Report
Figure 3G.4-2. Finite Element Model of FWSC (Isometric View)
ESBWR Design Control Document/Tier 2
Whole View
Cut View

Fermi 3 3-1335 Revision 0Updated Final Safety Analysis Report October 2015
Figure 3G.4-3a. Finite Element Model of FWSC (Foundation Mat)
Figure 3G.4-3a. Finite Element Model of FWSC (Foundation Mat)
20001950
GRID-ID
ELEM-ID (Unit: mm)
2000 2000 2000 2000 2000 2000
1
1
210017252000 2100 2125
2000
2125 2100 20002100 2000 2000 2000 2000 2000 20002000 19501725
2000
2000
2000
2000
2000
2000
2000
2000
2000
2 3 4 5 6 7 8 9 10 11 12 13 14 15 16 17 18 19 20 21 22 23 24 25 26 27
5756
15221
15171
1517015169
15168
15217
4847464544434241401017010169
10168
10217
3231
297296
15204
15205
1515615157
15158
15159
15209
28828728628528428328228128010158
10209
272271
327326325324323322321320319318317316315314313312311310309308307306305304303302301
71 72 73 74 75 7677
101 102 103 104 105 106 107
131 132 133 134 135 136 137
161 162 163 164 165 166 167
191 192 193 194 195 196 197
221 222 223 224 225 226227
251 252 253 254 255 256 257241
211
181
151
121
61
91
1015710156
10205
10204
10203
10152
15210
15211
15216 15222
15223
87
117
147
177
207
237
267
15203
15152
15153
15154
15155
1515115101150511500115000
15102
15103
15104
15105
1510615107
1510815109
15110
1505915111
15112
1511315163
15162
15161
15160
15058 1505715056
15055
15054
15053
1505215003
1500515007
15009
15011
1501315063
15062
15061
15060
15164
15114
15064
15215
15165
15115
15065
15166
15116
15066
15067
15117
15167
15118
15068
15119
15069 15070
15120
15121
15122
15172
15173
15123
1512415174
15071
15072
15073
1507415023
1502115019
15017
15015
10210
10211
10161
10160
10162
10163
10164
10111
10061
10011
10000
10159
10110
1010910108
1010710106
10105
10155
10055
10005
1005610057
1005810059
10060
10062
10063
10154
10153
10151
10174
10173
10223
10222
10172
10171
10104
10103
10102
10101
10124
10123
10122
10121
1012010119
1011810117
10116
10115
10114
10113
10112
1016710216
10215
10165
10166
1007010069
10071
10072
10073
10074
10051
10052
10053
10054
10003
10001
1000710009
10013
10015
1001710019
10021
1002310064
10065
10066
1006710068
10221
4075
113
101102
104 105 106 107109
110
111
112
117
118
103108
119
120
115
114
2
116
124
123
126
1109011091
11092
11093
11094
11095
11096 128
11089
11088
11087121
122
11086
11085127
125
129 11084
11083
11082
11081
1108011079 11078 11077
11076
11075
11074
11073130
132
135
136
140
139
154
153152151150
149
138
137
134
131
133
142
141
91147
143
148
1106611067
11068
11069
11070
11071
11072
11049
11050
11051
11052
1105311054
1105511056
1105711058
11059
11060
11061
11062
11063
11064 11065
1100111002
1100311004
1100511006
1100711008
1100911010 11011
11012 1104811047
11046
1104511044
11043
11042
11041
1104011039
11038
1103711036
1103511034
11033
1103211031
1103011029
11028
11027 11026
1102511024
11023
1102211021
11020
11019
11018
1101711016
11015
11014 11013
3
13
4
14
5
15
6
16
7
17
8
18
9
282726252423
383736353433
484746454443
585756555453
686766656463
73 74 75 76 77 78
83 84 85 86 87 88
93 94 95 96 97 98
144
155 15692
145
146
99247
241
242
233
234
231
237
238
243
248
249
250251 252
253
254
255
244
256100
246
245
236
235
240
239
232
230
228
226
224
223
220
215
216
10210
214
209
208
219
207206205204
203
202
213
201
218
212
211
221
217
222
225
227
229 16084
16083
16082
16081
16080
16079 1607816077
16076
16075
16074
16073
16096
16095
16094
16093
160921609116090
16089
16088
16087
16086
1608516061
16062
16063
16064 1606516066 16067 16068
16069
16070
16071
16072
16049
16050
16051
16052
1605316054
1605516056
1605716058
16059
16060
16003
16002
16001
16012
16011
1601016009
16008
16007
1600616005
16004
16023
1601316014
16015
1601616017
1601816019
16020
160211602216024
16025
1602616027
16028
1602916030
1603116032
16033
1603416035
1603616037
16038
1603916040
16041
16042
16043
1604416045
16046
1604716048
X(S)
Y(E)
Element selectedfor evaluation
9950 9725 6325 6325 9725 9950
5925
5925
4075

Fermi 3 3-1336 Revision 0Updated Final Safety Analysis Report October 2015
Figure 3G.4-3b. Finite Element Model of FWSC (Center Shear Key and South Shear Key of Basemat)
26A6642AN Rev. 10
ESBWR Design Control Document/Tier 2
Figure 3G.4-3b. Finite Element Model of FWSC (Center Shear Key and South Shear Key of Basemat)
20048
20548
73008
21048
73034
ELEM-ID
GRID-ID (Unit: mm)
20541
21041
73027
20041
73001
20542
21042
73028
20042
73002
20543
21043
73029
20043
73003
20006
20506
21006
20544
21044
73030
20044
73004
20545
73031
21045
73005
20045 20047
20547
21047
73032
73006
73033
73007
CENTER SHEAR KEY
73012
73038
20050
20550
73010
21050
73036
20049
20549
73009
21049
73035
20051
20551
73011
21051
73037
20552
21052
20052
73039
73013
20553
21053
20053
20554
21054
73040
20054
73014
20555
73041
21055
73015
20055
20556
73042
21056
73016
20056
21065
20565
2006520061
20561
21061
20557
73043
21057
73017
20057
20558
73044
21058
73018
20058 20060
20560
21060
20559
73045
21059
73019
20059
73046
73020
73049
73023
20063
20563
21063
20026
20526
21026
73047
73021
73048
73022
73050
73024
21064
20564
20064
EL -850
EL 2150
1500
1500
Z
20067
20567
21067
20066
20566
21066
73026
73052
73025
73051
X
3000
for evaluationElement selected
Element selected(Unit: mm)GRID-ID
SOUTH SHEAR KEY
for evaluation
72018
72008
21028
20528
20028
ELEM-ID
20021
72011
21021
72001
20521
2002320022
72012
21022
72002
20522
72013
21023
72003
20523
21026
20526
200262002520024
72014
21024
72004
20524
72015
21025
72005
20525
20027
21027
20527
72016
72006
72017
72007
72020
72010
21030
20530
2003020029
72019
72009
21029
20529
20031
21031
20531
EL -850
EL 2150
1500
1500
3000
Z
Y

Fermi 3 3-1337 Revision 0Updated Final Safety Analysis Report October 2015
Figure 3G.4-4. Finite Element Model of FWSC (South FWS Wall)
ESBWR Design Control Document/Tier 2
Figure 3G.4-4. Finite Element Model of FWSC (South FWS Wall)
ELEM-ID
GRID-ID (Unit: mm)Element selectedfor evaluation
2080
EL 4650
1100
1090
1100
1267
8
1720
1710
1798
EL 17328
Z
15663 15662
35512
15661
35511
15660
35510
15659
35509
15658
35508
15657
35507
15656
35506
15655
35505
15654
35504
15653
35503
15652
35502
15651
35501
16163 16162
36012
16161
36011
16160
36010
16159
36009
16158
36008
16157
36007
16156
36006
16155
36005
16154
36004
16153
36003
16152
36002
16151
3600116663 16662
36512
16661
36511
16660
36510
16659
36509
16658
36508
16657
36507
16656
36506
16655
36505
16654
36504
16653
36503
16652
36502
16651
3650117163 17162
37012
17161
37011
17160
37010
17159
37009
17158
37008
17157
37007
17156
37006
17155
37005
17154
37004
17153
37003
17152
37002
17151
3700117663 17662
37512
17661
37511
17660
37510
17659
37509
17658
37508
17657
37507
17656
37506
17655
37505
17654
37504
17653
37503
17652
37502
17651
37501
18163 18162
38012
18161
38011
18160
38010
18159
38009
18158
38008
18157
38007
18156
38006
18155
38005
18154
38004
18153
38003
18152
38002
18151
38001
18663 18662
38512
18661
38511
18660
38510
18659
38509
18658
38508
18657
38507
18656
38506
18655
38505
18654
38504
18653
38503
18652
38502
18651
38501
19151191521915319154191551915619157191581915919160191611916219163
19663 19662 19661 19660 19659 19658 19657 19656 19655 19654 19653 19652 19651
350013500235003350043500535006350073500835009350103501135012
15664156651566615667156681566915670156711567215673 15663
16164161651616616167161681616916170161711617216173 16163
16664166651666616667166681666916670166711667216673 16663
17164171651716617167171681716917170171711717217173 17163
17664176651766617667176681766917670176711767217673 17663
18164181651816618167181681816918170181711817218173 18163
18664186651866618667186681866918670186711867218673 18663
1916319173 19172 19171 19170 19169 19168 19167 19166 19165 19164
19664196651966619667196681966919670196711967219673 1966319674
19174
18674
18174
17674
17174
16674
16174
15674
45012 45011 45010 45009 45008 45007 45006 45005 45004 45003 45002 45001
485014850248503485044850548506485074850848509485104851148512
480014800248003480044800548006480074800848009480104801148012
475014750247503475044750547506475074750847509475104751147512
470014700247003470044700547006470074700847009470104701147012
465014650246503465044650546506465074650846509465104651146512
460014600246003460044600546006460074600846009460104601146012
455014550245503455044550545506455074550845509455104551145512
N E S W N
2080
EL 6730
EL 8810
EL 9900
EL 11000
EL 12100
EL 13810
EL 15530
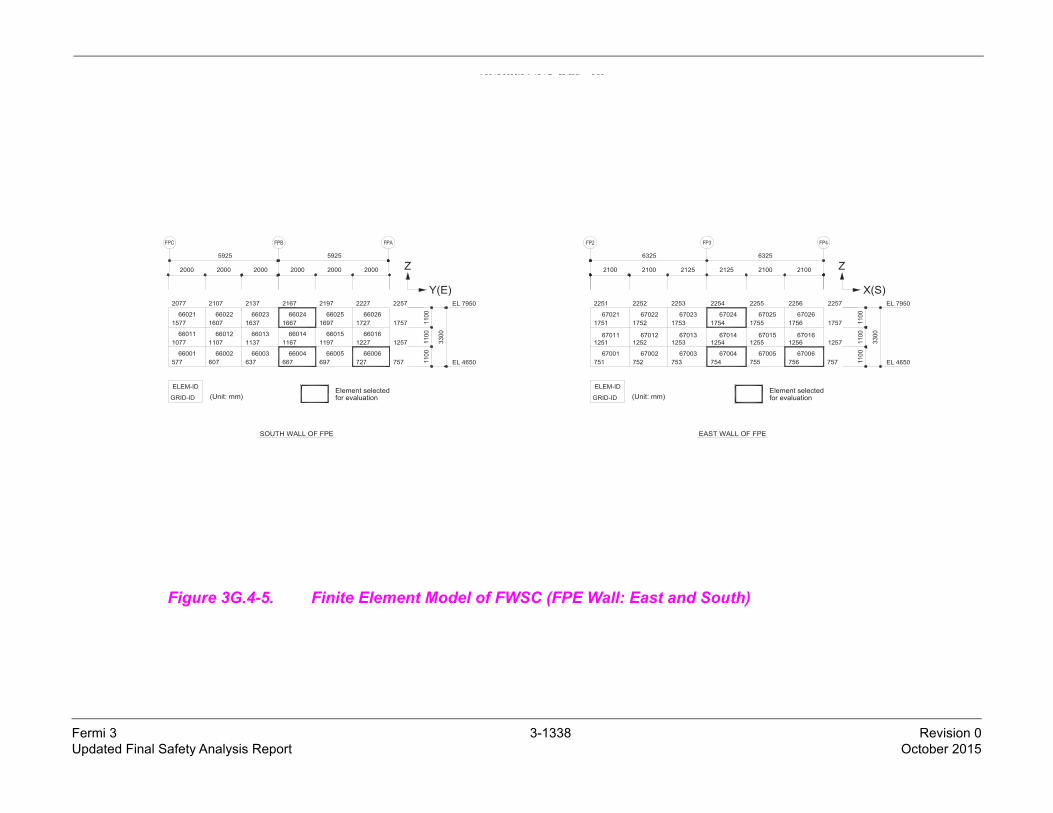
Fermi 3 3-1338 Revision 0Updated Final Safety Analysis Report October 2015
Figure 3G.4-5. Finite Element Model of FWSC (FPE Wall: East and South)
26A6642AN Rev. 10
SBWR Design Control Document/T
Figure 3G.4-5. Finite Element Model of FWSC (FPE Wall: East and South)
(Unit: mm)ELEM-ID
GRID-ID
SOUTH WALL OF FPE
for evaluationElement selected
66011
66001577
1077
1577
2077
66021
66012
66002
1107
607
1607
2107
66022
2000 2000
5925
2000
5925
697
1197
1697
2197
66005
66015
66025
667
1167
1667
2167
66013
66003637
1137
660231637
2137
66014
66004
66024
2000 2000
66006
66016
66026
727
1227
1727
2227
757
1257
1757
2257
2000 Z
Y(E)EL 7950
EL 4650
1100
3300
1100
1100 67024
67014
67004
2125
EAST WALL OF FPE
(Unit: mm)ELEM-ID
GRID-ID
67022
67012
67002
6325
2252
1752
1252
2100
67021
67011
67001
2251
1751
1251
751 752
2100
67023
67013
67003
1253
753
2253
1753
1254
754
2254
1754
2125
Element selectedfor evaluation
EL 7950
EL 4650
67025
67015
67005
1255
755
2255
1755
670161256
75667006
2256
175667026
6325
2100 2100
X(S)
1100
1100
1100
757
1257
1757
2257
3300
Z

Fermi 3 3-1339 Revision 0Updated Final Safety Analysis Report October 2015
Figure 3G.4-6. Finite Element Model of FWSC (FPE Roof Slab, South FWS Roof Slab)
Figure 3G.4-6. Finite Element Model of FWSC (FPE Roof Slab, South FWS Roof Slab)
FPE ROOF EL 8250
2255
2225
2195
2165
2105
2075
2135
222422232221 2222
GRID-ID
ELEM-ID (Unit: mm)
51533
51523
2071
2101
51524
2072
2102
51534
51563
51553
51543
2161
2131
2191
51554
2162
2132
51544
2192
51564
51525
2073
51535
2103
51526
2074
51536
2104
51555
51545
2163
2133
51565
2193
51556
51546
2164
2134
51566
2194
2100
51573
2251 2252
51574
6325
2100
51575
2253
2125
51576
2254
2125
22272226
2106
2076
51538
51528
Element selectedfor evaluation
51527
51537
2077
2107
2196
2166
2136
51568
51558
51548
51557
51547
51567
2167
2137
2197
2000
5925
2000
2000
2000
5925
2000
Y(E)2100
2256
5157851577
2100
6325
2257
X(S)
2000
19604
26072
26049
26071
19622
Element selectedfor evaluation
196701966819669
FWS SOUTH ROOF EL 17250 ~ EL 19700
19616
26059
19667
19659
19611
19561
19562
19563
19564
19565
26081
26088
26058
26063
19661
1966426086
19665
19666
19615
26087
19613
26084
26085
19663
19662
26060
19614
26061
26062
19612
26083
19660
260821955626057 26021
26022
26003
26010
19519
26040
19619
26067
26041
26011
19507
2603426035
26036
2606519617
26089
19566
26064
19567
19618
26066
26090
26038
19569
26037
1956826039
26025
26029
26026
26030
26031
26033
26032
19560
26028
26027
19559
1951126005
19517
2600819515
1951326006
26007
26009
26023
26024
1950926004
195732604526044
26092
19571
26068
26091
19620
19570
26042
26043
19671
1962126093
2607019572
26069
19555
19501
1950326014
26046
26047
26016
26002
26001
19523
2601219500
19521
26019
2601719505
26020 26018
1955226013
2604819551
19574
26051
19553
19554
26015 26050
19607
19657
19557
26054
19658
19609
2605619610
26080
26079
19608
19558
26055
26077
19656
26052
26078
19606
26053
19655
2607619605
1965326075
19674
19673
19672
26095
26094
19623
19601
19624
26073
26096
19602
26074
19603
19651
19652
19654
Y(E)
X(S)
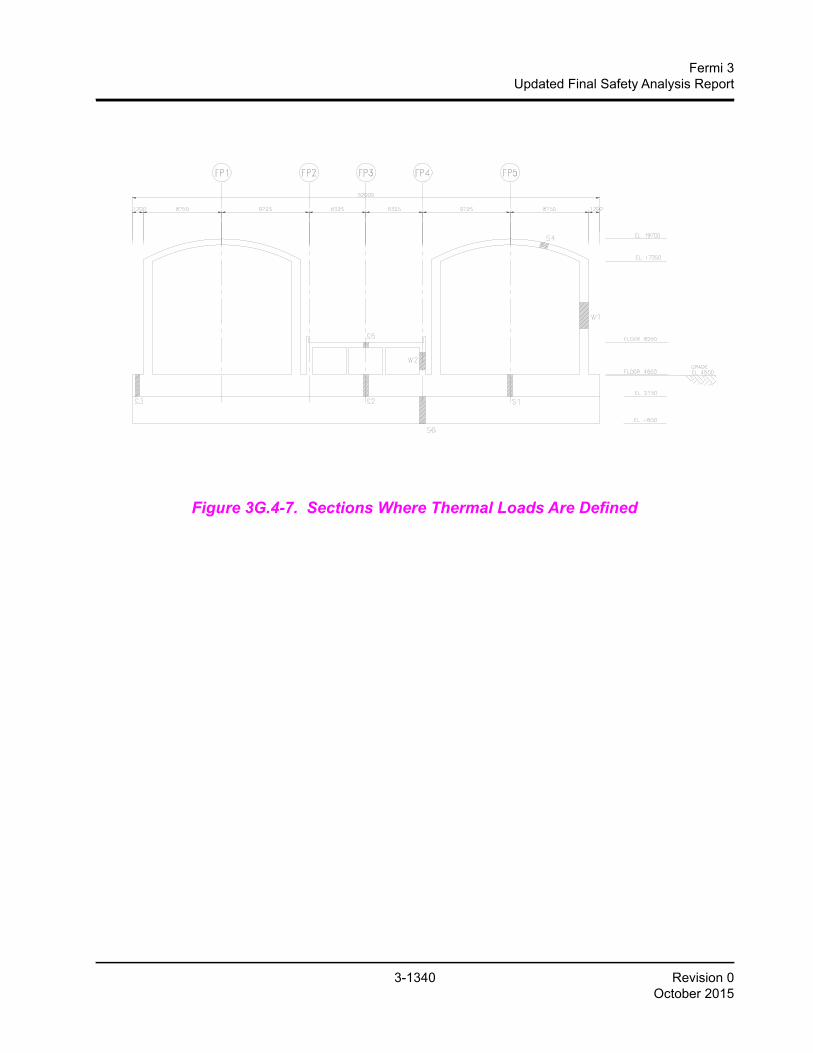
3-1340 Revision 0October 2015
Fermi 3Updated Final Safety Analysis Report
Figure 3G.4-7. Sections Where Thermal Loads Are Defined
Figure 3G.4-7. Sections Where Thermal Loads Are Defined

Fermi 3 3-1341 Revision 0Updated Final Safety Analysis Report October 2015
Figure 3G.4-8. Design Seismic Shears and Moments for FWSC (FWS)
Figure 3G.4-8. Design Seismic Shears and Moments for FWSC (FWS)
0
5
10
15
20
0 30 60
Shear (MN)
EL (m
)
NS-dir
EW-dir
0
5
10
15
20
0 150 300
Moment (MN-m)
EL (m
) NS-dir
EW-dir
0
5
10
15
20
0 10 20 30 40 50
Torsion (MN-m)
EL (m
)
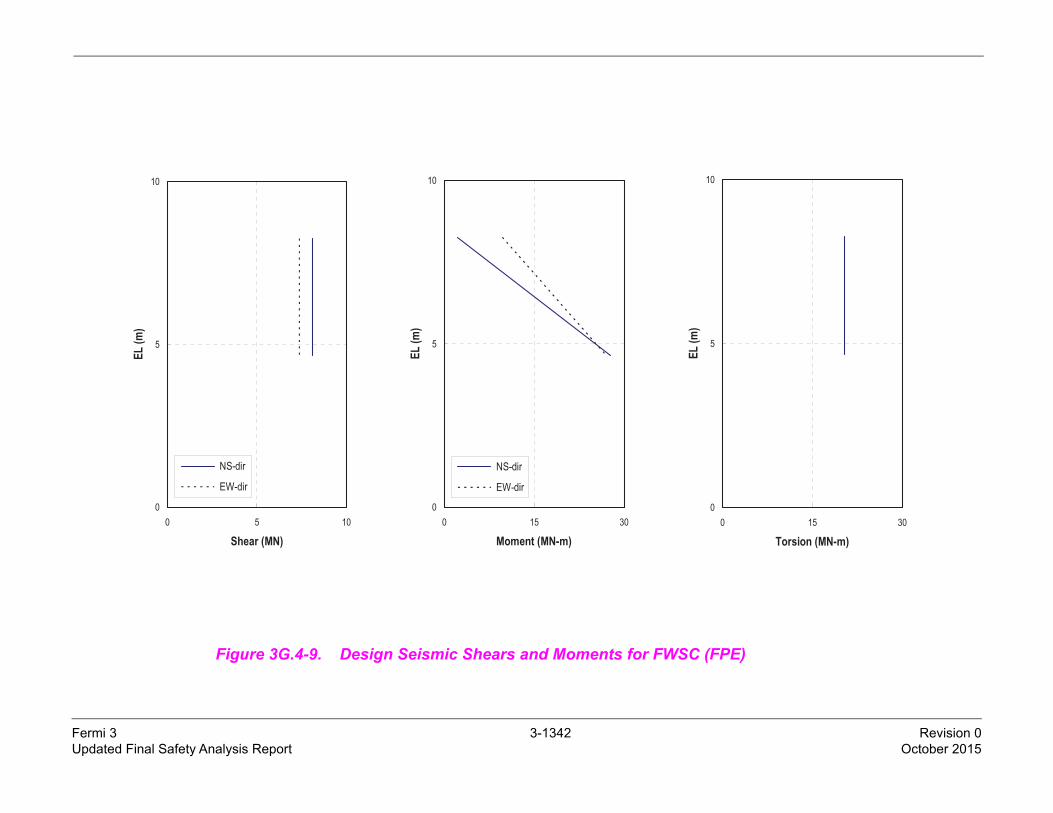
Fermi 3 3-1342 Revision 0Updated Final Safety Analysis Report October 2015
Figure 3G.4-9. Design Seismic Shears and Moments for FWSC (FPE)
26A6642AN Rev. 10
ESBWR Design Control Document/Tier 2
Figure 3G.4-9. Design Seismic Shears and Moments for FWSC (FPE)
0
5
10
0 5 10
Shear (MN)
EL (m
)
NS-dir
EW-dir
0
5
10
0 15 30
Moment (MN-m)
EL (m
)
NS-dir
EW-dir
0
5
10
0 15 30
Torsion (MN-m)
EL (m
)

3-1343 Revision 0October 2015
Fermi 3Updated Final Safety Analysis Report
Figure 3G.4-10. Force and Moment in Shell Element
ESBWR Design Control Document/Tier 2
z
x
y
z
x
y
Nx
Nxy
Qx
Nx
Nxy
Qx
Ny
Nxy
Qy
Ny
Nxy
Qy
Membrane and Shear Forces
MxyMxy
Mxy
My
Mxy
My
Moments
Mx
Mx
Definition of Element Coordinate System
Structure x y z
Wall in N-S direction horizontal vertical toward West Wall in E-W direction horizontal vertical toward North Tank Wall horizontal vertical outward Foundation Mat & Roof toward South toward East Upward Shear key in N-S direction horizontal vertical toward West Shear key in E-W direction horizontal vertical toward North

3-1344 Revision 0October 2015
Fermi 3Updated Final Safety Analysis Report
Figure 3G.4-11. (Deleted)

3-1345 Revision 0October 2015
Fermi 3Updated Final Safety Analysis Report
3G.5 STRUCTURAL EVALUATION FOR TRACG CALCULATED LOCA TEMPERATURES
A quantitative evaluation is performed to demonstrate that the thermal transient profiles calculated
by TRACG do not invalidate the structural design analysis using the thermal loads presented in
Subsection 3G.1.5.2.1.6. The following six break cases in the event of a LOCA are examined:
MSLA:Main Steamline Break inside Containment – nominal
MSLCB:Main Steamline Break inside Containment – containment bounding
FWLA:Feedwater Line Break – nominal
FWLCB:Feedwater Line Break – containment bounding
GDL:GDCS Injection Line – nominal
BDL:Bottom Drain Line – nominal
The TRACG calculated bulk temperature curves (including consideration of uncertainties) of these
break cases are bounded by the design temperature curves considered in the structural analysis at
all locations except for the drywell (DW), wetwell (WW) airspace and RB upper pools. Evaluation
details of the DW, WW, and RB upper pools where the design temperature is not bounding are
presented below.
3G.5.1 Drywell
The TRACG temperature curves in the DW are compared with the design temperature curve
(labeled ENV) in Figures 3G.5-1 through 3G.5-3 for short-term, medium-term and long-term break
cases, respectively. It is observed that the MSLA and MSLCB cases result in the highest
temperature in the short term (t < 0.1 hr); the FWLA and FWLCB cases result in the highest
temperature in the medium term (0.3 < t < 0.5 hr); and the BDL case results in the highest
temperature in the long term (t > 0.5 hr). The GDL case is not bounding over any time interval for
the DW.
The MSLA case is the most critical because it has the highest temperature at 193°C (379°F) as
compared to the 171°C (340°F) peak design temperature. However, this exceedance occurs very
early in the transient and is very short in duration. It should be noted that the TRACG results are
bulk fluid temperatures. The actual temperatures in the structures are lower than the fluid
temperatures due to heat transfer effects at the surface. The beneficial effects of reduced surface
heat transfer are ignored in the structural design analysis in which the design temperature curve
was directly applied to the structure assuming an infinite value for the heat transfer coefficient.
To show that the actual structural temperature is lower than the fluid temperature, a transient
1-D heat transfer analysis is performed for the DW liner (6.4 mm (0.25 in) thick) with the inside liner
face subjected to the bulk fluid temperature and the outside liner face (which is at the liner-concrete
interface) perfectly insulated for the MSLA transient up to 0.1 hr. A conservative heat transfer
coefficient derived from TRACG results is applied at the inside liner face. The results of this heat

3-1346 Revision 0October 2015
Fermi 3Updated Final Safety Analysis Report
transfer analysis show that the maximum temperature uniformly across the liner thickness and at
the concrete surface is 167°C (333°F), which is less than the 171°C (340°F) peak temperature used
in the structural design. The 167°C (333°F) temperature at the concrete surface is also within the
177°C (350°F) limit stipulated in ASME Code Section III, Division 2, Subarticle CC-3440 for an
accident or any other short-term period.
Besides the containment liner, there are other steel structures subjected to the DW temperature.
They consist of containment metal components not backed by concrete (such as the DW head) and
containment internal steel structures (such as the diaphragm floor (D/F), vent wall (VW), GDCS
pool wall and reactor shield wall). Since these steel structures are thicker than the liner plate and
one face of the liner plate is conservatively assumed to be fully insulated in the heat transfer
analysis described above, the calculated 167°C (333°F) maximum temperature is also applicable to
all steel structures for which the design temperature is higher at 171°C (340°F). It should be noted
that the design stress analyses performed for the D/F and VW ignores the infill concrete; the steel
plates on the DW side are designed to 171°C (340°F) peak design temperature and the steel plates
on the WW airspace side are designed to 130°C (266°F) peak design temperature. The WW
temperature is discussed separately below.
As opposed to steel structures, concrete structures react to temperature loading very slowly. The
more important consideration is how much heat is penetrating into the concrete as the accident
progresses. The integrated TRACG curves versus the integrated design temperature curve over
the 72-hr duration are shown in Figures 3G.5-4 through 3G.5-6 for short-term, medium-term and
long-term break cases, respectively. The accumulated heat input at 72 hours, which is the most
critical timing for concrete response when the thermal gradient across the thickness is largest, is
less than that of the design temperature curve for all breaks. At the very early stage of the transient
up to about 0.6 hr, however, some breaks result in higher accumulated heat input but they are
inconsequential to structural design since the duration is too short for heat penetrating into the
concrete.
3G.5.2 Wetwell Airspace
The TRACG temperature curves in the airspace of the WW are compared with the design
temperature curve (labeled ENV) in Figures 3G.5-7 through 3G.5-9 for short-term, medium-term
and long-term break cases, respectively. The peak temperatures calculated by TRACG are less
than the 130°C (266°F) peak design temperature up to 0.1 hr for all break cases except for FWLA
and FWLCB. The slightly higher FWLA and FWLCB temperatures (134°C (273°F) maximum) are
fluid temperatures, and the actual temperatures in the structures are expected to be lower for
short-duration heat buildup in view of the heat transfer analysis described above for the DW. At the
late stage of the transient approaching 72 hours, the TRACG temperatures reach a maximum value
of about 137°C (279°F) at 72 hours associated with MSLCB. It is about 13% higher than the 121°C
(250°F) design temperature. The impact on the structural design is evaluated assuming that the

3-1347 Revision 0October 2015
Fermi 3Updated Final Safety Analysis Report
existing total stresses of the abnormal and abnormal/extreme environmental load combinations,
which include the accident thermal load, are increased by 13%. This approach is very conservative
since stresses other than thermal are not affected by the 13% increase in the WW airspace
temperature. The design margins of the affected structures, D/F, VW, containment liner and
Reinforced Concrete Containment Vessel (RCCV), are presented below.
The structural elements of the D/F on the WW side are the bottom plate and the web and flange
plates of the supporting radial beams. Their existing maximum stresses are summarized in
Table 3G.1-37. The bottom plate stresses reported in this table have a minimum stress margin
(defined to be the ratio of the allowable to calculated stresses) equal to 1.35 associated with tensile
stress under the normal load condition. The stress margin for the abnormal and abnormal/extreme
environmental conditions is higher. This provides ample design margin against 13% higher
temperature load. As noted in Table 3G.1-37 for the radial web plate (lower web) and bottom flange,
the thermal stress associated with extreme and abnormal load conditions meets deformation limits
of AISC N690 Subsection Q1.5.7.2 and the total stress excluding thermal stress satisfies the
allowable stress limit in Table Q1.5.7.1 of AISC N690. With a 13% increase in the total stresses for
these plates, the resulting deformation is still within 27% of the allowable ductility. Hence, the D/F
structure has adequate margins to accommodate a 13% temperature increase in the WW airspace.
The stress summary of the VW is provided in Table 3G.1-39. The smallest stress margin is 1.4. The
outside cylinder is on the WW side and its stress margin is 1.8. The stress margin is sufficient to
accommodate a 13% temperature increase in the WW airspace.
The maximum strains of the containment liners are in Table 3G.1-35. The smallest strain margin is
1.22 for the cylinder, which includes the portions in the WW airspace. The strain margin is sufficient
to accommodate 13% temperature increase in the WW airspace.
The thermal response of the RCCV, being a concrete structure, is a function of heat input
accumulated over time. As shown in Figures 3G.5-10 through 3G.5-12, the integrated TRACG
temperature curves are bounded by the integrated design temperature curve for all breaks after
0.0003 hr. Prior to 0.0003 hr the TRACG accumulated heat input is higher but has no impact on
structural design since the duration is too short for significant heat to penetrate into the concrete. It
should be further noted that the ascending trend of TRACG temperatures does not extend beyond
72 hours in accordance with Figure 6.2-14e2. The change in the temperature trend and reduction in
temperature in Figure 6.2-14e2 is due to operation of the PCCS vent fans, which reduce the
non-condensable gas concentration in the PCCS heat exchangers, increasing heat removal.
Furthermore, for a very conservative check, the concrete and rebar stresses of the RCCV provided
in Tables 3G.1-29 through 3G.1-33 for abnormal and abnormal/extreme environmental conditions
are examined for design margins. At the WW airspace the smallest stress margin is 1.14 for the
outer layer rebars near the WW top. Therefore, the RCCV has sufficient margin even if the

3-1348 Revision 0October 2015
Fermi 3Updated Final Safety Analysis Report
combined stresses were increased by 13%, which is the same amount as the 13% temperature
increase in the WW airspace.
3G.5.3 RB Upper Pools
The RB upper pools consist of equipment storage pool, reactor well, buffer pool, IC/PCCS pools,
inner expansion pool and outer expansion pool. Four (4) temperature cases are considered for
minimum and maximum pool temperatures at 72 hours following a DBA, taking into account
minimum/maximum initial temperatures, operator actions, equipment performance, and
uncertainties. The maximum and minimum temperature conditions are designated to be Case 1
and Case 2, respectively, in this structural evaluation. A third case with a combination of maximum
and minimum temperatures is also considered in this evaluation and designated as Case 3. The
intent of Case 3 is to maximize the temperature differences across common walls between pools,
such as the wall between the inner and outer expansion pools. Furthermore, to account for the
possibility that the pools could be at a very low temperature above freezing when a LOCA occurred,
a lower bound temperature at 0ºC (32ºF) is also assumed for all pools and this case is designated
as Case 4. These 4 analysis cases are summarized below.
Case 1: Maximum as temperatures in all pools are at their respective maximum values.
Case 2: Minimum as temperatures in all pools are at their respective minimum values.
Case 3: Mixed temperatures in the individual pools are at either maximum or minimum
values.
Case 4: Lower bound temperature in all pools at 0ºC (32ºF).
The temperature distributions in various pool regions for these cases are shown in Figure 3G.5-13..
In all cases the temperature in the rooms outside the pool boundary is at 10ºC (50ºF) in winter and
the winter air temperature outside the building is –40ºC (-40ºF). The drywell (DW) temperature at
the bottom surface of the RCCV top slab is 150ºC (302ºF), which is the accident temperature at 72
hours after a LOCA in all cases.
Steady-state heat transfer calculations are performed for slab/wall sections shown in
Figures 3G.5-14 and 3G.5-15. The results of equivalent linear temperatures are summarized in
Tables 3G.5-1.
Stress analyses are performed using the global NASTRAN model described in Subsection 3G.1.4.1
with updates for current pool gate design and design changes identified through iterations in this
evaluation. These design changes, required in order to meet design acceptance criteria, are:
a. Top slab: The concrete strength is increased from 34.5 MPa (5000 psi) to 41.4 MPa
(6000 psi) and reinforcement is rearranged.
b. RB floor slab outside of the RCCV at EL 27000 mm (88.58 ft): The thickness is
increased from 1000 mm (3.28 ft) to 1500 mm (4.92 ft) and reinforcement is rearranged.

3-1349 Revision 0October 2015
Fermi 3Updated Final Safety Analysis Report
c. Pool girder: Reinforcement is rearranged.
d. IC/PCCS pool walls in the North-South direction between the IC/PCCS pools and the
inner expansion pool: The thickness is increased from 600 mm (1.97 ft) to 1000 mm
(3.28 ft) and reinforcement is rearranged.
Additional reinforcement in local regions is also added to the RB slab at EL 34000 mm (111.55 ft),
RB exterior walls at EL 27000 mm (88.58 ft), IC/PCCS pool walls in the East-West direction and
walls between inner and outer expansion pools.
The upper pool portions of the global NASTRAN finite element model are shown in Figure 3G.5-16..
In addition to the accident thermal (Ta) load, the updated NASTRAN model is also analyzed for
dead load (D), accident pressure (Pa) and seismic (E’) loads. The original NASTRAN model is used
for other loads such as live load (L), pipe reaction (Ra), SRV and chugging loads that are not
influenced by the upper pools.
The loads are combined for the abnormal and abnormal/extreme environmental categories in
accordance with Table 3G.5-2. The calculated section forces and moments at selected elements in
Figures 3G.5-17 through 3G.5-20 for sections identified in Figure 3G.1-28. are shown in
Tables 3G.5-3 through 3G.5-12 for individual loads. The combined section forces and moments are
presented in Tables 3G.5-13 through 3G.5-20 for various load combinations. The element
coordinate system for section forces and moments follows Figure 3G.1-29..
Stress evaluation is performed using the section properties in Table 3G.5-21. The calculated rebar
and concrete stresses are summarized in Tables 3G.5-22 through 3G.5-29 for individual load
combination cases. The enveloping transverse shear results of load combination cases are
presented in Tables 3G.5-30 and 3G.5-31. As shown the design meets all allowable limits.
The maximum compressive liner strain in the containment top slab is found to be 0.0023. It is 21%
larger than the maximum compressive liner strain of 0.0019 at the top slab for the abnormal and
abnormal/extreme environmental categories in Table 3G.1-35 and is still well within the allowable
compressive strain of 0.005. Therefore, the top slab containment liner design is adequate.
3G.5.4 Conclusions
On the basis of the evaluations described above, it can be concluded that the TRACG calculated
LOCA temperatures do not invalidate the DW and WW structural design analysis. The RB upper
pool structure with the afore-mentioned design changes implemented is adequate to withstand a
wide range of pool temperatures in conjunction with LOCA.
Furthermore, the design changes to the RB upper pool structure described in Subsection 3G.5.3
increase the design strength of the RCCV top slab. Therefore, the Level C capacity of the top slab
presented in Section 19B and the pressure fragility of the top slab presented in Section 19C for the
previous design are conservative.

3-1350 Revision 0October 2015
Fermi 3Updated Final Safety Analysis Report
Table 3G.5-1 RB Upper Pools – Equivalent Linear Temperature Distributions at Various Sections
Section*1Side*2
Equivalent Linear Temperature *3(ºC)
Case 1 Case 2 Case 3 Case 4
1 2 Td Tg Td Tg Td Tg Td Tg
SL1 RM RM 10.00 0.0 10.00 0.0 10.00 0.0 10.00 0.0
SL2 IP RM 69.46 81.1 39.73 40.5 39.73 40.5 4.05 -8.1
SL3 RM XI 66.73 -86.5 4.33 8.7 66.73 -86.5 4.33 8.7
SL4 RM BP 28.51 -31.0 4.56 9.1 4.56 9.1 4.56 9.1
SL5 RM AT -18.80 39.3 -18.80 39.3 -18.80 39.3 -18.80 39.3
SL6 XO AT 3.10 79.8 -19.23 38.5 -19.23 38.5 -19.23 38.5
SL9 RM XO 28.72 -28.6 4.33 8.7 4.33 8.7 4.33 8.7
SL10 RM XS 66.73 -86.5 4.33 8.7 4.33 8.7 4.33 8.7
SL11 XS RM 69.46 81.1 4.05 -8.1 4.05 -8.1 4.05 -8.1
SL12 PP RM 69.46 81.1 63.51 73.0 63.51 73.0 4.05 -8.1
SL13 XI RM 69.46 81.1 4.05 -8.1 69.46 81.1 4.05 -8.1
MT5 MT DS 83.50 -53.0 78.50 -43.0 83.50 -53.0 28.50 57.0
MT6 MT XS 83.50 -53.0 28.50 57.0 28.50 57.0 28.50 57.0
MT8 MT AT 9.30 95.4 9.30 95.4 9.30 95.4 9.30 95.4
MT9 MT RM 35.58 42.8 35.58 42.8 35.58 42.8 35.58 42.8
TS1 DW DS 128.23 36.5 122.78 45.6 128.23 36.5 68.35 136.7
TS2 DW IP 128.23 36.5 101.01 82.0 101.01 82.0 68.35 136.7
TS3 DW XI 128.23 36.5 68.35 136.7 128.23 36.5 68.35 136.7
TS4 DW RW 128.23 36.5 122.78 45.6 128.23 36.5 68.35 136.7
TS5 DW RM 80.00 117.2 80.00 117.2 80.00 117.2 80.00 117.2
TS6 DW PP 128.23 36.5 122.78 45.6 122.78 45.6 68.35 136.7
TS7 DW BP 92.30 96.6 68.35 136.7 68.35 136.7 68.35 136.7
PG1 PP RW 110.00 0.0 100.00 0.0 105.00 -10.0 0.00 0.0
PG2 XI BP 77.00 66.0 0.00 0.0 55.00 110.0 0.00 0.0
PG3 RM DS 66.36 -87.3 60.73 -78.5 66.36 -87.3 4.36 8.7
PG4 IP DS 110.00 0.0 80.00 -40.0 85.00 -50.0 0.00 0.0
PG5 PP DS 110.00 0.0 100.00 0.0 105.00 -10.0 0.00 0.0
PG6 IP BP 77.00 66.0 30.00 60.0 30.00 60.0 0.00 0.0
PG7 RM BP 29.16 -29.7 4.36 8.7 4.36 8.7 4.36 8.7
PG8 XS DS 110.00 0.0 50.00 -100.0 55.00 -110.0 0.00 0.0
PG9 PP BP 77.00 66.0 50.00 100.0 50.00 100.0 0.00 0.0

3-1351 Revision 0October 2015
Fermi 3Updated Final Safety Analysis Report
*1: Refer to Figures 3G.5-14 and 3G.5-15*2: Side
DW: Drywell WW: Wetwell SP: Suppression PoolGP: GDCS Pool IP: IC Pool PP: PCCS PoolXI: Inner Expansion Pool XO: Outer Expansion Pool XS: Side Expansion PoolRM: Room DS: Equipment Storage Pool BP: Buffer PoolRW: Reactor Well FP: Spent Fuel Pool MT: MS TunnelGR: Ground AT: Outside Air
*3: Td: Average TemperatureTg: Surface Temperature Difference (positive when temperature at Side 1 is higher)
SI to U.S. Customary units conversion (SI units are the controlling units and U.S. Customary units are for reference only):1°C = (°F - 32)/1.8
Table 3G.5-1 RB Upper Pools – Equivalent Linear Temperature Distributions at Various Sections (Continued)
Section*1
Side*2 Equivalent Linear Temperature *3 (ºC)
Case 1 Case 2 Case 3 Case 4
1 2 Td Tg Td Tg Td Tg Td Tg
GW1 AT RM -17.73 -42.3 -17.73 -42.3 -17.73 -42.3 -17.73 -42.3
GW3 AT XO 3.10 -79.8 -19.23 -38.5 -19.23 -38.5 -19.23 -38.5
GW5 AT BP 2.68 -82.6 -19.68 -39.4 -19.68 -39.4 -19.68 -39.4
GW6 DS AT 35.85 148.3 30.79 138.4 35.85 148.3 -19.77 39.5
GW7 XS AT 36.95 146.1 -19.48 39.0 -19.48 39.0 -19.48 39.0
GW8 RM XO 29.62 -26.8 4.05 8.1 4.05 8.1 4.05 8.1
GW9 AT RM -18.80 -39.3 -18.80 -39.3 -18.80 -39.3 -18.80 -39.3
GW10 RM RM 10.00 0.0 10.00 0.0 10.00 0.0 10.00 0.0
GW11 AT BP 3.09 -81.8 -19.48 -39.0 -19.48 -39.0 -19.48 -39.0
PW1 RW DS 110.00 0.0 100.00 0.0 110.00 0.0 0.00 0.0
PW2 PP PP 110.00 0.0 100.00 0.0 100.00 0.0 0.00 0.0
PW4 XI PP 110.00 0.0 50.00 -100.0 105.00 10.0 0.00 0.0
PW6 XI XS 110.00 0.0 0.00 0.0 55.00 110.0 0.00 0.0
PW7 XO XI 76.50 -67.0 0.00 0.0 55.00 -110.0 0.00 0.0
PW8 XI RM 69.46 81.1 4.05 -8.1 69.46 81.1 4.05 -8.1
PW9 RM XS 65.22 -89.6 4.48 9.0 4.48 9.0 4.48 9.0
PW10 RM RM 10.00 0.0 10.00 0.0 10.00 0.0 10.00 0.0
PW11 RM RM 10.00 0.0 10.00 0.0 10.00 0.0 10.00 0.0
PW12 IP XI 110.00 0.0 30.00 60.0 85.00 -50.0 0.00 0.0
PW13 IP RM 69.46 81.1 39.73 40.5 39.73 40.5 4.05 -8.1
PW14 XI IP 110.00 0.0 30.00 -60.0 85.00 50.0 0.00 0.0
PW15 XI IP 110.00 0.0 30.00 -60.0 85.00 50.0 0.00 0.0
PW16 PP IP 110.00 0.0 80.00 40.0 80.00 40.0 0.00 0.0
PW17 XO RM 29.62 26.8 4.05 -8.1 4.05 -8.1 4.05 -8.1
PW18 RM XS 69.46 -81.1 4.05 8.1 4.05 8.1 4.05 8.1
PW19 BP RW 77.00 -66.0 50.00 -100.0 55.00 -110.0 0.00 0.0

3-1352 Revision 0October 2015
Fermi 3Updated Final Safety Analysis Report
Table 3G.5-2 RB Upper Pools - Load Combination Cases
Table 3G.5-3 RB Upper Pools - Results of NASTRAN Analysis, Dead Load
SI to U.S. Customary units conversion (SI units are the controlling units and U.S. Customary units are for reference only):1 MN/m = 6.852x10⁴ lbf/ft1 MNm/m = 2.248x10⁵ lbf-ft/ft
Load Combinations
Category No. Ta D L Pa E' Ra SRV CHUG
Case1 Case2 Case3 Case4
LOCA (1.5Pa) 72hr 6001 1.0 1.0 1.0 1.5 1.0 1.25 1.5
6002 1.0 1.0 1.0 1.5 1.0 1.25 1.5
6003 1.0 1.0 1.0 1.5 1.0 1.25 1.5
6004 1.0 1.0 1.0 1.5 1.0 1.25 1.5
LOCA + SSE 72hr 7001 1.0 1.0 1.0 1.0 1.0 1.0 1.0 1.0
7002 1.0 1.0 1.0 1.0 1.0 1.0 1.0 1.0
7003 1.0 1.0 1.0 1.0 1.0 1.0 1.0 1.0
7004 1.0 1.0 1.0 1.0 1.0 1.0 1.0 1.0
LocationElement
IDNx
(MN/m)Ny
(MN/m)Nxy
(MN/m)Mx
(MNm/m)My
(MNm/m)Mxy
(MNm/m)Qx
(MN/m)Qy
(MN/m)
15 Topslab 98120 1.036 0.302 0.400 -0.507 -0.113 -0.344 0.076 0.431
@ Drywell Head 98135 2.629 0.236 -0.219 -0.683 0.262 0.142 -0.059 0.367
Opening 98104 0.101 0.824 -0.093 -0.262 -1.581 0.308 -0.005 0.235
16 Topslab 98149 1.638 -0.329 0.508 -0.766 -0.196 0.046 -0.001 -0.299
@ Center 98170 1.363 -0.014 0.037 -0.708 -0.786 0.077 0.002 0.056
98109 0.160 0.566 0.005 -0.675 -0.939 0.178 0.114 0.097
17 Topslab 98174 0.788 -0.132 0.161 -0.738 -0.577 -0.281 -0.173 0.044
@ RCCV 98197 0.463 -0.011 -0.204 -0.267 1.160 0.167 0.066 0.707
98103 -0.138 0.430 0.027 1.884 0.303 0.201 0.924 0.115
27 Slab 98472 0.386 0.059 0.126 0.294 0.487 -0.422 0.345 -0.402
EL27.0m 98514 0.146 0.113 0.032 0.043 0.188 0.035 -0.019 -0.143
@ RCCV 98424 -0.118 0.440 0.004 0.736 0.195 -0.053 -0.980 -0.066
28 Pool Girder 123054 0.420 -2.372 -0.765 0.050 0.044 0.046 -0.012 -0.020
@ Storage Pool 123154 1.306 -0.479 -0.607 0.072 0.028 0.088 0.008 0.011
29 Pool Girder 123062 0.397 0.548 0.257 -0.042 -0.210 0.022 0.017 -0.109
@ Well 123162 -1.349 0.198 0.131 -0.071 -0.046 0.012 0.081 0.026
30 Pool Girder 123067 0.402 -2.129 1.430 0.011 -0.044 -0.066 -0.097 -0.052
@ Buffer Pool 123167 0.464 -0.540 1.244 0.033 0.026 0.012 -0.024 0.006
32 IC/PCCS 125051 -0.097 -1.275 -0.895 0.001 -0.057 -0.002 0.002 -0.042
Pool Wall 125151 -0.106 -0.520 -0.735 -0.002 -0.007 -0.005 0.008 -0.002
in NS Direction 125055 0.046 -0.168 -0.099 -0.017 -0.104 0.003 -0.035 -0.069
125155 -0.520 -0.112 -0.082 0.006 0.028 0.005 0.032 -0.037
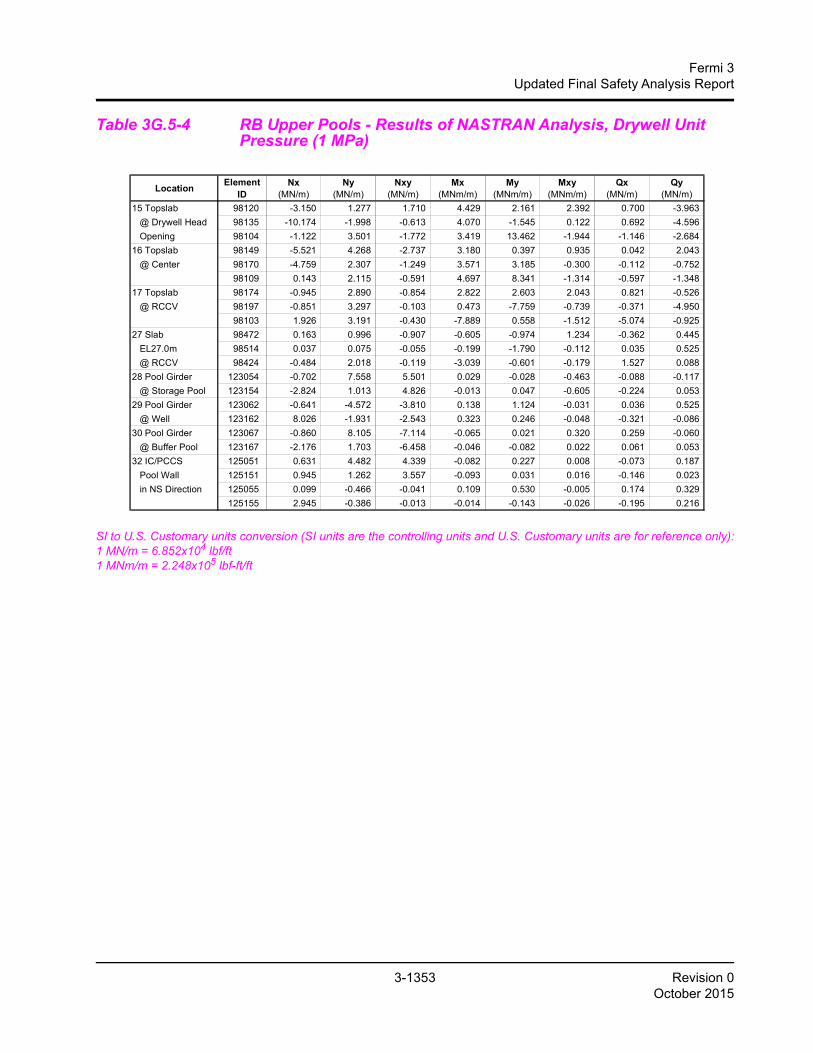
3-1353 Revision 0October 2015
Fermi 3Updated Final Safety Analysis Report
Table 3G.5-4 RB Upper Pools - Results of NASTRAN Analysis, Drywell Unit Pressure (1 MPa)
SI to U.S. Customary units conversion (SI units are the controlling units and U.S. Customary units are for reference only):1 MN/m = 6.852x10⁴ lbf/ft1 MNm/m = 2.248x10⁵ lbf-ft/ft
LocationElement
IDNx
(MN/m)Ny
(MN/m)Nxy
(MN/m)Mx
(MNm/m)My
(MNm/m)Mxy
(MNm/m)Qx
(MN/m)Qy
(MN/m)
15 Topslab 98120 -3.150 1.277 1.710 4.429 2.161 2.392 0.700 -3.963
@ Drywell Head 98135 -10.174 -1.998 -0.613 4.070 -1.545 0.122 0.692 -4.596
Opening 98104 -1.122 3.501 -1.772 3.419 13.462 -1.944 -1.146 -2.684
16 Topslab 98149 -5.521 4.268 -2.737 3.180 0.397 0.935 0.042 2.043
@ Center 98170 -4.759 2.307 -1.249 3.571 3.185 -0.300 -0.112 -0.752
98109 0.143 2.115 -0.591 4.697 8.341 -1.314 -0.597 -1.348
17 Topslab 98174 -0.945 2.890 -0.854 2.822 2.603 2.043 0.821 -0.526
@ RCCV 98197 -0.851 3.297 -0.103 0.473 -7.759 -0.739 -0.371 -4.950
98103 1.926 3.191 -0.430 -7.889 0.558 -1.512 -5.074 -0.925
27 Slab 98472 0.163 0.996 -0.907 -0.605 -0.974 1.234 -0.362 0.445
EL27.0m 98514 0.037 0.075 -0.055 -0.199 -1.790 -0.112 0.035 0.525
@ RCCV 98424 -0.484 2.018 -0.119 -3.039 -0.601 -0.179 1.527 0.088
28 Pool Girder 123054 -0.702 7.558 5.501 0.029 -0.028 -0.463 -0.088 -0.117
@ Storage Pool 123154 -2.824 1.013 4.826 -0.013 0.047 -0.605 -0.224 0.053
29 Pool Girder 123062 -0.641 -4.572 -3.810 0.138 1.124 -0.031 0.036 0.525
@ Well 123162 8.026 -1.931 -2.543 0.323 0.246 -0.048 -0.321 -0.086
30 Pool Girder 123067 -0.860 8.105 -7.114 -0.065 0.021 0.320 0.259 -0.060
@ Buffer Pool 123167 -2.176 1.703 -6.458 -0.046 -0.082 0.022 0.061 0.053
32 IC/PCCS 125051 0.631 4.482 4.339 -0.082 0.227 0.008 -0.073 0.187
Pool Wall 125151 0.945 1.262 3.557 -0.093 0.031 0.016 -0.146 0.023
in NS Direction 125055 0.099 -0.466 -0.041 0.109 0.530 -0.005 0.174 0.329
125155 2.945 -0.386 -0.013 -0.014 -0.143 -0.026 -0.195 0.216

3-1354 Revision 0October 2015
Fermi 3Updated Final Safety Analysis Report
Table 3G.5-5 RB Upper Pools - Results of NASTRAN Analysis, Wetwell Unit Pressure (1 MPa)
SI to U.S. Customary units conversion (SI units are the controlling units and U.S. Customary units are for reference only):1 MN/m = 6.852x10⁴ lbf/ft1 MNm/m = 2.248x10⁵ lbf-ft/ft
LocationElement
IDNx
(MN/m)Ny
(MN/m)Nxy
(MN/m)Mx
(MNm/m)My
(MNm/m)Mxy
(MNm/m)Qx
(MN/m)Qy
(MN/m)
15 Topslab 98120 0.422 0.617 0.348 -0.005 -0.004 -0.004 -0.011 -0.008
@ Drywell Head 98135 0.783 0.177 -0.205 -0.040 -0.006 0.006 -0.001 -0.001
Opening 98104 0.185 1.159 -0.205 -0.001 -0.034 0.000 -0.001 0.004
16 Topslab 98149 0.497 0.728 0.027 -0.049 -0.063 0.027 0.011 -0.050
@ Center 98170 0.686 0.305 0.028 -0.064 -0.090 -0.017 -0.011 -0.013
98109 0.400 0.774 -0.006 -0.055 -0.053 -0.006 -0.022 0.006
17 Topslab 98174 0.533 0.830 0.112 -0.230 -0.292 0.127 0.058 -0.074
@ RCCV 98197 0.400 0.299 -0.002 -0.158 -0.131 -0.045 -0.024 -0.002
98103 0.352 0.616 0.040 -0.258 -0.074 -0.001 -0.031 -0.004
27 Slab 98472 -0.079 0.083 0.373 0.226 0.288 -0.176 0.137 -0.118
EL27.0m 98514 0.179 0.119 0.007 0.049 0.379 0.009 -0.004 -0.230
@ RCCV 98424 0.095 0.378 0.015 0.208 0.039 0.009 -0.171 -0.011
28 Pool Girder 123054 0.151 0.051 -0.045 -0.001 -0.012 0.001 0.017 -0.016
@ Storage Pool 123154 0.033 0.022 -0.047 0.005 0.007 -0.001 0.006 0.001
29 Pool Girder 123062 0.245 0.035 0.047 -0.010 -0.011 -0.001 0.017 -0.009
@ Well 123162 0.168 0.026 0.059 -0.001 0.003 -0.004 0.005 -0.002
30 Pool Girder 123067 0.107 -0.487 -0.009 -0.027 -0.046 -0.017 -0.022 -0.044
@ Buffer Pool 123167 0.251 -0.136 -0.046 0.006 0.008 0.000 -0.012 -0.002
32 IC/PCCS 125051 0.045 -0.153 0.010 -0.009 -0.021 0.001 -0.007 -0.012
Pool Wall 125151 0.022 -0.056 -0.008 -0.006 -0.004 0.000 -0.005 -0.002
in NS Direction 125055 0.158 0.039 0.046 -0.001 -0.006 0.001 0.000 -0.003
125155 0.067 0.031 0.057 0.001 0.002 0.000 0.002 -0.003
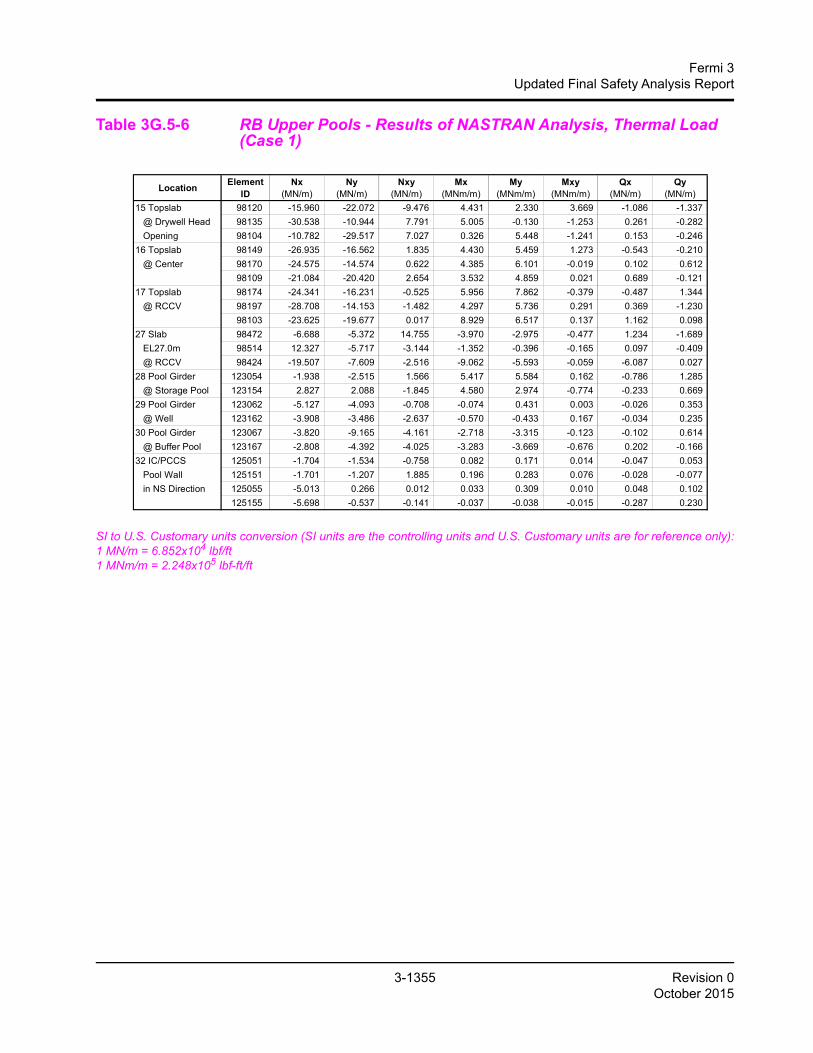
3-1355 Revision 0October 2015
Fermi 3Updated Final Safety Analysis Report
Table 3G.5-6 RB Upper Pools - Results of NASTRAN Analysis, Thermal Load (Case 1)
SI to U.S. Customary units conversion (SI units are the controlling units and U.S. Customary units are for reference only):1 MN/m = 6.852x10⁴ lbf/ft1 MNm/m = 2.248x10⁵ lbf-ft/ft
LocationElement
IDNx
(MN/m)Ny
(MN/m)Nxy
(MN/m)Mx
(MNm/m)My
(MNm/m)Mxy
(MNm/m)Qx
(MN/m)Qy
(MN/m)
15 Topslab 98120 -15.960 -22.072 -9.476 4.431 2.330 3.669 -1.086 -1.337
@ Drywell Head 98135 -30.538 -10.944 7.791 5.005 -0.130 -1.253 0.261 -0.282
Opening 98104 -10.782 -29.517 7.027 0.326 5.448 -1.241 0.153 -0.246
16 Topslab 98149 -26.935 -16.562 1.835 4.430 5.459 1.273 -0.543 -0.210
@ Center 98170 -24.575 -14.574 0.622 4.385 6.101 -0.019 0.102 0.612
98109 -21.084 -20.420 2.654 3.532 4.859 0.021 0.689 -0.121
17 Topslab 98174 -24.341 -16.231 -0.525 5.956 7.862 -0.379 -0.487 1.344
@ RCCV 98197 -28.708 -14.153 -1.482 4.297 5.736 0.291 0.369 -1.230
98103 -23.625 -19.677 0.017 8.929 6.517 0.137 1.162 0.098
27 Slab 98472 -6.688 -5.372 14.755 -3.970 -2.975 -0.477 1.234 -1.689
EL27.0m 98514 12.327 -5.717 -3.144 -1.352 -0.396 -0.165 0.097 -0.409
@ RCCV 98424 -19.507 -7.609 -2.516 -9.062 -5.593 -0.059 -6.087 0.027
28 Pool Girder 123054 -1.938 -2.515 1.566 5.417 5.584 0.162 -0.786 1.285
@ Storage Pool 123154 2.827 2.088 -1.845 4.580 2.974 -0.774 -0.233 0.669
29 Pool Girder 123062 -5.127 -4.093 -0.708 -0.074 0.431 0.003 -0.026 0.353
@ Well 123162 -3.908 -3.486 -2.637 -0.570 -0.433 0.167 -0.034 0.235
30 Pool Girder 123067 -3.820 -9.165 -4.161 -2.718 -3.315 -0.123 -0.102 0.614
@ Buffer Pool 123167 -2.808 -4.392 -4.025 -3.283 -3.669 -0.676 0.202 -0.166
32 IC/PCCS 125051 -1.704 -1.534 -0.758 0.082 0.171 0.014 -0.047 0.053
Pool Wall 125151 -1.701 -1.207 1.885 0.196 0.283 0.076 -0.028 -0.077
in NS Direction 125055 -5.013 0.266 0.012 0.033 0.309 0.010 0.048 0.102
125155 -5.698 -0.537 -0.141 -0.037 -0.038 -0.015 -0.287 0.230

3-1356 Revision 0October 2015
Fermi 3Updated Final Safety Analysis Report
Table 3G.5-7 RB Upper Pools - Results of NASTRAN Analysis, Thermal Load (Case 2)
SI to U.S. Customary units conversion (SI units are the controlling units and U.S. Customary units are for reference only):1 MN/m = 6.852x10⁴ lbf/ft1 MNm/m = 2.248x10⁵ lbf-ft/ft
LocationElement
IDNx
(MN/m)Ny
(MN/m)Nxy
(MN/m)Mx
(MNm/m)My
(MNm/m)Mxy
(MNm/m)Qx
(MN/m)Qy
(MN/m)
15 Topslab 98120 -19.902 -26.667 -11.787 5.629 2.584 4.364 -2.001 -2.323
@ Drywell Head 98135 -39.294 -13.488 9.764 5.599 -0.234 -1.593 0.184 -0.375
Opening 98104 -13.270 -35.829 8.792 0.352 6.123 -1.341 0.149 -0.199
16 Topslab 98149 -33.733 -21.119 4.825 5.213 5.993 1.060 -1.406 0.102
@ Center 98170 -34.893 -14.930 1.452 5.732 10.037 -0.064 -0.308 2.366
98109 -25.371 -25.382 2.731 3.872 5.508 0.166 0.756 -0.215
17 Topslab 98174 -26.600 -14.222 8.993 10.857 12.992 1.314 -1.498 1.903
@ RCCV 98197 -13.284 -10.483 -1.148 17.845 17.217 0.071 0.069 -0.159
98103 -27.839 -21.759 0.163 10.698 7.647 0.099 1.647 0.121
27 Slab 98472 0.560 2.997 21.415 2.417 3.120 -1.205 1.317 -1.610
EL27.0m 98514 12.596 -5.530 -2.667 1.250 5.280 0.063 -0.064 -2.425
@ RCCV 98424 -25.159 -6.289 -2.594 -9.143 -5.309 -0.140 -8.276 -0.118
28 Pool Girder 123054 -2.533 -12.587 0.553 5.558 5.234 0.165 0.381 0.217
@ Storage Pool 123154 -1.617 -4.773 2.290 5.684 3.025 -0.503 0.458 0.837
29 Pool Girder 123062 -7.087 -7.406 0.091 -0.429 0.232 -0.240 0.122 0.390
@ Well 123162 -6.089 -5.905 -3.162 -1.202 -0.494 0.073 0.108 0.172
30 Pool Girder 123067 5.357 -5.116 -3.767 0.633 -0.017 -0.360 -0.406 -0.305
@ Buffer Pool 123167 0.172 -1.539 -1.800 0.764 0.265 -0.025 -0.182 -0.019
32 IC/PCCS 125051 2.182 1.406 0.841 1.141 1.454 0.062 -0.706 0.145
Pool Wall 125151 0.820 0.470 1.675 1.267 1.459 0.112 -0.609 -0.022
in NS Direction 125055 0.876 2.406 -0.406 2.535 2.933 0.001 0.149 0.312
125155 -1.094 1.213 0.165 2.361 2.132 -0.036 -0.297 0.357

3-1357 Revision 0October 2015
Fermi 3Updated Final Safety Analysis Report
Table 3G.5-8 RB Upper Pools - Results of NASTRAN Analysis, Thermal Load (Case 3)
SI to U.S. Customary units conversion (SI units are the controlling units and U.S. Customary units are for reference only):1 MN/m = 6.852x10⁴ lbf/ft1 MNm/m = 2.248x10⁵ lbf-ft/ft
LocationElement
IDNx
(MN/m)Ny
(MN/m)Nxy
(MN/m)Mx
(MNm/m)My
(MNm/m)Mxy
(MNm/m)Qx
(MN/m)Qy
(MN/m)
15 Topslab 98120 -15.482 -25.691 -9.974 5.489 2.234 4.322 -2.021 -2.368
@ Drywell Head 98135 -32.537 -12.430 9.556 4.505 -0.194 -1.508 0.066 -0.258
Opening 98104 -12.512 -34.938 8.362 0.044 4.959 -1.046 0.084 -0.255
16 Topslab 98149 -28.675 -18.892 4.137 6.478 7.026 1.078 -2.189 -0.583
@ Center 98170 -25.010 -15.923 1.978 5.084 6.564 -0.038 0.234 0.414
98109 -23.621 -24.363 2.681 3.361 4.562 0.150 0.762 -0.169
17 Topslab 98174 -22.078 -8.288 0.121 9.502 11.524 -0.392 -0.423 0.969
@ RCCV 98197 -32.845 -14.689 -0.677 3.897 4.991 0.352 0.353 -1.504
98103 -26.644 -21.930 0.304 9.531 6.548 0.056 1.410 0.111
27 Slab 98472 -10.555 -5.730 14.877 -3.631 -2.841 -0.701 1.393 -1.882
EL27.0m 98514 19.208 -5.647 -2.587 1.045 2.953 -0.194 0.107 -1.118
@ RCCV 98424 -24.231 -6.952 -2.278 -10.190 -6.460 -0.167 -7.964 -0.108
28 Pool Girder 123054 -0.796 -10.849 0.720 6.148 6.064 0.167 0.364 0.243
@ Storage Pool 123154 2.563 -3.589 1.883 6.336 3.560 -0.289 0.575 0.983
29 Pool Girder 123062 -3.492 -7.610 -0.329 0.235 0.976 -0.143 0.144 0.349
@ Well 123162 -2.959 -6.337 -3.847 -0.450 0.157 0.052 0.056 0.215
30 Pool Girder 123067 -1.268 -8.891 -3.861 -5.866 -6.788 0.001 -0.270 0.070
@ Buffer Pool 123167 -0.187 -3.829 -3.108 -6.192 -5.622 -0.821 0.411 -0.590
32 IC/PCCS 125051 -1.590 -0.135 -1.056 -0.896 -0.957 0.021 -0.132 0.072
Pool Wall 125151 -1.514 -0.093 1.642 -0.781 -0.803 0.065 -0.132 -0.123
in NS Direction 125055 -5.687 0.084 -0.180 -0.145 0.088 0.019 0.049 0.095
125155 -6.471 -0.673 -0.245 -0.209 -0.233 -0.039 -0.277 0.218

3-1358 Revision 0October 2015
Fermi 3Updated Final Safety Analysis Report
Table 3G.5-9 RB Upper Pools - Results of NASTRAN Analysis, Thermal Load (Case 4)
SI to U.S. Customary units conversion (SI units are the controlling units and U.S. Customary units are for reference only):1 MN/m = 6.852x10⁴ lbf/ft1 MNm/m = 2.248x10⁵ lbf-ft/ft
LocationElement
IDNx
(MN/m)Ny
(MN/m)Nxy
(MN/m)Mx
(MNm/m)My
(MNm/m)Mxy
(MNm/m)Qx
(MN/m)Qy
(MN/m)
15 Topslab 98120 -19.685 -9.620 -6.700 13.625 13.102 10.762 -0.910 -0.945
@ Drywell Head 98135 -32.643 -9.465 3.312 21.679 2.367 -4.692 1.311 -1.131
Opening 98104 -8.235 -7.644 3.764 4.770 25.728 -6.165 0.516 -0.138
16 Topslab 98149 -21.295 -8.598 -2.582 17.374 16.424 1.478 -0.731 0.060
@ Center 98170 -22.487 -9.601 -1.177 18.047 16.314 -0.099 0.184 0.965
98109 -14.161 -10.561 1.426 14.914 19.897 -0.725 0.771 -0.034
17 Topslab 98174 -18.223 -10.690 1.049 17.510 16.987 0.904 -0.266 0.393
@ RCCV 98197 -21.470 -6.681 -1.270 17.924 18.933 -0.016 -0.052 -0.217
98103 -13.879 -12.975 -0.003 21.263 20.723 0.115 1.239 0.090
27 Slab 98472 -0.712 2.508 15.854 2.844 3.563 -1.727 1.485 -1.701
EL27.0m 98514 8.714 -4.774 -2.722 1.284 5.685 0.103 -0.091 -2.673
@ RCCV 98424 -12.877 1.351 -2.967 7.731 9.604 -0.006 -6.463 -0.087
28 Pool Girder 123054 9.857 -7.176 3.794 0.061 -0.484 -0.222 0.790 -0.570
@ Storage Pool 123154 7.646 -1.589 2.072 0.291 0.127 -0.235 0.262 0.022
29 Pool Girder 123062 11.194 0.038 -2.026 -0.395 0.719 0.207 1.138 -0.117
@ Well 123162 7.371 0.069 -1.416 -0.059 0.546 -0.247 0.304 -0.082
30 Pool Girder 123067 7.387 -5.704 -5.204 0.309 -0.082 -0.083 -0.415 -0.377
@ Buffer Pool 123167 4.800 -1.367 -2.400 0.306 0.335 0.026 -0.128 0.066
32 IC/PCCS 125051 3.473 -2.171 0.893 -0.574 -0.630 0.049 -0.282 -0.058
Pool Wall 125151 1.753 -1.442 -0.967 -0.439 -0.226 -0.016 -0.265 -0.069
in NS Direction 125055 6.938 0.773 -0.207 0.007 -0.199 -0.001 0.298 0.181
125155 3.393 0.481 0.012 0.006 -0.149 -0.010 0.012 -0.083

3-1359 Revision 0October 2015
Fermi 3Updated Final Safety Analysis Report
Table 3G.5-10 RB Upper Pools - Results of NASTRAN Analysis, Seismic Load (Horizontal: North to South Direction)
SI to U.S. Customary units conversion (SI units are the controlling units and U.S. Customary units are for reference only):1 MN/m = 6.852x10⁴ lbf/ft1 MNm/m = 2.248x10⁵ lbf-ft/ft
LocationElement
IDNx
(MN/m)Ny
(MN/m)Nxy
(MN/m)Mx
(MNm/m)My
(MNm/m)Mxy
(MNm/m)Qx
(MN/m)Qy
(MN/m)
15 Topslab 98120 0.235 -0.044 0.071 -0.051 -0.138 -0.104 -0.073 0.004
@ Drywell Head 98135 1.035 0.092 -0.142 -0.221 -0.021 0.005 -0.023 0.007
Opening 98104 -0.084 -1.784 0.108 -0.058 -0.368 0.021 -0.040 0.026
16 Topslab 98149 0.423 0.405 0.169 -0.189 0.019 -0.108 -0.077 -0.011
@ Center 98170 0.217 -0.354 0.174 -0.147 -0.177 -0.024 -0.013 -0.028
98109 0.113 -1.458 -0.076 -0.301 -0.443 -0.020 -0.062 0.071
17 Topslab 98174 -0.019 1.048 0.104 -0.037 -0.115 -0.228 -0.023 -0.035
@ RCCV 98197 0.022 -0.577 0.515 -0.005 -0.114 -0.083 0.025 0.103
98103 -0.135 -1.647 0.037 -1.188 -0.641 0.020 -0.259 0.017
27 Slab 98472 1.116 -0.286 -0.210 -0.458 -0.547 0.217 -0.164 0.224
EL27.0m 98514 -0.393 -0.172 -0.105 -0.145 -0.496 0.031 0.039 0.344
@ RCCV 98424 0.985 -1.102 0.090 0.114 -0.140 0.096 1.033 0.048
28 Pool Girder 123054 -0.105 1.449 -0.517 -0.067 -0.009 0.032 -0.016 0.019
@ Storage Pool 123154 -1.168 0.463 -0.380 -0.096 -0.032 0.026 -0.027 0.002
29 Pool Girder 123062 -0.189 -0.076 0.304 -0.137 -0.022 -0.035 0.063 0.032
@ Well 123162 -0.879 -0.127 0.165 -0.262 -0.069 -0.019 0.118 0.007
30 Pool Girder 123067 -0.733 1.734 0.963 0.067 0.024 0.023 0.027 0.021
@ Buffer Pool 123167 -1.131 0.330 1.275 0.023 0.033 0.007 0.000 0.002
32 IC/PCCS 125051 0.011 0.304 0.367 0.004 0.011 -0.004 0.022 -0.004
Pool Wall 125151 -0.196 0.229 0.311 0.015 0.010 0.000 0.028 -0.006
in NS Direction 125055 -0.070 -0.045 0.465 -0.026 -0.017 0.001 0.007 -0.006
125155 -0.383 0.002 0.392 -0.019 0.007 0.003 0.022 -0.011

3-1360 Revision 0October 2015
Fermi 3Updated Final Safety Analysis Report
Table 3G.5-11 RB Upper Pools - Results of NASTRAN Analysis, Seismic Load (Horizontal: East to West Direction)
SI to U.S. Customary units conversion (SI units are the controlling units and U.S. Customary units are for reference only):1 MN/m = 6.852x10⁴ lbf/ft1 MNm/m = 2.248x10⁵ lbf-ft/ft
LocationElement
IDNx
(MN/m)Ny
(MN/m)Nxy
(MN/m)Mx
(MNm/m)My
(MNm/m)Mxy
(MNm/m)Qx
(MN/m)Qy
(MN/m)
15 Topslab 98120 -1.240 -1.096 -0.904 -0.127 -0.652 -0.222 -0.033 -0.121
@ Drywell Head 98135 0.102 0.348 -0.578 -0.204 -0.277 0.143 0.064 -0.135
Opening 98104 0.415 0.577 -0.602 0.025 -0.414 -0.041 0.065 -0.356
16 Topslab 98149 -0.977 -0.370 -0.560 -0.093 -0.291 -0.052 0.052 0.072
@ Center 98170 -0.967 0.084 -0.901 -0.016 0.009 -0.005 0.016 0.005
98109 0.062 0.021 -0.799 -0.052 -0.261 -0.120 -0.001 -0.135
17 Topslab 98174 -1.434 -0.290 -0.736 -0.295 -0.232 0.064 0.139 -0.097
@ RCCV 98197 -1.364 -0.007 -0.783 0.000 0.041 -0.042 -0.037 0.039
98103 -0.214 0.174 -1.220 -0.038 -0.059 -0.233 0.040 -0.053
27 Slab 98472 0.133 -1.152 -0.544 -0.004 -0.006 -0.007 -0.086 0.100
EL27.0m 98514 -0.592 0.235 -0.459 0.123 0.955 -0.014 -0.020 -0.659
@ RCCV 98424 0.199 -0.160 -5.679 0.062 0.046 -0.190 0.048 0.096
28 Pool Girder 123054 0.284 0.140 0.134 0.314 0.154 -0.070 0.030 0.193
@ Storage Pool 123154 -0.397 0.342 0.687 0.200 -0.061 -0.086 0.047 -0.009
29 Pool Girder 123062 -0.420 0.966 0.140 0.076 0.056 -0.028 -0.060 0.078
@ Well 123162 -0.616 0.896 0.142 0.062 -0.051 0.020 -0.069 0.007
30 Pool Girder 123067 0.051 -0.015 0.251 0.158 0.162 0.053 0.017 0.247
@ Buffer Pool 123167 -0.442 0.383 -0.359 0.053 -0.109 0.064 -0.055 -0.013
32 IC/PCCS 125051 -0.143 0.258 -0.277 -0.002 -0.011 -0.002 -0.002 0.021
Pool Wall 125151 -0.100 0.150 -0.088 0.003 -0.002 -0.012 -0.003 -0.013
in NS Direction 125055 -0.353 0.072 0.102 -0.002 -0.017 -0.004 -0.018 0.041
125155 -0.384 0.018 0.084 -0.001 -0.019 0.004 -0.019 -0.027

3-1361 Revision 0October 2015
Fermi 3Updated Final Safety Analysis Report
Table 3G.5-12 RB Upper Pools - Results of NASTRAN Analysis, Seismic Load (Vertical: Upward Direction)
SI to U.S. Customary units conversion (SI units are the controlling units and U.S. Customary units are for reference only):1 MN/m = 6.852x10⁴ lbf/ft1 MNm/m = 2.248x10⁵ lbf-ft/ft
LocationElement
IDNx
(MN/m)Ny
(MN/m)Nxy
(MN/m)Mx
(MNm/m)My
(MNm/m)Mxy
(MNm/m)Qx
(MN/m)Qy
(MN/m)
15 Topslab 98120 -0.954 -0.304 -0.371 0.470 0.090 0.320 -0.072 -0.420
@ Drywell Head 98135 -2.389 -0.191 0.169 0.631 -0.264 -0.130 0.057 -0.358
Opening 98104 -0.068 -0.730 0.049 0.246 1.523 -0.290 0.004 -0.224
16 Topslab 98149 -1.492 0.268 -0.491 0.717 0.174 -0.057 -0.004 0.283
@ Center 98170 -1.261 0.050 -0.077 0.664 0.675 -0.068 0.000 -0.069
98109 -0.112 -0.491 -0.048 0.643 0.909 -0.168 -0.107 -0.097
17 Topslab 98174 -0.688 0.055 -0.172 0.698 0.511 0.243 0.160 -0.053
@ RCCV 98197 -0.363 0.058 0.151 0.302 -1.018 -0.150 -0.065 -0.623
98103 0.168 -0.329 -0.065 -1.794 -0.292 -0.194 -0.889 -0.111
27 Slab 98472 -0.327 0.037 -0.190 -0.348 -0.573 0.440 -0.351 0.414
EL27.0m 98514 -0.087 -0.065 -0.052 -0.056 -0.248 -0.034 0.018 0.140
@ RCCV 98424 0.215 -0.340 -0.004 -0.744 -0.207 0.050 0.989 0.063
28 Pool Girder 123054 -0.395 2.229 0.690 -0.046 -0.036 -0.043 0.007 0.018
@ Storage Pool 123154 -1.306 0.402 0.534 -0.060 -0.031 -0.083 -0.011 -0.009
29 Pool Girder 123062 -0.387 -0.532 -0.268 0.043 0.210 -0.024 -0.019 0.109
@ Well 123162 1.190 -0.198 -0.132 0.069 0.048 -0.015 -0.083 -0.026
30 Pool Girder 123067 -0.408 2.312 -1.252 -0.014 0.043 0.066 0.096 0.045
@ Buffer Pool 123167 -0.618 0.554 -1.041 -0.035 -0.022 -0.009 0.025 -0.005
32 IC/PCCS 125051 0.093 1.224 0.837 -0.001 0.056 0.003 -0.001 0.041
Pool Wall 125151 0.093 0.503 0.683 0.006 0.010 0.005 -0.006 0.002
in NS Direction 125055 -0.046 0.124 0.070 0.016 0.098 -0.003 0.033 0.064
125155 0.472 0.103 0.057 -0.006 -0.025 -0.006 -0.033 0.036

3-1362 Revision 0October 2015
Fermi 3Updated Final Safety Analysis Report
Table 3G.5-13 RB Upper Pools - Combined Forces and Moments, Selected Load Combination 6001
LocationElement
IDNx
(MN/m)Ny
(MN/m)Nxy
(MN/m)Mx
(MNm/m)My
(MNm/m)Mxy
(MNm/m)Qx
(MN/m)Qy
(MN/m)
15 Topslab 98120 OTHR -0.116 1.220 1.421 1.549 0.876 0.764 0.398 -1.412
@ Drywell Head TEMP -15.960 -22.072 -9.476 4.431 2.330 3.669 -1.086 -1.337
Opening HYDR 0.239 0.081 0.101 0.050 0.074 0.036 0.009 0.019
98135 OTHR -1.528 -0.597 -0.608 1.179 -0.461 0.203 0.263 -1.771
TEMP -30.538 -10.944 7.791 5.005 -0.130 -1.253 0.261 -0.282
HYDR 0.374 0.055 0.078 0.068 0.021 0.017 0.005 0.009
98104 OTHR -0.337 2.874 -1.003 1.321 4.626 -0.589 -0.539 -1.018
TEMP -10.782 -29.517 7.027 0.326 5.448 -1.241 0.153 -0.246
HYDR 0.069 0.289 0.113 0.021 0.123 0.026 0.005 0.047
16 Topslab 98149 OTHR -0.546 2.189 -0.729 0.733 0.035 0.500 0.014 0.527
@ Center TEMP -26.935 -16.562 1.835 4.430 5.459 1.273 -0.543 -0.210
HYDR 0.350 0.186 0.040 0.047 0.037 0.026 0.016 0.020
98170 OTHR -0.368 1.466 -0.516 0.916 0.680 -0.069 -0.031 -0.221
TEMP -24.575 -14.574 0.622 4.385 6.101 -0.019 0.102 0.612
HYDR 0.252 0.185 0.120 0.035 0.051 0.012 0.005 0.005
98109 OTHR 0.445 1.908 -0.252 1.490 2.892 -0.434 -0.170 -0.525
TEMP -21.084 -20.420 2.654 3.532 4.859 0.021 0.689 -0.121
HYDR 0.042 0.153 0.192 0.028 0.083 0.027 0.005 0.013
17 Topslab 98174 OTHR 0.746 1.816 -0.160 0.551 0.562 0.702 0.224 -0.159
@ RCCV TEMP -24.341 -16.231 -0.525 5.956 7.862 -0.379 -0.487 1.344
HYDR 0.298 0.192 0.069 0.113 0.126 0.079 0.041 0.038
98197 OTHR 0.452 1.949 -0.214 -0.141 -2.616 -0.196 -0.109 -1.508
TEMP -28.708 -14.153 -1.482 4.297 5.736 0.291 0.369 -1.230
HYDR 0.414 0.266 0.108 0.072 0.133 0.034 0.017 0.035
98103 OTHR 0.937 2.239 -0.127 -1.911 0.510 -0.503 -1.454 -0.318
TEMP -23.625 -19.677 0.017 8.929 6.517 0.137 1.162 0.098
HYDR 0.056 0.174 0.229 0.090 0.079 0.016 0.023 0.001
27 Slab 98472 OTHR 0.598 0.749 -0.160 0.093 0.116 0.074 0.310 -0.312
EL27.0m TEMP -6.688 -5.372 14.755 -3.970 -2.975 -0.477 1.234 -1.689
@ RCCV HYDR 0.100 0.049 0.144 0.060 0.079 0.039 0.048 0.050
98514 OTHR 0.388 0.537 0.023 -0.035 -0.502 -0.013 -0.005 -0.005
TEMP 12.327 -5.717 -3.144 -1.352 -0.396 -0.165 0.097 -0.409
HYDR 0.171 0.075 0.171 0.027 0.126 0.002 0.002 0.099
98424 OTHR -0.280 1.593 -0.036 -0.576 -0.082 -0.132 -0.308 -0.030
TEMP -19.507 -7.609 -2.516 -9.062 -5.593 -0.059 -6.087 0.027
HYDR 0.038 0.122 0.094 0.045 0.058 0.019 0.155 0.004

3-1363 Revision 0October 2015
Fermi 3Updated Final Safety Analysis Report
Table 3G.5-13 RB Upper Pools - Combined Forces and Moments, Selected Load Combination 6001 (Continued)
OTHR: Loads other than thermal and hydrodynamic loadsTEMP: Thermal loadsHYDR: Hydrodynamic loadsSI to U.S. Customary units conversion (SI units are the controlling units and U.S. Customary units are for reference only):1 MN/m = 6.852x10⁴ lbf/ft1 MNm/m = 2.248x10⁵ lbf-ft/ft
LocationElement
IDNx
(MN/m)Ny
(MN/m)Nxy
(MN/m)Mx
(MNm/m)My
(MNm/m)Mxy
(MNm/m)Qx
(MN/m)Qy
(MN/m)
28 Pool Girder 123054 OTHR 0.181 1.271 1.721 0.070 0.026 -0.166 -0.053 -0.068
@ Storage Pool TEMP -1.938 -2.515 1.566 5.417 5.584 0.162 -0.786 1.285
HYDR 0.115 0.149 0.128 0.009 0.008 0.005 0.012 0.012
123154 OTHR 0.064 0.064 1.522 0.074 0.040 -0.189 -0.096 0.030
TEMP 2.827 2.088 -1.845 4.580 2.974 -0.774 -0.233 0.669
HYDR 0.211 0.029 0.122 0.014 0.009 0.016 0.006 0.001
29 Pool Girder 123062 OTHR 0.341 -1.396 -1.460 0.027 0.300 -0.001 0.043 0.174
@ Well TEMP -5.127 -4.093 -0.708 -0.074 0.431 0.003 -0.026 0.353
HYDR 0.127 0.014 0.099 0.009 0.011 0.004 0.005 0.003
123162 OTHR 2.594 -0.537 -1.030 0.081 0.023 0.000 -0.058 -0.029
TEMP -3.908 -3.486 -2.637 -0.570 -0.433 0.167 -0.034 0.235
HYDR 0.315 0.013 0.093 0.017 0.011 0.003 0.011 0.003
30 Pool Girder 123067 OTHR 0.174 1.598 -1.845 -0.044 -0.074 0.042 -0.040 -0.043
@ Buffer Pool TEMP -3.820 -9.165 -4.161 -2.718 -3.315 -0.123 -0.102 0.614
HYDR 0.121 0.753 0.285 0.022 0.021 0.008 0.017 0.021
123167 OTHR -0.295 0.333 -1.783 -0.009 -0.064 0.036 -0.080 0.002
TEMP -2.808 -4.392 -4.025 -3.283 -3.669 -0.676 0.202 -0.166
HYDR 0.336 0.218 0.312 0.013 0.006 0.006 0.008 0.003
32 IC/PCCS 125051 OTHR 0.275 1.012 1.148 -0.051 0.034 0.003 -0.041 0.049
Pool Wall TEMP -1.704 -1.534 -0.758 0.082 0.171 0.014 -0.047 0.053
in NS Direction HYDR 0.011 0.065 0.043 0.002 0.001 0.000 0.002 0.001
125151 OTHR 0.410 0.298 0.920 -0.064 -0.011 0.002 -0.068 0.005
TEMP -1.701 -1.207 1.885 0.196 0.283 0.076 -0.028 -0.077
HYDR 0.026 0.037 0.048 0.003 0.001 0.000 0.003 0.000
125055 OTHR 0.260 -0.040 -0.079 0.032 0.139 0.001 0.054 0.096
TEMP -5.013 0.266 0.012 0.033 0.309 0.010 0.048 0.102
HYDR 0.033 0.031 0.066 0.001 0.001 0.000 0.001 0.000
125155 OTHR 0.974 0.033 -0.057 -0.002 -0.050 -0.006 -0.046 0.055
TEMP -5.698 -0.537 -0.141 -0.037 -0.038 -0.015 -0.287 0.230
HYDR 0.052 0.012 0.070 0.001 0.000 0.000 0.001 0.001

3-1364 Revision 0October 2015
Fermi 3Updated Final Safety Analysis Report
Table 3G.5-14 RB Upper Pools - Combined Forces and Moments, Selected Load Combination 6002
LocationElement
IDNx
(MN/m)Ny
(MN/m)Nxy
(MN/m)Mx
(MNm/m)My
(MNm/m)Mxy
(MNm/m)Qx
(MN/m)Qy
(MN/m)
15 Topslab 98120 OTHR -0.116 1.220 1.421 1.549 0.876 0.764 0.398 -1.412
@ Drywell Head TEMP -19.902 -26.667 -11.787 5.629 2.584 4.364 -2.001 -2.323
Opening HYDR 0.239 0.081 0.101 0.050 0.074 0.036 0.009 0.019
98135 OTHR -1.528 -0.597 -0.608 1.179 -0.461 0.203 0.263 -1.771
TEMP -39.294 -13.488 9.764 5.599 -0.234 -1.593 0.184 -0.375
HYDR 0.374 0.055 0.078 0.068 0.021 0.017 0.005 0.009
98104 OTHR -0.337 2.874 -1.003 1.321 4.626 -0.589 -0.539 -1.018
TEMP -13.270 -35.829 8.792 0.352 6.123 -1.341 0.149 -0.199
HYDR 0.069 0.289 0.113 0.021 0.123 0.026 0.005 0.047
16 Topslab 98149 OTHR -0.546 2.189 -0.729 0.733 0.035 0.500 0.014 0.527
@ Center TEMP -33.733 -21.119 4.825 5.213 5.993 1.060 -1.406 0.102
HYDR 0.350 0.186 0.040 0.047 0.037 0.026 0.016 0.020
98170 OTHR -0.368 1.466 -0.516 0.916 0.680 -0.069 -0.031 -0.221
TEMP -34.893 -14.930 1.452 5.732 10.037 -0.064 -0.308 2.366
HYDR 0.252 0.185 0.120 0.035 0.051 0.012 0.005 0.005
98109 OTHR 0.445 1.908 -0.252 1.490 2.892 -0.434 -0.170 -0.525
TEMP -25.371 -25.382 2.731 3.872 5.508 0.166 0.756 -0.215
HYDR 0.042 0.153 0.192 0.028 0.083 0.027 0.005 0.013
17 Topslab 98174 OTHR 0.746 1.816 -0.160 0.551 0.562 0.702 0.224 -0.159
@ RCCV TEMP -26.600 -14.222 8.993 10.857 12.992 1.314 -1.498 1.903
HYDR 0.298 0.192 0.069 0.113 0.126 0.079 0.041 0.038
98197 OTHR 0.452 1.949 -0.214 -0.141 -2.616 -0.196 -0.109 -1.508
TEMP -13.284 -10.483 -1.148 17.845 17.217 0.071 0.069 -0.159
HYDR 0.414 0.266 0.108 0.072 0.133 0.034 0.017 0.035
98103 OTHR 0.937 2.239 -0.127 -1.911 0.510 -0.503 -1.454 -0.318
TEMP -27.839 -21.759 0.163 10.698 7.647 0.099 1.647 0.121
HYDR 0.056 0.174 0.229 0.090 0.079 0.016 0.023 0.001
27 Slab 98472 OTHR 0.598 0.749 -0.160 0.093 0.116 0.074 0.310 -0.312
EL27.0m TEMP 0.560 2.997 21.415 2.417 3.120 -1.205 1.317 -1.610
@ RCCV HYDR 0.100 0.049 0.144 0.060 0.079 0.039 0.048 0.050
98514 OTHR 0.388 0.537 0.023 -0.035 -0.502 -0.013 -0.005 -0.005
TEMP 12.596 -5.530 -2.667 1.250 5.280 0.063 -0.064 -2.425
HYDR 0.171 0.075 0.171 0.027 0.126 0.002 0.002 0.099
98424 OTHR -0.280 1.593 -0.036 -0.576 -0.082 -0.132 -0.308 -0.030
TEMP -25.159 -6.289 -2.594 -9.143 -5.309 -0.140 -8.276 -0.118
HYDR 0.038 0.122 0.094 0.045 0.058 0.019 0.155 0.004

3-1365 Revision 0October 2015
Fermi 3Updated Final Safety Analysis Report
Table 3G.5-14 RB Upper Pools - Combined Forces and Moments, Selected Load Combination 6002 (Continued)
OTHR: Loads other than thermal and hydrodynamic loadsTEMP: Thermal loadsHYDR: Hydrodynamic loadsSI to U.S. Customary units conversion (SI units are the controlling units and U.S. Customary units are for reference only):1 MN/m = 6.852x10⁴ lbf/ft1 MNm/m = 2.248x10⁵ lbf-ft/ft
LocationElement
IDNx
(MN/m)Ny
(MN/m)Nxy
(MN/m)Mx
(MNm/m)My
(MNm/m)Mxy
(MNm/m)Qx
(MN/m)Qy
(MN/m)
28 Pool Girder 123054 OTHR 0.181 1.271 1.721 0.070 0.026 -0.166 -0.053 -0.068
@ Storage Pool TEMP -2.533 -12.587 0.553 5.558 5.234 0.165 0.381 0.217
HYDR 0.115 0.149 0.128 0.009 0.008 0.005 0.012 0.012
123154 OTHR 0.064 0.064 1.522 0.074 0.040 -0.189 -0.096 0.030
TEMP -1.617 -4.773 2.290 5.684 3.025 -0.503 0.458 0.837
HYDR 0.211 0.029 0.122 0.014 0.009 0.016 0.006 0.001
29 Pool Girder 123062 OTHR 0.341 -1.396 -1.460 0.027 0.300 -0.001 0.043 0.174
@ Well TEMP -7.087 -7.406 0.091 -0.429 0.232 -0.240 0.122 0.390
HYDR 0.127 0.014 0.099 0.009 0.011 0.004 0.005 0.003
123162 OTHR 2.594 -0.537 -1.030 0.081 0.023 0.000 -0.058 -0.029
TEMP -6.089 -5.905 -3.162 -1.202 -0.494 0.073 0.108 0.172
HYDR 0.315 0.013 0.093 0.017 0.011 0.003 0.011 0.003
30 Pool Girder 123067 OTHR 0.174 1.598 -1.845 -0.044 -0.074 0.042 -0.040 -0.043
@ Buffer Pool TEMP 5.357 -5.116 -3.767 0.633 -0.017 -0.360 -0.406 -0.305
HYDR 0.121 0.753 0.285 0.022 0.021 0.008 0.017 0.021
123167 OTHR -0.295 0.333 -1.783 -0.009 -0.064 0.036 -0.080 0.002
TEMP 0.172 -1.539 -1.800 0.764 0.265 -0.025 -0.182 -0.019
HYDR 0.336 0.218 0.312 0.013 0.006 0.006 0.008 0.003
32 IC/PCCS 125051 OTHR 0.275 1.012 1.148 -0.051 0.034 0.003 -0.041 0.049
Pool Wall TEMP 2.182 1.406 0.841 1.141 1.454 0.062 -0.706 0.145
in NS Direction HYDR 0.011 0.065 0.043 0.002 0.001 0.000 0.002 0.001
125151 OTHR 0.410 0.298 0.920 -0.064 -0.011 0.002 -0.068 0.005
TEMP 0.820 0.470 1.675 1.267 1.459 0.112 -0.609 -0.022
HYDR 0.026 0.037 0.048 0.003 0.001 0.000 0.003 0.000
125055 OTHR 0.260 -0.040 -0.079 0.032 0.139 0.001 0.054 0.096
TEMP 0.876 2.406 -0.406 2.535 2.933 0.001 0.149 0.312
HYDR 0.033 0.031 0.066 0.001 0.001 0.000 0.001 0.000
125155 OTHR 0.974 0.033 -0.057 -0.002 -0.050 -0.006 -0.046 0.055
TEMP -1.094 1.213 0.165 2.361 2.132 -0.036 -0.297 0.357
HYDR 0.052 0.012 0.070 0.001 0.000 0.000 0.001 0.001
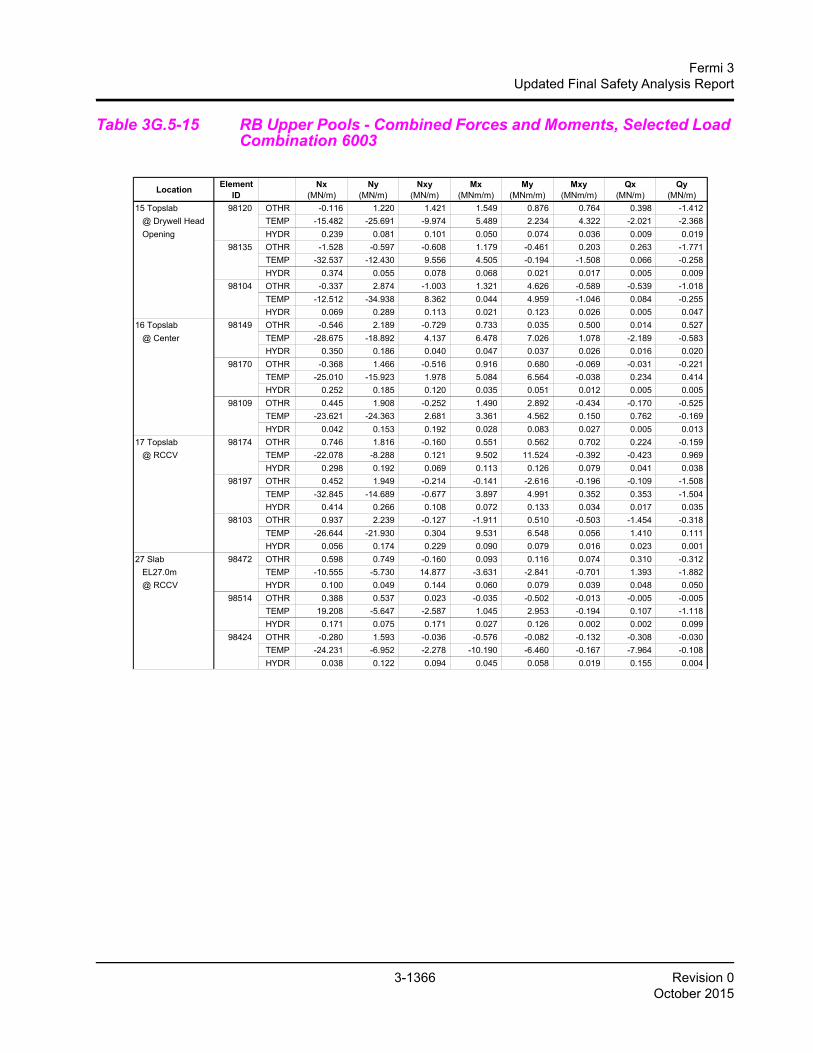
3-1366 Revision 0October 2015
Fermi 3Updated Final Safety Analysis Report
Table 3G.5-15 RB Upper Pools - Combined Forces and Moments, Selected Load Combination 6003
LocationElement
IDNx
(MN/m)Ny
(MN/m)Nxy
(MN/m)Mx
(MNm/m)My
(MNm/m)Mxy
(MNm/m)Qx
(MN/m)Qy
(MN/m)
15 Topslab 98120 OTHR -0.116 1.220 1.421 1.549 0.876 0.764 0.398 -1.412
@ Drywell Head TEMP -15.482 -25.691 -9.974 5.489 2.234 4.322 -2.021 -2.368
Opening HYDR 0.239 0.081 0.101 0.050 0.074 0.036 0.009 0.019
98135 OTHR -1.528 -0.597 -0.608 1.179 -0.461 0.203 0.263 -1.771
TEMP -32.537 -12.430 9.556 4.505 -0.194 -1.508 0.066 -0.258
HYDR 0.374 0.055 0.078 0.068 0.021 0.017 0.005 0.009
98104 OTHR -0.337 2.874 -1.003 1.321 4.626 -0.589 -0.539 -1.018
TEMP -12.512 -34.938 8.362 0.044 4.959 -1.046 0.084 -0.255
HYDR 0.069 0.289 0.113 0.021 0.123 0.026 0.005 0.047
16 Topslab 98149 OTHR -0.546 2.189 -0.729 0.733 0.035 0.500 0.014 0.527
@ Center TEMP -28.675 -18.892 4.137 6.478 7.026 1.078 -2.189 -0.583
HYDR 0.350 0.186 0.040 0.047 0.037 0.026 0.016 0.020
98170 OTHR -0.368 1.466 -0.516 0.916 0.680 -0.069 -0.031 -0.221
TEMP -25.010 -15.923 1.978 5.084 6.564 -0.038 0.234 0.414
HYDR 0.252 0.185 0.120 0.035 0.051 0.012 0.005 0.005
98109 OTHR 0.445 1.908 -0.252 1.490 2.892 -0.434 -0.170 -0.525
TEMP -23.621 -24.363 2.681 3.361 4.562 0.150 0.762 -0.169
HYDR 0.042 0.153 0.192 0.028 0.083 0.027 0.005 0.013
17 Topslab 98174 OTHR 0.746 1.816 -0.160 0.551 0.562 0.702 0.224 -0.159
@ RCCV TEMP -22.078 -8.288 0.121 9.502 11.524 -0.392 -0.423 0.969
HYDR 0.298 0.192 0.069 0.113 0.126 0.079 0.041 0.038
98197 OTHR 0.452 1.949 -0.214 -0.141 -2.616 -0.196 -0.109 -1.508
TEMP -32.845 -14.689 -0.677 3.897 4.991 0.352 0.353 -1.504
HYDR 0.414 0.266 0.108 0.072 0.133 0.034 0.017 0.035
98103 OTHR 0.937 2.239 -0.127 -1.911 0.510 -0.503 -1.454 -0.318
TEMP -26.644 -21.930 0.304 9.531 6.548 0.056 1.410 0.111
HYDR 0.056 0.174 0.229 0.090 0.079 0.016 0.023 0.001
27 Slab 98472 OTHR 0.598 0.749 -0.160 0.093 0.116 0.074 0.310 -0.312
EL27.0m TEMP -10.555 -5.730 14.877 -3.631 -2.841 -0.701 1.393 -1.882
@ RCCV HYDR 0.100 0.049 0.144 0.060 0.079 0.039 0.048 0.050
98514 OTHR 0.388 0.537 0.023 -0.035 -0.502 -0.013 -0.005 -0.005
TEMP 19.208 -5.647 -2.587 1.045 2.953 -0.194 0.107 -1.118
HYDR 0.171 0.075 0.171 0.027 0.126 0.002 0.002 0.099
98424 OTHR -0.280 1.593 -0.036 -0.576 -0.082 -0.132 -0.308 -0.030
TEMP -24.231 -6.952 -2.278 -10.190 -6.460 -0.167 -7.964 -0.108
HYDR 0.038 0.122 0.094 0.045 0.058 0.019 0.155 0.004

3-1367 Revision 0October 2015
Fermi 3Updated Final Safety Analysis Report
Table 3G.5-15 RB Upper Pools - Combined Forces and Moments, Selected Load Combination 6003 (Continued)
OTHR: Loads other than thermal and hydrodynamic loadsTEMP: Thermal loadsHYDR: Hydrodynamic loadsSI to U.S. Customary units conversion (SI units are the controlling units and U.S. Customary units are for reference only):1 MN/m = 6.852x10⁴ lbf/ft1 MNm/m = 2.248x10⁵ lbf-ft/ft
LocationElement
IDNx
(MN/m)Ny
(MN/m)Nxy
(MN/m)Mx
(MNm/m)My
(MNm/m)Mxy
(MNm/m)Qx
(MN/m)Qy
(MN/m)
28 Pool Girder 123054 OTHR 0.181 1.271 1.721 0.070 0.026 -0.166 -0.053 -0.068
@ Storage Pool TEMP -0.796 -10.849 0.720 6.148 6.064 0.167 0.364 0.243
HYDR 0.115 0.149 0.128 0.009 0.008 0.005 0.012 0.012
123154 OTHR 0.064 0.064 1.522 0.074 0.040 -0.189 -0.096 0.030
TEMP 2.563 -3.589 1.883 6.336 3.560 -0.289 0.575 0.983
HYDR 0.211 0.029 0.122 0.014 0.009 0.016 0.006 0.001
29 Pool Girder 123062 OTHR 0.341 -1.396 -1.460 0.027 0.300 -0.001 0.043 0.174
@ Well TEMP -3.492 -7.610 -0.329 0.235 0.976 -0.143 0.144 0.349
HYDR 0.127 0.014 0.099 0.009 0.011 0.004 0.005 0.003
123162 OTHR 2.594 -0.537 -1.030 0.081 0.023 0.000 -0.058 -0.029
TEMP -2.959 -6.337 -3.847 -0.450 0.157 0.052 0.056 0.215
HYDR 0.315 0.013 0.093 0.017 0.011 0.003 0.011 0.003
30 Pool Girder 123067 OTHR 0.174 1.598 -1.845 -0.044 -0.074 0.042 -0.040 -0.043
@ Buffer Pool TEMP -1.268 -8.891 -3.861 -5.866 -6.788 0.001 -0.270 0.070
HYDR 0.121 0.753 0.285 0.022 0.021 0.008 0.017 0.021
123167 OTHR -0.295 0.333 -1.783 -0.009 -0.064 0.036 -0.080 0.002
TEMP -0.187 -3.829 -3.108 -6.192 -5.622 -0.821 0.411 -0.590
HYDR 0.336 0.218 0.312 0.013 0.006 0.006 0.008 0.003
32 IC/PCCS 125051 OTHR 0.275 1.012 1.148 -0.051 0.034 0.003 -0.041 0.049
Pool Wall TEMP -1.590 -0.135 -1.056 -0.896 -0.957 0.021 -0.132 0.072
in NS Direction HYDR 0.011 0.065 0.043 0.002 0.001 0.000 0.002 0.001
125151 OTHR 0.410 0.298 0.920 -0.064 -0.011 0.002 -0.068 0.005
TEMP -1.514 -0.093 1.642 -0.781 -0.803 0.065 -0.132 -0.123
HYDR 0.026 0.037 0.048 0.003 0.001 0.000 0.003 0.000
125055 OTHR 0.260 -0.040 -0.079 0.032 0.139 0.001 0.054 0.096
TEMP -5.687 0.084 -0.180 -0.145 0.088 0.019 0.049 0.095
HYDR 0.033 0.031 0.066 0.001 0.001 0.000 0.001 0.000
125155 OTHR 0.974 0.033 -0.057 -0.002 -0.050 -0.006 -0.046 0.055
TEMP -6.471 -0.673 -0.245 -0.209 -0.233 -0.039 -0.277 0.218
HYDR 0.052 0.012 0.070 0.001 0.000 0.000 0.001 0.001

3-1368 Revision 0October 2015
Fermi 3Updated Final Safety Analysis Report
Table 3G.5-16 RB Upper Pools - Combined Forces and Moments, Selected Load Combination 6004
LocationElement
IDNx
(MN/m)Ny
(MN/m)Nxy
(MN/m)Mx
(MNm/m)My
(MNm/m)Mxy
(MNm/m)Qx
(MN/m)Qy
(MN/m)
15 Topslab 98120 OTHR -0.116 1.220 1.421 1.549 0.876 0.764 0.398 -1.412
@ Drywell Head TEMP -19.685 -9.620 -6.700 13.625 13.102 10.762 -0.910 -0.945
Opening HYDR 0.239 0.081 0.101 0.050 0.074 0.036 0.009 0.019
98135 OTHR -1.528 -0.597 -0.608 1.179 -0.461 0.203 0.263 -1.771
TEMP -32.643 -9.465 3.312 21.679 2.367 -4.692 1.311 -1.131
HYDR 0.374 0.055 0.078 0.068 0.021 0.017 0.005 0.009
98104 OTHR -0.337 2.874 -1.003 1.321 4.626 -0.589 -0.539 -1.018
TEMP -8.235 -7.644 3.764 4.770 25.728 -6.165 0.516 -0.138
HYDR 0.069 0.289 0.113 0.021 0.123 0.026 0.005 0.047
16 Topslab 98149 OTHR -0.546 2.189 -0.729 0.733 0.035 0.500 0.014 0.527
@ Center TEMP -21.295 -8.598 -2.582 17.374 16.424 1.478 -0.731 0.060
HYDR 0.350 0.186 0.040 0.047 0.037 0.026 0.016 0.020
98170 OTHR -0.368 1.466 -0.516 0.916 0.680 -0.069 -0.031 -0.221
TEMP -22.487 -9.601 -1.177 18.047 16.314 -0.099 0.184 0.965
HYDR 0.252 0.185 0.120 0.035 0.051 0.012 0.005 0.005
98109 OTHR 0.445 1.908 -0.252 1.490 2.892 -0.434 -0.170 -0.525
TEMP -14.161 -10.561 1.426 14.914 19.897 -0.725 0.771 -0.034
HYDR 0.042 0.153 0.192 0.028 0.083 0.027 0.005 0.013
17 Topslab 98174 OTHR 0.746 1.816 -0.160 0.551 0.562 0.702 0.224 -0.159
@ RCCV TEMP -18.223 -10.690 1.049 17.510 16.987 0.904 -0.266 0.393
HYDR 0.298 0.192 0.069 0.113 0.126 0.079 0.041 0.038
98197 OTHR 0.452 1.949 -0.214 -0.141 -2.616 -0.196 -0.109 -1.508
TEMP -21.470 -6.681 -1.270 17.924 18.933 -0.016 -0.052 -0.217
HYDR 0.414 0.266 0.108 0.072 0.133 0.034 0.017 0.035
98103 OTHR 0.937 2.239 -0.127 -1.911 0.510 -0.503 -1.454 -0.318
TEMP -13.879 -12.975 -0.003 21.263 20.723 0.115 1.239 0.090
HYDR 0.056 0.174 0.229 0.090 0.079 0.016 0.023 0.001
27 Slab 98472 OTHR 0.598 0.749 -0.160 0.093 0.116 0.074 0.310 -0.312
EL27.0m TEMP -0.712 2.508 15.854 2.844 3.563 -1.727 1.485 -1.701
@ RCCV HYDR 0.100 0.049 0.144 0.060 0.079 0.039 0.048 0.050
98514 OTHR 0.388 0.537 0.023 -0.035 -0.502 -0.013 -0.005 -0.005
TEMP 8.714 -4.774 -2.722 1.284 5.685 0.103 -0.091 -2.673
HYDR 0.171 0.075 0.171 0.027 0.126 0.002 0.002 0.099
98424 OTHR -0.280 1.593 -0.036 -0.576 -0.082 -0.132 -0.308 -0.030
TEMP -12.877 1.351 -2.967 7.731 9.604 -0.006 -6.463 -0.087
HYDR 0.038 0.122 0.094 0.045 0.058 0.019 0.155 0.004

3-1369 Revision 0October 2015
Fermi 3Updated Final Safety Analysis Report
Table 3G.5-16 RB Upper Pools - Combined Forces and Moments, Selected Load Combination 6004 (Continued)
OTHR: Loads other than thermal and hydrodynamic loadsTEMP: Thermal loadsHYDR: Hydrodynamic loadsSI to U.S. Customary units conversion (SI units are the controlling units and U.S. Customary units are for reference only):1 MN/m = 6.852x10⁴ lbf/ft1 MNm/m = 2.248x10⁵ lbf-ft/ft
LocationElement
IDNx
(MN/m)Ny
(MN/m)Nxy
(MN/m)Mx
(MNm/m)My
(MNm/m)Mxy
(MNm/m)Qx
(MN/m)Qy
(MN/m)
28 Pool Girder 123054 OTHR 0.181 1.271 1.721 0.070 0.026 -0.166 -0.053 -0.068
@ Storage Pool TEMP 9.857 -7.176 3.794 0.061 -0.484 -0.222 0.790 -0.570
HYDR 0.115 0.149 0.128 0.009 0.008 0.005 0.012 0.012
123154 OTHR 0.064 0.064 1.522 0.074 0.040 -0.189 -0.096 0.030
TEMP 7.646 -1.589 2.072 0.291 0.127 -0.235 0.262 0.022
HYDR 0.211 0.029 0.122 0.014 0.009 0.016 0.006 0.001
29 Pool Girder 123062 OTHR 0.341 -1.396 -1.460 0.027 0.300 -0.001 0.043 0.174
@ Well TEMP 11.194 0.038 -2.026 -0.395 0.719 0.207 1.138 -0.117
HYDR 0.127 0.014 0.099 0.009 0.011 0.004 0.005 0.003
123162 OTHR 2.594 -0.537 -1.030 0.081 0.023 0.000 -0.058 -0.029
TEMP 7.371 0.069 -1.416 -0.059 0.546 -0.247 0.304 -0.082
HYDR 0.315 0.013 0.093 0.017 0.011 0.003 0.011 0.003
30 Pool Girder 123067 OTHR 0.174 1.598 -1.845 -0.044 -0.074 0.042 -0.040 -0.043
@ Buffer Pool TEMP 7.387 -5.704 -5.204 0.309 -0.082 -0.083 -0.415 -0.377
HYDR 0.121 0.753 0.285 0.022 0.021 0.008 0.017 0.021
123167 OTHR -0.295 0.333 -1.783 -0.009 -0.064 0.036 -0.080 0.002
TEMP 4.800 -1.367 -2.400 0.306 0.335 0.026 -0.128 0.066
HYDR 0.336 0.218 0.312 0.013 0.006 0.006 0.008 0.003
32 IC/PCCS 125051 OTHR 0.275 1.012 1.148 -0.051 0.034 0.003 -0.041 0.049
Pool Wall TEMP 3.473 -2.171 0.893 -0.574 -0.630 0.049 -0.282 -0.058
in NS Direction HYDR 0.011 0.065 0.043 0.002 0.001 0.000 0.002 0.001
125151 OTHR 0.410 0.298 0.920 -0.064 -0.011 0.002 -0.068 0.005
TEMP 1.753 -1.442 -0.967 -0.439 -0.226 -0.016 -0.265 -0.069
HYDR 0.026 0.037 0.048 0.003 0.001 0.000 0.003 0.000
125055 OTHR 0.260 -0.040 -0.079 0.032 0.139 0.001 0.054 0.096
TEMP 6.938 0.773 -0.207 0.007 -0.199 -0.001 0.298 0.181
HYDR 0.033 0.031 0.066 0.001 0.001 0.000 0.001 0.000
125155 OTHR 0.974 0.033 -0.057 -0.002 -0.050 -0.006 -0.046 0.055
TEMP 3.393 0.481 0.012 0.006 -0.149 -0.010 0.012 -0.083
HYDR 0.052 0.012 0.070 0.001 0.000 0.000 0.001 0.001

3-1370 Revision 0October 2015
Fermi 3Updated Final Safety Analysis Report
Table 3G.5-17 RB Upper Pools - Combined Forces and Moments, Selected Load Combination 7001
LocationElement
IDNx
(MN/m)Ny
(MN/m)Nxy
(MN/m)Mx
(MNm/m)My
(MNm/m)Mxy
(MNm/m)Qx
(MN/m)Qy
(MN/m)
15 Topslab 98120 OTHR 0.283 0.926 1.091 0.861 0.544 0.392 0.290 -0.798
@ Drywell Head TEMP -15.960 -22.072 -9.476 4.431 2.330 3.669 -1.086 -1.337
Opening SEIS 1.584 1.139 0.981 0.492 0.682 0.404 0.110 0.437
HYDR 0.167 0.057 0.071 0.036 0.052 0.026 0.006 0.014
98135 OTHR -0.136 -0.322 -0.474 0.554 -0.221 0.183 0.155 -1.059
TEMP -30.538 -10.944 7.791 5.005 -0.130 -1.253 0.261 -0.282
SEIS 2.606 0.408 0.619 0.703 0.385 0.195 0.091 0.383
HYDR 0.259 0.037 0.053 0.049 0.015 0.012 0.004 0.006
98104 OTHR -0.195 2.182 -0.694 0.792 2.553 -0.289 -0.361 -0.602
TEMP -10.782 -29.517 7.027 0.326 5.448 -1.241 0.153 -0.246
SEIS 0.429 2.013 0.613 0.255 1.629 0.294 0.079 0.422
HYDR 0.047 0.201 0.077 0.015 0.089 0.019 0.004 0.032
16 Topslab 98149 OTHR 0.191 1.354 -0.308 0.230 -0.048 0.349 0.009 0.251
@ Center TEMP -26.935 -16.562 1.835 4.430 5.459 1.273 -0.543 -0.210
SEIS 1.835 0.611 0.764 0.750 0.348 0.134 0.094 0.293
HYDR 0.245 0.130 0.028 0.034 0.026 0.019 0.012 0.014
98170 OTHR 0.218 0.971 -0.319 0.369 0.178 -0.020 -0.020 -0.131
TEMP -24.575 -14.574 0.622 4.385 6.101 -0.019 0.102 0.612
SEIS 1.606 0.369 0.920 0.682 0.702 0.074 0.021 0.076
HYDR 0.176 0.127 0.084 0.025 0.036 0.009 0.003 0.004
98109 OTHR 0.348 1.457 -0.158 0.767 1.612 -0.231 -0.076 -0.318
TEMP -21.084 -20.420 2.654 3.532 4.859 0.021 0.689 -0.121
SEIS 0.171 1.539 0.805 0.714 1.056 0.208 0.123 0.183
HYDR 0.030 0.106 0.129 0.021 0.060 0.018 0.004 0.009
17 Topslab 98174 OTHR 0.766 1.170 -0.048 0.120 0.176 0.371 0.089 -0.091
@ RCCV TEMP -24.341 -16.231 -0.525 5.956 7.862 -0.379 -0.487 1.344
SEIS 1.598 1.092 0.763 0.763 0.581 0.341 0.216 0.118
HYDR 0.208 0.134 0.049 0.078 0.086 0.057 0.028 0.026
98197 OTHR 0.467 1.292 -0.199 -0.183 -1.351 -0.075 -0.049 -0.764
TEMP -28.708 -14.153 -1.482 4.297 5.736 0.291 0.369 -1.230
SEIS 1.413 0.587 0.950 0.302 1.025 0.177 0.080 0.633
HYDR 0.290 0.186 0.078 0.051 0.091 0.024 0.011 0.026
98103 OTHR 0.576 1.630 -0.068 -0.649 0.436 -0.269 -0.662 -0.174
TEMP -23.625 -19.677 0.017 8.929 6.517 0.137 1.162 0.098
SEIS 0.304 1.689 1.238 2.160 0.733 0.304 0.930 0.125
HYDR 0.039 0.121 0.155 0.068 0.059 0.011 0.018 0.001
27 Slab 98472 OTHR 0.541 0.521 -0.068 0.159 0.239 -0.092 0.321 -0.342
EL27.0m TEMP -6.688 -5.372 14.755 -3.970 -2.975 -0.477 1.234 -1.689
@ RCCV SEIS 1.176 1.193 0.615 0.578 0.794 0.492 0.399 0.483
HYDR 0.075 0.036 0.103 0.045 0.059 0.029 0.035 0.038
98514 OTHR 0.312 0.396 0.031 -0.011 -0.282 0.003 -0.010 -0.043
TEMP 12.327 -5.717 -3.144 -1.352 -0.396 -0.165 0.097 -0.409
SEIS 0.726 0.299 0.479 0.203 1.130 0.049 0.047 0.777
HYDR 0.121 0.054 0.118 0.020 0.094 0.001 0.001 0.074
98424 OTHR -0.224 1.211 -0.021 -0.140 0.005 -0.107 -0.521 -0.042
TEMP -19.507 -7.609 -2.516 -9.062 -5.593 -0.059 -6.087 0.027
SEIS 1.028 1.165 5.763 0.759 0.269 0.223 1.468 0.128
HYDR 0.028 0.084 0.064 0.033 0.044 0.013 0.117 0.003

3-1371 Revision 0October 2015
Fermi 3Updated Final Safety Analysis Report
Table 3G.5-17 RB Upper Pools - Combined Forces and Moments, Selected Load Combination 7001 (Continued)
OTHR: Loads other than thermal and hydrodynamic loadsTEMP: Thermal loadsHYDR: Hydrodynamic loadsSI to U.S. Customary units conversion (SI units are the controlling units and U.S. Customary units are for reference only):1 MN/m = 6.852x10⁴ lbf/ft1 MNm/m = 2.248x10⁵ lbf-ft/ft
LocationElement
IDNx
(MN/m)Ny
(MN/m)Nxy
(MN/m)Mx
(MNm/m)My
(MNm/m)Mxy
(MNm/m)Qx
(MN/m)Qy
(MN/m)
28 Pool Girder 123054 OTHR 0.254 0.062 0.883 0.063 0.032 -0.096 -0.040 -0.052
@ Storage Pool TEMP -1.938 -2.515 1.566 5.417 5.584 0.162 -0.786 1.285
SEIS 0.509 2.690 0.878 0.333 0.162 0.091 0.035 0.197
HYDR 0.085 0.112 0.096 0.007 0.006 0.004 0.008 0.009
123154 OTHR 0.469 -0.118 0.803 0.073 0.035 -0.096 -0.061 0.024
TEMP 2.827 2.088 -1.845 4.580 2.974 -0.774 -0.233 0.669
SEIS 1.814 0.723 0.957 0.238 0.075 0.124 0.056 0.013
HYDR 0.157 0.021 0.091 0.010 0.007 0.011 0.004 0.001
29 Pool Girder 123062 OTHR 0.359 -0.748 -0.884 0.004 0.130 0.007 0.034 0.079
@ Well TEMP -5.127 -4.093 -0.708 -0.074 0.431 0.003 -0.026 0.353
SEIS 0.623 1.105 0.433 0.163 0.219 0.052 0.090 0.138
HYDR 0.088 0.010 0.070 0.006 0.008 0.003 0.003 0.002
123162 OTHR 1.266 -0.294 -0.641 0.030 -0.001 0.004 -0.012 -0.011
TEMP -3.908 -3.486 -2.637 -0.570 -0.433 0.167 -0.034 0.235
SEIS 1.619 0.928 0.272 0.279 0.099 0.033 0.160 0.027
HYDR 0.233 0.010 0.066 0.012 0.008 0.002 0.008 0.002
30 Pool Girder 123067 OTHR 0.253 0.356 -0.750 -0.024 -0.063 0.006 -0.059 -0.044
@ Buffer Pool TEMP -3.820 -9.165 -4.161 -2.718 -3.315 -0.123 -0.102 0.614
SEIS 0.854 2.907 1.607 0.181 0.179 0.091 0.102 0.257
HYDR 0.090 0.556 0.209 0.015 0.014 0.006 0.012 0.015
123167 OTHR -0.044 0.041 -0.769 0.005 -0.035 0.028 -0.062 0.004
TEMP -2.808 -4.392 -4.025 -3.283 -3.669 -0.676 0.202 -0.166
SEIS 1.387 0.756 1.690 0.073 0.117 0.066 0.061 0.015
HYDR 0.249 0.161 0.229 0.010 0.004 0.004 0.006 0.002
32 IC/PCCS 125051 OTHR 0.151 0.243 0.465 -0.034 0.004 0.001 -0.026 0.018
Pool Wall TEMP -1.704 -1.534 -0.758 0.082 0.171 0.014 -0.047 0.053
in NS Direction SEIS 0.174 1.291 0.962 0.006 0.058 0.006 0.023 0.046
HYDR 0.008 0.048 0.031 0.001 0.001 0.000 0.002 0.001
125151 OTHR 0.235 0.020 0.367 -0.043 -0.010 0.000 -0.042 0.002
TEMP -1.701 -1.207 1.885 0.196 0.283 0.076 -0.028 -0.077
SEIS 0.240 0.575 0.764 0.017 0.015 0.013 0.029 0.014
HYDR 0.020 0.027 0.035 0.002 0.001 0.000 0.002 0.000
125055 OTHR 0.188 -0.090 -0.086 0.016 0.058 0.002 0.024 0.041
TEMP -5.013 0.266 0.012 0.033 0.309 0.010 0.048 0.102
SEIS 0.372 0.153 0.491 0.031 0.101 0.006 0.038 0.076
HYDR 0.023 0.022 0.047 0.000 0.000 0.000 0.000 0.000
125155 OTHR 0.472 -0.022 -0.065 0.001 -0.024 -0.002 -0.020 0.024
TEMP -5.698 -0.537 -0.141 -0.037 -0.038 -0.015 -0.287 0.230
SEIS 0.722 0.105 0.419 0.020 0.033 0.008 0.044 0.047
HYDR 0.039 0.008 0.050 0.000 0.000 0.000 0.001 0.000

3-1372 Revision 0October 2015
Fermi 3Updated Final Safety Analysis Report
Table 3G.5-18 RB Upper Pools - Combined Forces and Moments, Selected Load Combination 7002
LocationElement
IDNx
(MN/m)Ny
(MN/m)Nxy
(MN/m)Mx
(MNm/m)My
(MNm/m)Mxy
(MNm/m)Qx
(MN/m)Qy
(MN/m)
15 Topslab 98120 OTHR 0.283 0.926 1.091 0.861 0.544 0.392 0.290 -0.798
@ Drywell Head TEMP -19.902 -26.667 -11.787 5.629 2.584 4.364 -2.001 -2.323
Opening SEIS 1.584 1.139 0.981 0.492 0.682 0.404 0.110 0.437
HYDR 0.167 0.057 0.071 0.036 0.052 0.026 0.006 0.014
98135 OTHR -0.136 -0.322 -0.474 0.554 -0.221 0.183 0.155 -1.059
TEMP -39.294 -13.488 9.764 5.599 -0.234 -1.593 0.184 -0.375
SEIS 2.606 0.408 0.619 0.703 0.385 0.195 0.091 0.383
HYDR 0.259 0.037 0.053 0.049 0.015 0.012 0.004 0.006
98104 OTHR -0.195 2.182 -0.694 0.792 2.553 -0.289 -0.361 -0.602
TEMP -13.270 -35.829 8.792 0.352 6.123 -1.341 0.149 -0.199
SEIS 0.429 2.013 0.613 0.255 1.629 0.294 0.079 0.422
HYDR 0.047 0.201 0.077 0.015 0.089 0.019 0.004 0.032
16 Topslab 98149 OTHR 0.191 1.354 -0.308 0.230 -0.048 0.349 0.009 0.251
@ Center TEMP -33.733 -21.119 4.825 5.213 5.993 1.060 -1.406 0.102
SEIS 1.835 0.611 0.764 0.750 0.348 0.134 0.094 0.293
HYDR 0.245 0.130 0.028 0.034 0.026 0.019 0.012 0.014
98170 OTHR 0.218 0.971 -0.319 0.369 0.178 -0.020 -0.020 -0.131
TEMP -34.893 -14.930 1.452 5.732 10.037 -0.064 -0.308 2.366
SEIS 1.606 0.369 0.920 0.682 0.702 0.074 0.021 0.076
HYDR 0.176 0.127 0.084 0.025 0.036 0.009 0.003 0.004
98109 OTHR 0.348 1.457 -0.158 0.767 1.612 -0.231 -0.076 -0.318
TEMP -25.371 -25.382 2.731 3.872 5.508 0.166 0.756 -0.215
SEIS 0.171 1.539 0.805 0.714 1.056 0.208 0.123 0.183
HYDR 0.030 0.106 0.129 0.021 0.060 0.018 0.004 0.009
17 Topslab 98174 OTHR 0.766 1.170 -0.048 0.120 0.176 0.371 0.089 -0.091
@ RCCV TEMP -26.600 -14.222 8.993 10.857 12.992 1.314 -1.498 1.903
SEIS 1.598 1.092 0.763 0.763 0.581 0.341 0.216 0.118
HYDR 0.208 0.134 0.049 0.078 0.086 0.057 0.028 0.026
98197 OTHR 0.467 1.292 -0.199 -0.183 -1.351 -0.075 -0.049 -0.764
TEMP -13.284 -10.483 -1.148 17.845 17.217 0.071 0.069 -0.159
SEIS 1.413 0.587 0.950 0.302 1.025 0.177 0.080 0.633
HYDR 0.290 0.186 0.078 0.051 0.091 0.024 0.011 0.026
98103 OTHR 0.576 1.630 -0.068 -0.649 0.436 -0.269 -0.662 -0.174
TEMP -27.839 -21.759 0.163 10.698 7.647 0.099 1.647 0.121
SEIS 0.304 1.689 1.238 2.160 0.733 0.304 0.930 0.125
HYDR 0.039 0.121 0.155 0.068 0.059 0.011 0.018 0.001
27 Slab 98472 OTHR 0.541 0.521 -0.068 0.159 0.239 -0.092 0.321 -0.342
EL27.0m TEMP 0.560 2.997 21.415 2.417 3.120 -1.205 1.317 -1.610
@ RCCV SEIS 1.176 1.193 0.615 0.578 0.794 0.492 0.399 0.483
HYDR 0.075 0.036 0.103 0.045 0.059 0.029 0.035 0.038
98514 OTHR 0.312 0.396 0.031 -0.011 -0.282 0.003 -0.010 -0.043
TEMP 12.596 -5.530 -2.667 1.250 5.280 0.063 -0.064 -2.425
SEIS 0.726 0.299 0.479 0.203 1.130 0.049 0.047 0.777
HYDR 0.121 0.054 0.118 0.020 0.094 0.001 0.001 0.074
98424 OTHR -0.224 1.211 -0.021 -0.140 0.005 -0.107 -0.521 -0.042
TEMP -25.159 -6.289 -2.594 -9.143 -5.309 -0.140 -8.276 -0.118
SEIS 1.028 1.165 5.763 0.759 0.269 0.223 1.468 0.128
HYDR 0.028 0.084 0.064 0.033 0.044 0.013 0.117 0.003
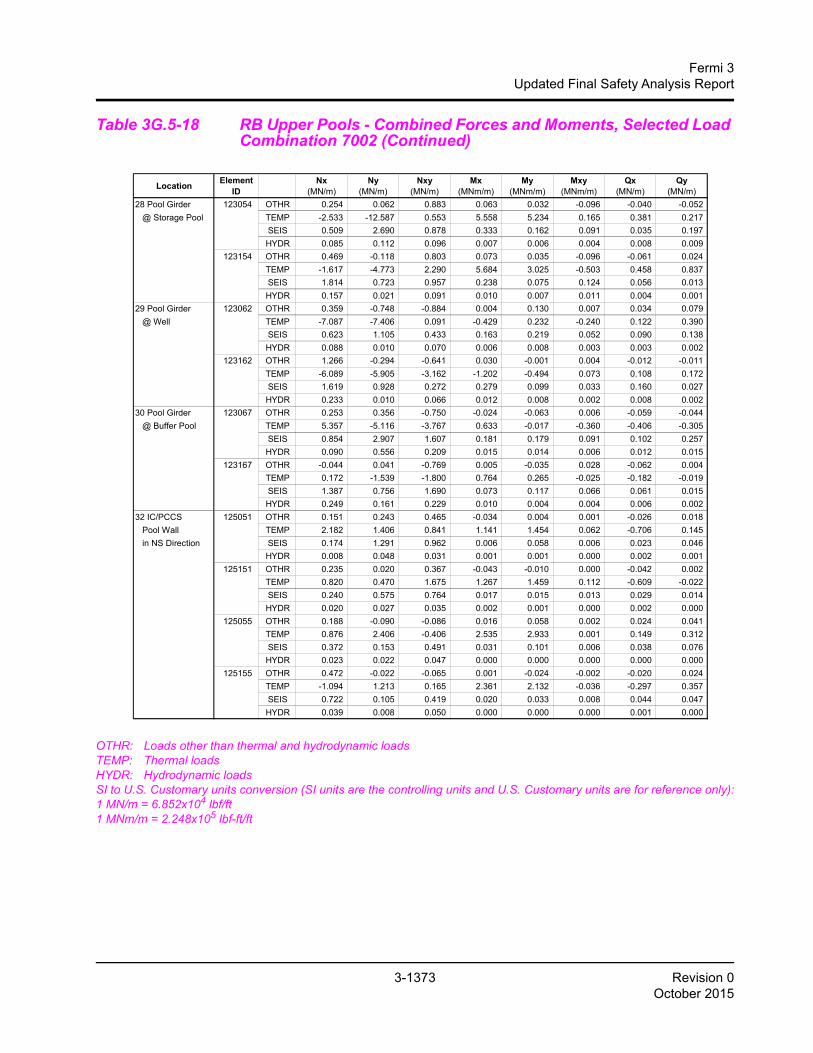
3-1373 Revision 0October 2015
Fermi 3Updated Final Safety Analysis Report
Table 3G.5-18 RB Upper Pools - Combined Forces and Moments, Selected Load Combination 7002 (Continued)
OTHR: Loads other than thermal and hydrodynamic loadsTEMP: Thermal loadsHYDR: Hydrodynamic loadsSI to U.S. Customary units conversion (SI units are the controlling units and U.S. Customary units are for reference only):1 MN/m = 6.852x10⁴ lbf/ft1 MNm/m = 2.248x10⁵ lbf-ft/ft
LocationElement
IDNx
(MN/m)Ny
(MN/m)Nxy
(MN/m)Mx
(MNm/m)My
(MNm/m)Mxy
(MNm/m)Qx
(MN/m)Qy
(MN/m)
28 Pool Girder 123054 OTHR 0.254 0.062 0.883 0.063 0.032 -0.096 -0.040 -0.052
@ Storage Pool TEMP -2.533 -12.587 0.553 5.558 5.234 0.165 0.381 0.217
SEIS 0.509 2.690 0.878 0.333 0.162 0.091 0.035 0.197
HYDR 0.085 0.112 0.096 0.007 0.006 0.004 0.008 0.009
123154 OTHR 0.469 -0.118 0.803 0.073 0.035 -0.096 -0.061 0.024
TEMP -1.617 -4.773 2.290 5.684 3.025 -0.503 0.458 0.837
SEIS 1.814 0.723 0.957 0.238 0.075 0.124 0.056 0.013
HYDR 0.157 0.021 0.091 0.010 0.007 0.011 0.004 0.001
29 Pool Girder 123062 OTHR 0.359 -0.748 -0.884 0.004 0.130 0.007 0.034 0.079
@ Well TEMP -7.087 -7.406 0.091 -0.429 0.232 -0.240 0.122 0.390
SEIS 0.623 1.105 0.433 0.163 0.219 0.052 0.090 0.138
HYDR 0.088 0.010 0.070 0.006 0.008 0.003 0.003 0.002
123162 OTHR 1.266 -0.294 -0.641 0.030 -0.001 0.004 -0.012 -0.011
TEMP -6.089 -5.905 -3.162 -1.202 -0.494 0.073 0.108 0.172
SEIS 1.619 0.928 0.272 0.279 0.099 0.033 0.160 0.027
HYDR 0.233 0.010 0.066 0.012 0.008 0.002 0.008 0.002
30 Pool Girder 123067 OTHR 0.253 0.356 -0.750 -0.024 -0.063 0.006 -0.059 -0.044
@ Buffer Pool TEMP 5.357 -5.116 -3.767 0.633 -0.017 -0.360 -0.406 -0.305
SEIS 0.854 2.907 1.607 0.181 0.179 0.091 0.102 0.257
HYDR 0.090 0.556 0.209 0.015 0.014 0.006 0.012 0.015
123167 OTHR -0.044 0.041 -0.769 0.005 -0.035 0.028 -0.062 0.004
TEMP 0.172 -1.539 -1.800 0.764 0.265 -0.025 -0.182 -0.019
SEIS 1.387 0.756 1.690 0.073 0.117 0.066 0.061 0.015
HYDR 0.249 0.161 0.229 0.010 0.004 0.004 0.006 0.002
32 IC/PCCS 125051 OTHR 0.151 0.243 0.465 -0.034 0.004 0.001 -0.026 0.018
Pool Wall TEMP 2.182 1.406 0.841 1.141 1.454 0.062 -0.706 0.145
in NS Direction SEIS 0.174 1.291 0.962 0.006 0.058 0.006 0.023 0.046
HYDR 0.008 0.048 0.031 0.001 0.001 0.000 0.002 0.001
125151 OTHR 0.235 0.020 0.367 -0.043 -0.010 0.000 -0.042 0.002
TEMP 0.820 0.470 1.675 1.267 1.459 0.112 -0.609 -0.022
SEIS 0.240 0.575 0.764 0.017 0.015 0.013 0.029 0.014
HYDR 0.020 0.027 0.035 0.002 0.001 0.000 0.002 0.000
125055 OTHR 0.188 -0.090 -0.086 0.016 0.058 0.002 0.024 0.041
TEMP 0.876 2.406 -0.406 2.535 2.933 0.001 0.149 0.312
SEIS 0.372 0.153 0.491 0.031 0.101 0.006 0.038 0.076
HYDR 0.023 0.022 0.047 0.000 0.000 0.000 0.000 0.000
125155 OTHR 0.472 -0.022 -0.065 0.001 -0.024 -0.002 -0.020 0.024
TEMP -1.094 1.213 0.165 2.361 2.132 -0.036 -0.297 0.357
SEIS 0.722 0.105 0.419 0.020 0.033 0.008 0.044 0.047
HYDR 0.039 0.008 0.050 0.000 0.000 0.000 0.001 0.000

3-1374 Revision 0October 2015
Fermi 3Updated Final Safety Analysis Report
Table 3G.5-19 RB Upper Pools - Combined Forces and Moments, Selected Load Combination 7003
LocationElement
IDNx
(MN/m)Ny
(MN/m)Nxy
(MN/m)Mx
(MNm/m)My
(MNm/m)Mxy
(MNm/m)Qx
(MN/m)Qy
(MN/m)
15 Topslab 98120 OTHR 0.283 0.926 1.091 0.861 0.544 0.392 0.290 -0.798
@ Drywell Head TEMP -15.482 -25.691 -9.974 5.489 2.234 4.322 -2.021 -2.368
Opening SEIS 1.584 1.139 0.981 0.492 0.682 0.404 0.110 0.437
HYDR 0.167 0.057 0.071 0.036 0.052 0.026 0.006 0.014
98135 OTHR -0.136 -0.322 -0.474 0.554 -0.221 0.183 0.155 -1.059
TEMP -32.537 -12.430 9.556 4.505 -0.194 -1.508 0.066 -0.258
SEIS 2.606 0.408 0.619 0.703 0.385 0.195 0.091 0.383
HYDR 0.259 0.037 0.053 0.049 0.015 0.012 0.004 0.006
98104 OTHR -0.195 2.182 -0.694 0.792 2.553 -0.289 -0.361 -0.602
TEMP -12.512 -34.938 8.362 0.044 4.959 -1.046 0.084 -0.255
SEIS 0.429 2.013 0.613 0.255 1.629 0.294 0.079 0.422
HYDR 0.047 0.201 0.077 0.015 0.089 0.019 0.004 0.032
16 Topslab 98149 OTHR 0.191 1.354 -0.308 0.230 -0.048 0.349 0.009 0.251
@ Center TEMP -28.675 -18.892 4.137 6.478 7.026 1.078 -2.189 -0.583
SEIS 1.835 0.611 0.764 0.750 0.348 0.134 0.094 0.293
HYDR 0.245 0.130 0.028 0.034 0.026 0.019 0.012 0.014
98170 OTHR 0.218 0.971 -0.319 0.369 0.178 -0.020 -0.020 -0.131
TEMP -25.010 -15.923 1.978 5.084 6.564 -0.038 0.234 0.414
SEIS 1.606 0.369 0.920 0.682 0.702 0.074 0.021 0.076
HYDR 0.176 0.127 0.084 0.025 0.036 0.009 0.003 0.004
98109 OTHR 0.348 1.457 -0.158 0.767 1.612 -0.231 -0.076 -0.318
TEMP -23.621 -24.363 2.681 3.361 4.562 0.150 0.762 -0.169
SEIS 0.171 1.539 0.805 0.714 1.056 0.208 0.123 0.183
HYDR 0.030 0.106 0.129 0.021 0.060 0.018 0.004 0.009
17 Topslab 98174 OTHR 0.766 1.170 -0.048 0.120 0.176 0.371 0.089 -0.091
@ RCCV TEMP -22.078 -8.288 0.121 9.502 11.524 -0.392 -0.423 0.969
SEIS 1.598 1.092 0.763 0.763 0.581 0.341 0.216 0.118
HYDR 0.208 0.134 0.049 0.078 0.086 0.057 0.028 0.026
98197 OTHR 0.467 1.292 -0.199 -0.183 -1.351 -0.075 -0.049 -0.764
TEMP -32.845 -14.689 -0.677 3.897 4.991 0.352 0.353 -1.504
SEIS 1.413 0.587 0.950 0.302 1.025 0.177 0.080 0.633
HYDR 0.290 0.186 0.078 0.051 0.091 0.024 0.011 0.026
98103 OTHR 0.576 1.630 -0.068 -0.649 0.436 -0.269 -0.662 -0.174
TEMP -26.644 -21.930 0.304 9.531 6.548 0.056 1.410 0.111
SEIS 0.304 1.689 1.238 2.160 0.733 0.304 0.930 0.125
HYDR 0.039 0.121 0.155 0.068 0.059 0.011 0.018 0.001
27 Slab 98472 OTHR 0.541 0.521 -0.068 0.159 0.239 -0.092 0.321 -0.342
EL27.0m TEMP -10.555 -5.730 14.877 -3.631 -2.841 -0.701 1.393 -1.882
@ RCCV SEIS 1.176 1.193 0.615 0.578 0.794 0.492 0.399 0.483
HYDR 0.075 0.036 0.103 0.045 0.059 0.029 0.035 0.038
98514 OTHR 0.312 0.396 0.031 -0.011 -0.282 0.003 -0.010 -0.043
TEMP 19.208 -5.647 -2.587 1.045 2.953 -0.194 0.107 -1.118
SEIS 0.726 0.299 0.479 0.203 1.130 0.049 0.047 0.777
HYDR 0.121 0.054 0.118 0.020 0.094 0.001 0.001 0.074
98424 OTHR -0.224 1.211 -0.021 -0.140 0.005 -0.107 -0.521 -0.042
TEMP -24.231 -6.952 -2.278 -10.190 -6.460 -0.167 -7.964 -0.108
SEIS 1.028 1.165 5.763 0.759 0.269 0.223 1.468 0.128
HYDR 0.028 0.084 0.064 0.033 0.044 0.013 0.117 0.003

3-1375 Revision 0October 2015
Fermi 3Updated Final Safety Analysis Report
Table 3G.5-19 RB Upper Pools - Combined Forces and Moments, Selected Load Combination 7003 (Continued)
OTHR: Loads other than thermal and hydrodynamic loadsTEMP: Thermal loadsHYDR: Hydrodynamic loadsSI to U.S. Customary units conversion (SI units are the controlling units and U.S. Customary units are for reference only):1 MN/m = 6.852x10⁴ lbf/ft1 MNm/m = 2.248x10⁵ lbf-ft/ft
LocationElement
IDNx
(MN/m)Ny
(MN/m)Nxy
(MN/m)Mx
(MNm/m)My
(MNm/m)Mxy
(MNm/m)Qx
(MN/m)Qy
(MN/m)
28 Pool Girder 123054 OTHR 0.254 0.062 0.883 0.063 0.032 -0.096 -0.040 -0.052
@ Storage Pool TEMP -0.796 -10.849 0.720 6.148 6.064 0.167 0.364 0.243
SEIS 0.509 2.690 0.878 0.333 0.162 0.091 0.035 0.197
HYDR 0.085 0.112 0.096 0.007 0.006 0.004 0.008 0.009
123154 OTHR 0.469 -0.118 0.803 0.073 0.035 -0.096 -0.061 0.024
TEMP 2.563 -3.589 1.883 6.336 3.560 -0.289 0.575 0.983
SEIS 1.814 0.723 0.957 0.238 0.075 0.124 0.056 0.013
HYDR 0.157 0.021 0.091 0.010 0.007 0.011 0.004 0.001
29 Pool Girder 123062 OTHR 0.359 -0.748 -0.884 0.004 0.130 0.007 0.034 0.079
@ Well TEMP -3.492 -7.610 -0.329 0.235 0.976 -0.143 0.144 0.349
SEIS 0.623 1.105 0.433 0.163 0.219 0.052 0.090 0.138
HYDR 0.088 0.010 0.070 0.006 0.008 0.003 0.003 0.002
123162 OTHR 1.266 -0.294 -0.641 0.030 -0.001 0.004 -0.012 -0.011
TEMP -2.959 -6.337 -3.847 -0.450 0.157 0.052 0.056 0.215
SEIS 1.619 0.928 0.272 0.279 0.099 0.033 0.160 0.027
HYDR 0.233 0.010 0.066 0.012 0.008 0.002 0.008 0.002
30 Pool Girder 123067 OTHR 0.253 0.356 -0.750 -0.024 -0.063 0.006 -0.059 -0.044
@ Buffer Pool TEMP -1.268 -8.891 -3.861 -5.866 -6.788 0.001 -0.270 0.070
SEIS 0.854 2.907 1.607 0.181 0.179 0.091 0.102 0.257
HYDR 0.090 0.556 0.209 0.015 0.014 0.006 0.012 0.015
123167 OTHR -0.044 0.041 -0.769 0.005 -0.035 0.028 -0.062 0.004
TEMP -0.187 -3.829 -3.108 -6.192 -5.622 -0.821 0.411 -0.590
SEIS 1.387 0.756 1.690 0.073 0.117 0.066 0.061 0.015
HYDR 0.249 0.161 0.229 0.010 0.004 0.004 0.006 0.002
32 IC/PCCS 125051 OTHR 0.151 0.243 0.465 -0.034 0.004 0.001 -0.026 0.018
Pool Wall TEMP -1.590 -0.135 -1.056 -0.896 -0.957 0.021 -0.132 0.072
in NS Direction SEIS 0.174 1.291 0.962 0.006 0.058 0.006 0.023 0.046
HYDR 0.008 0.048 0.031 0.001 0.001 0.000 0.002 0.001
125151 OTHR 0.235 0.020 0.367 -0.043 -0.010 0.000 -0.042 0.002
TEMP -1.514 -0.093 1.642 -0.781 -0.803 0.065 -0.132 -0.123
SEIS 0.240 0.575 0.764 0.017 0.015 0.013 0.029 0.014
HYDR 0.020 0.027 0.035 0.002 0.001 0.000 0.002 0.000
125055 OTHR 0.188 -0.090 -0.086 0.016 0.058 0.002 0.024 0.041
TEMP -5.687 0.084 -0.180 -0.145 0.088 0.019 0.049 0.095
SEIS 0.372 0.153 0.491 0.031 0.101 0.006 0.038 0.076
HYDR 0.023 0.022 0.047 0.000 0.000 0.000 0.000 0.000
125155 OTHR 0.472 -0.022 -0.065 0.001 -0.024 -0.002 -0.020 0.024
TEMP -6.471 -0.673 -0.245 -0.209 -0.233 -0.039 -0.277 0.218
SEIS 0.722 0.105 0.419 0.020 0.033 0.008 0.044 0.047
HYDR 0.039 0.008 0.050 0.000 0.000 0.000 0.001 0.000

3-1376 Revision 0October 2015
Fermi 3Updated Final Safety Analysis Report
Table 3G.5-20 RB Upper Pools - Combined Forces and Moments, Selected Load Combination 7004
LocationElement
IDNx
(MN/m)Ny
(MN/m)Nxy
(MN/m)Mx
(MNm/m)My
(MNm/m)Mxy
(MNm/m)Qx
(MN/m)Qy
(MN/m)
15 Topslab 98120 OTHR 0.283 0.926 1.091 0.861 0.544 0.392 0.290 -0.798
@ Drywell Head TEMP -19.685 -9.620 -6.700 13.625 13.102 10.762 -0.910 -0.945
Opening SEIS 1.584 1.139 0.981 0.492 0.682 0.404 0.110 0.437
HYDR 0.167 0.057 0.071 0.036 0.052 0.026 0.006 0.014
98135 OTHR -0.136 -0.322 -0.474 0.554 -0.221 0.183 0.155 -1.059
TEMP -32.643 -9.465 3.312 21.679 2.367 -4.692 1.311 -1.131
SEIS 2.606 0.408 0.619 0.703 0.385 0.195 0.091 0.383
HYDR 0.259 0.037 0.053 0.049 0.015 0.012 0.004 0.006
98104 OTHR -0.195 2.182 -0.694 0.792 2.553 -0.289 -0.361 -0.602
TEMP -8.235 -7.644 3.764 4.770 25.728 -6.165 0.516 -0.138
SEIS 0.429 2.013 0.613 0.255 1.629 0.294 0.079 0.422
HYDR 0.047 0.201 0.077 0.015 0.089 0.019 0.004 0.032
16 Topslab 98149 OTHR 0.191 1.354 -0.308 0.230 -0.048 0.349 0.009 0.251
@ Center TEMP -21.295 -8.598 -2.582 17.374 16.424 1.478 -0.731 0.060
SEIS 1.835 0.611 0.764 0.750 0.348 0.134 0.094 0.293
HYDR 0.245 0.130 0.028 0.034 0.026 0.019 0.012 0.014
98170 OTHR 0.218 0.971 -0.319 0.369 0.178 -0.020 -0.020 -0.131
TEMP -22.487 -9.601 -1.177 18.047 16.314 -0.099 0.184 0.965
SEIS 1.606 0.369 0.920 0.682 0.702 0.074 0.021 0.076
HYDR 0.176 0.127 0.084 0.025 0.036 0.009 0.003 0.004
98109 OTHR 0.348 1.457 -0.158 0.767 1.612 -0.231 -0.076 -0.318
TEMP -14.161 -10.561 1.426 14.914 19.897 -0.725 0.771 -0.034
SEIS 0.171 1.539 0.805 0.714 1.056 0.208 0.123 0.183
HYDR 0.030 0.106 0.129 0.021 0.060 0.018 0.004 0.009
17 Topslab 98174 OTHR 0.766 1.170 -0.048 0.120 0.176 0.371 0.089 -0.091
@ RCCV TEMP -18.223 -10.690 1.049 17.510 16.987 0.904 -0.266 0.393
SEIS 1.598 1.092 0.763 0.763 0.581 0.341 0.216 0.118
HYDR 0.208 0.134 0.049 0.078 0.086 0.057 0.028 0.026
98197 OTHR 0.467 1.292 -0.199 -0.183 -1.351 -0.075 -0.049 -0.764
TEMP -21.470 -6.681 -1.270 17.924 18.933 -0.016 -0.052 -0.217
SEIS 1.413 0.587 0.950 0.302 1.025 0.177 0.080 0.633
HYDR 0.290 0.186 0.078 0.051 0.091 0.024 0.011 0.026
98103 OTHR 0.576 1.630 -0.068 -0.649 0.436 -0.269 -0.662 -0.174
TEMP -13.879 -12.975 -0.003 21.263 20.723 0.115 1.239 0.090
SEIS 0.304 1.689 1.238 2.160 0.733 0.304 0.930 0.125
HYDR 0.039 0.121 0.155 0.068 0.059 0.011 0.018 0.001
27 Slab 98472 OTHR 0.541 0.521 -0.068 0.159 0.239 -0.092 0.321 -0.342
EL27.0m TEMP -0.712 2.508 15.854 2.844 3.563 -1.727 1.485 -1.701
@ RCCV SEIS 1.176 1.193 0.615 0.578 0.794 0.492 0.399 0.483
HYDR 0.075 0.036 0.103 0.045 0.059 0.029 0.035 0.038
98514 OTHR 0.312 0.396 0.031 -0.011 -0.282 0.003 -0.010 -0.043
TEMP 8.714 -4.774 -2.722 1.284 5.685 0.103 -0.091 -2.673
SEIS 0.726 0.299 0.479 0.203 1.130 0.049 0.047 0.777
HYDR 0.121 0.054 0.118 0.020 0.094 0.001 0.001 0.074
98424 OTHR -0.224 1.211 -0.021 -0.140 0.005 -0.107 -0.521 -0.042
TEMP -12.877 1.351 -2.967 7.731 9.604 -0.006 -6.463 -0.087
SEIS 1.028 1.165 5.763 0.759 0.269 0.223 1.468 0.128
HYDR 0.028 0.084 0.064 0.033 0.044 0.013 0.117 0.003

3-1377 Revision 0October 2015
Fermi 3Updated Final Safety Analysis Report
Table 3G.5-20 RB Upper Pools - Combined Forces and Moments, Selected Load Combination 7004 (Continued)
OTHR: Loads other than thermal and hydrodynamic loadsTEMP: Thermal loadsHYDR: Hydrodynamic loadsSI to U.S. Customary units conversion (SI units are the controlling units and U.S. Customary units are for reference only):1 MN/m = 6.852x10⁴ lbf/ft1 MNm/m = 2.248x10⁵ lbf-ft/ft
LocationElement
IDNx
(MN/m)Ny
(MN/m)Nxy
(MN/m)Mx
(MNm/m)My
(MNm/m)Mxy
(MNm/m)Qx
(MN/m)Qy
(MN/m)
28 Pool Girder 123054 OTHR 0.254 0.062 0.883 0.063 0.032 -0.096 -0.040 -0.052
@ Storage Pool TEMP 9.857 -7.176 3.794 0.061 -0.484 -0.222 0.790 -0.570
SEIS 0.509 2.690 0.878 0.333 0.162 0.091 0.035 0.197
HYDR 0.085 0.112 0.096 0.007 0.006 0.004 0.008 0.009
123154 OTHR 0.469 -0.118 0.803 0.073 0.035 -0.096 -0.061 0.024
TEMP 7.646 -1.589 2.072 0.291 0.127 -0.235 0.262 0.022
SEIS 1.814 0.723 0.957 0.238 0.075 0.124 0.056 0.013
HYDR 0.157 0.021 0.091 0.010 0.007 0.011 0.004 0.001
29 Pool Girder 123062 OTHR 0.359 -0.748 -0.884 0.004 0.130 0.007 0.034 0.079
@ Well TEMP 11.194 0.038 -2.026 -0.395 0.719 0.207 1.138 -0.117
SEIS 0.623 1.105 0.433 0.163 0.219 0.052 0.090 0.138
HYDR 0.088 0.010 0.070 0.006 0.008 0.003 0.003 0.002
123162 OTHR 1.266 -0.294 -0.641 0.030 -0.001 0.004 -0.012 -0.011
TEMP 7.371 0.069 -1.416 -0.059 0.546 -0.247 0.304 -0.082
SEIS 1.619 0.928 0.272 0.279 0.099 0.033 0.160 0.027
HYDR 0.233 0.010 0.066 0.012 0.008 0.002 0.008 0.002
30 Pool Girder 123067 OTHR 0.253 0.356 -0.750 -0.024 -0.063 0.006 -0.059 -0.044
@ Buffer Pool TEMP 7.387 -5.704 -5.204 0.309 -0.082 -0.083 -0.415 -0.377
SEIS 0.854 2.907 1.607 0.181 0.179 0.091 0.102 0.257
HYDR 0.090 0.556 0.209 0.015 0.014 0.006 0.012 0.015
123167 OTHR -0.044 0.041 -0.769 0.005 -0.035 0.028 -0.062 0.004
TEMP 4.800 -1.367 -2.400 0.306 0.335 0.026 -0.128 0.066
SEIS 1.387 0.756 1.690 0.073 0.117 0.066 0.061 0.015
HYDR 0.249 0.161 0.229 0.010 0.004 0.004 0.006 0.002
32 IC/PCCS 125051 OTHR 0.151 0.243 0.465 -0.034 0.004 0.001 -0.026 0.018
Pool Wall TEMP 3.473 -2.171 0.893 -0.574 -0.630 0.049 -0.282 -0.058
in NS Direction SEIS 0.174 1.291 0.962 0.006 0.058 0.006 0.023 0.046
HYDR 0.008 0.048 0.031 0.001 0.001 0.000 0.002 0.001
125151 OTHR 0.235 0.020 0.367 -0.043 -0.010 0.000 -0.042 0.002
TEMP 1.753 -1.442 -0.967 -0.439 -0.226 -0.016 -0.265 -0.069
SEIS 0.240 0.575 0.764 0.017 0.015 0.013 0.029 0.014
HYDR 0.020 0.027 0.035 0.002 0.001 0.000 0.002 0.000
125055 OTHR 0.188 -0.090 -0.086 0.016 0.058 0.002 0.024 0.041
TEMP 6.938 0.773 -0.207 0.007 -0.199 -0.001 0.298 0.181
SEIS 0.372 0.153 0.491 0.031 0.101 0.006 0.038 0.076
HYDR 0.023 0.022 0.047 0.000 0.000 0.000 0.000 0.000
125155 OTHR 0.472 -0.022 -0.065 0.001 -0.024 -0.002 -0.020 0.024
TEMP 3.393 0.481 0.012 0.006 -0.149 -0.010 0.012 -0.083
SEIS 0.722 0.105 0.419 0.020 0.033 0.008 0.044 0.047
HYDR 0.039 0.008 0.050 0.000 0.000 0.000 0.001 0.000

3-1378 Revision 0October 2015
Fermi 3Updated Final Safety Analysis Report
Table 3G.5-21 RB Upper Pools – Sectional Thicknesses and Rebar Ratios Used in the Evaluation
Note: Rebar in parentheses indicates additional bars locally required.SI to U.S. Customary units conversion (SI units are the controlling units and U.S. Customary units are for reference only):1 m = 3.28 ft
Primary Reinforcement
N - S E - W Shear Tie
Location
Element
ID
Thickness
(m) Position Arrangement Ratio
(%) Arrangement Ratio (%) Arrangement Ratio
(%)
Top 3 - #14@300 0.605 3 - #14@300 0.605 98120 2.4
Bottom 3 - #14@300 0.605 3 - #14@300 0.605 #9@600x300 0.358
Top 3 - #14@300 0.605 3 - #14@300 0.605 98135 2.4
Bottom 3 - #14@300 (+2 - #14@300) 1.008 3 - #14@300 0.605
#9@600x300 0.358
Top 3 - #14@300 0.605 3 - #14@300
(+2 - #14@300 +1 - #14@600)
1.109
15 Top slab @ Drywell Head Opening
98104 2.4
Bottom 3 - #14@300 0.605 3 - #14@300 (+2 - #14@300) 1.008
#9@600x300 0.358
Top 3 - #14@300 (+1 - #14@300) 0.806
3 - #14@300 ( +1 - #14@300 + 1 - #14@ 600)
0. 907 98149 93109 2.4
Bottom 3 - #14@300 0.605 3 - #14@300 0.605 #9 @600x600 0.179
Top 3 - #14@300 0.605 3 - #14@300 0.605
16 Top slab @ Center
98170 2.4 Bottom 3 - #14@300 0.605 3 - #14@300 0.605
#9@600x600 0.179
Top 3 - #14@300 (+1 - #14@300) 0.806
3 - #14@300 ( +1 - #14@3 00 + 1 - #14@ 600)
0. 907 98174 2.4
Bottom 3 - #14@300 0.605 3 - #14@300 0.605
#9@600x600 0.179
Top 3 - #14@300 (+1 - #14@300) 0.806
3 - #14@300 ( +1 - #14@300 + 1 - #14@ 600)
0. 907
17 Top slab @ RCCV
98197 98103 2.4
Bottom 3 - #14@300 0.605 3 - #14@300 0.605
#9@ 3 00x300 0.717

3-1379 Revision 0October 2015
Fermi 3Updated Final Safety Analysis Report
Table 3G.5-21 RB Upper Pools – Sectional Thicknesses and Rebar Ratios Used in the Evaluation (Continued)
Note: Rebar in parentheses indicates additional bars locally required.SI to U.S. Customary units conversion (SI units are the controlling units and U.S. Customary units are for reference only):1 m = 3.28 ft
Primary Reinforcement
Horizontal
Vertical
Shear Tie
Location
Element
ID
Thickness
(m) Position
Arrangement Ratio
(%) Arrangement Ratio
(%) Arrangement Ratio
(%)
Top 3 - #1 1 @ 2 00
(+2 - #11@200) 1.677 3 - #1 1 @ 2 00
(+2 - #11@200) 1.677 98472
98514
1.5
Bottom
3 - #1 1 @ 2 00
(+3 - #11@200)
2.013
3 - #1 1 @ 2 00
(+3 - #11@200)
2 .013
# 7 @ 2 00x 2 00
0. 968
Top
4 - #1 1 @ 2 00
(+2 - #11@200)
1.258
4 - #1 1 @ 2 00
(+2 - #11@200)
1.258
27 Slab
EL27.0m
@RCCV
98424 2.4 Bottom
4 - #1 1 @ 2 00
(+1 - #11@200)
1.048
4 - #1 1 @ 2 00
(+1 - #11@200)
1.048
# 7 @ 2 00x 2 00 0. 968
Inside
3 - #1 1 @ 2 00
0.944
3 - #1 1 @ 2 00
0 .944
28 Pool Girder
@ Storage Pool
123054
123154
1.6
Outside
3 - #1 1 @ 2 00
(+1 - #11@200) 1.258 3 - #1 1 @ 2 00
0.944
# 7 @ 4 00x 2 00
0. 484
Inside
3 - #1 1 @ 2 00
0.944
3 - #1 1 @ 2 00
0.944
2 9 Pool Girder
@ Well 123062
123162 1.6
Outside
3 - #1 1 @ 2 00
0.944
3 - #1 1 @ 2 00
0.944
# 7 @ 4 00x 4 00
0. 242
Inside 3 - #1 1 @ 2 00 (+1 - #11@200)
1.258 3 - #1 1 @ 2 00
(+1 - #11@200)
1.258 30 Pool Girder
@ Buffer Pool
123067
123167
1.6
Outside
3 - #1 1 @ 2 00
0.944
3 - #1 1 @ 2 00
0.944
# 7 @ 4 00x 2 00
0. 484
Inside
1 - #1 1 @ 2 00
+1 - #11@ 400
0.755
1 - #1 1 @ 2 00
+1 - #11@400
0.755
32 IC/PCCS
Pool Wall
in NS Direction
125051
125151 125055
125155
1.0
Outside
2 - #1 1 @ 2 00
1.006
2 #1 1 @ 2 00
(+1 - #11@400)
1.258
# 5 @ 4 00x 2 00
0. 250

3-1380 Revision 0October 2015
Fermi 3Updated Final Safety Analysis Report
Table 3G.5-22 RB Upper Pools - Rebar and Concrete Stresses: Selected Load Combination 6001
Note: Negative value means compression.
Note *: Top slab Direction1: N-S Direction2: E-W Slab Direction1: N-S, Direction2: E-WPool Girder Direction1: Horizontal, Direction2: VerticalIC/PCCS Pool Direction1: Horizontal, Direction2: Vertical
SI to U.S. Customary units conversion (SI units are the controlling units and U.S. Customary units are for reference only):1 MPa = 145.038 psi
In/Top Out/Bottom In/Top Out/Bottom
15 Topslab 98120 -19.8 -29.5 -13.2 -54.0 -37.8 -56.0 337.4
@ Drywell Head 98135 -18.5 -29.5 -55.3 -97.7 -22.5 -6.5 337.4
Opening 98104 -20.4 -29.5 -17.6 -18.7 -23.6 -100.4 337.4
16 Topslab 98149 -16.3 -29.5 -47.0 -81.3 -6.4 -45.2 337.4
@ Center 98170 -15.1 -29.5 -44.4 -75.9 18.1 -42.8 337.4
98109 -15.7 -29.5 -29.7 -59.6 -9.9 -68.1 337.4
17 Topslab 98174 -16.6 -29.5 -34.5 -76.8 34.5 -51.3 337.4
@ RCCV 98197 -15.4 -29.5 -52.2 -81.9 -9.3 -30.8 337.4
98103 -15.8 -29.5 -27.6 -73.5 -10.7 -60.3 337.4
27 Slab 98472 -15.5 -27.3 21.8 161.4 48.2 157.1 357.4
EL27.0m 98514 -5.8 -29.0 60.6 94.3 -11.5 10.8 369.8
@ RCCV 98424 -16.0 -26.6 -85.6 0.7 -14.8 51.8 352.0
28 Pool Girder 123054 -16.3 -27.3 2.9 198.3 12.9 249.1 357.5
@ Storage Pool 123154 -5.8 -27.3 15.4 125.7 25.1 106.2 357.5
29 Pool Girder 123062 -5.4 -25.4 -14.8 -17.4 -25.1 -12.8 343.4
@ Well 123162 -5.1 -25.4 111.4 99.3 54.1 38.5 343.4
30 Pool Girder 123067 -13.8 -26.9 110.9 4.8 111.0 -36.0 354.1
@ Buffer Pool 123167 -13.3 -26.9 139.2 7.3 143.6 -11.2 354.1
32 IC/PCCS 125051 -2.5 -25.4 74.8 59.9 92.3 78.7 343.4
Pool Wall 125151 -5.4 -25.4 90.1 74.8 91.0 75.9 343.4
in NS Direction 125055 -4.8 -25.4 -31.1 -29.4 2.8 37.2 343.4
125155 -4.4 -25.4 -29.8 -30.1 3.7 -0.1 343.4
LocationElement
ID
Concrete Stress (MPa) Primary Reinforcement Stress (MPa)
Calculated Allowable
Calculated
AllowableDirection 1* Direction 2*

3-1381 Revision 0October 2015
Fermi 3Updated Final Safety Analysis Report
Table 3G.5-23 RB Upper Pools - Rebar and Concrete Stresses: Selected Load Combination 6002
Note: Negative value means compression.
Note *: Top slab Direction1: N-S Direction2: E-W Slab Direction1: N-S, Direction2: E-WPool Girder Direction1: Horizontal, Direction2: VerticalIC/PCCS Pool Direction1: Horizontal, Direction2: Vertical
SI to U.S. Customary units conversion (SI units are the controlling units and U.S. Customary units are for reference only):1 MPa = 145.038 psi
In/Top Out/Bottom In/Top Out/Bottom
15 Topslab 98120 -23.9 -29.8 -17.2 -66.5 -47.6 -66.4 339.2
@ Drywell Head 98135 -22.6 -29.8 -74.5 -120.1 -26.0 -8.1 339.2
Opening 98104 -23.6 -29.8 -21.8 -22.3 -35.3 -117.3 339.2
16 Topslab 98149 -19.4 -29.8 -59.5 -99.4 -13.3 -55.8 339.2
@ Center 98170 -20.7 -29.8 -68.4 -107.6 114.7 -30.6 339.2
98109 -18.0 -29.8 -37.5 -69.4 -18.0 -81.4 339.2
17 Topslab 98174 -22.4 -31.0 31.0 -89.8 133.4 -34.7 346.3
@ RCCV 98197 -18.9 -32.7 113.4 -53.0 87.0 -19.7 356.9
98103 -19.2 -29.8 -31.3 -89.3 -10.7 -67.4 339.2
27 Slab 98472 -21.9 -29.3 310.4 159.4 308.3 149.1 372.2
EL27.0m 98514 -12.2 -29.3 80.7 70.9 65.7 -59.2 372.2
@ RCCV 98424 -17.9 -26.8 -101.0 -17.9 -5.5 59.9 353.6
28 Pool Girder 123054 -18.2 -27.6 -1.9 102.1 -72.9 43.3 359.4
@ Storage Pool 123154 -13.0 -27.6 -4.9 149.3 -18.1 102.0 359.4
29 Pool Girder 123062 -6.1 -25.9 -18.1 -25.7 -35.8 -25.9 346.6
@ Well 123162 -6.2 -25.9 99.1 65.4 30.1 3.8 346.6
30 Pool Girder 123067 -6.7 -29.3 92.7 134.1 57.0 84.1 372.2
@ Buffer Pool 123167 -4.5 -29.3 49.6 106.1 46.9 88.6 372.2
32 IC/PCCS 125051 -6.6 -28.9 29.0 196.9 27.7 216.8 369.3
Pool Wall 125151 -7.3 -28.9 27.5 198.2 15.0 188.1 369.3
in NS Direction 125055 -9.8 -28.1 -5.0 133.3 -4.3 146.6 362.8
125155 -8.4 -28.1 -6.1 143.5 4.0 88.3 362.8
LocationElement
ID
Concrete Stress (MPa) Primary Reinforcement Stress (MPa)
Calculated Allowable
Calculated
AllowableDirection 1* Direction 2*

3-1382 Revision 0October 2015
Fermi 3Updated Final Safety Analysis Report
Table 3G.5-24 RB Upper Pools - Rebar and Concrete Stresses: Selected Load Combination 6003
Note: Negative value means compression.
Note *: Top slab Direction1: N-S Direction2: E-W Slab Direction1: N-S, Direction2: E-WPool Girder Direction1: Horizontal, Direction2: VerticalIC/PCCS Pool Direction1: Horizontal, Direction2: Vertical
SI to U.S. Customary units conversion (SI units are the controlling units and U.S. Customary units are for reference only):1 MPa = 145.038 psi
In/Top Out/Bottom In/Top Out/Bottom
15 Topslab 98120 -21.8 -29.5 -6.7 -55.4 -48.2 -64.3 337.4
@ Drywell Head 98135 -19.3 -29.5 -61.6 -100.2 -25.4 -8.4 337.4
Opening 98104 -22.0 -29.5 -20.7 -20.2 -37.6 -111.0 337.4
16 Topslab 98149 -18.7 -29.8 -43.3 -92.0 -2.9 -54.9 339.2
@ Center 98170 -16.0 -29.8 -42.0 -78.0 3.4 -51.4 339.2
98109 -16.8 -29.5 -34.9 -63.9 -19.6 -76.0 337.4
17 Topslab 98174 -18.7 -31.0 -18.3 -87.2 126.1 -14.8 346.3
@ RCCV 98197 -16.6 -29.5 -63.3 -91.1 -11.8 -27.7 337.4
98103 -17.7 -29.5 -32.0 -82.5 -15.2 -64.5 337.4
27 Slab 98472 -17.2 -27.3 -1.2 130.2 50.6 144.6 357.4
EL27.0m 98514 -6.9 -29.3 129.1 106.8 76.6 -79.6 372.2
@ RCCV 98424 -18.5 -26.6 -102.3 -11.1 -9.1 66.8 352.0
28 Pool Girder 123054 -18.8 -27.3 6.0 125.7 -59.5 94.5 357.5
@ Storage Pool 123154 -11.3 -27.3 17.7 184.8 -14.7 132.1 357.5
29 Pool Girder 123062 -7.8 -25.6 -8.2 -7.0 -44.1 -23.4 345.0
@ Well 123162 -7.1 -25.6 111.6 118.7 28.8 37.6 345.0
30 Pool Girder 123067 -22.7 -27.8 231.7 28.9 214.2 -50.1 361.2
@ Buffer Pool 123167 -16.2 -27.8 214.4 20.5 193.9 -20.3 361.2
32 IC/PCCS 125051 -8.0 -26.5 202.4 10.3 214.7 39.7 351.5
Pool Wall 125151 -6.5 -26.5 191.8 15.1 227.2 45.2 351.5
in NS Direction 125055 -5.4 -25.6 -31.9 -36.9 2.1 24.6 345.0
125155 -6.1 -25.6 -30.7 -38.9 24.1 1.5 345.0
LocationElement
ID
Concrete Stress (MPa) Primary Reinforcement Stress (MPa)
Calculated Allowable
Calculated
AllowableDirection 1* Direction 2*
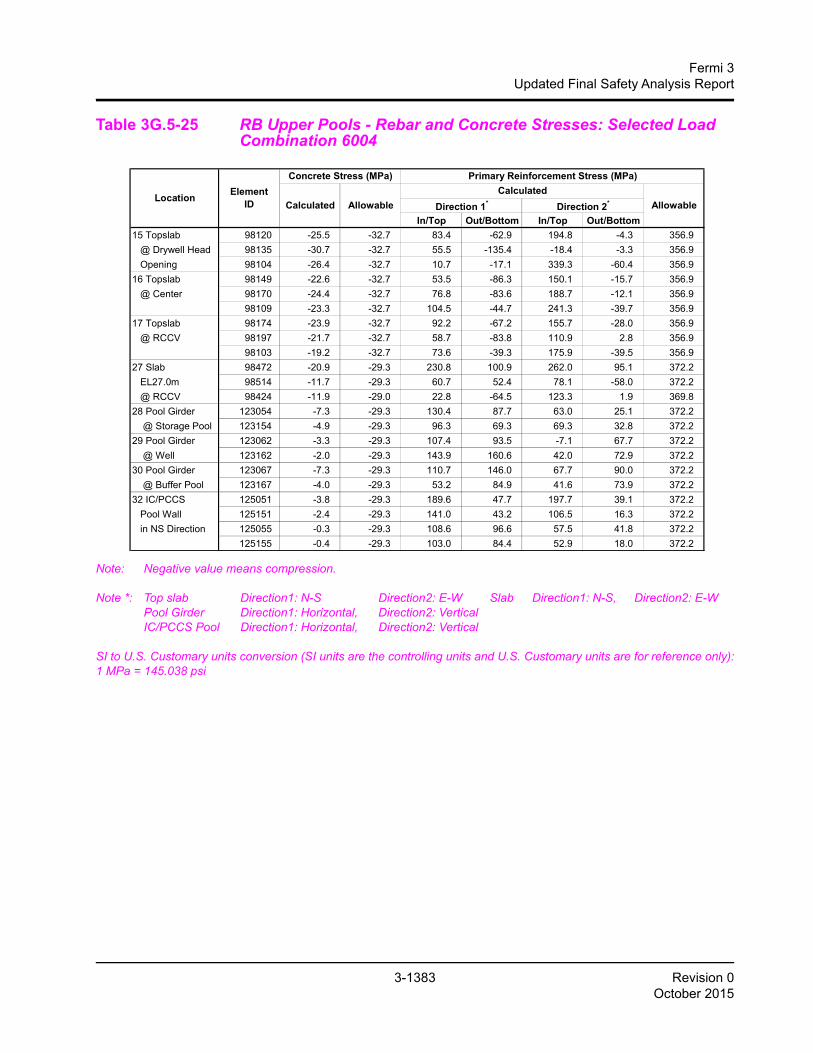
3-1383 Revision 0October 2015
Fermi 3Updated Final Safety Analysis Report
Table 3G.5-25 RB Upper Pools - Rebar and Concrete Stresses: Selected Load Combination 6004
Note: Negative value means compression.
Note *: Top slab Direction1: N-S Direction2: E-W Slab Direction1: N-S, Direction2: E-WPool Girder Direction1: Horizontal, Direction2: VerticalIC/PCCS Pool Direction1: Horizontal, Direction2: Vertical
SI to U.S. Customary units conversion (SI units are the controlling units and U.S. Customary units are for reference only):1 MPa = 145.038 psi
In/Top Out/Bottom In/Top Out/Bottom
15 Topslab 98120 -25.5 -32.7 83.4 -62.9 194.8 -4.3 356.9
@ Drywell Head 98135 -30.7 -32.7 55.5 -135.4 -18.4 -3.3 356.9
Opening 98104 -26.4 -32.7 10.7 -17.1 339.3 -60.4 356.9
16 Topslab 98149 -22.6 -32.7 53.5 -86.3 150.1 -15.7 356.9
@ Center 98170 -24.4 -32.7 76.8 -83.6 188.7 -12.1 356.9
98109 -23.3 -32.7 104.5 -44.7 241.3 -39.7 356.9
17 Topslab 98174 -23.9 -32.7 92.2 -67.2 155.7 -28.0 356.9
@ RCCV 98197 -21.7 -32.7 58.7 -83.8 110.9 2.8 356.9
98103 -19.2 -32.7 73.6 -39.3 175.9 -39.5 356.9
27 Slab 98472 -20.9 -29.3 230.8 100.9 262.0 95.1 372.2
EL27.0m 98514 -11.7 -29.3 60.7 52.4 78.1 -58.0 372.2
@ RCCV 98424 -11.9 -29.0 22.8 -64.5 123.3 1.9 369.8
28 Pool Girder 123054 -7.3 -29.3 130.4 87.7 63.0 25.1 372.2
@ Storage Pool 123154 -4.9 -29.3 96.3 69.3 69.3 32.8 372.2
29 Pool Girder 123062 -3.3 -29.3 107.4 93.5 -7.1 67.7 372.2
@ Well 123162 -2.0 -29.3 143.9 160.6 42.0 72.9 372.2
30 Pool Girder 123067 -7.3 -29.3 110.7 146.0 67.7 90.0 372.2
@ Buffer Pool 123167 -4.0 -29.3 53.2 84.9 41.6 73.9 372.2
32 IC/PCCS 125051 -3.8 -29.3 189.6 47.7 197.7 39.1 372.2
Pool Wall 125151 -2.4 -29.3 141.0 43.2 106.5 16.3 372.2
in NS Direction 125055 -0.3 -29.3 108.6 96.6 57.5 41.8 372.2
125155 -0.4 -29.3 103.0 84.4 52.9 18.0 372.2
LocationElement
ID
Concrete Stress (MPa) Primary Reinforcement Stress (MPa)
Calculated Allowable
Calculated
AllowableDirection 1* Direction 2*

3-1384 Revision 0October 2015
Fermi 3Updated Final Safety Analysis Report
Table 3G.5-26 RB Upper Pools - Rebar and Concrete Stresses: Selected Load Combination 7001
Note: Negative value means compression.
Note *: Top slab Direction1: N-S Direction2: E-W Slab Direction1: N-S, Direction2: E-WPool Girder Direction1: Horizontal, Direction2: VerticalIC/PCCS Pool Direction1: Horizontal, Direction2: Vertical
SI to U.S. Customary units conversion (SI units are the controlling units and U.S. Customary units are for reference only):1 MPa = 145.038 psi
In/Top Out/Bottom In/Top Out/Bottom
15 Topslab 98120 -20.8 -29.5 -16.1 -54.7 -39.6 -60.4 337.4
@ Drywell Head 98135 -19.0 -29.5 -57.3 -99.8 -22.9 -8.3 337.4
Opening 98104 -20.9 -29.5 -18.0 -17.5 -33.6 -104.1 337.4
16 Topslab 98149 -16.6 -29.5 -47.8 -83.3 -8.6 -49.0 337.4
@ Center 98170 -15.5 -29.5 -44.7 -76.7 -5.1 -50.7 337.4
98109 -16.3 -29.5 -33.9 -59.4 -15.5 -71.4 337.4
17 Topslab 98174 -17.2 -29.5 -36.6 -79.7 19.1 -56.0 337.4
@ RCCV 98197 -16.3 -29.5 -54.8 -83.5 -8.9 -41.7 337.4
98103 -19.4 -29.5 -30.8 -86.7 -14.8 -65.8 337.4
27 Slab 98472 -18.3 -27.3 73.0 191.6 109.5 189.6 357.4
EL27.0m 98514 -7.3 -29.0 65.9 111.0 -23.0 26.6 369.8
@ RCCV 98424 -18.4 -26.6 -87.1 56.0 -12.7 95.4 352.0
28 Pool Girder 123054 -15.9 -27.3 -8.1 162.9 -24.8 238.9 357.5
@ Storage Pool 123154 -5.1 -27.3 41.3 188.3 49.8 129.1 357.5
29 Pool Girder 123062 -5.6 -25.4 -15.0 -20.5 -27.1 -13.4 343.4
@ Well 123162 -5.3 -25.4 63.9 91.0 38.7 41.3 343.4
30 Pool Girder 123067 -16.1 -26.9 75.9 -8.3 59.0 -60.6 354.1
@ Buffer Pool 123167 -14.4 -26.9 124.0 -1.4 133.7 -22.7 354.1
32 IC/PCCS 125051 -4.4 -25.4 -9.1 -8.0 -20.1 29.0 343.4
Pool Wall 125151 -5.8 -25.4 63.4 59.9 57.0 54.6 343.4
in NS Direction 125055 -5.3 -25.4 -33.9 -30.4 4.5 45.3 343.4
125155 -5.6 -25.4 -36.8 -37.7 4.0 1.1 343.4
LocationElement
ID
Concrete Stress (MPa) Primary Reinforcement Stress (MPa)
Calculated Allowable
Calculated
AllowableDirection 1* Direction 2*

3-1385 Revision 0October 2015
Fermi 3Updated Final Safety Analysis Report
Table 3G.5-27 RB Upper Pools - Rebar and Concrete Stresses: Selected Load Combination 7002
Note: Negative value means compression.
Note *: Top slab Direction1: N-S Direction2: E-W Slab Direction1: N-S, Direction2: E-WPool Girder Direction1: Horizontal, Direction2: VerticalIC/PCCS Pool Direction1: Horizontal, Direction2: Vertical
SI to U.S. Customary units conversion (SI units are the controlling units and U.S. Customary units are for reference only):1 MPa = 145.038 psi
In/Top Out/Bottom In/Top Out/Bottom
15 Topslab 98120 -24.9 -29.8 -20.1 -67.3 -49.4 -70.7 339.2
@ Drywell Head 98135 -23.1 -29.8 -76.5 -122.2 -26.3 -9.8 339.2
Opening 98104 -24.1 -29.8 -22.2 -21.1 -45.4 -121.0 339.2
16 Topslab 98149 -19.9 -29.8 -60.2 -101.4 -15.5 -59.5 339.2
@ Center 98170 -21.2 -29.8 -68.8 -108.5 69.1 -44.8 339.2
98109 -18.6 -29.8 -41.7 -69.2 -23.6 -84.8 339.2
17 Topslab 98174 -22.7 -31.0 23.1 -93.3 100.7 -43.1 346.3
@ RCCV 98197 -19.9 -32.7 106.4 -50.8 132.6 -29.4 356.9
98103 -22.8 -29.8 -34.5 -102.5 -15.4 -72.8 339.2
27 Slab 98472 -26.0 -29.3 344.0 193.5 343.9 159.3 372.2
EL27.0m 98514 -14.7 -29.3 85.6 85.3 108.3 -75.2 372.2
@ RCCV 98424 -19.9 -26.8 -102.9 22.2 -4.7 90.4 353.6
28 Pool Girder 123054 -19.5 -27.6 -4.9 102.3 -91.2 27.8 359.4
@ Storage Pool 123154 -13.5 -27.6 -14.2 150.7 -25.7 79.1 359.4
29 Pool Girder 123062 -6.4 -25.9 -18.3 -28.8 -37.8 -26.6 346.6
@ Well 123162 -8.0 -25.9 67.0 -24.1 17.7 -27.1 346.6
30 Pool Girder 123067 -8.5 -29.3 103.4 139.4 23.2 40.3 372.2
@ Buffer Pool 123167 -5.3 -29.3 38.1 90.8 33.6 78.0 372.2
32 IC/PCCS 125051 -9.0 -28.9 40.6 214.7 38.5 255.7 369.3
Pool Wall 125151 -8.8 -28.9 33.4 213.2 22.5 207.5 369.3
in NS Direction 125055 -9.7 -28.1 12.3 172.9 6.2 172.3 362.8
125155 -8.2 -28.1 -17.6 171.7 10.0 110.7 362.8
LocationElement
ID
Concrete Stress (MPa) Primary Reinforcement Stress (MPa)
Calculated Allowable
Calculated
AllowableDirection 1* Direction 2*

3-1386 Revision 0October 2015
Fermi 3Updated Final Safety Analysis Report
Table 3G.5-28 RB Upper Pools - Rebar and Concrete Stresses: Selected Load Combination 7003
Note: Negative value means compression.
Note *: Top slab Direction1: N-S Direction2: E-W Slab Direction1: N-S, Direction2: E-WPool Girder Direction1: Horizontal, Direction2: VerticalIC/PCCS Pool Direction1: Horizontal, Direction2: Vertical
SI to U.S. Customary units conversion (SI units are the controlling units and U.S. Customary units are for reference only):1 MPa = 145.038 psi
In/Top Out/Bottom In/Top Out/Bottom
15 Topslab 98120 -22.8 -29.5 -9.6 -56.2 -50.0 -68.6 337.4
@ Drywell Head 98135 -19.9 -29.5 -63.6 -102.3 -25.7 -10.1 337.4
Opening 98104 -22.5 -29.5 -21.1 -19.0 -47.6 -114.7 337.4
16 Topslab 98149 -19.2 -29.8 -43.8 -93.9 -8.1 -59.9 339.2
@ Center 98170 -16.7 -29.8 -43.0 -79.6 -7.0 -55.4 339.2
98109 -17.4 -29.5 -39.2 -63.8 -25.2 -79.4 337.4
17 Topslab 98174 -19.4 -31.0 -18.4 -90.3 108.3 -22.4 346.3
@ RCCV 98197 -17.3 -29.5 -65.9 -92.7 -11.3 -38.6 337.4
98103 -21.3 -29.5 -35.2 -95.5 -19.9 -70.0 337.4
27 Slab 98472 -19.7 -27.3 52.3 157.0 113.4 174.1 357.4
EL27.0m 98514 -19.7 -29.3 160.4 103.1 126.5 -79.7 372.2
@ RCCV 98424 -20.6 -26.6 -104.2 33.9 -8.5 97.7 352.0
28 Pool Girder 123054 -19.0 -27.3 8.2 121.8 -80.4 75.7 357.5
@ Storage Pool 123154 -10.5 -27.3 37.9 224.4 -23.3 89.0 357.5
29 Pool Girder 123062 -8.1 -25.6 -10.8 -7.7 -45.7 -24.5 345.0
@ Well 123162 -6.9 -25.6 72.0 111.8 25.3 33.3 345.0
30 Pool Girder 123067 -25.0 -27.8 202.5 19.9 160.2 -74.1 361.2
@ Buffer Pool 123167 -15.4 -27.8 162.5 10.6 150.3 -36.9 361.2
32 IC/PCCS 125051 -6.0 -26.5 163.1 -6.0 231.1 60.2 351.5
Pool Wall 125151 -7.4 -26.5 172.3 -8.1 178.1 28.9 351.5
in NS Direction 125055 -6.1 -25.6 -33.0 -40.5 11.6 20.5 345.0
125155 -7.3 -25.6 -37.7 -46.3 18.2 1.5 345.0
LocationElement
ID
Concrete Stress (MPa) Primary Reinforcement Stress (MPa)
Calculated Allowable
Calculated
AllowableDirection 1* Direction 2*

3-1387 Revision 0October 2015
Fermi 3Updated Final Safety Analysis Report
Table 3G.5-29 RB Upper Pools - Rebar and Concrete Stresses:Selected Load Combination 7004
Note: Negative value means compression.Note *: Top slab Direction1: N-S Direction2: E-W Slab Direction1: N-S, Direction2: E-W
Pool Girder Direction1: Horizontal, Direction2: VerticalIC/PCCS Pool Direction1: Horizontal, Direction2: Vertical
SI to U.S. Customary units conversion (SI units are the controlling units and U.S. Customary units are for reference only):1 MPa = 145.038 psi
In/Top Out/Bottom In/Top Out/Bottom
15 Topslab 98120 -26.2 -32.7 86.6 -65.5 179.9 -12.6 356.9
@ Drywell Head 98135 -30.0 -32.7 85.0 -132.7 -17.3 -4.2 356.9
Opening 98104 -25.4 -32.7 -5.5 -17.7 281.7 -69.3 356.9
16 Topslab 98149 -22.1 -32.7 58.2 -85.5 130.8 -21.0 356.9
@ Center 98170 -24.8 -32.7 79.5 -83.7 177.5 -15.4 356.9
98109 -19.8 -32.7 93.5 -46.3 203.6 -49.0 356.9
17 Topslab 98174 -23.8 -32.7 91.1 -69.6 135.8 -33.8 356.9
@ RCCV 98197 -22.9 -32.7 61.1 -82.7 149.6 -12.8 356.9
98103 -24.6 -32.7 180.3 -39.4 185.6 -42.6 356.9
27 Slab 98472 -25.0 -29.3 226.1 105.6 298.0 101.4 372.2
EL27.0m 98514 -14.0 -29.3 64.6 67.6 114.8 -72.2 372.2
@ RCCV 98424 -14.8 -29.0 130.1 -69.6 224.8 34.4 369.8
28 Pool Girder 123054 -8.0 -29.3 100.1 100.3 23.4 -17.0 372.2
@ Storage Pool 123154 -5.5 -29.3 151.3 134.4 71.7 29.3 372.2
29 Pool Girder 123062 -3.4 -29.3 107.3 110.8 15.7 47.5 372.2
@ Well 123162 -1.9 -29.3 122.4 169.2 31.7 43.9 372.2
30 Pool Girder 123067 -8.9 -29.3 117.4 149.0 33.4 41.8 372.2
@ Buffer Pool 123167 -5.2 -29.3 93.9 152.1 51.4 91.2 372.2
32 IC/PCCS 125051 -6.9 -29.3 166.7 71.1 87.9 -16.9 372.2
Pool Wall 125151 -3.2 -29.3 116.4 45.1 35.4 -6.4 372.2
in NS Direction 125055 -1.2 -29.3 145.2 126.7 138.8 46.1 372.2
125155 -1.3 -29.3 135.2 118.5 95.8 39.0 372.2
LocationElement
ID
Concrete Stress (MPa) Primary Reinforcement Stress (MPa)
Calculated Allowable
Calculated
AllowableDirection 1* Direction 2*

3-1388 Revision 0October 2015
Fermi 3Updated Final Safety Analysis Report
Table 3G.5-30 RB Upper Pools - Transverse Shear; RCCV
SI to U.S. Customary units conversion (SI units are the controlling units and U.S. Customary units are for reference only):1 MPa = 145.038 psi1 MN/m = 6.852x10⁴ lbf/ft1 m = 3.28 ft
Table 3G.5-31 RB Upper Pools - Transverse Shear; RB
SI to U.S. Customary units conversion (SI units are the controlling units and U.S. Customary units are for reference only):1 MN/m = 6.852x10⁴ lbf/ft1 m = 3.28 ft
Element LOAD Shear Force d
ID ID Q (MN/m) (m) Vu Vc Vs required provided
15 Topslab 98120 6004 1.79 1.95 1.08 1.11 0.00 0.000 0.358
@ Drywell Head 98135 6004 3.10 1.94 1.88 2.87 0.00 0.000 0.358
Opening 98104 7004 0.24 1.97 0.14 0.14 0.00 0.000 0.358
16 Topslab 98149 7003 2.36 1.93 1.44 3.57 0.00 0.000 0.179
@ Center 98170 7002 1.46 1.95 0.88 2.65 0.00 0.000 0.179
98109 7004 0.67 1.97 0.40 1.22 0.00 0.000 0.179
17 Topslab 98174 7002 2.12 1.96 1.27 3.74 0.00 0.000 0.179
@ RCCV 98197 6004 1.62 1.99 0.96 1.16 0.00 0.000 0.717
98103 7004 1.05 1.93 0.64 1.24 0.00 0.000 0.717
LocationShear Stress (MN/m) Shear Tie Ratio (%)
Element Load d pv
ID ID (m) (%) Vu Vc Vs Vn
27 Slab 98472 7004 1.21 0.968 1.41 0.58 4.72 4.50 0.314
EL27.0m 98514 7004 1.21 0.968 3.50 1.95 4.72 5.67 0.617
@ RCCV 98424 7002 2.11 0.968 10.27 7.08 8.23 13.01 0.789
28 Pool Girder 123054 7001 1.25 0.484 1.20 1.41 2.50 3.32 0.362
@ Storage Pool 123154 6002 1.25 0.484 0.94 1.38 2.50 3.30 0.285
29 Pool Girder 123062 7004 1.22 0.242 0.12 0.14 1.22 1.15 0.101
@ Well 123162 6004 1.23 0.242 0.05 0.06 1.23 1.10 0.044
30 Pool Girder 123067 7002 1.24 0.484 0.10 0.12 2.49 2.21 0.046
@ Buffer Pool 123167 6001 1.27 0.484 0.21 0.25 2.55 2.38 0.089
32 IC/PCCS 125051 7004 0.81 0.250 0.12 0.14 0.84 0.83 0.139
Pool Wall 125151 6001 0.80 0.250 0.12 0.14 0.83 0.83 0.148
in NS Direction 125055 7002 0.79 0.250 0.08 0.10 0.82 0.78 0.105
125155 6004 0.83 0.250 0.05 0.06 0.86 0.78 0.061
Shear Force (MN/m)Vu/VnLocation
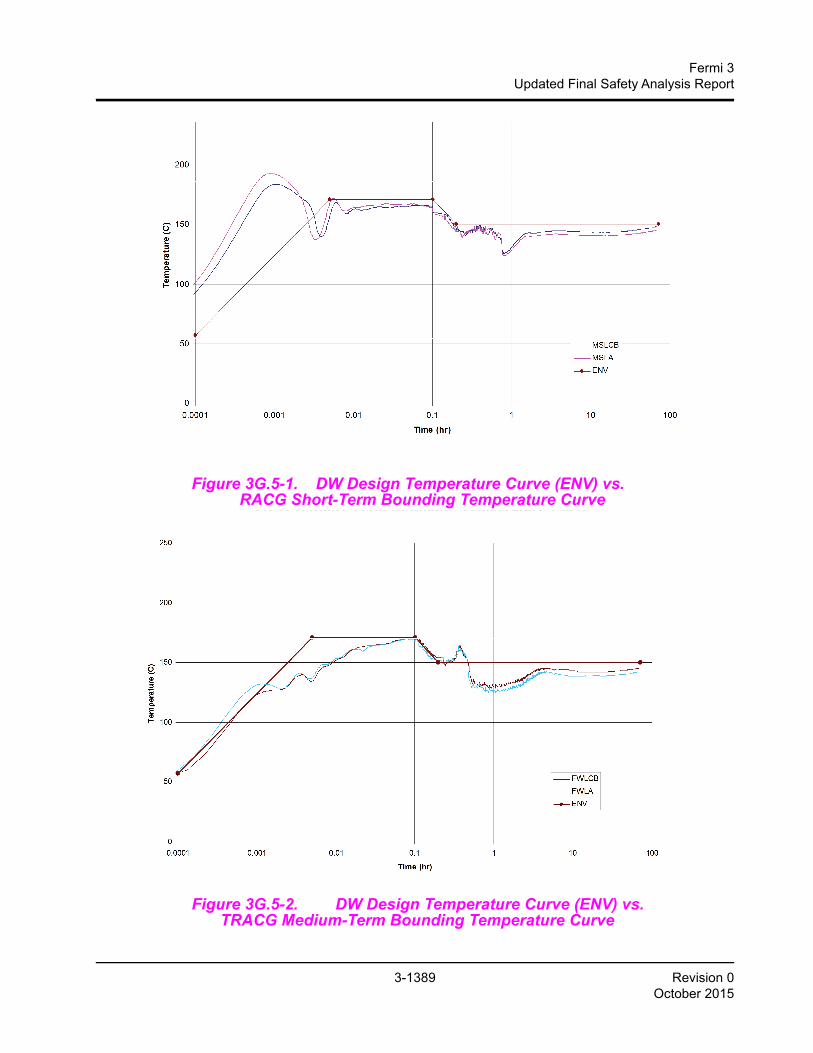
3-1389 Revision 0October 2015
Fermi 3Updated Final Safety Analysis Report
Figure 3G.5-1. DW Design Temperature Curve (ENV) vs.RACG Short-Term Bounding Temperature Curve
Figure 3G.5-2. DW Design Temperature Curve (ENV) vs.TRACG Medium-Term Bounding Temperature Curve
Figure 3G 5 1 DW Design Temperature Curve (ENV) vs
TRACG Short Term Bounding Temperature Curve

3-1390 Revision 0October 2015
Fermi 3Updated Final Safety Analysis Report
Figure 3G.5-3. DW Design Temperature Curve (ENV) vs.TRACG Long-Term Bounding Temperature Curve
Figure 3G.5-4. DW Integrated Design Temperature Curve vs.TRACG Short-Term Bounding Temperature Curve
Figure 3G.5-3. DW Design Temperature Curve (ENV) vs.
TRACG Long-Term Bounding Temperature Curve

3-1391 Revision 0October 2015
Fermi 3Updated Final Safety Analysis Report
Figure 3G.5-5. DW Integrated Design Temperature Curve vs.TRACG Medium-Term Bounding Temperature Curve
Figure 3G.5-6. DW Integrated Design Temperature Curve vs.TRACG Long-Term Bounding Temperature Curve
Figure 3G 5 5 DW Integrated Design Temperature Curve vs

3-1392 Revision 0October 2015
Fermi 3Updated Final Safety Analysis Report
Figure 3G.5-7. WW Design Temperature Curve (ENV) vs.TRACG Short-Term Bounding Temperature Curve
Figure 3G.5-8. WW Design Temperature Curve (ENV) vs.TRACG Medium-Term Bounding Temperature Curve
ESBWR Design Control Document/Tier 2
Figure 3G 5-7 WW Design Temperature Curve (ENV) vs
Figure 3G.5-7. WW Design Temperature Curve (ENV) vs. TRACG Short-Term Bounding Temperature Curve

3-1393 Revision 0October 2015
Fermi 3Updated Final Safety Analysis Report
Figure 3G.5-9. WW Design Temperature Curve (ENV) vs.TRACG Long-Term Bounding Temperature Curve
Figure 3G.5-10. WW Integrated Design Temperature Curve vs.TRACG Short-Term Bounding Temperature Curve

3-1394 Revision 0October 2015
Fermi 3Updated Final Safety Analysis Report
Figure 3G.5-11. WW Integrated Design Temperature Curve vs.TRACG Medium-Term Bounding Temperature Curve
Figure 3G.5-12. WW Integrated Design Temperature Curve vs.TRACG Long-Term Bounding Temperature Curve

3-1395 Revision 0October 2015
Fermi 3Updated Final Safety Analysis Report
Figure 3G.5-13. Temperature Distributions in RB Upper Pools
26A6642AN Rev. 10
ESBWR Design Control Document/Tier 2
Case1 Case2
Case3 Case4
Units: ºC
Figure 3G.5-13. Temperature Distributions in RB Upper Pools

3-1396 Revision 0October 2015
Fermi 3Updated Final Safety Analysis Report
Figure 3G.5-14. RB Upper Pools - Slab Sections for Heat Transfer Calculation
26A6642AN Rev. 10
ESBWR Design Control Document/Tier 2
(EL27.0m)
(EL34.0m)
Figure 3G.5-14. RB Upper Pools - Slab Sections for Heat Transfer Calculation
TS1
TS4
TS2
TS3
TS7
TS6
SL3
SL9
SL10
SL6
SL11 SL2SL1
SL5
SL13
SL12

3-1397 Revision 0October 2015
Fermi 3Updated Final Safety Analysis Report
Figure 3G.5-15. RB Upper Pools - Wall Sections for Heat Transfer Calculation
Figure 3G.5-16. Finite Element Model Around RB Upper Pools
PG1PG3PG2
PG4PG5 PG9
PG6 PG7PG8
PW6
PW7
PW8
PW9 PW11
PW12
PW13PW14
PW4 PW15
PW2PW16
PW17
GW3
GW5GW6
GW7
GW8 GW9
GW1
GW11
PW1 PW19
PW10PW18
GW10
Figure 3G.5 15. RB Upper Pools Wall Sections for Heat Transfer Calculation
Figure 3G.5-16. Finite Element Model Around RB Upper Pools

3-1398 Revision 0October 2015
Fermi 3Updated Final Safety Analysis Report
Figure 3G.5-17. RB Upper Pools - Elements Selected for Evaluation (Top Slab)
ESBWR Design Control Document/Tier 2
Figure 3G.5-17. RB Upper Pools - Elements Selected for Evaluation (Top Slab)
98120
98149
98174
98135
98104
98170
98197
9810998103
PN
R=18000
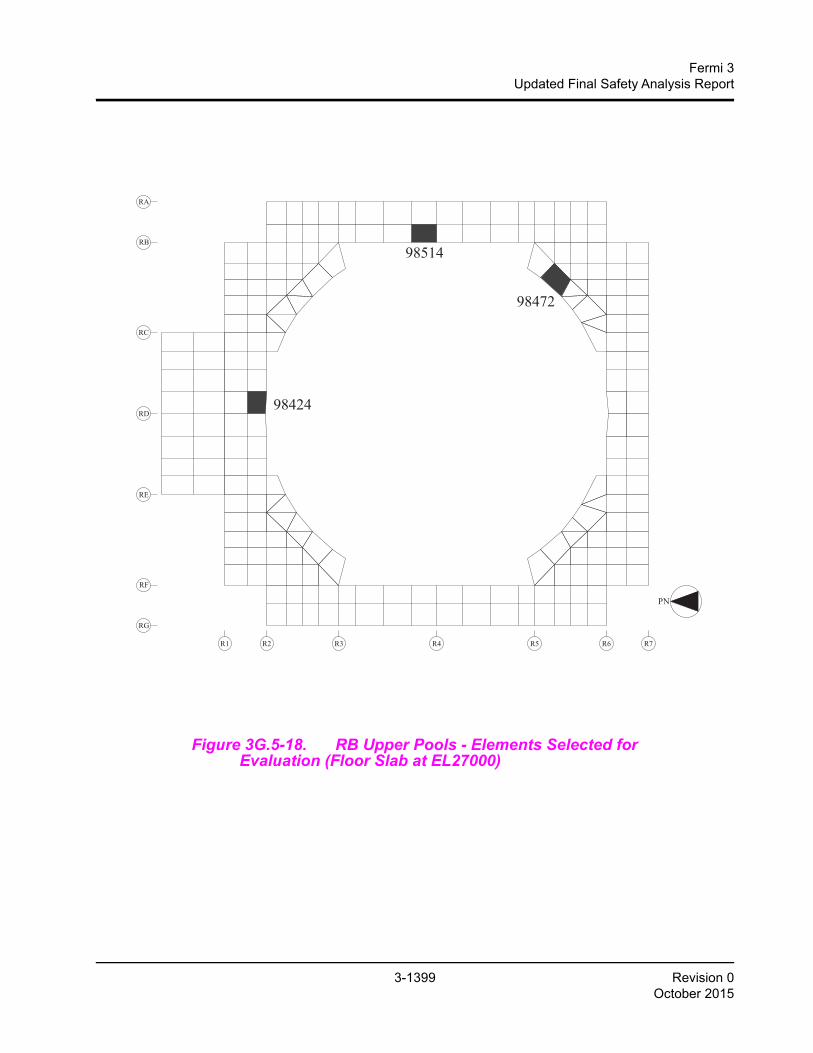
3-1399 Revision 0October 2015
Fermi 3Updated Final Safety Analysis Report
Figure 3G.5-18. RB Upper Pools - Elements Selected for Evaluation (Floor Slab at EL27000)
26A6642AN Rev. 10
ESBWR Design Control Document/Tier 2
Figure 3G.5-18. RB Upper Pools - Elements Selected for Evaluation (Floor Slab at EL27000)
98472
98514
98424
R1 R2 R3 R4 R5 R6 R7
RG
RF
RE
RD
RC
RB
RA
PN

3-1400 Revision 0October 2015
Fermi 3Updated Final Safety Analysis Report
Figure 3G.5-19. RB Upper Pools - Elements Selected for Evaluation (Pool Girder)
Figure 3G.5-20. RB Upper Pools - Elements Selected for Evaluation (IC/PCCS Pool Wall in NS Direction)
ESBWR Design Control Document/Tier 2
123054
123154
123062
123162
123067
123167
R1 R2 R3 R4 R5 R6 R7
EL 34000
EL 27000
East Side Girder
125151
R3 R4 R5
EL 34000
EL 27000
East Side Wall
125051
125155
125055

3-1401 Revision 0October 2015
Fermi 3Updated Final Safety Analysis Report
3G.6 CRITICAL DIMENSIONS AND TOLERANCES
The critical dimensions and acceptable tolerances are provided in Tables 3G.6-1, 3G.6-2 and
3G.6-3 for the RB, CB and FB, respectively. The locations labeled in these tables are illustrated in
Figures 3G.6-1 through 3G.6-11 for the RB, 3G.6-12 through 3G.6-16 for the CB and 3G.6-17
through 3G.6-22 for the FB.

Fermi 3 3-1402 Revision 0Updated Final Safety Analysis Report October 2015
Table 3G.6-1 Critical Dimensions of Reactor Building – Part 1
Label Wall or Section DescriptionColumn Line or
Region
Floor Elevation orElevation Range
(EL: mm)
Concrete Thickness*
mm(ft-in)
Tolerance*mm(in)
Concrete Containment
101RPV Pedestal Cylinder Not Applicable
From -10400 to 46502500
(8'-2⅜")+60,-0
(+2⅜",-0")
102RCCV Cylinder Not Applicable
From 4650 to 246002000
(6'-6¾")+60,-0
(+2⅜",-0")
103Containment Basemat Below RPV Pedestal Cylinder
-104005100
(16'-8¾")+50,-20(+2",-¾")
104Suppression Pool Slab Between RPV Pedestal Cylinder
and RCCV Cylinder4650
2000(6'-6¾")
+60,-0(+2⅜",-0")
105Top Slab From DW Head to RCCV Cylinder
270002400
(7'-10½")+60,-0
(+2⅜",-0")
Outside Concrete Containment
1Wall at Column Line R1 From RA to RG
From -11500 to 36502000
(6'-6¾")+25,-20(+1",-¾")
2Wall at Column Line R7 From RA to RG
From -11500 to 36502000
(6'-6¾")+25,-20(+1",-¾")
3Wall at Column Line RA From R1 to R7
From -11500 to 36502000
(6'-6¾")+25,-20(+1",-¾")
4Wall at Column Line RG From R1 to R7
From -11500 to 36502000
(6'-6¾")+25,-20(+1",-¾")
5Wall between Column Lines R1 and R2 From between RA and RB to RC
From -11500 to -74001000
(3'-3⅜")+25,-20(+1",-¾")
6Wall between Column Lines R1 and R2 From RE to between RF and RG
From -11500 to -74001000
(3'-3⅜")+25,-20(+1",-¾")
7Wall between Column Lines RA and RB From between R1 and R2 to R3
From -11500 to -74001000
(3'-3⅜")+25,-20(+1",-¾")

Fermi 3 3-1403 Revision 0Updated Final Safety Analysis Report October 2015
8Wall between Column Lines RF and RG From between R1 and R2 to R3
From -11500 to -74001000
(3'-3⅜")+25,-20(+1",-¾")
9Cylinder below RCCV Not Applicable
From -11500 to 26502000
(6'-6¾")+60,-0
(+2⅜",-0")
10
Cylinder between RPV Pedestal and Cylinder below RCCV Northeast QuadrantFrom -11500 to -1700 1400
(4'-7⅛")Minimum
11Cylinder between RPV Pedestal and Cylinder below RCCV Northwest Quadrant
From -11500 to -17001400
(4'-7⅛")Minimum
12Cylinder between RPV Pedestal and Cylinder below RCCV Southwest Quadrant
From -11500 to -1700600
(1'-11⅝")Minimum
13Cylinder between RPV Pedestal and Cylinder below RCCV Southeast Quadrant
From -11500 to -7400600
(1'-11⅝")Minimum
14Cylinder between RPV Pedestal and Cylinder below RCCV Southeast Quadrant
From -6400 to -19001350
(4'-5⅛")Minimum
15Wall at Column Line R1 From RA to RG
From 4650 to 165001500
(4'-11")+25,-20(+1",-¾")
16Wall at Column Line R7 From RA to RG
From 4650 to 165001500
(4'-11")+25,-20(+1",-¾")
17Wall at Column Line RA From R1 to R7
From 4650 to 255001500
(4'-11")+25,-20(+1",-¾")
18Wall at Column Line RG From R1 to R7
From 4650 to 255001500
(4'-11")+25,-20(+1",-¾")
19Wall at Column Line R1 From RA to RC
From 17500 to 255001500
(4'-11")+25,-20(+1",-¾")
20Wall at Column Line R1 From RE to RG
From 17500 to 255001500
(4'-11")+25,-20(+1",-¾")
21Wall at Column Line R7 From RA to RC
From 17500 to 255001500
(4'-11")+25,-20(+1",-¾")
Table 3G.6-1 Critical Dimensions of Reactor Building – Part 1
Label Wall or Section DescriptionColumn Line or
Region
Floor Elevation orElevation Range
(EL: mm)
Concrete Thickness*
mm(ft-in)
Tolerance*mm(in)

Fermi 3 3-1404 Revision 0Updated Final Safety Analysis Report October 2015
22Wall at Column Line R7 From between RD and RE to RG
From 17500 to 255001500
(4'-11")+25,-20(+1",-¾")
23Main Steam Tunnel Wall East side
From 17500 to 246001300
(4'-3⅛")+25,-20(+1",-¾")
24Main Steam Tunnel Wall West side
From 17500 to 246001300
(4'-3⅛")+25,-20(+1",-¾")
25Wall at Column Line R1 From RA to RB
From 27000 to 330001000
(3'-3⅜")+25,-20(+1",-¾")
26Wall at Column Line R1 From RB to RC
From 27000 to 330001500
(4'-11")+25,-20(+1",-¾")
27Wall at Column Line R1 From RC to RE
From 27000 to 340003500
(11'-5¾") +25,-20(+1",-¾")
28Wall at Column Line R1 From RE to RF
From 27000 to 330001500
(4'-11")+25,-20(+1",-¾")
29Wall at Column Line R1 From RF to RG
From 27000 to 330001000
(3'-3⅜")+25,-20(+1",-¾")
30Wall at Column Line R2 From RA to RC
From 27000 to 330001000
(3'-3⅜")+25,-20(+1",-¾")
31Wall at Column Line R2 From RE to RG
From 27000 to 330001000
(3'-3⅜")+25,-20(+1",-¾")
32Wall at Column Line R6 From RA to RC
From 27000 to 330001000
(3'-3⅜")+25,-20(+1",-¾")
33Wall at Column Line R6 From RE to RG
From 27000 to 330001000
(3'-3⅜")+25,-20(+1",-¾")
34Wall at Column Line R7 From RA to RB
From 27000 to 330001000
(3'-3⅜")+25,-20(+1",-¾")
35Wall at Column Line R7 From RB to between RC and RD
From 27000 to 330001500
(4'-11")+25,-20(+1",-¾")
36Wall at Column Line R7 From between RC and RD to RE
From 27000 to 340002440(8'-0")
+25,-20(+1",-¾")
Table 3G.6-1 Critical Dimensions of Reactor Building – Part 1
Label Wall or Section DescriptionColumn Line or
Region
Floor Elevation orElevation Range
(EL: mm)
Concrete Thickness*
mm(ft-in)
Tolerance*mm(in)

Fermi 3 3-1405 Revision 0Updated Final Safety Analysis Report October 2015
37Wall at Column Line R7 From RE to RF
From 27000 to 330001500
(4'-11")+25,-20(+1",-¾")
38Wall at Column Line R7 From RF to RG
From 27000 to 330001000
(3'-3⅜")+25,-20(+1",-¾")
39Wall at Column Line RA From R1 to R7
From 27000 to 330001000
(3'-3⅜")+25,-20(+1",-¾")
40Wall at Column Line RB From R1 to R7
From 27000 to 330002000
(6'-6¾")+25,-20(+1",-¾")
41Wall between Column Lines RB and RC From R6 to R7
From 27000 to 330001000
(3'-3⅜")+25,-20(+1",-¾")
42Wall at Column Line RC (Pool Girder) From R1 to R7
From 27000 to 330001600(5'-3")
+25,-20(+1",-¾")
43Wall at Column Line RE (Pool Girder) From R1 to R7
From 27000 to 330001600(5'-3")
+25,-20(+1",-¾")
44Wall between Column Lines RE and RF From R6 to R7
From 27000 to 330001000
(3'-3⅜")+25,-20(+1",-¾")
45Wall at Column Line RF From R1 to R7
From 27000 to 330002000
(6'-6¾")+25,-20(+1",-¾")
46Wall at Column Line RG From R1 to R7
From 27000 to 330001000
(3'-3⅜")+25,-20(+1",-¾")
47Reactor Cavity Wall (Northeast side) From RC to between RC and RD
From 27000 to 340001600(5'-3")
+25,-20(+1",-¾")
48Reactor Cavity Wall (Northwest side) From between RD and RE to RE
From 27000 to 340001600(5'-3")
+25,-20(+1",-¾")
49Reactor Cavity Wall (Southeast side) From RC to between RC and RD
From 27000 to 340001600(5'-3")
+25,-20(+1",-¾")
50 Not used
51IC/PCCS Pool Wall between Column Lines R2 and R3 From between RB and RC to RC
From 27000 to 330001000
(3'-3⅜")+25,-20(+1",-¾")
Table 3G.6-1 Critical Dimensions of Reactor Building – Part 1
Label Wall or Section DescriptionColumn Line or
Region
Floor Elevation orElevation Range
(EL: mm)
Concrete Thickness*
mm(ft-in)
Tolerance*mm(in)
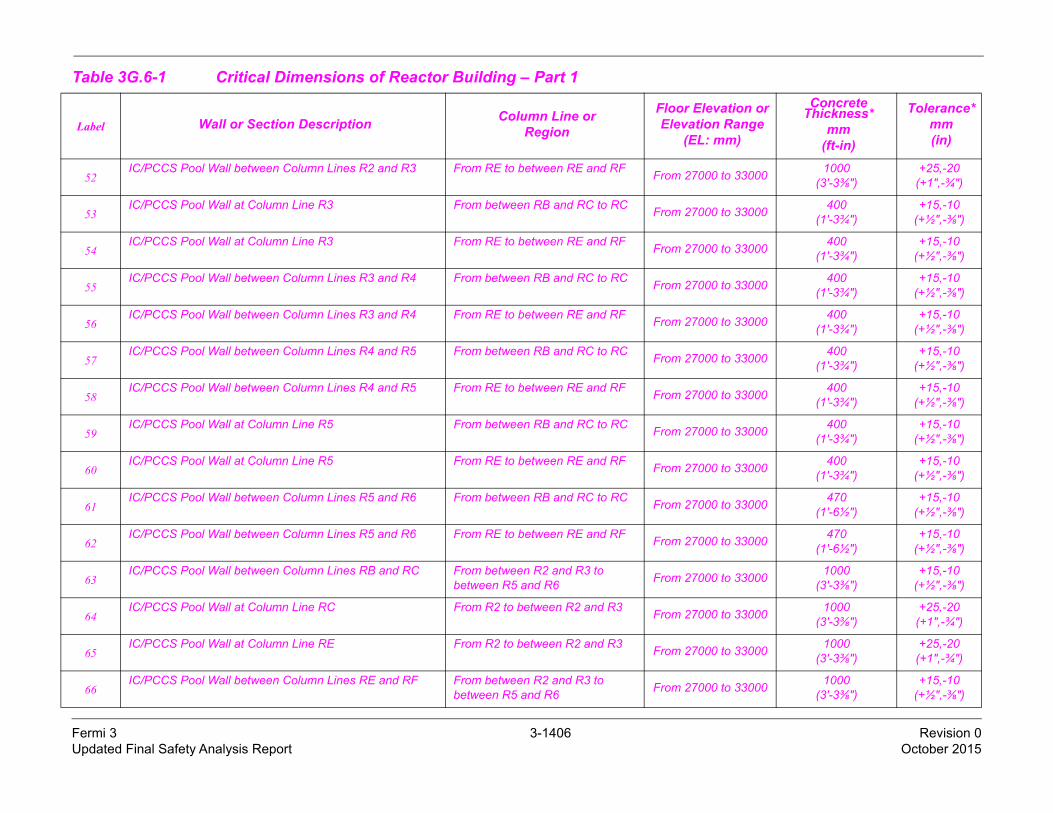
Fermi 3 3-1406 Revision 0Updated Final Safety Analysis Report October 2015
52IC/PCCS Pool Wall between Column Lines R2 and R3 From RE to between RE and RF
From 27000 to 330001000
(3'-3⅜")+25,-20(+1",-¾")
53IC/PCCS Pool Wall at Column Line R3 From between RB and RC to RC
From 27000 to 33000400
(1'-3¾")+15,-10
(+½",-⅜")
54IC/PCCS Pool Wall at Column Line R3 From RE to between RE and RF
From 27000 to 33000400
(1'-3¾")+15,-10
(+½",-⅜")
55IC/PCCS Pool Wall between Column Lines R3 and R4 From between RB and RC to RC
From 27000 to 33000400
(1'-3¾")+15,-10
(+½",-⅜")
56IC/PCCS Pool Wall between Column Lines R3 and R4 From RE to between RE and RF
From 27000 to 33000400
(1'-3¾")+15,-10
(+½",-⅜")
57IC/PCCS Pool Wall between Column Lines R4 and R5 From between RB and RC to RC
From 27000 to 33000400
(1'-3¾")+15,-10
(+½",-⅜")
58IC/PCCS Pool Wall between Column Lines R4 and R5 From RE to between RE and RF
From 27000 to 33000400
(1'-3¾")+15,-10
(+½",-⅜")
59IC/PCCS Pool Wall at Column Line R5 From between RB and RC to RC
From 27000 to 33000400
(1'-3¾")+15,-10
(+½",-⅜")
60IC/PCCS Pool Wall at Column Line R5 From RE to between RE and RF
From 27000 to 33000400
(1'-3¾")+15,-10
(+½",-⅜")
61IC/PCCS Pool Wall between Column Lines R5 and R6 From between RB and RC to RC
From 27000 to 33000470
(1'-6½")+15,-10
(+½",-⅜")
62IC/PCCS Pool Wall between Column Lines R5 and R6 From RE to between RE and RF
From 27000 to 33000470
(1'-6½")+15,-10
(+½",-⅜")
63IC/PCCS Pool Wall between Column Lines RB and RC From between R2 and R3 to
between R5 and R6From 27000 to 33000
1000(3'-3⅜")
+15,-10(+½",-⅜")
64IC/PCCS Pool Wall at Column Line RC From R2 to between R2 and R3
From 27000 to 330001000
(3'-3⅜")+25,-20(+1",-¾")
65IC/PCCS Pool Wall at Column Line RE From R2 to between R2 and R3
From 27000 to 330001000
(3'-3⅜")+25,-20(+1",-¾")
66IC/PCCS Pool Wall between Column Lines RE and RF From between R2 and R3 to
between R5 and R6From 27000 to 33000
1000(3'-3⅜")
+15,-10(+½",-⅜")
Table 3G.6-1 Critical Dimensions of Reactor Building – Part 1
Label Wall or Section DescriptionColumn Line or
Region
Floor Elevation orElevation Range
(EL: mm)
Concrete Thickness*
mm(ft-in)
Tolerance*mm(in)

Fermi 3 3-1407 Revision 0Updated Final Safety Analysis Report October 2015
67Wall at Column Line R1 From RB to RF
From 34000 to 520001000
(3'-3⅜")+25,-20(+1",-¾")
68Wall at Column Line R7 From RB to RF
From 34000 to 520001000
(3'-3⅜")+25,-20(+1",-¾")
69Wall at Column Line RB From R1 to R7
From 34000 to 520001000
(3'-3⅜")+25,-20(+1",-¾")
70Wall at Column Line RF From R1 to R7
From 34000 to 520001000
(3'-3⅜")+25,-20(+1",-¾")
71Basemat excluding Containment Basemat From R1 to R7 and RA and RG
-115004000
(13'-1½")+50,-20(+2",-¾")
72Floor inside Cylinder below RCCV Northeast Quadrant
-6400600
(1'-11⅝")+15,-10
(+½",-⅜")
73Floor inside Cylinder below RCCV Northwest Quadrant
-6400600
(1'-11⅝")+15,-10
(+½",-⅜")
74Floor inside Cylinder below RCCV Southeast Quadrant
-64001000
(3'-3⅜")+25,-20(+1",-¾")
75Floor inside Cylinder below RCCV Southwest Quadrant
-6400600
(1'-11⅝")+15,-10
(+½",-⅜")
76Floor outside Cylinder below RCCV From R1 to R7 and RA and RG
-64001000
(3'-3⅜")+25,-20(+1",-¾")
77Floor inside Cylinder below RCCV Northeast Quadrant
-1000700
(2'-3⅝")+15,-10
(+½",-⅜")
78Floor inside Cylinder below RCCV Northwest Quadrant
-1000700
(2'-3⅝")+15,-10
(+½",-⅜")
79Floor inside Cylinder below RCCV Southeast Quadrant
-1000900
(2'-11½")+15,-10
(+½",-⅜")
80Floor inside Cylinder below RCCV Southwest Quadrant
-1000700
(2'-3⅝")+15,-10
(+½",-⅜")
81Floor outside Cylinder below RCCV From R1 to R7 and RA to RG
-10001000
(3'-3⅜")+25,-20(+1",-¾")
Table 3G.6-1 Critical Dimensions of Reactor Building – Part 1
Label Wall or Section DescriptionColumn Line or
Region
Floor Elevation orElevation Range
(EL: mm)
Concrete Thickness*
mm(ft-in)
Tolerance*mm(in)

Fermi 3 3-1408 Revision 0Updated Final Safety Analysis Report October 2015
* SI units are the controlling units and English units are for reference only.
82Floor From R1 to R7 and RA to RG
46501000
(3'-3⅜")+25,-20(+1",-¾")
83Floor From R1 to R7 and RA to RG
90601000
(3'-3⅜")+25,-20(+1",-¾")
84Floor From R1 to R7 and RA to RG
135701000
(3'-3⅜")+25,-20(+1",-¾")
85Main Steam Tunnel Floor From RC to RE
175001600(5'-3")
+25,-20(+1",-¾")
86Floor excluding Main Steam Tunnel Floor From R1 to R7 and RA to RG
175001000
(3'-3⅜")+25,-20(+1",-¾")
87Main Steam Tunnel Roof From RC to RE
270002400
(7'-10½")+25,-20(+1",-¾")
88Floor From R1 to R7 and RA to RC
270001500
(4'-11")+25,-20(+1",-¾")
89Floor From R1 to R7 and RE to RG
270001500
(4'-11")+25,-20(+1",-¾")
90Floor From R1 to R7 and RA to RC
340001000
(3'-3⅜")+25,-20(+1",-¾")
91Floor From R1 to R7 and RE to RG
340001000
(3'-3⅜")+25,-20(+1",-¾")
92Roof From R1 to R7 and RB to RF
52700700
(2'-3⅝")+15,-10
(+½",-⅜")
Table 3G.6-1 Critical Dimensions of Reactor Building – Part 1
Label Wall or Section DescriptionColumn Line or
Region
Floor Elevation orElevation Range
(EL: mm)
Concrete Thickness*
mm(ft-in)
Tolerance*mm(in)

Fermi 3 3-1409 Revision 0Updated Final Safety Analysis Report October 2015
* SI units are the controlling units and English units are for reference only.
Table 3G.6-1 Critical Dimensions of Reactor Building – Part 2
Key Dimension Reference DimensionNominal Dimension*
mm(ft-in)
Tolerance*mm(in)
Distance from RPV Centreline to Outside Surface of Wall at Column Line RA when Measured at Column Line R1
X1 (Figure 3G.6-1)24500
(80'-4½")±300(±12")
Distance from RPV Centreline to Outside Surface of Wall at Column Line RG when Measured at Column Line R1
X2 (Figure 3G.6-1)24500
(80'-4½")±300(±12")
Distance from RPV Centreline to Outside Surface of Wall at Column Line R1 when Measured at Column Line RA
X3 (Figure 3G.6-1)24500
(80'-4½")±300(±12")
Distance from RPV Centreline to Outside Surface of Wall at Column Line R7 when Measured at Column Line RA
X4 (Figure 3G.6-1)24500
(80'-4½")±300(±12")
Distance from Top of Basemat Outside Containment to Design Plant Grade
X5 (Figure 3G.6-10.)16150
(52'-11⅞")±300(±12")
Distance from Design Plant Grade to Top Surface of RoofX6 (Figure 3G.6-10.)
48050(157'-7¾")
±300(±12")

Fermi 3 3-1410 Revision 0Updated Final Safety Analysis Report October 2015
* SI units are the controlling units and English units are for reference only.
Table 3G.6-2 Critical Dimensions of Control Building – Part 1
Label Wall or Section DescriptionColumn Line or
Region
Floor Elevation orElevation Range
(EL: mm)
Concrete Thickness*mm
(ft-in)
Tolerance*mm(in)
1Wall at Column Line C1 From CA to CD From -7400 to 8560 900
(2'-11½")+15,-10
(+½",-⅜")
2Wall at Column Line C5 From CA to CD From -7400 to 8560 900
(2'-11½")+15,-10
(+½",-⅜")
3Wall at Column Line CA From C1 to C5 From -7400 to 8560 900
(2'-11½")+15,-10
(+½",-⅜")
4Wall at Column Line CD From C1 to C5 From -7400 to 8560 900
(2'-11½")+15,-10
(+½",-⅜")
5Wall at Column Line C3 From CA to CB From -7400 to -2500 1000
(3'-3⅜")+25,-20(+1",-¾")
6Wall at Column Line C3 From CC to CD From -7400 to -2500 1000
(3'-3⅜")+25,-20(+1",-¾")
7Wall at Column Line C1 From CA to CD From 9060 to 13100 700
(2'-3⅝")+15,-10
(+½",-⅜")
8Wall at Column Line C5 From CA to CD From 9060 to 13100 700
(2'-3⅝")+15,-10
(+½",-⅜")
9Wall at Column Line CA From C1 to C5 From 9060 to 13100 700
(2'-3⅝")+15,-10
(+½",-⅜")
10Wall at Column Line CD From C1 to C5 From 9060 to 13100 700
(2'-3⅝")+15,-10
(+½",-⅜")
11Basemat From C1 to C5 and CA to CD -7400 3000
(9'-10")+50,-20(+2",-¾")
12Floor From C1 to C5 and CA to CD -2000 500
(1'-7¾")+15,-10
(+½",-⅜")
13Floor From C1 to C5 and CA to CD 4650 500
(1'-7¾")+15,-10
(+½",-⅜")
14Floor From C1 to C5 and CA to CD 9060 500
(1'-7¾")+15,-10
(+½",-⅜")
15Roof From C1 to C5 and CA to CD 13800 700
(2'-3⅝")+15,-10
(+½",-⅜")

Fermi 3 3-1411 Revision 0Updated Final Safety Analysis Report October 2015
* SI units are the controlling units and English units are for reference only.
Table 3G.6-2 Critical Dimensions of Control Building – Part 2
Key Dimension Reference DimensionNominal Dimension*
mm(ft-in)
Tolerance*mm(in)
Distance from Outside Surface of Wall at Column Line CA to Column Line CB when Measured at Column Line C1
X1 (Figure 3G.6-12)10400
(34'-1⅜")±300(±12")
Distance from Outside Surface of Wall at Column Line CD to Column Line CB when Measured at Column Line C1
X2 (Figure 3G.6-12)13400
(43'-11½")±300(±12")
Distance from Outside Surface of Wall at Column Line C1 to Column Line C3 when Measured at Column Line CA
X3 (Figure 3G.6-12)15150
(49'-8½")±300(±12")
Distance from Outside Surface of Wall at Column Line C5 to Column Line C3 when Measured at Column Line CA
X4 (Figure 3G.6-12)15150
(49'-8½")±300(±12")
Distance from Top of Basemat to Design Plant GradeX5 (Figure 3G.6-16)
12050(39'-6½")
±300(±12")
Distance from Design Plant Grade to Top Surface of RoofX6 (Figure 3G.6-16)
9150(30'-0¼")
±300(±12")
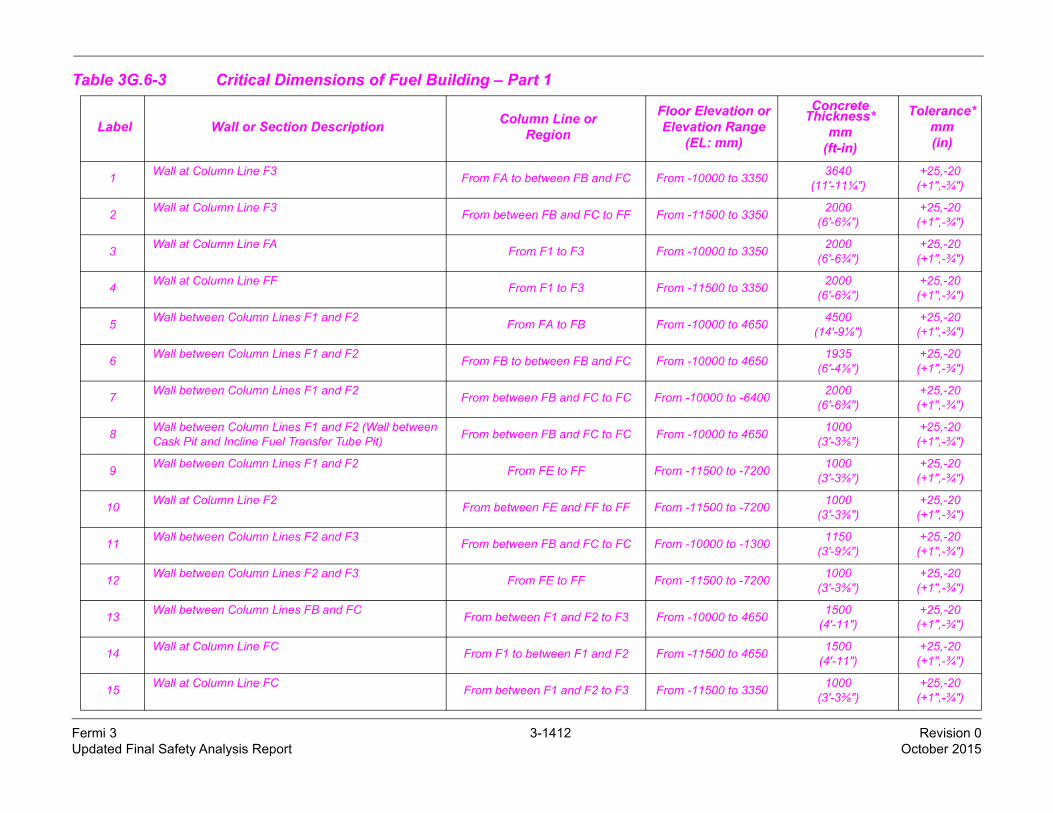
Fermi 3 3-1412 Revision 0Updated Final Safety Analysis Report October 2015
Table 3G.6-3 Critical Dimensions of Fuel Building – Part 1
Label Wall or Section DescriptionColumn Line or
Region
Floor Elevation orElevation Range
(EL: mm)
Concrete Thickness*
mm(ft-in)
Tolerance*mm(in)
1Wall at Column Line F3
From FA to between FB and FC From -10000 to 33503640
(11'-11¼")+25,-20(+1",-¾")
2Wall at Column Line F3
From between FB and FC to FF From -11500 to 33502000
(6'-6¾")+25,-20(+1",-¾")
3Wall at Column Line FA
From F1 to F3 From -10000 to 33502000
(6'-6¾")+25,-20(+1",-¾")
4Wall at Column Line FF
From F1 to F3 From -11500 to 33502000
(6'-6¾")+25,-20(+1",-¾")
5Wall between Column Lines F1 and F2
From FA to FB From -10000 to 46504500
(14'-9⅛")+25,-20(+1",-¾")
6Wall between Column Lines F1 and F2
From FB to between FB and FC From -10000 to 46501935
(6'-4⅛")+25,-20(+1",-¾")
7Wall between Column Lines F1 and F2
From between FB and FC to FC From -10000 to -64002000
(6'-6¾")+25,-20(+1",-¾")
8Wall between Column Lines F1 and F2 (Wall between Cask Pit and Incline Fuel Transfer Tube Pit)
From between FB and FC to FC From -10000 to 46501000
(3'-3⅜")+25,-20(+1",-¾")
9Wall between Column Lines F1 and F2
From FE to FF From -11500 to -72001000
(3'-3⅜")+25,-20(+1",-¾")
10Wall at Column Line F2
From between FE and FF to FF From -11500 to -72001000
(3'-3⅜")+25,-20(+1",-¾")
11Wall between Column Lines F2 and F3
From between FB and FC to FC From -10000 to -13001150
(3'-9¼")+25,-20(+1",-¾")
12Wall between Column Lines F2 and F3
From FE to FF From -11500 to -72001000
(3'-3⅜")+25,-20(+1",-¾")
13Wall between Column Lines FB and FC
From between F1 and F2 to F3 From -10000 to 46501500
(4'-11")+25,-20(+1",-¾")
14Wall at Column Line FC
From F1 to between F1 and F2 From -11500 to 46501500
(4'-11")+25,-20(+1",-¾")
15Wall at Column Line FC
From between F1 and F2 to F3 From -11500 to 33501000
(3'-3⅜")+25,-20(+1",-¾")

Fermi 3 3-1413 Revision 0Updated Final Safety Analysis Report October 2015
* SI units are the controlling units and English units are for reference only.
16Wall at Column Line FE From between F1 and F2 to F2
and F3From -11500 to -7200
1000(3'-3⅜")
+25,-20(+1",-¾")
17Wall at Column Line FE
From between F2 and F3 to F3 From -11500 to -7200600
(1'-11⅝")+15,-10
(+½",-⅜")
18Wall between Column Lines FB and FC
From F1 to F1 and F2 From -6400 to 46502000
(6'-6¾")+25,-20(+1",-¾")
19Wall between Column Lines F2 and F3
From between FB and FC to FC From -1300 to 33501000
(3'-3⅜")+25,-20(+1",-¾")
20Wall at Column Line F3
From FA to FF From 4650 to 218001000
(3'-3⅜")+25,-20(+1",-¾")
21Wall at Column Line FA
From F1 to F3 From 4650 to 218001000
(3'-3⅜")+25,-20(+1",-¾")
22Wall at Column Line FF
From F1 to F3 From 4650 to 218001000
(3'-3⅜")+25,-20(+1",-¾")
23Basemat of Spent Fuel Pool, Cask Pit, and Incline Fuel Transfer Tube Pit
Not Applicable -100005500
(18'-0½")+50,-20(+2",-¾")
24Basemat excluding Spent Fuel Pool, Cask Pit, and Incline Fuel Transfer Tube Pit
Not Applicable -115004000
(13'-1½")+50,-20(+2",-¾")
25Floor
From F1 to F3 and FC to FF -6400800
(2'-7½")+15,-10
(+½",-⅜")
26Floor
From F1 to F3 and FC to FF -1000800
(2'-7½")+15,-10
(+½",-⅜")
27Floor (Cask Pit)
Not Applicable -13001150
(3'-9¼")+25,-20(+1",-¾")
28Floor
From F1 to F3 and FC to FF 46501300
(4'-3⅛")+25,-20(+1",-¾")
29Roof
From F1 to F3 and FA to FF 22500700
(2'-3⅝")+15,-10
(+½",-⅜")
Table 3G.6-3 Critical Dimensions of Fuel Building – Part 1
Label Wall or Section DescriptionColumn Line or
Region
Floor Elevation orElevation Range
(EL: mm)
Concrete Thickness*
mm(ft-in)
Tolerance*mm(in)

Fermi 3 3-1414 Revision 0Updated Final Safety Analysis Report October 2015
* SI units are the controlling units and English units are for reference only.
Table 3G.6-3 Critical Dimensions of Fuel Building – Part 2
Key Dimension Reference DimensionNominal Dimension*
mm(ft-in)
Tolerance*mm(in)
Distance from Outside Surface of Wall at Column Line FA to Column Line FC when Measured at Column Line F1
X1 (Figure 3G.6-17)21700
(71'-2⅜")+300,-200(+12",-7⅞")
Distance from Outside Surface of Wall at Column Line FF to Column Line FC when Measured at Column Line F1
X2 (Figure 3G.6-17)27300
(89'-6¾")±300(±12")
Distance between Outside Surface of Walls at Column Lines R7 and F3 when Measured at Column Line FA
X3 (Figure 3G.6-17)21000
(68'-10¾")+300,-200(+12",-7⅞")
Distance from Top of Basemat to Design Plant Grade (Basemat excluding Spent Fuel Pool, Cask Pit, and Incline Fuel Transfer Tube Pit)
X4 (Figure 3G.6-22)16150
(52'-11⅞")±300(±12")
Distance from Design Plant Grade to Top Surface of Roof (Excluding C-II Portion)
X5 (Figure 3G.6-22)17850
(58'-6¾")±300(±12")

Fermi 3 3-1415 Revision 0Updated Final Safety Analysis Report October 2015
Figure 3G.6-1. RB Concrete Outline Plan at EL –11500{{{Security-Related Information - Withhold Under 10 CFR 2.390}}}

Fermi 3 3-1416 Revision 0Updated Final Safety Analysis Report October 2015
Figure 3G.6-2. RB Concrete Outline Plan at EL –6400{{{Security-Related Information - Withhold Under 10 CFR 2.390}}}

Fermi 3 3-1417 Revision 0Updated Final Safety Analysis Report October 2015
Figure 3G.6-3. RB Concrete Outline Plan at EL –1000{{{Security-Related Information - Withhold Under 10 CFR 2.390}}}
Fermi 3 3-1418 Revision 0Updated Final Safety Analysis Report October 2015
Figure 3G.6-4. RB Concrete Outline Plan at EL 4650{{{Security-Related Information - Withhold Under 10 CFR 2.390}}}

Fermi 3 3-1419 Revision 0Updated Final Safety Analysis Report October 2015
Figure 3G.6-5. RB Concrete Outline Plan at EL 9060{{{Security-Related Information - Withhold Under 10 CFR 2.390}}}

Fermi 3 3-1420 Revision 0Updated Final Safety Analysis Report October 2015
Figure 3G.6-6. RB Concrete Outline Plan at EL 13570{{{Security-Related Information - Withhold Under 10 CFR 2.390}}}

Fermi 3 3-1421 Revision 0Updated Final Safety Analysis Report October 2015
Figure 3G.6-7. RB Concrete Outline Plan at EL 17500{{{Security-Related Information - Withhold Under 10 CFR 2.390}}}

Fermi 3 3-1422 Revision 0Updated Final Safety Analysis Report October 2015
Figure 3G.6-8. RB Concrete Outline Plan at EL 27000{{{Security-Related Information - Withhold Under 10 CFR 2.390}}}

Fermi 3 3-1423 Revision 0Updated Final Safety Analysis Report October 2015
Figure 3G.6-9. RB Concrete Outline Plan at EL 34000{{{Security-Related Information - Withhold Under 10 CFR 2.390}}}

Fermi 3 3-1424 Revision 0Updated Final Safety Analysis Report October 2015
Figure 3G.6-10. RB Concrete Outline N-S Section{{{Security-Related Information - Withhold Under 10 CFR 2.390}}}

Fermi 3 3-1425 Revision 0Updated Final Safety Analysis Report October 2015
Figure 3G.6-11. RB Concrete Outline E-W Section{{{Security-Related Information - Withhold Under 10 CFR 2.390}}}

Fermi 3 3-1426 Revision 0Updated Final Safety Analysis Report October 2015
Figure 3G.6-12. CB Concrete Outline Plan at EL –7400{{{Security-Related Information - Withhold Under 10 CFR 2.390}}}

Fermi 3 3-1427 Revision 0Updated Final Safety Analysis Report October 2015
Figure 3G.6-13. CB Concrete Outline Plan at EL –2000{{{Security-Related Information - Withhold Under 10 CFR 2.390}}}

Fermi 3 3-1428 Revision 0Updated Final Safety Analysis Report October 2015
Figure 3G.6-14. CB Concrete Outline Plan at EL 4650{{{Security-Related Information - Withhold Under 10 CFR 2.390}}}
Fermi 3 3-1429 Revision 0Updated Final Safety Analysis Report October 2015
Figure 3G.6-15. CB Concrete Outline Plan at EL 9060{{{Security-Related Information - Withhold Under 10 CFR 2.390}}}

Fermi 3 3-1430 Revision 0Updated Final Safety Analysis Report October 2015
Figure 3G.6-16. CB Concrete Outline E-W Section{{{Security-Related Information - Withhold Under 10 CFR 2.390}}}

Fermi 3 3-1431 Revision 0Updated Final Safety Analysis Report October 2015
Figure 3G.6-17. FB Concrete Outline Plan at EL –11500{{{Security-Related Information - Withhold Under 10 CFR 2.390}}}

Fermi 3 3-1432 Revision 0Updated Final Safety Analysis Report October 2015
Figure 3G.6-18. FB Concrete Outline Plan at EL –6400{{{Security-Related Information - Withhold Under 10 CFR 2.390}}}

Fermi 3 3-1433 Revision 0Updated Final Safety Analysis Report October 2015
Figure 3G.6-19. FB Concrete Outline Plan at EL –1000{{{Security-Related Information - Withhold Under 10 CFR 2.390}}}

Fermi 3 3-1434 Revision 0Updated Final Safety Analysis Report October 2015
Figure 3G.6-20. FB Concrete Outline Plan at EL 4650{{{Security-Related Information - Withhold Under 10 CFR 2.390}}}

Fermi 3 3-1435 Revision 0Updated Final Safety Analysis Report October 2015
Figure 3G.6-21. FB Concrete Outline Plan at EL 22500{{{Security-Related Information - Withhold Under 10 CFR 2.390}}}

Fermi 3 3-1436 Revision 0Updated Final Safety Analysis Report October 2015
Figure 3G.6-22. FB Concrete Outline N-S Section{{{Security-Related Information - Withhold Under 10 CFR 2.390}}}
3-1437 Revision 0October 2015
Fermi 3Updated Final Safety Analysis Report
Appendix 3H EQUIPMENT QUALIFICATION DESIGN ENVIRONMENTAL CONDITIONS
3H.1 INTRODUCTION
This appendix specifies plant environmental conditions, which envelop the actual environment
expected over the plant life, for which safety-related equipment (Section 3.11) is designed and
qualified. The plant conditions considered in defining the environmental conditions are normal
operation including anticipated operational occurrences, and accident conditions including
post-accident operations. The accident condition considered is a hypothesized single event (not
reasonably expected during the course of plant operation) that has the potential to cause severe
environmental conditions for safety-related equipment. The specified accident conditions are based
on significantly conservative assumptions.
The primary environmental parameters addressed are pressure, temperature, relative humidity,
radiation, and chemical conditions. Safety-related equipment inside containment is designed and
qualified for the environmental conditions resulting from the most limiting Design Basis Accident
(DBA) and meets the Environmental Qualification (EQ) program acceptance criteria. The
parameters specified in this appendix do not include margins that may be required to satisfy
applicable codes and standards for equipment qualification. The radiation data specified in this
appendix is intended to provide a conservative basis for equipment qualification and is not intended
to limit or justify personnel access.
The following areas containing safety-related equipment are considered for equipment qualification
purposes:
• Containment Vessel
• Reactor Building (RB)
• Control Building (CB)
3H.2 PLANT ZONES
3H.2.1 Containment Vessel
The containment vessel is divided into a drywell region and a wetwell region with an interconnecting
vent system. The containment vessel is shown in Figure 6.2-1a. The drywell volume is divided into
an upper drywell and lower drywell by the Reactor Pressure Vessel (RPV) supports and support
pedestal. The upper and lower drywell is interconnected. Table 3.2-1 identifies the safety-related
equipment located within the containment vessel.
For normal operating conditions, the containment vessel is divided into three thermodynamic and
four radiation zones to represent the enveloping levels of the environmental conditions. The
environmental zones are shown in Table 3H-2 and Table 3H-5.
3-1438 Revision 0October 2015
Fermi 3Updated Final Safety Analysis Report
3H.2.2 Outside Containment Vessel
The area outside the containment vessel includes:
• Control Building
• Reactor Building outside containment
The region inside the RB surrounding the containment encloses penetrations through the
containment. The Control Room Habitability Area (CRHA) includes the main control room and
areas adjacent to the control room containing operator facilities. Also located in the CB are
safety-related Distributed Control and Information System (DCIS) rooms, located at elevation
-7400 mm. Major equipment zones are shown on the RB arrangement drawing (Figures 1.2-1 to
1.2-9).
3H.3 ENVIRONMENTAL CONDITIONS
Table 3H-1 contains a cross listing of the environmental data tables arranged by location and by
type of condition.
3H.3.1 Plant Normal Operating Conditions
Tables 3H-2 through 3H-4 define the thermodynamic conditions (pressure, temperature and
humidity) for normal operating conditions for areas containing safety-related equipment. Figures
showing equipment location and system configurations are referenced in each table. Section 12.3
defines the radiation conditions for the Reactor Building and Control Building for normal operating
conditions. Table 3H-5 specifies the radiation environmental conditions inside the containment
vessel for normal operating conditions. Specific radiation environment conditions for equipment are
determined through the equipment qualification program based on actual location. Section 9.4
defines the Fuel Building thermodynamic conditions for normal operating conditions.
3H.3.2 Accident Conditions
Thermodynamic conditions for safety-related equipment in the containment vessel, CB and RB are
presented in Tables 3H-8 through 3H-10 for accident conditions. Heat loads for the evaluated post
accident periods are specified in Table 3H-12. In general, the most severe environmental conditions
resu l t f rom a pos tu la ted reac to r coo lan t l i ne b reak ins ide the con ta inment ,
Loss-Of-Coolant-Accident (LOCA) (bounding case) plus Loss Of Offsite Power (LOOP), see
Chapter 6 for detailed information. However, accident conditions were also considered for ruptures
occurring in the steam tunnel and breaks in the RWCU/SDC System outside the containment, High
Energy Line Break (HELB) plus LOOP, see Chapter 6 for detailed information. Tables 3H-6 and
3H-7 list typical radiation environmental qualification conditions inside the RB and the CB.
Table 3H-11 specifies the radiation environment conditions inside the containment vessel. The EQ
program confirms explicit radiation and thermodynamic conditions during accidents. The limiting
thermodynamic conditions in the Fuel Building results from the boiling of the spent fuel pool. The

3-1439 Revision 0October 2015
Fermi 3Updated Final Safety Analysis Report
thermodynamic conditions during an accident when the spent fuel pool boils is a limiting
temperature of 104°C (219°F), with 100% relative humidity and a limiting pressure consistent with
the full tornado pressure drop described in Subsection 3.3.2.2.
3H.3.2.1 Transient Room Temperature Analysis
The performance evaluation for environmental qualification show conformance to the requirements
identified in Section 3.11. The maximum temperature Control Building and Reactor Building
Environmental Temperature Analysis for ESBWR is presented in Reference 3H.4-8 and is
summarized below. Reference 3H.4-8 is designated as Tier 2*. Prior NRC approval is required to
change Tier 2* information. The Control Room Habitability Area Minimum Temperature Analysis
and high humidity analysis is also summarized below.
Acceptance Criteria
The design meets the following Acceptance Criteria:
• Environmental Qualification Maximum Temperatures – The maximum temperature limit for
which the safety-related equipment is qualified is not exceeded. The maximum temperature limit
is specified in Tables 3H-9 and 3H-10.
• Control Room Habitability Area Temperature – The maximum bulk average temperature
meets the acceptance criteria stated in Section 6.4. The minimum bulk average air temperature
remains at or above 13ºC (55ºF) for 72 hours after an accident.
Analysis Assumptions
The analysis event assumptions are summarized below. Initial conditions and assumptions can be
found in Table 3H-14. Heat loads used in the analysis are found in Table 3H-12.
• The event presented is the most limiting between LOCA or HELB with each concurrent with
LOOP.
• Normal Heating, Ventilation and Air Conditioning (HVAC) heating and/or cooling is lost for the
first 72 hours of the accident.
• After 72 hours the safety-related equipment heat loads are no longer accounted for because the
safety-related equipment needed to maintain safe shutdown no longer requires power to
perform their safety-related functions. Normal HVAC mitigates the safety-related equipment heat
loads when power is available.
• During the first 2 hours of the event the nonsafety-related heat loads in the RB and in the CB
outside of the CRHA powered by the nonsafety-related batteries are considered in the analysis.
• Safety-related heat loads are considered throughout the duration of the event when power is
available.
3-1440 Revision 0October 2015
Fermi 3Updated Final Safety Analysis Report
• The CRHA calculation considers safety-related heat loads and additional heat loads for some
nonsafety-related equipment. Select nonsafety-related equipment deenergizes if active cooling
is not available.
• Room to room interactions are considered in all calculations.
• Outside air intake from the emergency filter unit (EFU) is considered for the CRHA calculation
during maximum and minimum temperature conditions.
Analysis Results
As shown in Table 3H-15, the environmental qualification temperatures for safety-related
equipment is not exceeded during the limiting event based on the detailed Control Building and
Reactor Building Environmental Temperature Analysis for ESBWR performed with CONTAIN 2.0.
The CRHA minimum bulk average air temperature acceptance criteria is met based on the detailed
Control Room Habitability Area Minimum Temperature Analysis performed, which is benchmarked
against the Control Building CONTAIN maximum temperature analysis in Reference 3H.4-8. The
CRHA Wet Bulb Globe Temperature (WBGT) index acceptance criteria are met. When rooms are
located on the same level and have similar dimensions and internal heat loads, the most
unfavorable room is taken to be the representative room for that group of rooms. Solar heat loads
were applied to rooms located above grade. Table 3H-15 summarizes the representative room
temperatures and locations of the room groups.
During the transient event concurrent with LOOP and loss of normal HVAC the heat generated in
the rooms is absorbed by the surrounding walls, floor and ceiling. The building concrete acts as a
heat sink for passive heat removal. The room temperature rises quickly because the heat
absorption capacity of air is very low. The heat transfer to the walls, floor and ceiling maintain the
environmental temperatures below the qualification temperature.
During wintertime conditions the RB and CB are isolated and equipment room cool down is
insignificant. The case for the CRHA post 72 hours presented in Table 3H-15 which
accounts for heat loads from people and minimal lighting only, demonstrates that the cool
down for the RB and CB are inconsequential. The injection of ambient air at wintertime
conditions when safety-related heat loads are not present provides a faster cool down rate
than the other rooms located in the RB and CB. See Subsection 3H.3.2.1.1 for
env i ronmenta l cond i t i ons used fo r max imum tempera tu re ana lys is , see
Subsection 3H.3.2.1.2 for environmental conditions used for minimum temperature analysis
and see Subsection 3H.3.2.1.3 for environmental conditions used for high humidity analysis.
The temperature in the CRHA remains below the temperature acceptance criteria outlined in
Section 6.4. The temperature and humidity profiles for the 0% exceedance coincident maximum
temperature case are presented in Figures 3H-2 and 3H-3 respectively. Cases were considered to
ensure that the 0% exceedance maximum outside air temperature was bounding and 100% relative

3-1441 Revision 0October 2015
Fermi 3Updated Final Safety Analysis Report
humidity with additional moisture created by CRHA occupants (latent load) would not lead to a 72
hour CRHA air temperature higher than the 0% exceedance coincident maximum temperature
case, and ensure the heat absorbed by the CRHA structures would not be adversely impacted by
the condensation created. The results of this analysis show that higher humidity ratios, and
subsequently higher specific enthalpy, do not affect the maximum temperature reached with little
condensation occurring on the walls of the control room. The concrete heat sink provides enough
thermal mass to keep the CRHA within limits during the limiting event by absorbing heat loads or
heating ambient air during summer or winter conditions.
3H.3.2.1.1 Maximum Temperature Analysis Conditions
For the summer conditions the 0% exceedance maximum dry bulb and coincident wet bulb
ambient outside air temperature [47.2°C (117°F) DBt and 26.7°C (80°F) WBt] was considered. The
Daily Temperature Range applied for this analysis is Δ 15°C (27°F).
The Daily Temperature Range for summer conditions is defined as the dry bulb temperature
difference between the 0% exceedance maximum dry bulb temperature and the dry bulb
temperature that corresponds to the higher of the two lows occurring within 24 hours before
and after that maximum.
The Maximum Average Dry Bulb Temperature for the 0% Exceedance Maximum
Temperature Day is defined as the average of the 0% exceedance maximum dry bulb
temperature of 47.2ºC (117°F) and the dry bulb temperature resulting from a daily
temperature range of 15ºC (27°F), which is 39.7ºC (103.5°F).
3H.3.2.1.2 Minimum Temperature Analysis Conditions
For the winter conditions the Control Room Habitability Area Minimum Temperature Analysis
considers the 0% exceedance minimum dry bulb ambient outside air temperature (-40°C/°F). The
Daily Temperature Range applied for this analysis is Δ 15°C (27°F).
The Daily Temperature Range for winter conditions is defined as the dry bulb temperature
difference between the 0% exceedance minimum dry bulb temperature and the dry bulb
temperature that corresponds to the lower of the two highs occurring within 24 hours before
and after that minimum.
The Minimum Average Dry Bulb Temperature for 0% Exceedance Minimum Temperature
Day is the average of the 0% exceedance minimum dry bulb temperature of –40ºC (-40°F)
and the dry bulb temperature resulting from a daily temperature range of 15ºC (27°F), which
is -32.5ºC (–26.5°F).

3-1442 Revision 0October 2015
Fermi 3Updated Final Safety Analysis Report
3H.3.2.1.3 High Humidity Analysis Conditions
For high humidity conditions the 0% exceedance non-coincident maximum wet bulb temperature
[31.1ºC (88ºF) WBt] and High Humidity Diurnal Swing [Δ 4.4ºC (8ºF) DBt] are applied to the
methodology for the analysis presented in Reference 3H.4-8.
The High Humidity Diurnal Swing is defined as the dry bulb temperature range determined
by the maximum and the minimum wet bulb temperatures for the worst three-day period
over which the 0% exceedance wet bulb temperature occurs. The maximum wet bulb
temperature (31.1ºC/88ºF) has a coincident dry bulb temperature of (33.3ºC/92ºF). These
temperatures define the maximum dry bulb and wet bulb temperatures for three days in the
analysis. The minimum dry bulb temperature is defined as the coincident dry bulb
temperature (28.9ºC/84ºF) for the highest of six low wet bulb temperatures (27.2ºC/81ºF)
occurring in each of the three 24-hour periods before and after the 0% coincident maximum
wet bulb temperature. The High Humidity Diurnal Swing is the difference between the
coincident maximum dry bulb temperature (33.3ºC/92ºF) and the highest daily low dry bulb
temperature (28.9ºC/84ºF).
The overnight low wet bulb temperature in the high humidity CONTAIN analysis is 28.9ºC (84ºF),
which is conservative relative to the 27.2ºC (81ºF) wet bulb temperature in the High Humidity
Diurnal Swing.
The WBGT index value is determined by the dry bulb temperature multiplied by 0.3 plus the
wet bulb temperature multiplied by 0.7.
The Maximum High Humidity Average Wet Bulb Globe Temperature Index for 0%
Exceedance Maximum Wet Bulb Temperature Day is defined as the average of the WBGT
index values for the temperatures used to determine the High Humidity Diurnal Swing. The
WBGT index value for the maximum dry bulb 33.3ºC (92ºF) and wet bulb 31.1ºC (88ºF)
temperatures is 31.8ºC (89.2ºF). The WBGT index value for the minimum dry bulb 28.9ºC
(84ºF) and wet bulb 28.9ºC (84ºF) temperatures is 28.9ºC (84ºF). The average of the WBGT
index values is then 30.3ºC (86.6ºF).
3H.3.3 Water Quality
Reactor water design quality characteristics during normal operation are:
• pH range: 5.6 to 8.6
• Silica (as SiO2) ≤ 200 ppb (100 ppb operating target)
• Conductivity at 25°C (77ºF) 0.1µS/cm (0.08 µS/cm operating target)
• Dissolved Oxygen (as O2) 300 ppb
• Corrosion product metals 6 ppb

3-1443 Revision 0October 2015
Fermi 3Updated Final Safety Analysis Report
The Standby Liquid Control (SLC) System injects borated water into the RPV during DBA LOCA.
Although there is no caustic spray in the ESBWR design, the post-accident suppression pool pH
can vary due to the production of cesium-hydroxide and radiation-induced acids, as described in
detail in Subsection 15.4.4.
3H.3.4 Locations of Safety-Related Equipment
Table 3H-12 identifies the potential location for safety-related equipment assumed for each room or
set of rooms and the evaluated heat load capacity. This table also contains the evaluated heat load
for nonsafety-related rooms, because nonsafety-related equipment is conservatively assumed to
continue to be powered by nonsafety-related batteries during the first 2 hours of LOOP and thus
contributes to the room heat up during LOOP and a DBA. The EQ program confirms equipment
locations and heat loads do not cause temperatures to exceed the specified acceptance criteria.
3H.3.5 Mild Environment Conditions
The environment parameter limits that constitute mild environment conditions are identified in
Table 3H-13.
3H.3.6 Combined License (COL) Information
None.
3H.4 REFERENCES
3H.4-1 10 CFR 50 Appendix J, “Primary Reactor Containment Leakage Testing for Water-Cooled Power Reactors.”
3H.4-2 NUREG-1465, “Accident Source Terms for Light-Water Nuclear Power Plants,” February 1995.
3H.4-3 Not used.
3H.4-4 10 CFR Part 50, Appendix A, General Design Criterion 2, "Design Bases for Protection Against Natural Phenomena.”
3H.4-5 10 CFR Part 50, Appendix A, General Design Criterion 4, "Environmental and Dynamic Effects Design Bases.”
3H.4-6 10 CFR Part 50, 50.49, "Environmental Qualification of Electric Equipment Important to Safety of Nuclear Power Plants.”
3H.4-7 Regulatory Guide 1.209, “Guidelines for Environmental Qualification of Safety-Related Computer-Based Instrumentation and Control Systems in Nuclear Power Plants.”
3H.4-8 GE-Hitachi Nuclear Energy, “Control Building and Reactor Building Environmental Temperature Analysis for ESBWR,” NEDE-33536P, Class III (Proprietary), Revision 1, October 2010, NEDO-33536, Class I (Non-proprietary), Revision 1, October 2010.

3-1444 Revision 0October 2015
Fermi 3Updated Final Safety Analysis Report
Table 3H-1 Cross Reference of Plant Environmental Data and Location
Plant Environmental DataLocation
Containment Vessel Reactor Building Control Building
Thermodynamic (Normal Conditions)
Table 3H-2 Table 3H-3 Table 3H-4
Thermodynamic (Accident Conditions)
Table 3H-8 Table 3H-9 Table 3H-10
Radiation
Table 3H-5(Normal Conditions)
Table 3H-11(Accident Conditions)
Table 3H-6 Table 3H-7
Room Heat Loads Table 3H-12 Table 3H-12 Table 3H-12
Thermodynamic/Radiation (Mild Environment Limits)
Table 3H-13 Table 3H-13 Table 3H-13
Thermodynamic Analytical Initial Conditions and Assumptions
Chapter 6 Table 3H-14 Table 3H-14
Thermodynamic Analysis Results Chapter 6 Table 3H-15 Table 3H-15

3-1445 Revision 0October 2015
Fermi 3Updated Final Safety Analysis Report
(1) The containment atmosphere is nitrogen.(2) The containment vessel is pressurized during leak rate tests once per refueling outage in accordance with
10 CFR 50, Appendix J.(3) The worst combination of conditions in the table sets the design requirements of equipment.(4) The suppression pool water may reach 46°C (115°F) during testing. The maximum abnormal temperature is
49°C (120°F).
Table 3H-2 Thermodynamic Environment Conditions Inside Containment Vessel for Normal Operating Conditions
Plant Zone/Typical Equipment(1) Pressure(2)(3)
kPaG (psig)Temperature(3)
°C (°F)
Relative Humidity(3)
%
Upper drywell and upper area of lower drywell (Figure 6.2-1a)
9.0 (1.3)57 (135) Ave65 (150) Max
Not Controlled
Lower area of lower drywell(Figure 6.2-1a) 9.0 (1.3)
57 (135) Ave60 (140) Max
Not Controlled
Wetwell - pool and gas space (Figure 6.2-1a)
5.3 (0.76) Nom9.0 (1.3) Max
0 (0) Min43 (110) Max(4) 100

3-1446 Revision 0October 2015
Fermi 3Updated Final Safety Analysis Report
Table 3H-3 Thermodynamic Environment Conditions Inside Reactor Building for Normal Operating Conditions
Plant Zone/Typical Equipment Pressure(1) Temperature°C (°F)
RelativeHumidity
Hydraulic Control Unit (HCU) RoomsHCU, Reactor Protection System (RPS) solenoids and RPV water level instrument racksRoom Nos 1110, 1120, 1130, 1140(Figure 1.2-1)
NegativePressure
29 (85) Max18 (65) Min
Not controlled
Battery Rooms Div 1, 2, 3 and 4 batteriesRoom Nos 1210, 1220, 1230, 1240(Figure 1.2-2)
NegativePressure
29 (85) Max 18 (65) Min
Not controlled
Div 1, 2, 3 and 4 commodity chasesElectrical cablesRoom Nos 1211, 1221, 1231, 1241(Figure 1.2-2)
PositivePressure
40 (104) Max10 (50) Min
Not controlled
Electrical Division RoomsDiv 1, 2, 3 and 4 electrical and electronic equipmentRoom Nos 1311, 1321, 1331, 1341(Figure 1.2-3)
PositivePressure
29 (85) Max18 (65) Min
Not controlled
Lower drywell non-divisional electrical and mechanical penetration Outboard containment isolation valvesRoom Nos 1300, 1301, 1302, 1303(Figure 1.2-3)
PositivePressure
40 (104) Max10 (50) Min
Not controlled
Div 1, 2, 3 and 4 electrical penetration rooms Electrical cables and penetrations Room Nos 1312, 1322, 1332, 1342(Figure 1.2-3)
PositivePressure
40 (104) Max10 (50) Min
Not controlled
Remote shutdown panelRoom Nos 1313, 1323 (inside rooms 1311 and 1321)(Figure 1.2-3)
PositivePressure
29 (85) Max18 (65) Min
Not controlled
Non-divisional electrical equipmentSafety-related DCIS panelsRoom Nos 1500, 1501, 1502, 1503(Figure 1.2-5)
PositivePressure
29 (85) Max18 (65) Min
Not controlled
Div 1, 2, 3 and 4 electrical penetrationsElectrical cables and penetration Room Nos 1610, 1620, 1630, 1640(Figure 1.2-6)
NegativePressure
40 (104) Max10 (50) Min
Not controlled
Div 1, 2, 3 and 4 corridors rooms (access to penetration area), divisional electrical cables and safety-related DCIS Remote Multiplexing Units (RMUs)Room Nos 1710, 1720, 1730, 1740(Figure 1.2-7)
NegativePressure
29 (85) Max18 (65) Min
Not controlled

3-1447 Revision 0October 2015
Fermi 3Updated Final Safety Analysis Report
(1) Relative to surrounding areas.
Div 1, 2, 3 and 4 electrical penetration and Mechanical penetrationsElectrical cables and penetrations. Outboard isolation valvesRoom Nos 1711, 1721, 1731, 1741 and 1712, 1722, 1732, 1742(Figure 1.2-7)
NegativePressure
40 (104) Max10 (50) Min
Not controlled
SLC tank roomsSLC tank instrumentationRoom Nos 1713, 1723(Figure 1.2-7)
Negative Pressure
29 (85) Max18 (65) Min
Not controlled
Main Steam TunnelMain Steamline (MSL) isolation valvesMSL drain isolation valvesFeedwater (FW) isolation valvesRoom No 1770(Figure 1.2-7)
NegativePressure
40 (104) Max10 (50) Min
Not controlled
IC/PCCS pools Isolation Condenser System (ICS) pools instrumentationRoom Nos 18P3A/B/C/D, 18P4A/B/C/D/E/F, 18P5A/B/C, 18P6A/B/C(Figure 1.2-8)
NegativePressure
40 (104) Max10 (50) Min
100/Water
Table 3H-3 Thermodynamic Environment Conditions Inside Reactor Building for Normal Operating Conditions
Plant Zone/Typical Equipment Pressure(1) Temperature°C (°F)
RelativeHumidity

3-1448 Revision 0October 2015
Fermi 3Updated Final Safety Analysis Report
(1) Relative to surrounding areas.
Table 3H-4 Thermodynamic Environment Conditions Inside Control Building for Normal Operating Conditions
Plant Zone/Typical Equipment Pressure(1) Temperature°C (°F)
Relative Humidity
%
Safety-related portions of CRHA Ventilation Subsystem Room Nos 3406, 3407(Figure 1.2-5)
Positive Pressure40 (104)Max10 (50) Min
60 Max25 Min
Electrical chasesRoom Nos 3250, 3261(Figures 1.2-2 to 1.2-5)
Positive Pressure25.6 (78) Max18.3 (65) Min
60 Max25 Min
Control Room Habitability AreaMain control room panels(Outlined area on Figure 3H-1)
Positive Pressure23.3 (74) Max21.1 (70) Min
60 Max25 Min
Div 1, 2, 3 and 4 electrical roomsSafety-related DCIS panelsRoom Nos 3110, 3120, 3130 and 3140(Figure 1.2-2)
Positive Pressure25.6 (78) Max18.3 (65) Min
60 Max25 Min

3-1449 Revision 0October 2015
Fermi 3Updated Final Safety Analysis Report
Table 3H-5 Radiation Environment Conditions Inside Containment Vessel for Normal Operating Conditions
Plant Zone/Typical Equipment
Operating Dose Rate(1)(2) Integrated Dose(2)(3)
Gamma(R/h)
Beta(4)
(R/h)
Gamma(R)
Beta(4)
(R)
Upper drywell (Figure 6.2-1a) 2.61 E+1 Negl. 1.4 E+7 Negl.
Upper area of lower drywell(Figure 6.2-1a) 2.61 E+1 Negl. 1.4 E+7 Negl.
Lower area of lower drywell(Figure 6.2-1a) 1.98 E+1 Negl. 1.0 E+7 Negl.
Wetwell - Suppression pool and gas space (Figure 6.2-1a) < 1.4 Negl. 7.4 E+5 Negl.
(1) Nominal operating dose rate is at 100% rated power and located at 30 cm (0.98 ft) from radiation source.
Specific radiation environment conditions for equipment are determined through the equipment
qualification program based on actual location.(2) The operating dose rates and integrated dose are based on ABWR plant operating conditions and
adjusted for ESBWR using appropriate scaling factors.(3) Integrated dose means the integrated value over 60 years.(4) Negl.- Value less than 0.001 mR/h

3-1450 Revision 0October 2015
Fermi 3Updated Final Safety Analysis Report
Table 3H-6 Typical Radiation Environment Qualification Conditions Inside Reactor Building
Plant Zone/Typical Equipment Integrated gamma dose(rads)
Hydraulic Control Unit (HCU) RoomsHCU, RPS solenoids and RPV water level instrument racksRooms No 1110, 1120, 1130, 1140(Figure 1.2-1)
< 104(1)
< 106
Battery Rooms Div 1, 2, 3 and 4 batteriesRoom Nos 1210, 1220, 1230, 1240(Figure 1.2-2)
< 106
Div 1, 2, 3 and 4 commodity chasesElectrical cablesRoom Nos 1211, 1221, 1231, 1241(Figure 1.2-2)
< 106
Electrical Division RoomsDiv 1, 2, 3 and 4 electrical and electronic equipmentRoom Nos 1311, 1321, 1331, 1341(Figure 1.2-3)
< 104(1)
< 106
Lower drywell non-divisional electrical and mechanical penetration Outboard containment isolation valvesRoom Nos 1300, 1301, 1302, 1303(Figure 1.2-3)
< 106
Div 1, 2, 3 and 4 electrical penetration rooms Electrical cables and penetrations Room Nos 1312, 1322, 1332, 1342(Figure 1.2-3)
< 106
Remote shutdown panelRoom Nos 1313, 1323 (inside rooms 1311 and 1321)(Figure 1.2-3)
< 104(1)
< 106
Non-divisional electrical equipmentSafety-related DCIS panelsRoom Nos 1500, 1501, 1502, 1503(Figure 1.2-5)
< 104(1)
< 106
Div 1, 2, 3 and 4 electrical penetrations Electrical cables and penetration Room Nos 1610, 1620, 1630, 1640(Figure 1.2-6)
< 106
Div 1, 2, 3 and 4 corridors rooms (access to penetration area), divisional electrical cables and safety-related DCIS RMUsRoom Nos 1710, 1720, 1730, 1740(Figure 1.2-7)
< 104(1)
< 106

3-1451 Revision 0October 2015
Fermi 3Updated Final Safety Analysis Report
(1) Electronic equipment is qualified for gamma dose < 104 rads, other equipment is qualified for gamma dose < 106
rads. In locations within these zones where the calculated dose is greater than 104 rads the qualification is done
for the actual calculated doses plus 10%, or equipment is protected from radiation.
Div 1, 2, 3 and 4 Electrical penetration and Mechanical penetrationsElectrical cables and penetrations. Outboard isolation valvesRoom Nos 1711, 1721, 1731, 1741 and 1712, 1722, 1732, 1742(Figure 1.2-7)
< 106
SLC tank roomsSLC tank instrumentationRoom Nos 1713, 1723(Figure 1.2-7)
< 104(1)
< 106
Main Steam TunnelMain Steamline (MSL) isolation valvesMSL drain isolation valvesFW isolation valvesRoom No 1770
(Figure 1.2-7)
< 107
IC/PCCS pools ICS pools instrumentationRoom Nos 18P3A/B/C/D, 18P4A/B/C/D/E/F, 18P5A/B/C, 18P6A/B/C(Figure 1.2-8)
< 104
Table 3H-6 Typical Radiation Environment Qualification Conditions Inside Reactor Building
Plant Zone/Typical Equipment Integrated gamma dose(rads)

3-1452 Revision 0October 2015
Fermi 3Updated Final Safety Analysis Report
Table 3H-7 Typical Radiation Environment Qualification Conditions Inside Control Building
Plant Zone/Typical Equipment Integrated gamma dose(rads)
Safety-related portions of CRHA Ventilation SubsystemRoom Nos 3406, 3407(Figure 1.2-5) < 10 3
Control Room Habitability AreaMain control room panels
(Outlined area on Figure 3H-1)< 10 3
Div 1, 2, 3 and 4 electrical roomsSafety-related DCIS panelsRoom Nos 3110, 3120, 3130 and 3140(Figure 1.2-2)
< 10 3

3-1453 Revision 0October 2015
Fermi 3Updated Final Safety Analysis Report
(1) For a pipe failure inside the containment vessel, water accumulates in the lower drywell. The amount depends
upon the break location.(2) Time denotes the time after the occurrence of LOCA.
Table 3H-8 Thermodynamic Environment Conditions Inside Containment Vessel for Accident Conditions
Plant Zone
Upper and lower drywell (1)
(Figure 6.2-1a)Time (2)
Bulk Temp. °C (°F) Time (2)
Bulk Temp. °C (°F)Time (2)
Press. kPaG (psig)Humidity %
0 h – 0.01 h193 (379) Max.>0.01 h – 72 h171 (340) Max.0 h – 72 h310 (45) Max.Steam
Wetwell Gas Space(Figure 6.2-1a)
Time (2)
Bulk Temp. °C (°F)Press. kPaG (psig)Humidity %
0 h – 72 h137 (278) Max.310 (45) Max.100

3-1454 Revision 0October 2015
Fermi 3Updated Final Safety Analysis Report
Table 3H-9 Thermodynamic Environment Conditions Inside Reactor Building for Accident Conditions
Plant Zone/Typical Equipment(3)
Hydraulic Control Unit (HCU) RoomsHCU, RPS solenoids and RPV water level instrument racksRoom Nos 1110, 1120, 1130, 1140(Figure 1.2-1)
Time(1)
Temp. °C (°F) (2)
Press. kPaG (psig)Humidity %
0 h - 72 h50 (122) Max Not controlledNot controlled
96 h - 100 days40 (104)Negative PressureNot controlled
Battery RoomsDiv 1, 2, 3 and 4 batteriesRoom Nos 1210, 1220, 1230, 1240(Figure 1.2-2)
Time(1)
Temp. °C (°F) (2)
Press. kPaG (psig)Humidity %
0 h - 72 h50 (122) Max Not controlledNot controlled
96 h - 100 days40 (104)Positive PressureNot controlled
Div 1, 2, 3 and 4 commodity chasesElectrical cablesRoom Nos 1211, 1221, 1231, 1241(Figure 1.2-2)
Time(1)
Temp. °C (°F) (2)
Press. kPaG (psig)Humidity %
0 h - 72 h110 (230) Max Not controlledNot controlled
96 h - 100 days50 (122)Positive PressureNot controlled
Electrical Division RoomsDiv 1, 2, 3 and 4 electrical and electronic equipmentRoom Nos 1311, 1321, 1331, 1341(Figure 1.2-3)
Time(1)
Temp. °C (°F) (2)
Press. kPaG (psig)Humidity %
0 h - 72 h50 (122) Max Not controlledNot controlled
96 h - 100 days40 (104)Positive PressureNot controlled
Lower drywell non-divisional electrical penetrationOutboard containment isolation valvesRoom Nos 1300, 1301, 1302, 1303(Figure 1.2-3)
Time(1)
Temp. °C (°F) (2)
Press. kPaG (psig)Humidity %
0 h - 72 h110 (230) Max Not controlledNot controlled
96 h - 100 days50 (122)Positive PressureNot controlled
Div 1, 2, 3 and 4 electrical penetration roomsElectrical cables and penetrationsRoom Nos 1312, 1322, 1332, 1342(Figure 1.2-3)
Time(1)
Temp. °C (°F) (2)
Press. kPaG (psig)Humidity %
0 h - 72 h110 (230) Max Not controlledNot controlled
96 h - 100 days50 (122)Positive PressureNot controlled
Remote shutdown panelRoom Nos 1313, 1323 (inside rooms 1311 and 1321)(Figure 1.2-3)
Time(1)
Temp. °C (°F) (2)
Press. kPaG (psig)Humidity %
0 h - 72 h50 (122)Not controlledNot controlled
96 h - 100 days40 (104)Positive PressureNot controlled
Non-divisional electrical equipmentSafety-related DCIS panelsRoom Nos 1500, 1501, 1502, 1503(Figure 1.2-5)
Time(1)
Temp. °C (°F) (2)
Press. kPaG (psig)Humidity %
0 h - 72 h50 (122) MaxNot controlledNot controlled
96 h - 100 days40 (104)Positive PressureNot controlled
Div 1, 2, 3 and 4 electrical penetrations Electrical cables and penetrationRoom Nos 1610, 1620, 1630, 1640(Figure 1.2-6)
Time(1)
Temp. °C (°F) (2)
Press. kPaG (psig)Humidity %
0 h - 72 h110 (230) MaxNot controlledNot controlled
96 h - 100 days50 (122)Positive PressureNot controlled

3-1455 Revision 0October 2015
Fermi 3Updated Final Safety Analysis Report
(1) Time indicates the time after the occurrence of the accident.(2) After 72h, the temperature decreases to the temperature value shown for 96h.(3) Electronic equipment is qualified for 50ºC (122ºF) during 72 hours; other equipment could be qualified for higher
temperatures according to the above values. In locations within these zones where room temperature is higher than 50°C (122ºF), electronic equipment is qualified for the actual calculated temperature within the zone, or the equipment is protected from high temperatures.
Div 1, 2, 3 and 4 corridors rooms (access to penetration area), divisional electrical cables and safety-related DCIS RMUsRoom Nos 1710, 1720, 1730, 1740(Figure 1.2-7)
Time(1)
Temp. °C (°F) (2)
Press. kPaG (psig)Humidity %
0 h - 72 h50 (122) MaxNot controlledNot controlled
96 h - 100 days40 (104)Negative PressureNot controlled
Div 1, 2, 3 and 4 electrical penetration and Mechanical penetrations. Electrical cables and penetrations. Outboard isolation valvesRoom Nos 1711, 1721, 1731, 1741 and 1712, 1722, 1732, 1742(Figure 1.2-7)
Time(1)
Temp. °C (°F) (2)
Press. kPaG (psig)Humidity %
0 h - 72 h110 (230) MaxNot controlledNot controlled
96 h - 100 days50 (122)Negative PressureNot controlled
SLC tank roomsSLC tank instrumentationRoom Nos 1713, 1723(Figure 1.2-7)
Time(1)
Temp. °C (°F) (2)
Press. kPaG (psig)Humidity %
0 h - 72 h50 (122) MaxNot controlledNot controlled
96 h - 100 days40 (104)Negative PressureNot controlled
Main Steamline (MSL) isolation valvesMSL drain isolation valvesFW isolation valvesRoom No 1770(Figure 1.2-7)
Time(1)
Temp. °C (°F) (2)
Press. kPaG (psig)Humidity %
0 h - 72 h117 (243) Max76 (11)100
96 h - 100 days60 (140)Negative PressureNot controlled
IC/PCCS pools ICS pools instrumentationRoom Nos 18P3A/B/C/D, 18P4A/B/C/D/E/F, 18P5A/B/C, 18P6A/B/C(Figure 1.2-8)
Time(1)
Temp. °C (°F) (2)
Press. kPaG (psig)Humidity %
0 h - 72 h112 (234) Max49 (7.1)100
96 h - 100 days100 (212)Positive Pressure100
Table 3H-9 Thermodynamic Environment Conditions Inside Reactor Building for Accident Conditions
Plant Zone/Typical Equipment(3)

3-1456 Revision 0October 2015
Fermi 3Updated Final Safety Analysis Report
(1) Time indicates the time after the occurrence of the accident. (2) After 72h, the temperature decreases to the temperature value shown for 10 days.(3) Electronic equipment is type tested for 60ºC (140ºF) during 72 hours; other equipment could be type tested for
higher temperatures according to the above values.
Table 3H-10 Thermodynamic Environment Conditions Inside Control Building for Accident Conditions
Plant Zone/Typical Equipment (3)
Safety-related portions of CRHA Ventilation SubsystemRoom Nos 3406, 3407(Figure 1.2-5)
Time(1)
Temp. °C (°F)Press. Pa (psi)Humidity
0 h - 72 h50 (122)MaxNot controlledNot controlled
10 days – 100 days26 (79) MaxPositive PressureNot controlled
Electrical chasesRoom Nos 3250, 3261(Figures 1.2-2 to 1.2-5)
Time (1)
Temp. °C (°F)Press. Pa (psi)Humidity
0 h – 72 h110 (230) MaxNot controlledNot controlled
10 days – 100 days26 (79) MaxPositive PressureNot controlled
Control Room Habitability AreaMain control room panels
(Outlined area on Figure 3H-1)
Time(1) 0 – 72 h 10 days
Temp. °C (°F)(2) 33.9 (93) AverageBulk Max allowed
23.3 (74) max
Press. Pa (psi) 31 (4.5E-3) Positive 31 (4.5E-3) Positive
Humidity Not controlled 60% Max
Div 1, 2, 3 and 4 electrical roomsSafety-related DCIS panelsRoom Nos 3110, 3120, 3130 and 3140(Figure 1.2-2)
Time(1)
Temp. °C (°F)Press. Pa (psi)Humidity
0 h - 72 h45 (113)MaxNot controlledNot controlled
10 days – 100 days26 (79) MaxPositive PressureNot controlled

3-1457 Revision 0October 2015
Fermi 3Updated Final Safety Analysis Report
(1) The accident dose rates are based on ESBWR plant accident conditions and calculated in accordance with
RG 1.183 and NUREG-1465.(2) (Deleted)(3) Integrated dose is for 100 days.
Table 3H-11 Radiation Environment Conditions Inside Containment Vessel for Accident Conditions
Plant Zone/Typical Equipment
Maximum Post-Accident Dose Rate(1) Integrated Dose(3)
Gamma(Rad/h)
Beta(Rad/h)
Gamma(Rad)
Beta(Rad)
Upper drywell(Figure 6.2-1a)
3.45 E+6 2.09 E+7 1.84 E+8 1.59 E+9
Upper area of lower drywell(Figure 6.2-1a)
2.77 E+6 1.27 E+7 2.29 E+8 1.13 E+9
Lower area of lower drywell(Figure 6.2-1a)
1.97 E+6 2.09 E+7 6.57 E+7 1.59 E+9
Wetwell - Suppression pool and gas space(Figure 6.2-1a)
3.47 E+6 2.09 E+7 6.41 E+7 1.59 E+9

3-1458 Revision 0October 2015
Fermi 3Updated Final Safety Analysis Report
Table 3H-12 Room Heat Loads
Rooms(4)Contain
safety-related equipment
Heat Load W (BTU/h)(1)Remarks
0 – 2 hr 2 – 24 hr 24 – 72 hr
1110, 1120, 1130, 1140
Yes 2300 (7848)2300
(7848)2300
(7848)
1101, 1103, 1150, 1151, 1152, 1160, 1161, 1162, 1195
No1800 (6142)
HELBHELB HELB
Heat load for LOCA with station blackout (SBO) scenario. Rooms bounded by HELB
conditions, see Section 6.2
1100, 1102 Yes(5) 1800 (6142) HELB
HELB HELBHeat load for LOCA with station blackout
(SBO) scenario. Rooms bounded by HELB conditions see Section 6.2
1106, 1107, 1196, 1197, 1198
No Negligible 0 0No heat load and no heat sink
(conservative assumption)
1250, 1251, 1252, 1260, 1261, 1262, 1293, 1294, 1295,
1296
No1800 (6142)
HELBHELB HELB
Heat load for LOCA with SBO scenario. Rooms bounded by HELB conditions, see
Section 6.2
1210, 1220, 1230, 1240
Yes7200
(24567)6000
(20473)6000
(20473)
1211, 1221, 1231, 1241
Yes 500 (1706) 500 (1706) 500 (1706)
1203, 1204 No Negligible 0 0No heat load and no heat sink
(conservative assumption)
1311, 1321, 1331, 1341
Yes10140
(34599)8140
(27774)8140
(27774)
1304, 1305, 1306, 1307, 1308
No HELB HELB HELBRooms bounded by HELB conditions, see
Section 6.2
1300, 1301, 1302, 1303
Yes1700/500
(5800/1706)
1700/500 (5800/1706
)
1700/500 (5800/1706
)
The higher heat load applies to the rooms in which the RWCU/SDC piping is located.
1312, 1322, 1332, 1342
Yes 500 (1706) 500 (1706) 500 (1706)
1313, 1323 Yes 500 (1706) 500 (1706) 500 (1706)
1400, 1401, 1402, 1403
No5500
(18767)0 0
1500, 1501, 1502, 1503
Yes17500
(59712)2000
(6824)2000
(6824)
1600/1601 No150
(512)/150 (512)
0 0Rooms 1600 and 1601 are considered to
be the same room in the analysis.
1610, 1620, 1630, 1640
Yes 500 (1706) 500 (1706) 500 (1706)
1710, 1720, 1730, 1740
Yes3450/2250
(11772/7677)
3450/2250 (11772/767
7)
3450/2250 (11772/767
7)
The higher heat load applies to the rooms in which the RWCU/SDC piping is located.
1711, 1721, 1731, 1741
Yes 500 (1706) 500 (1706) 500 (1706)

3-1459 Revision 0October 2015
Fermi 3Updated Final Safety Analysis Report
(1) Heat Loads provided per room except as noted.(2) A uniform temperature distribution in the CRHA provides an adequate representation of the average bulk
temperature. Heat load provided is for the overall CRHA. There is a cooling system sized to remove the nonsafety-related heat loads for two hours (See Subsection 9.4.1). However, this nonsafety-related cooling system is not credited in the analysis, and additional heat load for some nonsafety-related equipment is included for the duration of the 72-hr period.
(3) The analysis assumes that the N-DCIS rooms reach a temperature of 60ºC (140ºF) in the first 2 hours and remains constant for the period of interest.
(4) See Figures 1.2-1 to 1.2-8 for room locations.(5) The safety related equipment located in these rooms performs its safety related function before a temperature
increase, is not needed during a HELB event, qualified for HELB temperatures or protected against HELB environment.
1712, 1722, 1732, 1742
Yes 1200 (4095)1200
(4095)1200
(4095)
1713, 1723 Yes 200 (682) 200 (682) 200 (682)
1770 Yes HELB HELB HELBRoom bounded by HELB conditions, see
Section 6.2
18P3A/B/C/D, 18P4A/B/C/D/E/F,
18P5A/B/C, 18PA/B/C
Yes HELB HELB HELBRooms bounded by HELB conditions, see
Section 6.2
3110, 3120, 3130, 3140
Yes5720
(19517)4675
(15952)3080
(10509)
3100, 3101 No 0 0 0No heat loads during a 0 - 72 hour period
(heat sink)
CRHA(Outlined area on
Figure 3H-1)Yes
9630 (32859)
9630 (32859)
9630 (32859)
240 l/s (509 cfm)of outside air are considered (see Table 9.4-1 for
minimum).(2)
(Deleted)
3200,3203, 3277 No 0 0 0No heat loads during a 0-72 hour period
(heat sink)
3250, 3261 Yes 500 (1706) 500 (1706) 500 (1706)
3251, 3260 No 0 0 0No heat loads during a 0-72 hour period
(heat sink)
3301, 3302 No See Note 3 See Note 3 See Note 3
Louver for each room maintains a maximum temperature of 50°C (122°F) during LOOP. See Figures 1.2-4, 1.2-5
and 1.2-11.
3401, 3402, 3403, 3404 & corridors
No 0 0 0No heat loads during a 0-72 hour period
(heat sink)
3406, 3407 Yes 500 (1706) 500 (1706) 500 (1706)
Table 3H-12 Room Heat Loads
Rooms(4)Contain
safety-related equipment
Heat Load W (BTU/h)(1)Remarks
0 – 2 hr 2 – 24 hr 24 – 72 hr

3-1460 Revision 0October 2015
Fermi 3Updated Final Safety Analysis Report
Table 3H-13 Typical Mild Environment Parameter Limits
Parameter Limits Notes
Temperature 50C (122F)63°C (145°F)
NormalAbnormal
Pressure Atmospheric Nominal
Humidity 30 – 65%≤ 95%
TypicalAbnormal
Radiation 1E4 Rads Gamma 1E3 Rads Gamma Electronics
Chemistry None
Submergence None

3-1461 Revision 0October 2015
Fermi 3Updated Final Safety Analysis Report
(1) During wintertime conditions the CB calculation uses 15.5°C (60°F) as the ground temperature. This temperature is used to set the initial temperature of the concrete heat sink.
(2) Initially a linear temperature distribution across the walls is used. The CRHA internal walls, floors and ceiling are exposed to an air temperature of 29.4ºC (85ºF) for an eight-hour period. The resulting concrete temperatures are used as the starting point for the CB analysis.
(3) During summertime conditions the maximum CB design temperature is used 47.2°C (117°F), during wintertime conditions the minimum CB design temperature is used – 40°C/°F. The dry bulb Daily Temperature Range used in the analyses is conservative because the actual Daily Temperature Range is larger. The Daily Temperature Range for a day with a high of 47.2°C (117°F) or minimum of -40ºC (-40ºF) is greater than 15ºC (27ºF).
(4) Combinations of thermal concrete properties were used for the RB calculation. The most limiting value is presented in the results.
(5) The High Humidity Diurnal Swing determined for a maximum wet bulb temperature of 31.1ºC (88ºF) is a maximum temperature of 33.3ºC (92ºF) dry bulb/31.1ºC (88ºF) wet bulb and a minimum temperature of 28.9ºC (84ºF) dry bulb/27.2ºC (81ºF) wet bulb, which is a dry bulb temperature swing of 4.4ºC (8ºF).
Table 3H-14 Input Parameters, Initial Conditions and Assumptions used in Reactor Building and Control Building Temperature Analyses
ParameterAnalytical
Value Design Value
Initial Ground Temperature °C (°F)(1) 30 (86) 15.5 (60)
HELB Temperatures See Section 6.2 Analysis
See Section 6.2
LOCA Temperatures See Section 6.2 Analysis
See Section 6.2
Heat Sink Initial Temperature(2) Table 3H-15 Table 3H-15
CRHA Day and Night Daily Temperature Range for 0% Exceedance Dry Bulb Temperature Δ °C (°F)(3) 15 (27) 15 (27)
CRHA Day and Night High Humidity Diurnal Swing for 0% Exceedance Wet Bulb Temperature ΔDBt °C (°F) (5) 4.4 (8) 4.4 (8)
EFU Outside Air Supply into CRHA l/s (cfm) 240(509)Maximum
See Table 9.4-1Minimum
Concrete Thermal Conductivity for RB and CB W/m°C (Btu·in/h·ft²·°F)(4) 0.865 (6.00) 1.63 (11.3)
Concrete Specific Heat J/kg·°C (Btu/lb°F)(4) 653.1 (0.156) 879.2 (0.210)
Concrete Density kg/m³ (lb/ft³)(4) 1922.2 (120.00)
2394.8 (149.50)
CRHA Heat Sink Perimeter m (ft) 103 (338) 103 (338)
CRHA Heat Sink Perimeter Wall Thickness in Contact with the Ground m (ft) 0.90 (2.95) 0.90 (2.95)
CRHA Heat Sink Perimeter Wall Thickness in Contact with the Corridor m (ft) 0.50 (1.64) 0.50 (1.64)
CRHA Heat Sink Thickness of Internal Walls and Walls not in contact with the Ground or Corridor m (ft)
0.30 (0.98) 0.30 (0.98)
CRHA Heat Sink Height m (ft) 6.15 (20.2) 6.15 (20.2)
CRHA Heat Sink Ceiling/Floor Area m² (ft²) 443 (4769) 443 (4769)
CRHA Heat Sink Ceiling/Floor Thickness m (ft) 0.50 (1.64) 0.50 (1.64)
CRHA Room Volume m³ (ft³) 2724 (96197) 2724 (96197)

3-1462 Revision 0October 2015
Fermi 3Updated Final Safety Analysis Report
Table 3H-15 Analytical Room Environment Temperatures
Rooms(5)
Temperature ºC (ºF)
Normal Operation
(Analytical)(1)72 hrs 168 hrs
MaxEnvironmentTemperature
from Table 3H-9
Hydraulic Control Unit (HCU) RoomsHCU, RPS solenoids and RPV water level instrument racksRoom Nos 1110, 1120, 1130, 1140Representative Room: 1130
30 (86) 44 (111)Safe
Shutdown50 (122)
Battery Rooms Div 1, 2, 3 and 4 batteriesRoom Nos 1210, 1220, 1230, 1240Representative Room: 1220
25 (77) 42 (108)Safe
Shutdown50 (122)
Div 1, 2, 3 and 4 commodity chasesElectrical cablesRoom Nos 1211, 1221, 1231, 1241Representative Room: 1241
41 (106) 58 (136)Safe
Shutdown110 (230)
Electrical Division RoomsDiv 1, 2, 3 and 4 electrical and electronic equipmentRoom Nos 1311, 1321, 1331, 1341Representative Room: 1341
30 (86) 47 (117)Safe
Shutdown50 (122)
Lower drywell non-divisional electrical and mechanical penetration Outboard containment isolation valvesRoom Nos 1300, 1301, 1302, 1303Representative Room: 1302
41 (106) 67 (153)Safe
Shutdown110 (230)
Div 1, 2, 3 and 4 electrical penetration rooms Electrical cables and penetrations Room Nos 1312, 1322, 1332, 1342Representative Room: 1312
41 (106) 59 (138)Safe
Shutdown110 (230)
Remote shutdown panelRoom Nos 1313, 1323 (inside rooms 1311 and 1321)Representative Room: 1323
30 (86) 45 (113)Safe
Shutdown50 (122)
Non-divisional electrical equipmentSafety-related DCIS panelsRooms Nos 1500, 1501, 1502, 1503 Representative Room: 1501
30 (86) 46 (115)Safe
Shutdown50 (122)
Div 1, 2, 3 and 4 electrical penetrationsElectrical cables and penetrations Room Nos 1610, 1620, 1630, 1640 Representative Room: 1610
41 (106) 62 (144)Safe
Shutdown110 (230)

3-1463 Revision 0October 2015
Fermi 3Updated Final Safety Analysis Report
Rooms(5)
Temperature ºC (ºF)
Normal Operation
(Analytical)(1)72 hrs 168 hrs
MaxEnvironmentTemperature
from Table 3H-9
Div 1and 4 corridors rooms (access to penetration area), divisional electrical cables and safety-related DCIS RMUsRoom Nos 1710, 1740 Representative Room: 1740
30 (86) 48 (118)Safe
Shutdown50 (122)
Div 2 and 3 corridors rooms (access to penetration area), divisional electrical cables and safety-related DCIS RMUsRoom Nos 1720, 1730 Representative Room: 1720
30 (86) 49 (120)Safe
Shutdown50 (122)
Div 1, 2, 3 and 4 electrical penetrations Electrical cables and penetrations. Room Nos 1711, 1721, 1731, 1741 Representative Room: 1741
41 (106) 54 (129)Safe
Shutdown110 (230)
Mechanical penetrationsOutboard isolation valvesRoom Nos 1712, 1722, 1732, 1742 Representative Room: 1712
41 (106) 61 (142)Safe
Shutdown110 (230)
SLC tank roomsSLC tank instrumentationRoom Nos 1713, 1723Representative Room: 1723
30 (86) 39 (102)Safe
Shutdown50 (122)
Main Steam TunnelMain Steamline (MSL) isolation valvesMSL drain isolation valvesFW isolation valvesRoom No 1770Accident Conditions
43 (109)Section 6.2 Analysis
Section 6.2Analysis
117 (243)
IC/PCCS pools ICS pools instrumentationRoom Nos 18P3A/B/C/D, 18P4A/B/C/D/E/F, 18P5A/B/C, 18P6A/B/C Accident Conditions
43 (109)Section 6.2Analysis
Section 6.2 Analysis
112 (234)
Control Room Habitability AreaMain control room panelsOutlined area on Figure 3H-1Summertime Conditions
23.3 (74) 33 (92)(4) <33.9 (93)33.9 (93) Average
Bulk Max for 72 hrs
Control Room Habitability AreaMain control room panelsOutlined area on Figure 3H-1 Wintertime Conditions
22.78 (73)(2) 16 (61)(3) 13 (55) Unspecified
Table 3H-15 Analytical Room Environment Temperatures

3-1464 Revision 0October 2015
Fermi 3Updated Final Safety Analysis Report
(1) All rooms in the RB and CB are evaluated at higher than expected normal operating temperatures unless
otherwise shown in the table to be at normal operating temperatures. The HVAC equipment rooms start at a
temperature of 40°C (104°F) as stated in Subsection 9.4.1.(2) During winter conditions the CB room initial temperatures, with the exception of the CRHA, are set to 18.3°C
(65°F).(3) The CRHA heat loads considered during this period is 2821 Watts (9626 BTU/h).(4) For high humidity conditions the CRHA has a maximum Wet Bulb Globe Temperature (WBGT) index of 31.2ºC
(88.1ºF).(5) See Figures 1.2-1 to 1.2-8 for room locations.
Rooms(5)
Temperature ºC (ºF)
Normal Operation
(Analytical)(1)72 hrs 168 hrs
MaxEnvironmentTemperature
from Table 3H-9
Div 1, 2, 3 and 4 electrical roomsSafety-related DCIS panelsRoom Nos 3110, 3120, 3130 and 3140
25.6 (78)(2) 37 (99)Safe
Shutdown45 (113)
Safety-related portions of CRHA Ventilation Subsystem Room Nos 3406, 3407
40 (104)(2) 43 (109)Safe
Shutdown50 (122)
Electrical Chases Room Nos 3250, 3261 25.6 (78)(2) 35 (95)
Safe Shutdown
110 (230)
Table 3H-15 Analytical Room Environment Temperatures
3-1465 Revision 0October 2015
Fermi 3Updated Final Safety Analysis Report
Figure 3H-1. Control Room Habitability Area{{{Security-Related Information - Withhold Under 10 CFR 2.390}}}

3-1466 Revision 0October 2015
Fermi 3Updated Final Safety Analysis Report
Figure 3H-2. Control Room Habitability Area Transient Analysis Heat up Profile – 0% Exceedance Maximum Temperature Case
Figure 3H-3. Control Room Habitability Area Transient Analysis Relative Humidity Profile– 0% Exceedance Maximum Temperature Case
20 ºC
25 ºC
30 ºC
35 ºC
40 ºC
45 ºC
50 ºC
0 h 6 h 12 h 18 h 24 h 30 h 36 h 42 h 48 h 54 h 60 h 66 h 72 h
Time
Room air temperature (ºC)
68 ºF
77 ºF
86 ºF
95 ºF
104 ºF
113 ºF
122 ºFRoom air temperature (ºF)
CRHA Outside Air Max. Allowable Temp.
Figure 3H-3. Control Room Habitability Area Transient Analysis Relative Humidity
0 %
10 %
20 %
30 %
40 %
50 %
60 %
70 %
0 h 6 h 12 h 18 h 24 h 30 h 36 h 42 h 48 h 54 h 60 h 66 h 72 h
Time
Relative Humidity (%)
CRHA Outside

3-1467 Revision 0October 2015
Fermi 3Updated Final Safety Analysis Report
Appendix 3I DESIGNATED NEDE-24326-1-P MATERIAL WHICH MAY NOT CHANGE WITHOUT PRIOR NRC APPROVAL
This appendix identifies the NEDE-24326-1-P (Reference 3I-1) “General Electric Environmental
Qualification Program” material that is designated as Tier 2* material. (See Section 3.10.)
3I.1 GENERAL REQUIREMENTS FOR DYNAMIC TESTING
(Paragraph 4.4.2.5.1 of Ref. 3I-1)
(a) Mounting – Specimens to be tested will be mounted in a manner that adequately simulates
the installed configuration or as described in the applicable GE mounting documentation.
Mounting will be specified in the Product Performance Qualification Specification (PPQS).
(b) Monitoring – Sufficient monitoring equipment will be used to evaluate the performance of the
specimen before, during, and after the test. Monitoring product is used to allow determination
of applied vibration levels and equipment responses. The location of monitoring sensors shall
be specified by the PPQS and will be documented in the test report.
When required by the PPQS, the response of the product will be measured using
accelerometers. When required by the PPQS, the accelerometers shall be located at a
sufficient number of locations on the product to define the mode shapes and/or frequencies
which would be required to allow dynamic qualification of individual safety-related
components and devices, to support analytical extrapolation of test results, or to verify
frequency requirements.
(c) Exploratory Tests – Exploratory vibration tests may be performed on the product to aid in the
determination of the test method that will best qualify or determine the dynamic characteristics
of the product. If it can be shown that the equipment is not resonant at any frequency within
the expected frequency range, it may be considered a rigid body and tested according to
methods and procedures discussed in Subsection 4.4.2.5.6 of Reference 3I-1 or analyzed
according to the methods of Subsection 4.4.4.1.4.5 of Reference 3I-1.
If the product contains a single resonance or multiple resonances, one of the methods
outlined in Subsection 4.4.2.5.3 of Reference 3I-1 will be used to qualify the product by test.
The exploratory test may be performed in the form of a low-level, continuous sinusoidal
sweep at a rate no greater than 2 octave per minute over the frequency range equal to or
greater than that to which the equipment is to be qualified. All resonances will be recorded for
use in determining the test method to be used or the dynamic characteristics of the
equipment. If the configuration of the product is such that critical natural frequencies cannot
be ascertained, dynamic qualification will be accomplished by testing by the Response
Spectrum method as specified in Paragraph 4.4.2.5.3.b of Reference 3I-1. An acceptable
alternative qualification method is a fragility test as described in Subsection 4.4.2.5.7 of
Reference 3I-1.
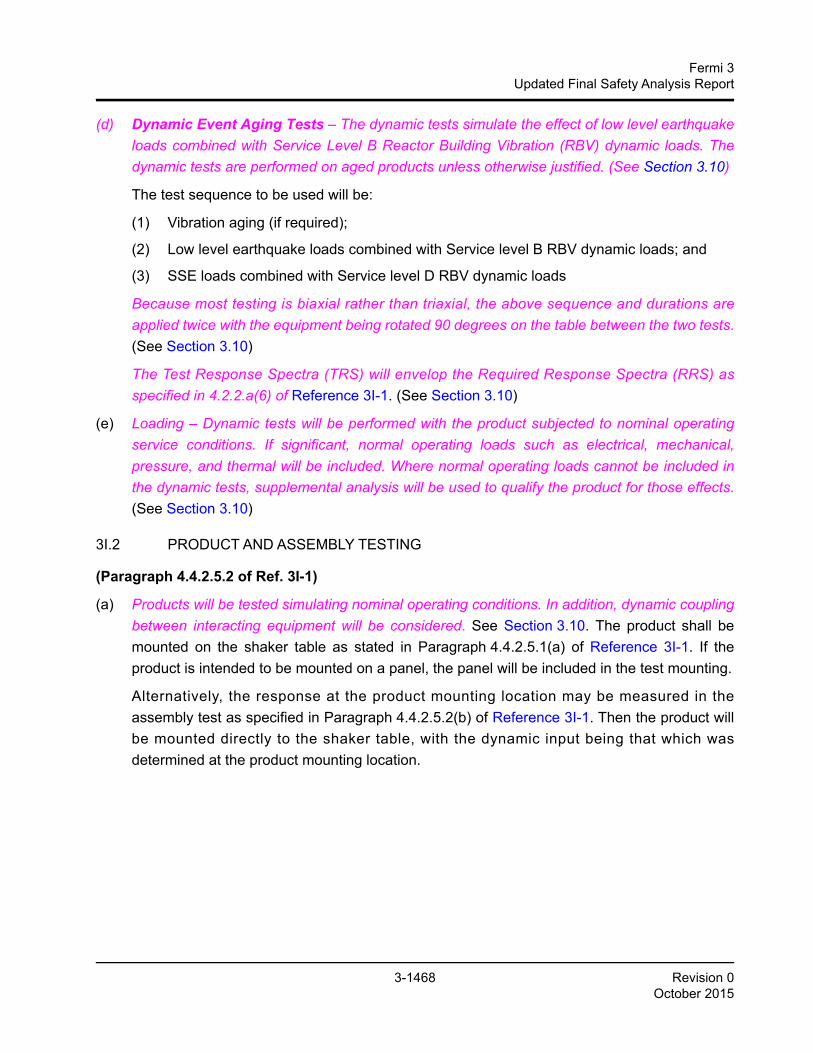
3-1468 Revision 0October 2015
Fermi 3Updated Final Safety Analysis Report
(d) Dynamic Event Aging Tests – The dynamic tests simulate the effect of low level earthquake
loads combined with Service Level B Reactor Building Vibration (RBV) dynamic loads. The
dynamic tests are performed on aged products unless otherwise justified. (See Section 3.10)
The test sequence to be used will be:
(1) Vibration aging (if required);
(2) Low level earthquake loads combined with Service level B RBV dynamic loads; and
(3) SSE loads combined with Service level D RBV dynamic loads
Because most testing is biaxial rather than triaxial, the above sequence and durations are
applied twice with the equipment being rotated 90 degrees on the table between the two tests.
(See Section 3.10)
The Test Response Spectra (TRS) will envelop the Required Response Spectra (RRS) as
specified in 4.2.2.a(6) of Reference 3I-1. (See Section 3.10)
(e) Loading – Dynamic tests will be performed with the product subjected to nominal operating
service conditions. If significant, normal operating loads such as electrical, mechanical,
pressure, and thermal will be included. Where normal operating loads cannot be included in
the dynamic tests, supplemental analysis will be used to qualify the product for those effects.
(See Section 3.10)
3I.2 PRODUCT AND ASSEMBLY TESTING
(Paragraph 4.4.2.5.2 of Ref. 3I-1)
(a) Products will be tested simulating nominal operating conditions. In addition, dynamic coupling
between interacting equipment will be considered. See Section 3.10. The product shall be
mounted on the shaker table as stated in Paragraph 4.4.2.5.1(a) of Reference 3I-1. If the
product is intended to be mounted on a panel, the panel will be included in the test mounting.
Alternatively, the response at the product mounting location may be measured in the
assembly test as specified in Paragraph 4.4.2.5.2(b) of Reference 3I-1. Then the product will
be mounted directly to the shaker table, with the dynamic input being that which was
determined at the product mounting location.

3-1469 Revision 0October 2015
Fermi 3Updated Final Safety Analysis Report
3I.3 MULTIPLE-FREQUENCY TESTS
(Paragraph 4.4.2.5.3 of Ref. 3I-1)
(a) General – When the dynamic ground motion has not been strongly filtered, the mounting
location retains the broadband characteristics. In this case, multi-frequency testing is
applicable to dynamic qualification. (See Section 3.10)
(b) Response Spectrum Test – Testing shall be performed by applying artificially generated
input excitation to the product, the amplitude of which is controlled in 1/3 octave or narrower
bands. The excitation will be controlled to provide a test response spectrum (TRS) which
meets or exceeds the RRS. The peak value of the input excitation equals or exceeds the zero
period acceleration (ZPA) of the RRS. (See Section 3.10)
3I.4 SINGLE- AND MULTI-AXIS TESTS
(Paragraph 4.4.2.5.4 of Ref. 3I-1)
Single-axis tests may be allowed if the tests are designed to conservatively reflect the dynamic
event at the equipment mounting locations or if the product being tested can be shown to respond
independently in each of the three orthogonal axis or otherwise withstand the dynamic event at its
mounting location.
If the preceding considerations do not apply, multi-axis testing will be used. The minimum is biaxial
testing with simultaneous inputs in a principal horizontal axis and the vertical axis. Independent
random inputs are preferred, and, if used, the test will be performed in two steps with the equipment
rotated 90° in the horizontal plane for the second step. If independent random inputs are not used
(such as with single frequency tests), four tests would be run; first, with the inputs in phase; second,
with one input 180° out of phase; third, with the equipment rotated 90° horizontally and the inputs in
phase; and, finally, with the same equipment orientation as in the third step but with one input 180°
out of phase. (See Section 3.10)
3I.5 SINGLE FREQUENCY TESTS
(Paragraph 4.4.2.5.6 of Ref. 3I-1)
If it can be shown that the products, as defined in Regulatory Guide 1.92 have no resonances, or
only one resonance, or if resonances are widely spaced and do not interact to reduce the fragility
level in the frequency range of interest or, if otherwise justified, single frequency tests may be used
to fully test the product. (See Section 3.10)

3-1470 Revision 0October 2015
Fermi 3Updated Final Safety Analysis Report
3I.6 DAMPING
(Paragraph 4.4.2.5.8 of Ref. 3I-1)
The product damping value used for dynamic qualification shall be established. See (Reference
3I-1) Section 5 of IEEE-344. (Also see Subsections 3.9.2.2, 3.9.3, and 3.10)
3I.7 QUALIFICATION DETERMINATION
(Paragraph 4.4.3.3 of Ref. 3I-1)
In order for equipment to be qualified by reason of operating experience, documented data will be
available confirming that the following criteria have been met:
(a) the product providing the operating experience is identical or justifiably similar to the
equipment to be qualified;
(b) the product providing the operating experience has operated under service conditions which
equal or exceed, in severity, the service conditions and performance requirements for which
the product is to be qualified; and
(c) the installed product must, in general, be removed from service and subjected to partial type
testing to include the dynamic and design basis event environments for which the product is to
be qualified. (See Section 3.10)
3I.8 DYNAMIC QUALIFICATION BY ANALYSIS
(Paragraph 4.4.4.1.4 of Ref. 3I-1)
(a) The analytical procedures described in this section may be used for dynamic qualification of
products.
(b) Many factors control the design of a qualification program. Paragraphs 4.2.2.c(3) and
4.2.2.d(1) of Reference 3I-1 provide general guidelines on dynamic analysis techniques.
Analytical techniques and modeling assumptions will, when possible, be based on a
correlation of the analytical approach with testing or operating experience performed on
similar equipment or structures. Analysis may be used as a qualification method for the
following conditions:
(1) if maintaining structural integrity is the only required assurance of the safety-related
function (see Section 3.10);
(2) if the response of the equipment is linear or has a simple nonlinear behavior which can
be predicted by conservative analytical methods; or
(3) if the product is too large to test.

3-1471 Revision 0October 2015
Fermi 3Updated Final Safety Analysis Report
3I.9 REQUIRED RESPONSE SPECTRA
(Paragraph 4.4.4.1.4.6.2 of Ref. 3I-1)
(a) The required response spectra that define the dynamic criteria for the location(s) of the
product under consideration are to be given in the PPQS. If the equipment under
consideration is attached to the structural system at more than one location, then the dynamic
analysis performed takes into consideration the different response spectra at the different
support locations. The effect of multiple support attachment points or multiple locations of the
particular product can also be accounted for by selecting a single spectrum which will
effectively produce the critical maximum responses due to different accelerations existing at
different points. (See Section 3.10.) This may be conservatively accomplished by enveloping
the response spectra for the different applicable locations. Alternatively, actual multi-support
excitation effects may be taken into account by performing a multi-support excitation analysis.
3I.10 TIME HISTORY ANALYSIS
(Paragraph 4.4.4.1.4.6.3 of Ref. 3I-1)
Time history analysis will be performed when conditions arise invalidating the response spectrum
method of analysis due to nonlinear phenomena, or when generation of in-equipment response
spectra or a more exact result is desired. To integrate or differentiate, the analysis will be done by
an applicable numerical integration technique. The largest time step used in the analysis will be
1/10 of the period of the highest significant mode of vibration of the equipment. The dynamic input
will be the time history motion at the equipment support location. (See Section 3.10.) For products
supported at several locations, the responses will be determined by simultaneous excitations using
appropriate time history input at each support location. The scaled time interval will be varied as per
Paragraph 4.2.2.a(6) of Reference 3I-1.
If the product frequency is within the range of the supporting structure, then a time interval will be
chosen such that the peak of the response spectrum shall be at the product resonance frequency.
The total time interval range will be provided with the time history.
3I.11 REFERENCES
3I-1 General Electric Company, “General Electric Environmental Qualification Program,” NEDE-24326-1-P, Proprietary Document, January 1983.

3-1472 Revision 0October 2015
Fermi 3Updated Final Safety Analysis Report
Appendix 3J EVALUATION OF POSTULATED RUPTURES IN HIGH ENERGY PIPES
3J.1 BACKGROUND AND SCOPE
The need for an evaluation of the dynamic effects of fluid dynamic forces resulting from postulated
ruptures in high energy piping systems is established by Standard Review Plan (SRP) Sections
3.6.1 and 3.6.2. The criteria for performing this evaluation are defined in Subsections 3.6.1and
3.6.2, SRP Sections 3.6.1 and 3.6.2 and ANS 58.2.
This Appendix defines an acceptable procedure for performing these evaluations.
The evaluation is performed in four major steps:
1. Identify the location of the postulated rupture and whether the rupture is postulated as circumferential or longitudinal.
2. Select the type and location of the pipe whip restraints.
3. Perform a complete system dynamic analysis or a simplified dynamic analysis, as appropriate, of the ruptured pipe and its pipe whip restraints to determine the total movement of the ruptured pipe, the loads on the pipe, strains in the pipe whip restraint, and, if applicable, the stresses in the piping in the penetration area.
4. Evaluate safety-related equipment that may be impacted by the ruptured pipe or the target of the pipe rupture jet impingement.
The criteria for locations where pipe ruptures must be postulated and the criteria for defining the
configuration of the pipe rupture are defined in Subsection 3.6.2. Also defined in Subsection 3.6.2
are:
• the fluid forces acting at the rupture location and in the various segments of the ruptured pipe
• the jet impingement effects including jet shape and direction and jet impingement load
The high energy fluid systems are defined within Subsection 3.6.2.1, and identified in Tables 3.6-3
and 3.6-4. Safety-related systems, components and equipment, or portions thereof, specified in
Tables 3.6-1 and 3.6-2, are protected from pipe break effects that would impair their ability to
facilitate safe shutdown of the plant.
The information contained in Subsections 3.6.1 and 3.6.2 and in the SRPs and ANS 58.2 is not
repeated in this appendix.
3J.2 IDENTIFICATION OF RUPTURE LOCATIONS AND RUPTURE GEOMETRY
3J.2.1 Ruptures in Containment Penetration Area
Postulation of pipe ruptures in the portion of piping in the containment penetration area is not
allowed. This includes the piping between the inner and outer isolation valves. Therefore, the final
stress analysis of the piping system is examined to confirm that, for piping in the containment

3-1473 Revision 0October 2015
Fermi 3Updated Final Safety Analysis Report
penetration areas, the design stress and fatigue limits specified in Subsection 3.6.2.1 are not
exceeded.
3J.2.2 Ruptures in Areas other than Containment Penetration.
Breaks in Class 1 piping are postulated in accordance with Subsection 3.6.2.1.1.
Breaks in Class 2 and 3 piping are postulated in accordance with Subsection 3.6.2.1.1.
Breaks in seismically analyzed non-ASME Class piping are postulated in accordance with the
above requirements for Class 2 and 3 piping.
3J.2.3 Determination of the Type of Pipe Break
Determination of whether the high energy line break is longitudinal or circumferential is in
accordance with Subsection 3.6.2.1.3.
3J.3 DESIGN AND SELECTION OF PIPE WHIP RESTRAINTS
3J.3.1 Preliminary Selection of Pipe Whip Restraint
The load carrying capability of the General Electric (GE) U-Bar pipe whip restraint is determined by
the number, size, bend radius and the straight length of the U-bars. The pipe whip restraint must
resist the thrust force at the pipe rupture location and the impact force of the pipe. The magnitude of
these forces is a function of the pipe size, fluid temperature, and operating pressure.
A preliminary selection of one of the standard GE pipe whip restraints is made by matching the
thrust force at the rupture location with a pipe whip restraint capable of resisting this thrust force.
The GE REDEP computer file contains a set of tables for selecting the design of pipe whip restraint
components. This file correlates the pipe size and the resulting thrust force at the pipe rupture with
the U-bar pipe whip restraints designed to carry the thrust force. REDEP then supplies the
force/deflection data for each pipe whip restraint. The REDEP file data is maintained in accordance
with GEH quality requirements.
3J.3.2 Preparation of Simplified Computer Model of Piping-Pipe Whip Restraint System
A simplified computer model of the piping system is prepared as described in Subsection 3J.4.2.1
and as shown in Figure 3J-1 and Figure 3J-2. Critical variables are the length of pipe, type of end
condition, distance of pipe from structure and location of the pipe whip restraint. The pipe whip
restraint is located as near as practical to the ruptured end of the pipe, but so as to minimize
interference to in-service inspection.
3J.3.3 Piping Dynamic Analysis
The Pipe Dynamic Analysis (PDA) computer program is run using the following input:
• The information from the simplified piping model, including pipe length, diameter, wall thickness
and pipe whip restraint location.

3-1474 Revision 0October 2015
Fermi 3Updated Final Safety Analysis Report
• Piping information such as pipe material type, stress/strain curve and pipe material mechanical
properties.
• Pipe whip restraint properties such as force-deflection data and elastic plastic displacements.
• Force time-history of the thrust at the pipe rupture location.
3J.3.4 Selection of Pipe Whip Restraint for Pipe Whip Restraint Analysis
PDA provides displacements of pipe and pipe whip restraint, pipe whip U-bar strains, pipe forces
and moments at fixed end, time at peak load and lapsed time to achieve steady state using thrust
load and pipe characteristics.
The displacements at the pipe broken end and at the pipe whip restraint are checked and the loads
on the piping and the strains of pipe whip restraint U-bars are compared to allowable loads and
strains. If the output results are not satisfactory, PDA is rerun with different pipe whip restraint
parameters.
3J.4 PIPE RUPTURE EVALUATION
3J.4.1 General Approach
There are several analytical approaches that may be used in analyzing the pipe/pipe whip restraint
system for the effects of pipe rupture. This procedure defines two acceptable approaches.
1. Dynamic Time-History Analysis With Simplified Model - A dynamic time history analysis of a portion of a piping system may be performed in lieu of a complete system analysis when it can be shown to be conservative by test data or by comparison with a more complete system analysis. For example, in those cases where pipe stresses in the containment penetration region need not be calculated, it is acceptable to model only a portion of the piping system as a simple cantilever with a fixed or pinned end or as a beam with both ends fixed or with one end pinned and one end fixed.
When a circumferential break is postulated, the pipe system is modeled as a simple
cantilever, the thrust load is applied opposite the fixed (or pinned) end and the pipe whip
restraint acts between the fixed (or pinned) end and the thrust load. It is then assumed that
deflection of the pipe is in one plane. As the pipe moves a resisting bending moment in the
pipe is created and later a restraining force at the pipe whip restraint. Pipe movement stops
when the resisting moments about the fixed (or pinned) end exceed the applied thrust
moment.
When a longitudinal break is postulated, the pipe system has both ends supported. To
analyze this case, two simplifications are made to allow the use of the cantilever model
described above. First, an equivalent point mass is assumed to exist at D (Figure 3J-2)
instead of pipe length DE. The inertia characteristics of this mass, as it rotates about point
B, are calculated to be identical to those of pipe length DE, as it rotates about point E.
Second, an equivalent resisting force is calculated (from the bending moment-angular

3-1475 Revision 0October 2015
Fermi 3Updated Final Safety Analysis Report
deflection relationships for end DE) for any deflection for the case of a built-in end. This
equivalent force is subtracted from the applied thrust force when calculating the net energy.
See Figure 3J-1 and Figure 3J-2 for the models described above.
2. Dynamic Time-History Analysis with Detailed Piping Model—In many cases it is necessary to calculate stresses in the ruptured pipe at locations remote from the pipe whip restraint location. For example, the pipe in the containment penetration area must meet the limits of SRP 3.6.2. In these cases it is required that the ruptured piping, the pipe supports, and the pipe whip restraints be modeled in sufficient detail to reflect their dynamic characteristics. A time-history analysis using the fluid forcing functions at the point of rupture and the fluid forcing functions of each pipe segment is performed to determine deflections, strains, loads to structure and equipment and pipe stresses.
3J.4.2 Procedure For Dynamic Time-History Analysis With Simplified Model
3J.4.2.1 Modeling of Piping System
For many piping systems, required information on the response to a postulated pipe rupture can be
determined by modeling a portion of the piping system as a cantilever with either a fixed or pinned
end. The fixed end model, as shown in Figure 3J-1, is used for piping systems where the stiffness
of the piping segment located between A and B is such that the slope of the pipe length, BD, at B,
would be approximately zero. The pinned end model, as shown in Figure 3J-1, is used for piping
systems where the slope of the pipe length, BD, at B, is much greater than zero. The pinned end
model is also used whenever it is not clear that the pipe end is fixed.
A simplified cantilever model may also be used for a postulated longitudinal break in a pipe
supported at both ends, as shown in Figure 3J-2. The pipe can have both ends fixed or have pinned
end at B and a fixed end at E, as shown in Figure 3J-2. Subsection 3J.4.1(1) discusses the
simplification techniques used to allow the use of a cantilever model. A fixed end is used when
rotational stiffness of the piping at that location is such that the slope of the pipe at that end is
approximately zero. A pinned end is used when the pipe slope at that end is much greater than
zero. If it is not clear whether an end is fixed or pinned, the end condition giving more conservative
results should be assumed.
The pipe whip restraint is modeled as two components acting in series; the restraint itself and the
structure to which the restraint is attached. The restraint and piping behave as determined by an
experimentally or analytically determined force-deflection relationship. The structure deflects as a
simple linear spring of representative spring constant.
The model must account for the maximum clearance between the restraint and the piping. The
clearance is equal to the maximum distance from the pipe during normal operation to the position of
the pipe when the pipe whip restraint starts picking up the rupture load. This simplified model is not
used if the piping has snubbers or restraints strong enough to affect the pipe movement following a
postulated rupture.

3-1476 Revision 0October 2015
Fermi 3Updated Final Safety Analysis Report
3J.4.2.2 Dynamic Analysis of Simplified Piping Model
When the thrust force (as defined in Subsection 3.6.2.2) is applied at the end of the pipe, rotational
acceleration would occur about the fixed (or pinned) end. As the pipe moves, the net rotational
acceleration would be reduced by the resisting bending moment at the fixed end and by the
application of the restraining force at the pipe whip restraint. The kinetic energy would be absorbed
by the deflection of the restraint and the bending of the pipe. Movement would continue until
equilibrium is reached. The primary acceptance criteria is the pipe whip restraint deflection or strain
must not exceed the design strain limit of 50% of the restraint material ultimate uniform strain
capacity.
The analysis may be performed by a general purpose computer program with capability for
nonlinear time-history analysis such as ANSYS, or by a special purpose computer program
especially written for pipe rupture analysis such as the GE computer program, “Pipe Dynamic
Analysis”.
3J.4.3 Procedure For Dynamic Time-History Analysis Using Detailed Piping Model
3J.4.3.1 Modeling of Piping System
In general, the rules for modeling the ruptured piping system are the same as the modeling rules
followed when performing seismic/dynamic analysis of Seismic Category I piping. These rules are
outlined in Subsection 3.7.3.3. The piping, pipe supports and pipe whip restraints are modeled in
sufficient detail to reflect their dynamic characteristics. Inertia and stiffness effects of the system
and gaps between piping and the restraints must be included.
If the snubbers or other seismic restraints are included in the piping model they should be modeled
with the same stiffness used in the seismic analysis of the pipe. However, credit for seismic
restraints cannot be taken if the applied load exceeds the Level D rating.
The pipe whip restraints are modeled the same as for the simplified model described in
Subsection 3J.4.2.1. For piping designed with the GE U-Bar pipe whip restraints, the selected size
and dimensions, and the resulting force-deflection and elastic/plastic stiffness are first determined
according to the procedure previously defined in Section 3J.3.
3J.4.3.2 Dynamic Analysis using Detail Piping Model
The pipe break nonlinear time-history analysis can be performed by ANSYS or other NRC
approved non-linear computer programs. The force time histories acting at the break location and in
each of the segments of the ruptured pipe are determined according to the criteria defined in
ANS 58.2. The time step used in the analysis must be sufficiently short to obtain convergence of the
solution. GE has shown that for a rupture of the main steam pipe a time step of 0.001 second is
adequate for convergence. The analysis must not stop until the peaks of the dynamic load and the
pipe response are over.

3-1477 Revision 0October 2015
Fermi 3Updated Final Safety Analysis Report
The primary acceptance criteria are:
• The piping stresses between the primary containment isolation valves are within the allowable
limits specified in Subsection 3.6.2.1.
• The pipe whip restraint loads and displacements due to the postulated break are within the
design limits.
• Specified allowable loads on safety-related valves or equipment to which the ruptured piping is
attached are not exceeded.
3J.5 JET IMPINGEMENT ON SAFETY-RELATED PIPING
Postulated pipe ruptures result in a jet of fluid emanating from the rupture point. Safety-related
systems and components require protection if they are not designed to withstand the results of the
impingement of this jet. Subsection 3.6.2.3.1 provides the criteria and procedure for:
(1) defining the jet shape and direction
2. defining the jet impingement load, temperature and impingement location
3. analysis to determine effects of jet impingement on safety-related equipment
The paragraphs below provide some additional criteria and procedure for the analysis required to
determine the effects of jet impingement on piping.
• Jet impingement is a faulted load and the primary stresses it produces in the piping must be
combined with the stresses caused by safe shutdown earthquake (SSE) to meet the faulted
stress limits for the designated ASME class of piping.
• If a pipe is subjected to more than one jet impingement load, each jet impingement load is
applied independently to the piping system and the load which supplies the largest bending
moment at each node is used for evaluation.
• A jet impingement load may be characterized as a two part load applied to the piping system—a
dynamic portion when the applied force varies with time and a static portion which is considered
steady state.
For the dynamic load portion, when static analysis methods are used, a dynamic load factor of two
is applied. Snubbers are assumed to be activated. Stresses produced by the dynamic load portion
are combined by SRSS with primary stresses produced by SSE.
For the static load portion, snubbers are not activated and stresses are combined with SSE
stresses by absolute sum.

3-1478 Revision 0October 2015
Fermi 3Updated Final Safety Analysis Report
Figure 3J-1 Simplified Piping Models

3-1479 Revision 0October 2015
Fermi 3Updated Final Safety Analysis Report
Figure 3J-2 Representation of Pipe With Both Ends Supported With a Longitudinal Break
ESBWR Design Control Document/Tier 2
Figure 3J-2. Representation of Pipe With Both Ends Supported With a Longitudinal
Break

3-1480 Revision 0October 2015
Fermi 3Updated Final Safety Analysis Report
Appendix 3K RESOLUTION OF INTERSYSTEM LOSS-OF-COOLANT-ACCIDENT
3K.1 INTRODUCTION
An Intersystem Loss-of-Coolant-Accident (ISLOCA) is postulated to occur when a series of failures
or inadvertent actions occur that allow the high pressure from one system to be applied to the low
design pressure of another system, which could potentially rupture the pipe and release coolant
from the reactor system pressure boundary. This may also occur within the high and low pressure
portions of a single system. Future advanced light water reactor (ALWR) designs like the ESBWR
are expected to reduce the possibility of a loss-of-coolant-accident (LOCA) outside the containment
by designing to the extent practicable all piping systems, major system components (pumps and
valves), and subsystems connected to the reactor coolant pressure boundary (RCPB) to an
ultimate rupture strength (URS) at least equal to the full RCPB pressure. The general URS criteria
was recommended by Reference 3K-1 and the NRC Staff recommended specific URS design
characteristics by Reference 3K-2.
3K.2 REGULATORY POSITIONS
In SECY-90-016 and SECY-93-087 (References 3K-3 and 3K-4), the NRC staff resolved the
ISLOCA issue for ALWR plants by requiring that low-pressure piping systems that interface with the
RCPB be designed to withstand reactor pressure to the extent practicable. However, the staff
believes that for those systems that have not been designed to withstand full reactor pressure,
evolutionary ALWRs should provide (1) the capability for leak testing the pressure isolation valves,
(2) valve position indication that is available in the control room when isolation valve operators are
de-energized and (3) high-pressure alarms to warn main control room operators when rising reactor
pressure approaches the design pressure of attached low-pressure systems or when both isolation
valves are not closed. The staff noted that for some low-pressure systems attached to the RCPB, it
may not be practical or necessary to provide a higher system ultimate pressure capability for the
entire low-pressure connected system. The staff will evaluate such exceptions on a case-by-case
basis during specific design certification reviews.
GE provided a proposed implementation of the issue resolution for the Advanced Boiling Water
Reactor (ABWR) in Reference 3K-5 and again in Reference 3K-6. The staff in the Civil Engineering
and Geosciences Branch of the Division of Engineering completed its evaluation of the Reference
3K-5 proposal. Specifically, as reported by Reference 3K-2 and summarized below, the staff has
evaluated the minimum pressure for which low-pressure systems should be designed to ensure
reasonable protection against burst failure should the low-pressure system be subjected to full
RCPB pressure.
The design pressure for the low-pressure piping systems that interface with the RCPB should be
equal to 0.4 times the normal operating RCPB pressure, the minimum wall thickness of
low-pressure piping should be no less than that of a standard weight pipe, and that Class 300
valves are adequate. The design is to be in accordance with the ASME Boiler and Pressure Vessel

3-1481 Revision 0October 2015
Fermi 3Updated Final Safety Analysis Report
Code, Section III, Subarticle NC/ND-3600. Furthermore, the staff will continue to require periodic
surveillance and leak rate testing of the pressure isolation valves via Technical Specifications, as a
part of the in-service inspection program.
3K.3 BOUNDARY LIMITS OF ULTIMATE RUPTURE STRENGTH
Guidance given by Reference 3K-3 provides provision for applying practical considerations for the
extent to which systems are designed to the URS design pressure. The following items form the
basis of what constitutes practicality and set forth the test of practicality used to establish the
boundary limits of URS for the ESBWR:
• It is impractical to consider a disruptive open flow path from reactor pressure to a low pressure
sink. A key assumption to understanding the establishment of the boundary limits from this
practicality basis is that only static pressure conditions are considered. Static conditions are
assumed when the valve adjacent to a low pressure sink remains closed. Thus, the dynamic
pressurization effects accompanied by violent high flow transients and temperature escalations
which would occur if the full RCPB pressure was connected directly to the low pressure sink, are
precluded. As a consequence, the furthest downstream valve in such a path is assumed closed,
so that essentially all of the static reactor coolant system pressure is contained by the piping in
the URS-designed region.
• It is impractical to design or construct large tank structures to the URS design pressure that are
vented to atmosphere and have a low design pressure.
• It is impractical to design piping systems that are connected to low pressure sink features to the
URS design pressure when the piping is always locked open to a low pressure sink by locked
open valves. These piping sections are extensions of the low pressure sink and need no greater
design pressure than the low pressure sink to which they are connected.
3K.4 EVALUATION PROCEDURE
The pressures of each system piping boundary in the ESBWR design are reviewed to ensure URS
protection is provided. Where low pressure piping interfaces with higher pressure piping at reactor
pressure, design pressures are at least equal to the URS design pressure. The low pressure piping
boundaries are designed to URS pressures and extend to the last closed valve connected to piping
interfacing a low pressure sink.
3K.5 SYSTEMS EVALUATED
The following systems, interfacing directly with the RCPB, are evaluated.
• Control Rod Drive system Section 4.6
• Standby Liquid Control (SLC) system Section 9.3
• Reactor Water Cleanup/Shutdown Cooling (RWCU/SDC) system Section 5.4
• Fuel and Auxiliary Pools Cooling System (FAPCS) Section 9.1

3-1482 Revision 0October 2015
Fermi 3Updated Final Safety Analysis Report
• Nuclear Boiler System (NBS) Section 5.1
• Condensate and Feedwater System (C&FS) Section 10.4
Attachment 3KA contains a system-by-system evaluation of potential reactor pressure application
to piping and components, discusses the URS boundary and lists the URS-designed components.
For some systems, certain regions of piping and components not designed to URS design pressure
are also listed.
3K.6 PIPING DESIGN PRESSURE FOR ULTIMATE RUPTURE STRENGTH COMPLIANCE
Guidelines for URS compliance were established by Reference 3K-2, which concluded that for the
ESBWR:
• The design pressure for the low-pressure piping systems that interface with the RCPB pressure
boundary should be equal to 0.4 times the normal operating RCPB pressure.
• The minimum wall thickness of the low-pressure piping should be no less than that of a standard
weight pipe.
3K.7 APPLICABILITY OF ULTIMATE RUPTURE STRENGTH FOR NON-PIPING COMPONENTS
Reference 3K-2 also provides the NRC Staff's position that:
1. The remaining components in the low-pressure systems should also be designed to a design pressure of 0.4 times the normal operating reactor pressure. The components include flanges, pump seals, etc.
2. A Class 300 valve is adequate for ensuring the pressure of the low-pressure piping system under full reactor pressure. The rated working pressure for Class 300 valves varies widely depending on material and temperature (ASME/ANSI B16.34).
3K.8 RESULTS
The results of this work are incorporated into the ESBWR system design.
3K.9 VALVE MISALIGNMENT DUE TO OPERATOR ERROR
The ESBWR design with the ISLOCA ultimate rupture strength applied for the boundary described
by this appendix and its attachment extends the increased design pressure (ultimate rupture
strength) over the full extent of regions that could potentially experience reactor pressure, so that
operator misaligned valves will not expose piping not designed to the URS pressure to reactor
pressure.
3K.10 SUMMARY
Based on the NRC staff's new guidance cited in References 3K-1 through 3K-4, the ESBWR is in
full compliance. For ISLOCA considerations, design pressures of at least the URS design pressure
and pipe having a minimum wall thickness equal to standard grade provide adequate margin with

3-1483 Revision 0October 2015
Fermi 3Updated Final Safety Analysis Report
respect to the full reactor operating pressure, by applying the guidance recommended by
Reference 3K-2. This design pressure is applied to low pressure piping at the applicable
boundaries, therefore imposing the requirement on the associated piping, valves, pumps, tanks,
instrumentation and other equipment within the boundaries. Piping has a minimum wall thickness
equal to standard grade and valves with a design pressure of at least the URS design pressure are
required to be a minimum of Class 300.
3K.11 REFERENCES
3K-1 Dino Scaletti, NRC, to Patrick Marriott, GE, “Identification of New Issues for the General Electric Company Advanced Boiling Water Reactor Review,” September 6, 1991.
3K-2 Chester Poslusny, NRC, to Patrick Marriott, GE, “Preliminary Evaluation of the Resolution of the Intersystem Loss-of-Coolant Accident (ISLOCA) Issue for the Advanced Boiling Water Reactor (ABWR) - Design Pressure for Low-Pressure Systems,” December 2, 1992, Docket No. 52-001.
3K-3 James M. Taylor, NRC, to The Commissioners, SECY-90-016, “Evolutionary Light Water Reactor (LWR) Certification Issues and Their Relationship to Current Regulatory Requirements,” January 12, 1990.
3K-4 James M. Taylor, NRC, to The Commissioners, SECY-93-087, “Policy, Technical, and Licensing Issues Pertaining to Evolutionary and Advanced Light-Water Reactor (ALWR) Designs,” April 2, l993.
3K-5 Jack Fox, GE, to Chet Poslusny, NRC, “Proposed Resolution of ISLOCA Issue for ABWR,” October 8, 1992.
3K-6 Jack Fox, GE, to Chet Poslusny, NRC, “Resolution of Intersystem Loss of Coolant Accident for ABWR,” April 30, 1993.

3-1484 Revision 0October 2015
Fermi 3Updated Final Safety Analysis Report
Attachment 3KA ULTIMATE RUPTURE STRENGTH SYSTEM BOUNDARY EVALUATION
3KA.1 CONTROL ROD DRIVE SYSTEM
3KA.1.1 System URS Boundary Description
The Control Rod Drive (CRD) system interfaces with the reactor in a manner that makes low
pressure piping over pressurization very unlikely. The minimum failure path from the reactor to the
low pressure piping has three check valves in series. This path is from the purge flow channels of
the CRD, out through the first check valve in the CRD housing, through the purge supply line that
has the second check valve, and to the pump discharge check valve. An alternate path through the
accumulator charging line has additionally the normally closed scram valve, and this path is less
likely for failure and therefore not considered. The path from the pump discharge, back through the
pump to its suction, and back through the suction lines to the condensate storage tank (CST) or the
condensate feedwater source is an open path. The pump suction is through the pump suction filters
in the normal mode of operation and through the suction filter bypass lines during the reactor high
pressure makeup mode of operation. The CRD pumps run continuously while the reactor is at
operating pressure, which prevents reactor pressure from reaching the low pressure piping except
for the unlikely case when both CRD pumps have failed. Therefore, an ISLOCA condition could
only occur when three check valves in series fail open at the same time both CRD pumps have
failed. The ISLOCA guidelines do not provide credit for this rare condition, so the low pressure
piping is designed to the URS design pressure over the entire low pressure piping region of the
CRD system. The suction path through the Condensate Storage and Transfer System (CS&TS) to
the CST from the CRD interface is an open path and is not designed to URS design pressure. The
primary suction path to the C&FS has a check valve in the path, and the design pressure up to and
including the check valve is the URS design pressure.
The normal key assumption, as stated in the Boundary Limits in Section 3K.3 above, that the valve
adjacent to a low pressure sink remains closed, means that the pump discharge check valve
remains closed as a given. However, this valve is in the high-pressure piping, which is unique for
the CRD system according to this accepted line of reasoning. The low-pressure piping is not
required to be designed to URS design pressure because it would not experience the high reactor
pressure. However, the low-pressure piping is designed to the URS design pressure based on the
guidance that states “for all interfacing systems and components which do not meet the full URS
criteria, justification is required, which must include engineering feasibility; not solely a risk benefit
analysis.” Designing the low-pressure piping to the URS design pressure is feasible and is done.
3KA.1.2 Downstream Interfaces
Other systems are listed below that interface with the CRD system and could possibly be exposed
to reactor pressure. A description of the interface location and a statement of its applicability to
ISLOCA are given.
3-1485 Revision 0October 2015
Fermi 3Updated Final Safety Analysis Report
• RWCU/SDC system at the output of the CRD pump discharge filter units. The RWCU/SDC
design pressure exceeds the URS design pressure.
• NBS at the output of the CRD pump discharge filter units. The NBS design pressure exceeds
the URS design pressure.
• CS&TS provides an alternate source of water for the CRD system if the C&FS is not available.
Its interfaces with the CRD system are located at pump suction from and system return to the
CST. This line cannot be pressurized because of the open communication to the CST, and the
CST is vented to atmosphere. There is no source to pressurize the CS&TS line because of
closed pump discharge check valves in the CRD URS region.
• C&FS provides a source of water for the CRD pump suction from the turbine building
condensate supply. This system is expected to be an open path to a large source similar to
CS&TS. Because of the open path, the piping is not considered practical for designing to the
URS design pressure.
• Process Sampling System (PSS) at the output of the CRD pump discharge filter units. The PSS
design pressure exceeds the URS design pressure.
3KA.1.3 Low-Pressure Piping Systems and Components Designed to URS Pressure
The following is a listing of low-pressure piping systems and components within CRD that are
designed to the minimum URS design pressure of 2.82 MPaG (409 psig) based on the ISLOCA
considerations outlined in Appendix 3K.
Pipeline/Component Description (see Figure 4.6-8):
CRD Pump Suction Piping and Associated Components
3KA.2 SANDBY LIQUID CONTROL SYSTEM
3KA.2.1 System URS Boundary Description
The SLC system is a high pressure system which injects enriched sodium pentaborate solution
inside the reactor through normally closed squib valves. The leakage path includes two check
valves in series in addition to a redundant set of normally closed pyrotechnic-type squib valves. The
entire SLC system is designed for pressure higher than reactor pressure except the low pressure
section from piston pump suction to open mixing drum used for preparation of sodium pentaborate
solution. Instrumentation, pressure relief, drain piping and valving are designed to higher than URS
design criteria to reduce the level of pressure challenge to these components.
3KA.2.2 Downstream interfaces
The SLC system has no further downstream system interfaces that could possibly be exposed to
reactor pressure.

3-1486 Revision 0October 2015
Fermi 3Updated Final Safety Analysis Report
3KA.2.3 Low Pressure Piping Systems and Components Designed to URS Pressure
None.
3KA.3 REACTOR WATER CLEANUP/SHUTDOWN COOLING SYSTEM
3KA.3.1 System URS Boundary Description
The RWCU/SDC system is a high pressure system that is designed above the URS pressure. Low
pressure piping connected to the condenser and the liquid waste management system at the
downstream of the overboarding line isolation valves is designed to URS design pressure. On the
upstream side of the isolation valves, there is a pressure reducing control valve that reduces the
pressure before the flow enters the low pressure piping.
3KA.3.2 Downstream Interfaces
Other systems are listed below that interface with RWCU/SDC system and could possibly be
exposed to reactor pressure. A description of the interface location and a statement of its
applicability to ISLOCA are given.
• FAPCS interfacing piping from the reactor well at the upstream of the Train B of RWCU/SDC
system non-regenerative heat exchanger has two locked closed isolation valves in series and
the piping provides an open free path to reactor well which is an atmospheric pressure pool.
• FAPCS Low Pressure Coolant Injection (LPCI) interfacing piping with Train B of RWCU/SDC
system return piping to Feedwater Line A is designed to a pressure that is above the URS
pressure.
• CRD system interfacing piping with Train A of RWCU/SDC system return piping to Feedwater
Line B is designed to a pressure that is above the URS pressure.
3KA.3.3 Low-Pressure Piping Systems and Components Designed to URS Pressure
The RWCU/SDC system low pressure piping connected at the downstream side of the
overboarding line isolation valves is designed to URS pressure so that the stresses do not exceed
the allowable stresses if the piping is subjected to full reactor pressure.
3KA.4 FUEL AND AUXILIARY POOLS COOLING SYSTEM
3KA.4.1 System URS Boundary Description
FAPCS is a low pressure piping system. The FAPCS connects to the RWCU/SDC system at three
locations.
LPCI Connections
Its LPCI line is connected to RWCU/SDC system Loop B discharge line, which has an interface with
the RCPB via the Feedwater Loop A discharge line (Figure 9.1-1). During reactor power operation,
an unisolated break outside the RCPB could lead to an ISLOCA with the release of reactor coolant

3-1487 Revision 0October 2015
Fermi 3Updated Final Safety Analysis Report
from the reactor system pressure boundary. In the FAPCS case, it would require multiple failures
before a LOCA could occur, i.e., a break in the FAPCS piping plus failures of the two check valves,
which maintain the RCPB.
Containment Cooling Supply Header Connection
The FAPCS has a containment cooling supply header that provides GDCS pool return, suppression
pool return, and drywell spray. This header is connected to the RWCU/SDC Loop A discharge line,
which has an interface with the RCPB via the Feedwater Loop B discharge line (Figures 9.1-1 and
5.1-4). This connection supports post-LOCA shutdown cooling. When aligned to the reactor
pressure vessel (RPV) during operational modes, the RWCU/SDC system operates at pressures
higher than the FAPCS design pressure.
Suppression Pool Suction Line Connection
The suppression pool suction line is connected to the RWCU/SDC mid-vessel suction line, which
interfaces directly with the RPV (Figures 9.1-1 and 5.1-4). This connection supports post-LOCA
shutdown cooling. When aligned to the RPV during operational modes, the RWCU/SDC system
operates at pressures higher than the FAPCS design pressure.
3KA.4.2 Downstream Interfaces
LPCI Line Interface
The following design features are provided to the interface between the high and low pressure
interfaces to prevent an intersystem LOCA from occurring in FAPCS piping:
• Normally closed isolation valves are provided on the LPCI line to separate the low pressure
FAPCS piping from the high pressure condition in the RWCU/SDC pipe during reactor power
operation.
• Valve position lights are provided to the operator in the main control room to confirm these
isolation valves in the closed positions.
• The isolation valves are provided with a reactor pressure interlock that closes these valves and
prevents them from opening whenever a high reactor pressure signal from the NBS is present.
Reactor pressure signals ensure high reliability that the isolation valves remain closed.
• The FAPCS LPCI pipe and components between its interface with RWCU/SDC system and the
second isolation valve, including the isolation valve, are Quality Group B components designed
to above URS pressure.
Containment Cooling Supply Header and FAPCS Suppression Pool Suction Line Interfaces
Each of the connection lines associated with these interfaces contains a normally closed manual
isolation valve and a blind spectacle flange to eliminate the possibility for overpressurization from

3-1488 Revision 0October 2015
Fermi 3Updated Final Safety Analysis Report
the RWCU/SDC system Train A during all normal plant modes. This connection is only manually
opened in the unlikely event of a LOCA with fuel damage.
3KA.4.3 Low-Pressure Piping Systems and Components Designed to URS Pressure
The low pressure side of LPCI line and the rest of FAPCS piping are not required to be designed to
the URS pressure because they are properly protected by the interlock closed isolation valves
described above and by a relief valve installed on the LPCI line that protects the line from the
overpressure condition, in case of leakage from the RWCU/SDC system side through the isolation
valves.
3KA.5 NUCLEAR BOILER SYSTEM
3KA.5.1 System URS Boundary Description
The Main Steam (MS) and Feedwater (FW) piping and instrumentation are designed for reactor
pressure.
3KA.5.2 Downstream Interfaces
Other systems are listed below that interface with the Nuclear Boiler System (NBS) and could
possibly be exposed to reactor pressure. A description of the interface location and a statement of
its applicability to ISLOCA are given.
• The outlet of the CRD pump discharge filter units provide flow to the NBS. The CRD design
pressure exceeds the URS design pressure.
• RWCU/SDC provides high pressure return flow to the FW lines. The RWCU/SDC design
pressure exceeds the URS design pressure.
• The Isolation Condenser system connects to a piping stub that connects the Depressurization
Valves to the RPV, and also there are isolation condenser vent lines that connect to the main
steamlines. The isolation condenser design pressure exceeds the URS design pressure.
3KA.5.3 Low-Pressure Piping Systems and Components Designed to URS Pressure
None.
3KA.6 CONDENSATE AND FEEDWATER SYSTEM
3KA.6.1 System URS Boundary Description
The feedwater subsystem of the C&FS provides high pressure feedwater to the reactor. The
feedwater subsystem is designed for high pressure except for the feedwater pump suction and the
outlet of the feedwater cleanup valve.
In the feedwater pump, the transition to low pressure occurs from the feedwater pump suction into
the direct contact feedwater heater (feedwater tank). The feedwater tank is a low pressure sink. The
last closed valve in the path from the reactor is the feedwater pump discharge check valve. The

3-1489 Revision 0October 2015
Fermi 3Updated Final Safety Analysis Report
piping to the feedwater pump suction can remain below the URS design pressure because it
connects to the low pressure sink feedwater tank. The maintenance block valves in the feedwater
pump suction lines are locked open.
In the feedwater cleanup control valve, the transition to low pressure occurs from the feedwater
cleanup control valve outlet connection into the condenser shell (hotwell). The hotwell is a low
pressure sink. The last closed valve in the path from the reactor in the feedwater cleanup control
valve is the normally closed block valve. The piping from the feedwater cleanup control valve to the
condenser can remain below the URS design pressure because it connects to the low pressure
sink hotwell.
The Condensate subsystem of the C&FS provides condensate to the feedwater tank, and the
condensate subsystem is designed for a pressure higher than the feedwater tank, except for the
condensate pump suction. The high pressure design includes the condensate polishing (filters and
demineralizers) units and the feedwater bypass valve. The transition to low pressure occurs from
the condensate suction into the High Pressure condenser shell (hotwell, which is a low pressure
sink). The last closed valve in the path from the feedwater tank is the condensate pump discharge
check valve. The piping to the condensate pump suction can remain below the feedwater tank
design pressure because it connects the low pressure sink hotwell. The maintenance block valves
in the condensate pump suction lines are locked open.
3KA.6.2 Downstream Interfaces
None.
3KA.6.3 Low-Pressure Piping Systems and Components Designed to URS Pressure
The maintenance block valves in the condensate pump suction lines are locked open.

3-1490 Revision 0October 2015
Fermi 3Updated Final Safety Analysis Report
Appendix 3L REACTOR INTERNALS FLOW INDUCED VIBRATION PROGRAM
3L.1 INTRODUCTION
A flow-induced vibration (FIV) analysis and testing program of the reactor internal components of
the ESBWR initial plant demonstrates that the ESBWR internals design can safely withstand
expected FIV forces for reactor operating conditions up to and including 100% power and core flow.
The ESBWR FIV program is considered to be a prototype per Reference 3L-1. This will require
analysis, measurement and full inspection of reactor internals of the first plant. The ESBWR
internals are similar to the Advanced Boiling Water Reactor (ABWR) internals; therefore, analyses
and measurements from the ABWR FIV program are used to the extent possible. The ESBWR FIV
program includes an initial evaluation phase that has the objective of demonstrating that the reactor
internals are not subject to FIV issues that can lead to failures due to material fatigue. Throughout
this part of the program, the emphasis is placed on demonstrating that the reactor components will
safely operate for the design life of the plant. The results of this evaluation are shown in Reference
3L-1. This evaluation does not include the steam dryer since it is separately evaluated in
References 3L-5, 3L-6, and 3L-8; however, an overview of the steam dryer evaluation program is
explained in Section 3L.4. The second phase of the program is focused on preparing and
performing the startup test program that demonstrates through instrumentation and inspection that
no FIV problems exist. This part of the program meets the requirements of Regulatory Guide 1.20
with the exception of those requirements related to preoperational testing that are not applicable to
a natural circulation plant.
3L.2 REACTOR INTERNAL COMPONENTS FIV EVALUATION
The ESBWR reactor internals are part of an evolutionary Boiling Water Reactor (BWR) design, but
fundamentally the components and function of the reactor vessel and internals are very similar to
past BWRs. To a large extent, the ESBWR design of the components relies heavily on the prior
design of internals in operating plants to assure that new vibration issues are not introduced. Also,
to assure that the flow of steam or water in the reactor vessel is comparable to prior reactors, efforts
were made to maintain traditional spacing and dimensional relationships of components. A unique
feature of the ESBWR, with respect to FIV, is the fact that ESBWR is a natural circulation plant
where no recirculation pumps exist that would create pressure pulses from the pump vanes that
would travel into the reactor vessel. The recirculation pump’s excitation has caused failures in
components inside previous BWR reactor vessels. For the ESBWR this source of flow excitation
does not exist. The ESBWR reactor internals are shown in Figure 5.3-3.
3L.2.1 Evaluation Process – Part 1
The first step in the evaluation process was to establish selection criteria for reactor internal
components related to susceptibility to vibration. All reactor internal components were considered
3-1491 Revision 0October 2015
Fermi 3Updated Final Safety Analysis Report
as potential candidates for further evaluation. Each component is evaluated against the following
selection criteria:
• Is the component safety-related?
• Is the component of a significantly different or new design compared to earlier BWRs?
• Does the component have a history of FIV-related problems?
• Is the component subjected to significantly different or new flow conditions?
Based on these criteria, the following internal component structures are considered to be
candidates for additional evaluation and potential to be instrumented in the startup FIV test
program:
• Steam Dryer Bank Hoods and End Plates based on history of past FIV-related problems (e.g.,
fatigue cracking between hood and endplate).
• Steam Dryer Skirt based on history of past FIV-related problems (e.g., fatigue cracking between
skirt and drain channels).
• Steam Dryer Drain Channels based on history of FIV-related problems (e.g., fatigue cracking
between skirt and drain channels).
• Steam Dryer Support Ring based on history of FIV-related problems (e.g., steam dryer rocking).
• Chimney Assembly based on new design features (i.e., elongated Chimney Shell, Partition
Assembly, Chimney Restraint), potential new flow conditions and limited ability to change the
design due to dimensional and performance constraints.
• Chimney Head/Steam Separator assembly based on new design (i.e., shallow dished head or
flat head with beam reinforcement, elongated standpipes and thinner stack materials).
• Shroud/Chimney Assembly based on new design features (see Figure 3.9-8), and potential new
flow conditions.
• Standby Liquid Control (SLC) internal piping based on new design routed through the shroud
and is safety-related.
Components that were evaluated and concluded to require no further evaluation:
• Control Rod Drive Housings
• Control Rod Guide Tubes
• In-Core Monitor Guide Tubes
• In-Core Monitor Housings
For each of these components, the length of the component has decreased from prior BWR product
lines due to the plant having shorter fuel. This increases the natural frequencies for these
components and moves the natural frequencies beyond the predominant frequencies measured at
the prototype ABWR plant. Also, the flow velocities in the reactor pressure vessel (RPV) bottom

3-1492 Revision 0October 2015
Fermi 3Updated Final Safety Analysis Report
head region have decreased and the calculated vortex shedding frequencies are well below the
natural frequencies of the components in this region.
Other components such as the top guide and core plate that are not specifically identified as
candidates for the instrumentation program are basically proven by trouble-free BWR experience,
and have designs and flow conditions that are similar to prior operating BWR plants. Because most
of the reactor internal components are large durable components where there has been no history
of FIV issues, no FIV issues are anticipated. Also, because it is still early in the program, there is
still the opportunity to make adjustments as necessary in the component designs to make them
more resistant to FIV.
The results of the Part 1 evaluation are contained in Reference 3L-1.
The chimney assembly was a new component where only limited operating experience was
available. Also, the chimney assembly is a structure where the geometry of the partitions places
limitations on the plate thicknesses, has a long extended length, and is subject to high velocity
two-phase steam flow. From this initial selection, a test and analysis program was established and
the results are discussed in Subsection 3L.3.3. For this case, testing was required since no prior
relevant test data was available for this component.
A steam dryer initial assessment was performed to study the acoustic and flow effects of the
ESBWR configuration in comparison to the ABWR steam dryer design. The initial assessment
determined that the increase in the size of the steam dryer support ring and skirt design and the
increase in steam velocity did not have any adverse effects on the steam dryer structural integrity.
However, at the time of the initial assessment, it was also recognized that the evaluation of BWR
operating plant steam dryer loads was an ongoing program that would need to be ultimately
factored into the ESBWR steam dryer design and evaluation effort. The progress of the
replacement steam dryer program is now at a stage that a meaningful effort can now be planned for
the ESBWR steam dryer. The detailed program that is planned is described in Section 3L.4. As a
result of the advances in the understanding of steam dryer vibration, differential pressure loads and
steam dryer design improvements (see Subsection 3L.2.3), the ESBWR uses a steam dryer design
patterned after the ABWR and replacement steam dryer designs developed for BWR plants.
The SLC internal piping is based on a new design and is safety-related. The SLC line is in the
downcomer flow field and is subject to vortex shedding flow induced vibration. The vibration
characteristics of the SLC internal piping is evaluated as described in Subsection 3L.5.5.1.4. The
SLC line is instrumented as part of the startup test program as shown in Table 3L-4.
3L.2.2 Evaluation Process – Part 2
The next phase of the evaluation program performed additional work to demonstrate the adequacy
of the components where Part 1 determined additional evaluations were required. The objective of
this phase completes a more quantitative evaluation and documents the existing facts regarding the
individual components. This part of the evaluation focuses on the following:

3-1493 Revision 0October 2015
Fermi 3Updated Final Safety Analysis Report
1. Similarities and differences of the ESBWR component design configurations as compared to prior designs. In most cases the comparison design is ABWR components.
2. A review of prior calculations for the components being evaluated, to establish the mode shapes and natural frequencies. Calculation of the ESBWR component natural frequencies is determined based on this data.
3. Prior plant startup instrumentation data from the prototype ABWR plant is reviewed to establish the magnitude and frequency of the measured vibration data, and to review the resulting calculated stress for the components that were instrumented.
4. A comparison of the flow paths and characteristics of the ESBWR design to prior BWR designs where a startup vibration test program was conducted.
Using the results of the above items, an assessment as to the likelihood of FIV issues is completed
and documented in Reference 3L-1. This report does not include the steam dryer since it was
evaluated in separate reports (see References 3L-5, 3L-6, and 3L-8). The evaluations for the
chimney components and SLC lines are included in this report, but alternate methods to those
described above have been used to evaluate FIV since these are new BWR components. This
report concludes that FIV evaluations have been completed and that none of the reactor internal
components are susceptible to FIV.
During the evaluation phase, the process as identified in Subsection 3.9.2.3 was followed to
prepare finite element analysis (FEA) models per the details shown in Subsection 3L.5.5.1. This
information will then be used as the basis for the instrumentation in the ESBWR startup test
program. It should be noted that the SLC internal piping, steam dryer and chimney have already
been identified in Section 3L.2.1 for inclusion in the startup test program.
3L.2.3 Design and Materials Evaluation
FIV-related fatigue cracking and intergranular stress corrosion cracking are major causes of reactor
internal component degradation observed in operating BWRs. The ESBWR reactor internals are
designed to resist fatigue loading. Design evaluations are conducted to evaluate load paths and
streamline structural discontinuities thus reducing stress risers that contribute to fatigue failure.
Welds are reduced by integrating components through machining or castings. Some components
are specifically designed for intersections between larger components so groove welds can be
used in lieu of fillet welds. Design evaluations are also conducted to stiffen the component structure
moving component fundamental frequencies above the frequency range associated with
hydrodynamic and acoustic loads.
The reactor internal materials, as specified in Subsection 4.5.2, are resistant to corrosion and
stress corrosion cracking in the BWR steam/water environment.

3-1494 Revision 0October 2015
Fermi 3Updated Final Safety Analysis Report
3L.3 CHIMNEY ASSEMBLY AND STANDBY LIQUID CONTROL INTERNAL PIPING EVALUATION
3L.3.1 Design and Materials
The chimney assembly design consists of a chimney shell and partition assembly. The chimney
shell has a bottom ring that rests on the top guide (Figure 3.9-8). The chimney partitions rest on the
top surface of the top guide. The top of the partition assembly is supported against the inside of the
chimney shell. The partition assembly is a grid of square structures, each of which encompasses
and lines up with four top guide fuel cells (i.e.,16 fuel assemblies). The chimney shell and partitions
are fabricated using austenitic stainless steel plate (Table 4.5-1). The partitions are full length
welded near the junctions of the partitions. The chimney shell that houses the partition structure is
cylindrical, similar to the core shroud. A sketch of the chimney assembly is shown in Figure 3L-1.
Because the chimney shell has structural characteristics similar to the shroud, this component is
considered under the generic reactor internals vibration program, and the partition assembly is
considered to be the unique component that requires special vibration consideration.
3L.3.2 Prior Operating Experience
Prior to the ESBWR design, the BWR-1 Dodewaard plant had operating experience with this
chimney design, although it did not have a vibration instrumentation program. For this plant, the
partition size was a square configuration that encompassed four fuel assemblies within the cell,
which is ¼ the dimension of the ESBWR partitions. Also, the height was approximately ½ the length
of the ESBWR design. The partition thickness was 3 mm (0.12 in) as compared to 9 mm (0.35 in)
for ESBWR, and the partitions were welded together using intermittent fillet welds as compared to
full-length groove welds in joints that are positioned away from the partition intersections for
ESBWR. Although the partitions were not instrumented, the plant operated for almost 30 years
without any issues related to the chimney structure. Since the design of the ESBWR chimney
partitions is more fatigue-resistant, this Dodewaard operational history provides additional
assurance that the ESBWR will not have FIV issues.
3L.3.3 Testing and Two-phase Flow Analysis
For the ESBWR, the chimney partition assembly constitutes a structure that has a unique vibration
evaluation program as part of the ESBWR reactor internals. In order to assess its capability to
maintain structural integrity under plant operating conditions, a flow induced vibration evaluation is
performed in which the fluctuating fluid force acting on the partition plates is evaluated by a
combination of scale tests and two-phase flow analysis.
The test scope comprised a 1/6-scale (100 mm x 100 mm [4 in x 4 in]), a 1/12-scale (50 mm 50 mm [2 in x 2 in]) and one almost full scale (500 mm 500 mm [20 in x 20 in]) chimney. Tests use
a mixture of air and water to simulate two-phase flow testing inside the chimney. The velocities of
the gas and liquid components of the two-phase flow were adjusted to be consistent with ESBWR
values to simulate the actual two-phase flow pattern. Different inlet flow conditions in the smaller

3-1495 Revision 0October 2015
Fermi 3Updated Final Safety Analysis Report
scale models were used to investigate the influence of inlet mixing within the partition to simulate
different power conditions. Pressure fluctuation was measured on the inner surface of the partition
wall with pressure transducers. The 1/6-scale model was later divided into four cells for
investigating the pressure fluctuations between cells (Reference 3L-1).
The scale model tests were used to investigate the effect of model size on the magnitude of
pressure fluctuations acting on the partition wall in steam-water conditions.
A structural analysis of the chimney and partition design was then conducted using finite element
methods. First, an eigenvalue analysis determined that the lowest natural frequency of the chimney
structure is approximately 54 Hz. This was sufficiently greater than the predominant frequency of
pressure fluctuation determined by testing (2 Hz) that a static analysis of the structure was
concluded to be proper. Based on the results of that static analysis, a maximum stress of 32.8 MPa
(4,760 psi), with a fatigue strength reduction factor of 2, was calculated near the edge of the
partition plate joint. This stress value is bounded by the allowable vibration highest stress amplitude
of 68.9 MPa (10,000 psi) specified in Subsection 3.9.2.3.
3L.3.4 SLC Internal Piping Evaluation
The SLC line is a new ESBWR component that enters the downcomer flow region at two locations,
180 degrees apart, in the annulus between the RPV and the chimney. The SLC piping continues
down to the shroud where the piping divides and penetrates the shroud at two locations each.
Since the configuration of the SLC line has a new geometry and location within the RPV, this
component is analyzed and tested during initial startup.
A finite element beam model of SLC line was constructed and analyzed for FIV induced stresses
(see Subsection 3L.5.5.1.4). The fundamental frequency of the SLC line was determined to be
31.2 Hz, which is well separated from the vortex shedding frequency of 5.5 Hz and, therefore, of no
concern.
The SLC piping in the annulus is instrumented during startup of the first ESBWR. A summary
description of these sensors is shown in Table 3L-4.

3-1496 Revision 0October 2015
Fermi 3Updated Final Safety Analysis Report
3L.4 STEAM DRYER EVALUATION PROGRAM
3L.4.1 Steam Dryer Design and Performance
The ESBWR steam dryer consists of a center support ring with dryer banks on top and a skirt
below. A typical steam dryer is shown in Figure 3L-2. The dryer units, made up of steam drying
vanes and perforated plates, are arranged in six parallel rows called dryer banks. The ESBWR
steam flow rate is approximately 15% higher than ABWR. The ESBWR RPV has a larger inner
diameter at the vessel flange than ABWR, which allows dryer banks to be extended, thereby
accommodating the higher steam flow. The additional dryer unit face area results in approximately
the same flow velocity through the drying vanes as ABWR and helps maintain moisture removal
performance requirements. The support ring is supported by RPV support brackets. The steam
dryer assembly does not physically connect to the chimney head and steam separator assembly.
The cylindrical skirt attaches to the support ring and projects downward to form a water seal around
the array of steam separators. Normal operating water level is approximately mid-height on the
steam dryer skirt.
Wet steam from the core flows upward from the steam separators into an inlet header, then
horizontally through the inner perforated plate, the dryer vanes and the outlet perforated plates,
then vertically in the outlet header and out into the RPV dome. Dry steam then exits the RPV
through the steam outlet nozzles. Moisture (liquid) is separated from the steam by the vane surface
and the hooks attached to the vanes. The captured moisture flows downward, under the force of
gravity, to a collection trough that carries the liquid flow to vertical drain channels. The liquid flows
by gravity through the vertical drain channels to the lower end of the skirt where the flow exists
below the normal water level.
The prototype for the ESBWR steam dryer builds on the successful operating experience of the
ABWR steam dryer. Although the ESBWR steam dryer will have a larger diameter and wider vane
banks to accommodate close to 15% higher steam flow, the vane height, skirt length, outer hood
setback from the main steam nozzle, and water submergence will be similar to the ABWR steam
dryer. The ESBWR steam dryer also draws experience from operating plant replacement steam
dryer program fabrication, testing and performance. Steam dryers recently tested and installed in
BWR/3 plants had experienced high pressure loads under extended power uprate operating
conditions. These loads were characterized by an abnormally high pressure tone at approximately
155 Hz that emanated from an acoustic resonance in one or more of the safety relief valve (SRV)
standpipes. The replacement steam dryers were specifically designed to withstand the FIV and
acoustic resonance loading that led to fatigue failures in the steam dryers for these plants. In
addition, the SRV/SV standpipes and main steamline branch lines in ESBWR are specifically
designed to preclude first and second shear layer wave acoustic resonances that could be a
significant contributor to steam dryer loading at normal operating conditions. Table 3L-1 provides a
comparison between major configuration parameters of the ESBWR, the ABWR prototype and a
BWR/3 replacement steam dryer.
3-1497 Revision 0October 2015
Fermi 3Updated Final Safety Analysis Report
3L.4.2 Materials and Fabrication
Current industry and replacement steam dryer practices are applied to the materials and fabrication
of the ESBWR steam dryer. The steam dryer materials are selected to be resistant to corrosion and
stress corrosion cracking in the BWR steam/water environment, see Table 4.5-1.
3L.4.3 Load Combinations
Design loads for the steam dryer are based on evaluation of the ASME B&PV Code load
combinations provided in Table 3.9-2 except that the load definitions that pertain to the steam dryer
are modified as shown in Table 3L-2. These load combinations consist of deadweight loads, static
and fluctuating differential pressure loads (including turbulent and acoustic sources), seismic,
thermal, and transient acoustic and fluid impact loads.
3L.4.4 Fluid Loads on the Steam Dryer
During normal operation, the steam dryer experiences a static differential pressure loading across
the steam dryer plates resulting from the pressure drop of the steam flow across the vane banks.
The steam dryer also experiences fluctuating pressure loads resulting from turbulent flow across
the steam dryer and acoustic sources in the vessel and main steamlines. During transient and
accident events, the steam dryer also experiences acoustic and flow impact loads that result from
system actions (e.g., turbine stop valve closure) or from the system response (e.g., the two-phase
level swell following a main steamline break).
Of particular interest are the fluctuating acoustic pressure loads that act on the steam dryer during
normal operation that have led to fatigue damage in previous steam dryer designs. In the low
frequency range, these pressure loads have been correlated with acoustic sources driven by the
steam flow in the outer hood and vessel steam nozzle region. In the high frequency range, acoustic
resonances in the stagnant steamline side branches (e.g., relief valve standpipes) are coupled to
the vessel, thus imparting a pressure load on the steam dryer. Vessel acoustic modes may also be
excited by sources inside and outside the vessel, resulting in additional acoustic pressure loads in
the middle frequency range.
A detailed description of the pressure load definition for the ESBWR steam dryer is provided in
Reference 3L-5. The load definition is based on the Plant Based Load Evaluation Methodology
described in Reference 3L-8. Reference 3L-8 provides the theoretical basis of the methodology,
describes the analytical model and provides benchmark and sensitivity comparisons of the
methodology predictions with measured pressure data taken from instrumented steam dryers. The
fluctuating load definition is based on the load definitions based on in-plant measurements that
were developed for the steam dryer structural analyses in several extended power uprates. These
load definitions provide a fine-mesh array of pressure time histories that are consistent with the
structural finite element model nodalization. Multiple load definitions are used in the ESBWR steam
dryer analysis in order to evaluate the steam dryer response over a wide frequency range. These
load definitions include the limiting low and high frequency loads observed in plants with

3-1498 Revision 0October 2015
Fermi 3Updated Final Safety Analysis Report
instrumented steam dryers. Based on the unique plant configurations (e.g., dead legs in the main
steamlines that may amplify the low frequency acoustic response) and operating conditions (e.g.,
high steam line flow velocities) in these instrumented plants, the load definitions from these plants
are expected to provide a robust load definition for the ESBWR. The load definitions developed for
the ESBWR are also benchmarked against the instrumented steam dryer measurements taken
during startup testing for the lead ABWR. The ESBWR and ABWR have the same vessel diameter
and vessel steam nozzle design (with flow restricting venturi), and similar main steamline layouts;
therefore, it is expected that the frequency content of the ESBWR steam dryer pressure loads will
be similar to those measured on the ABWR.
3L.4.5 Structural Evaluation
A FEA is performed to confirm that the ESBWR steam dryer is structurally acceptable for operation.
The FEA uses the load definitions described in Subsection 3L.4.4. The FEA is performed using a
whole steam dryer analysis model to determine the most highly stressed locations, also see
Subsection 3L.5.5.1.3. The FEA consists of dynamic analyses for the load combinations identified
in Subsection 3L.4.3. If required, locations of high stress identified in the whole steam dryer
analysis are further evaluated using solid finite element models to more accurately predict stresses
at these locations. Additional analysis confirms that the RPV steam dryer support lugs
accommodate the predicted loads under normal operation and transient and accident conditions.
(Also see Subsection 3L.5.5.1.3.)
The structural evaluation of the ESBWR steam dryer design is presented in Reference 3L-6.
3L.4.6 Instrumentation and Startup Testing
The ESBWR steam dryer is instrumented with temporary vibration sensors to obtain flow induced
vibration data during power operation. The primary function of this vibration measurement program
is to confirm FIV load definition used in the structural evaluation is conservative with respect to
the actual loading measured on the steam dryer during power operation, and to verify that the
steam dryer can adequately withstand stresses from flow induced vibration forces for the design life
of the steam dryer. The instrumentation and startup testing program for the ESBWR steam dryer
follows NRC regulatory guidance in Reference 3L-10, as described below. The detailed objectives
are as follows:
• Determine the as-built frequency response parameters: This is achieved by frequency response
testing the steam dryer components. The results yield natural frequencies, mode shapes and
damping of the components for the as-built steam dryer. These results are used to verify
portions of the steam dryer analytical model.
• Confirm FIV loading: In order to confirm loading due to turbulence, acoustics and other sources,
dynamic pressure sensors are installed on the steam dryer. These measurements will provide
the actual pressure loading on the steam dryer under various operating conditions.

3-1499 Revision 0October 2015
Fermi 3Updated Final Safety Analysis Report
• Verify the design: Based on past knowledge gained from different steam dryers, as well as
information gleaned from analysis, selected areas are instrumented with strain gages and
accelerometers to measure vibratory stresses and displacements during power operation. The
measured strain values are compared with the allowable values (acceptance criteria) obtained
from the analytical model to confirm that the steam dryer alternating stresses are within
allowable limits.
The objective of the steam dryer frequency response test is to identify the as-built frequencies and
mode shapes of several key components of the steam dryer at ambient conditions. Different
components of the steam dryer have different frequencies and mode shapes associated with them.
The areas of interest are the drain channel, the outer hood panel, the inner hood panel, the side
panel, and the skirt. These results are used to verify portions of the finite element model of the
steam dryer.
The concern is that local natural frequencies may coincide with existing forcing functions to cause
resonance conditions. The resonance could cause high stresses to occur in localized areas of the
steam dryer. A finite element frequency response analysis can calculate the frequency and mode
shape of a component, but they are only ideal approximations to the real values due to variations
such as plate thickness, weld geometries, configuration tolerances and residual stresses that affect
the assumed boundary conditions in the finite element model. The mode shapes and frequencies
determined by the frequency response test are used to validate the finite element frequency
response analysis and determine the uncertainty in the finite element model predictions of the
frequency response. The FE model and experimental transfer functions are then used to derive
frequency dependent amplitude bias and uncertainty of the FE model for key areas of the dryer.
This is described further in Reference 3L-6.
The frequency response test is performed following final assembly of the steam dryer. The tests are
performed with the steam dryer resting on simulated support blocks similar to the way the steam
dryer is seated inside the reactor vessel.
Two types of frequency response tests are performed on the steam dryer: (1) Dry frequency
response test, and (2) Wet frequency response test with the steam dryer skirt and drain channels
partially submerged in different water levels (to approximate in-reactor water level). Both tests are
conducted in ambient conditions. Temporary bondable accelerometers are installed at
predetermined locations for these tests. An instrumented input force is used to excite the steam
dryer at several pre-determined locations and the input force and the structural responses from the
accelerometers are recorded on a computer. The data is then used to compute experimental
transfer functions mode shape, frequency and damping of the instrumented steam dryer
components using appropriate software. The temporary sensors are then removed and the steam
dryer is cleaned prior to installation in to the reactor vessel.

3-1500 Revision 0October 2015
Fermi 3Updated Final Safety Analysis Report
The steam dryer vibration sensors consist of strain gages, accelerometers and dynamic pressure
sensors, appropriate for the application and environment. A typical list of vibration sensors with their
model numbers is provided in Table 3L-3. The selection and total number of sensors is based on
past experience of similar tests conducted on other BWR steam dryers. These sensors are
specifically designed to withstand the reactor environment. The pressure instrument locations are
selected to provide a good measure of the acoustic loading through the frequency range of interest.
A proper distribution of the steam dryer pressure instruments facilitates accurate assessments of
FIV loads. The layout of the steam dryer pressure instrument locations is evaluated using the RPV
acoustic FEA Model. The approach used to determine the number and locations of pressure
instruments is described in Subsections 2.3.2 and 4.4.2 of Reference 3L-8.
The steam dryer startup test and monitoring power ascension limits are developed on a similar
basis as the monitoring limits used for recent extended power uprate replacement steam dryers.
The power ascension limits are based on the final FIV analysis performed for the as-built steam
dryer. Strain gages and accelerometers are used to monitor the structural response during power
ascension. Accelerometers are also used to identify potential rocking and to measure the
accelerations resulting from support and vessel movements. The approach used to determine the
number and locations of the strain gages and accelerometers is described in Section 9.0 of
Reference 3L-6. Specific information utilized to verify the FIV load definition during startup testing is
described further in References 3L-5 and 3L-6.
Each of the sensors is pressure tested in an autoclave prior to assembly and installation on the
steam dryer. An uncertainty analysis is performed to calculate the expected uncertainty in the
measurements.
Prior to initial plant start-up, strain gages are resistance spot-welded directly to the steam dryer
surface. Accelerometers are tack welded to pads that are permanently welded to the steam dryer
surface. Surface mounted pressure sensors are welded underneath a specially designed dome
cover plate to minimize flow disturbances that may affect the measurement. The dome cover plate
with the pressure transducer is welded to an annular pad that is welded permanently to the steam
dryer surface. The sensor conduits are routed along a mast on the top of the steam dryer and fed
through the RPV instrument nozzle flange to bring the sensor leads out of the pressure boundary.
Sensor leads are routed through the drywell to the data acquisition area outside the primary
containment.
Pressure transducers and accelerometers are typically piezoelectric devices, requiring remote
charge converters that are located in junction boxes inside the drywell. The data acquisition system
consists of strain gages, pressure transducers and accelerometer signal conditioning electronics, a
multi-channel data analyzer and a data recorder. The vibration data from all sensors is recorded on
magnetic or optical media for post processing and data archival. The strain gages, accelerometer
and pressure transducers are field calibrated prior to data collection and analysis. This calibration
includes the addition of natural strain gauge factors based on the specific vendor supplied

3-1501 Revision 0October 2015
Fermi 3Updated Final Safety Analysis Report
calibration sheets and their effects on the final stress tables. The locations of the gauges are more
distributed than BWR EPU gauge locations. The locations are selected to avoid pressure nodes in
the acoustic harmonic response for frequencies that contribute most heavily to loading in the dryer
components with the highest stress. The final pressure transmitter locations are evaluated using
the PBLE model with multiple combinations of Frequency Response Function (FRF) sets
corresponding to different transmitter locations. The resulting data are used to find locations that
provide redundancy and minimize singularities over the frequency ranges of interest, with special
consideration at frequencies critical to high stress locations in the dryer. The sensitivity of locations
to dimensional tolerances is also considered. Strain gauge manufacturer installation procedures are
followed to duplicate previous installations. Care is taken to assure surface preparation (attachment
surface area polish), spotweld welding energy, and weld strength recommendations are followed for
each gauge. Applicable lessons learned from manufacturer’s recommendation were also
incorporated into the GEH welding procedure specification. Furthermore, knowledge is passed to
the welders by holding pre-job briefs and discussing the proper technique for applying the gauges,
emphasizing the uniform placement of spot welds at approximately 0.7 – 0.8 mm intervals.
Afterwards, the welders will practice on shims until peel tests are successfully completed. Quality
Control personnel are present to accept the weld process. The temporary vibration sensors are
removed after the first outage.
The steam dryer pressure measurements are used as input to an acoustic model for determining
the pressures acting on the steam dryer in order to provide a pressure load definition for use in
performing confirmatory structural evaluations.
In addition to the elements described above, NRC regulatory guidance (Reference 3L-10)
describes elements of the comprehensive vibration assessment program that is implemented prior
to and through startup testing. The following regulatory positions for prototype steam dryers
address the program elements applicable to the ESBWR steam dryers:
• Position 2.1 provides a description of the vibration and stress analysis program, including
specific items that should be included in the vibration and stress analysis submittal prior to
implementation of the vibration measurement program.
• Position 2.2 provides a description of the vibration and stress measurement program, which is to
verify the structural integrity of reactor internals, determine the margin of safety, and confirm
results of the vibration analysis.
• Position 2.3 describes the inspection program for inspection both prior to and following plant
operation.
• Position 2.4 describes documentation of results of the program.
• Position 2.5 describes the schedule for conducting the vibration assessment program.
COL Information Item 3.9.9-1-A implements the vibration assessment program. For each of the
regulatory positions above, the NRC guidance (Reference 3L-10) explains how the program is to be

3-1502 Revision 0October 2015
Fermi 3Updated Final Safety Analysis Report
conducted, how the processes assure structural integrity of the steam dryer, and identifies
information and reports that are to be prepared and when the information and reports should be
submitted. Steps in the process for the regulatory positions include the following key elements:
Position 2.1: The steam dryer analysis and modeling methodologies for performing a vibration and
stress analysis are described in References 3L-5, 3L-6, and 3L-8. NRC guidance specifies that a
summary of the vibration analysis program should be submitted to the NRC at least 60 days prior to
submission of the description of the vibration measurement and inspection programs (or 120 days if
submitted with a description of the vibration measurement and inspection phases description).
Thus, a summary of the as-built steam dryer structural analysis with the applied acoustic loads
would be developed and submitted to the NRC. In addition, the supporting information will be
available for NRC review for assuring acceptance criteria are met in accordance with ESBWR DCD
Subsections 3.9 and 14.3. This analysis is used to correlate results obtained through vibration
measurements during power ascension.
Position 2.2: Details of the steam dryer monitoring program are described above and in References
3L-5, 3L-6, and 3L-8. According to NRC guidance, a description of the vibration measurement and
inspection phases of the comprehensive vibration assessment program should be submitted to the
NRC in sufficient time to permit utilization of the staff’s related recommendations (allowing 90 days
for staff’s review and comment period). This submittal would be focused on the as-built steam dryer
monitoring and instrumentation to be used for obtaining vibration measurements, with details of the
data acquisition and reduction system (e.g., transducer types, transducer position, measures to
maximize quality of data, online data evaluation system, procedures, and bias errors associated
with the instruments). During power ascension, the steam dryer instrumentation (strain gages,
accelerometers and dynamic pressure transducers) is monitored against established limits to
assure the structural integrity of the steam dryer is maintained. If resonant frequencies are identified
and the vibrations increase above the pre-determined criteria, power ascension is stopped. The
acceptability of the steam dryer for continued operation is evaluated by revising the load definition
based on the measured loading, repeating the structural analysis using the revised load definition,
and determining revised operating limits based on the results of the structural analysis.
Position 2.3: Specific steam dryer inspection recommendations for the ESBWR steam dryer design
are developed based on the final as-built design and structural analysis results. The steam dryer
inspection recommendations are consistent with Reference 3L-2, and consistent with Boiling Water
Reactor Vessel Internals Program guidance issued by the BWR owners group specific to reactor
internals vibration. According to NRC guidance, a description of the inspection phase would be
included in the submittal with a description of the vibration measurement program. This description
would identify any inspections that are to be performed prior to and following operation during
power ascension, and describe procedures and method of inspections, if any, of the steam dryer.
Position 2.4: According to NRC guidance, results of the comprehensive vibration assessment
program should be reviewed and correlated to determine the extent to which test acceptance

3-1503 Revision 0October 2015
Fermi 3Updated Final Safety Analysis Report
criteria are satisfied. The preliminary report following startup testing should compare preliminary
comparison of data to test acceptance criteria and identify anomalous data that could bear on the
steam dryer structural integrity. If results are acceptable, the final report should include a
description of any deviations, comparison between measured and analytically determined modes of
structural response and hydraulic response for verifying analytical technique, determination of
margins of safety, and evaluation of unanticipated observations or measurements that exceeded
acceptable limits not specified as test acceptance criteria (as well as disposition of such deviations).
If testing or inspections reveal defects or unacceptable results, the final report should also include
an evaluation and description of the modifications or actions planned to justify the structural
adequacy of the steam dryer.
Position 2.5: A schedule for conducting the elements of the comprehensive vibration assessment
program is inherent in COL Information Item 3.9.9-1-A. NRC guidance specifies that the steam
dryer be classified as prototype or non-prototype; that a commitment be made in the DCD or COL
application regarding the scope of the comprehensive vibration assessment program; and that
certain submittals be made describing the program and results with suggested schedules for the
submittals.
With the detailed description above and implementation of COL Information Item 3.9.9-1-A, the
instrumentation and startup testing program elements are consistent with NRC regulatory guidance
and adequately ensure steam dryer structural integrity.
3L.5 STARTUP TEST PROGRAM
This section summarizes the program for preparing and performing the startup FIV testing including
the methods and analysis that are performed when the startup test data is available. This section
assumes that the initial selection of components identified in Subsection 3L.2.1 will be part of the
analysis and instrumentation associated with the startup testing program.
Testing requirements of this program are incorporated into the Initial Test Program detailed in
Section 14.2 through the Reactor Internals Vibration Test described in Subsection 14.2.8.2.11. The
test procedure acceptance criteria, derived from the evaluations described in this appendix, are
classified by definitions in the Startup Administrative Manual outlined in Subsection 14.2.2.
Direction on the quality process to be used to control the resolution of test acceptance criteria
failures is incorporated in the Startup Administrative Manual and specific guidance may be included
in the test procedure.
3L.5.1 Component Selections
The components that are selected for instrumentation are determined from the initial evaluation
phase as discussed in Subsection 3L.2.1. Many different sensors of four different types are utilized
to measure vibration related data on several different reactor internal component structures.

3-1504 Revision 0October 2015
Fermi 3Updated Final Safety Analysis Report
3L.5.2 Sensor Locations
Having determined the components to instrument during the test, sensor locations on those
structures are determined based upon the analytically predicted mode shapes for each structure, or
calculated maximum stress locations or, sensor locations based on computational fluid dynamics
modeling, and in some cases, based upon the location of past FIV-related failures. Strain gages
and accelerometers are used for monitoring vibration levels. Strain gages measure local strain from
which local stress can be calculated. Based on knowledge of the natural mode shapes of the
structure or calculated stress distribution, highest stresses at other locations on the structure are
determined from these data. Accelerometers (with double integration of the output signal) provide
measurements of local structural displacement. This information, together with knowledge of the
natural mode shapes of the structure or calculated stress distribution, allows the highest stresses to
be calculated at other locations. Pressure sensors are also utilized at various locations in the
vessel. These are not used to measure structural vibration directly, but rather to measure the
pressure variation that is often a forcing function that causes the structural vibration. These
pressure sensor data are very useful for determining the source of any excessive vibration
amplitudes, if they are to occur during testing. Sensor types and locations are listed in Table 3L-4.
3L.5.3 Test Conditions
Test conditions are selected early in the FIV test program to consider a variety of steady-state and
transient operating conditions that could be expected to occur during the life of the plant. Tests are
identified in the Initial Test Program (ITP) schedule during heat up and power operation testing
phases, when at steady-state conditions and with transient test sequences, as necessary. Specific
conditions for testing are integrated into the initial startup by inclusion in the ITP schedule outlined
in Subsections 14.2.2.4 and 14.2.7. Hold points and milestones are included to allow for test result
review and approval, overall phase testing approval and authorization to proceed with the next
testing phase documented in the Startup Administrative Manual, which includes time for COL
Holder and NRC staff interactions.
RPV internals vibration at steady-state conditions is more important than transient conditions for
evaluating the structural integrity of components. This is because steady-state normal operating
conditions can exist for long periods of time, allowing a very large number of vibration cycles to
accumulate. The FIV caused by transient operating conditions is far less influential because of the
relatively low number of vibration cycles that occur over the lifetime of the plant. The purpose in
including transient test conditions is to confirm that extremely high stresses do not occur during
transients. This check is accomplished during the actual startup transient tests by the vibration
engineers monitoring the test equipment. Transient stress levels near the allowable limit would be
easily and immediately detected by the vibration engineers. No such high stress levels are
expected to occur during the ESBWR initial plant FIV transient tests. Therefore, for the purposes of
confirming the structural capability of the internals, steady-state test conditions are the most
important conditions to evaluate.

3-1505 Revision 0October 2015
Fermi 3Updated Final Safety Analysis Report
Total volumetric core flow rate is also an important parameter that affects the vibration magnitude of
the internals. Vibration amplitude generally increases as the volumetric flow rate increases.
3L.5.4 Data Reduction Methods
Basically, two types of data reduction are performed: (1) time history analyses and (2) spectrum
analyses. In either data reduction method, the measured peak-to-peak (p-p) value of each sensor
signal is compared to the allowable p-p value. Even though time history, spectrum analyses or both
are performed for each selected sensor and test condition, the results from only one data reduction
method are used for comparison to the allowable values. The selection of the method is dependent
on the analysis method used for data evaluation. Table 3L-5 describes the method of data reduction
that is applicable to each component.
3L.5.4.1 Time History Analysis
The time history method uses the analyzer’s time capture mode of operation. Time capture is
performed for a period of several minutes for all the selected sensors and test conditions. The
frequency bandwidth for the time capture is chosen to accommodate 0-200 Hz as a minimum for
most channels.
For comparison to the allowable vibration amplitude, the measured p-p value over specified
bandwidths needs to be obtained for sensors in specific components. The bandwidths used for p-p
measurements for various components are shown in Table 3L-5. There are six bandwidths for time
history p-p measurement: 0-80 Hz, 0-200 Hz, 0-100 Hz, 80-200 Hz, 100-200 Hz and 0-1600 Hz.
The 0-1600 Hz is used only for the accelerometer for the purpose of detecting impacts. The other
three bandwidths are used for normal vibrations.
For the 0-200 Hz bandwidth, the maximum p-p values over several minutes of data for selected
sensors and test conditions are obtained directly from the time capture. Specification of the
bandwidth for time capture (0-200 Hz) automatically results in a low-pass filtered signal.
In order to obtain the maximum p-p in the 0-100 Hz range, the histogram operation is employed on
the time capture traces. When the bandwidth (0-100 Hz) is specified in the histogram operation, the
signal is automatically low-pass filtered in the specified frequency range. The histogram
measurement shows how the amplitude of the input signal is distributed between its maximum and
minimum values. The horizontal axis is the amplitude axis and usually the center of the horizontal
axis is the zero point with positive and negative amplitudes on either side of the zero. The vertical
axis is the number of counts or the number of times a particular amplitude value occurs in a
time-history. From the histogram, the maximum positive and maximum negative values in a time
history can be obtained, from which the maximum p-p of the time history can be obtained.
For the 100-200 Hz bandwidth range, the time captured traces are filtered in the 100-200 Hz range
and the p-p is obtained over a period of several minutes. The filtered time history between 100 and
200 Hz is scanned to obtain maximum and minimum values to get p-p values.

3-1506 Revision 0October 2015
Fermi 3Updated Final Safety Analysis Report
For the 0-1600 Hz range for accelerometers, the time history signal is examined for the presence of
any impacts.
3L.5.4.2 Frequency Analysis
The spectrum shows the signal in the frequency domain. There are several different types of
spectra. The linear spectrum is the Fourier transform of the time history signal. The auto power
spectrum is the magnitude squared of the linear spectrum, which is computed by multiplying the
Fourier transform of the signal by its complex conjugate. This spectrum contains magnitude
information only. The spectra generated for ESBWR data reduction are auto power spectra. The
spectra for selected sensors and test conditions are obtained from the captured time history
described previously.
Signal averaging is used to obtain better statistical properties. It is possible to select the number of
averages and the type of averaging. There are three types of averaging:
• Stable (normal)
• Exponential
• Peak Hold
The averaging method used for ESBWR is “Peak Hold”, which compares the current spectral value
of each individual frequency during the analysis interval to the last spectral value and holds the
larger of the two. The resultant spectrum is a composite spectrum which envelopes the spectrums
of all analysis intervals. The parameters used in the spectrum generation are described in Table
3L-6.
In order to obtain greater accuracy on amplitude of the frequency spectrum, a flat top window is
selected.
From the spectrum, the dominant frequencies of vibration and their root mean square (RMS)
magnitudes can be identified. The frequency is in the horizontal axis and the RMS magnitude is in
the vertical axis. The p-p value of vibration at each dominant frequency is obtained by multiplying
the RMS value (from the peak hold spectrum) by a factor of 6. This factor is obtained from many
years of reactor experience and is a conservative estimate of the p-p value. This p-p value is then
used to compute the stress at the sensor location and the maximum stress in the structure.
3L.5.5 Data Evaluation Methods
This section describes the methods used to evaluate the reduced test data for the purpose of
determining whether maximum stress levels are below the maximum allowable fatigue stress limits
for the materials. A significant portion of this evaluation lies in the determination of the natural
vibration modes of the instrumented components as determined using finite element models.
Subsection 3L.5.5.1 describes the finite element models used in this process. Subsection 3L.5.5.2
describes the steps involved in determining the maximum stress amplitudes from the reduced data.

3-1507 Revision 0October 2015
Fermi 3Updated Final Safety Analysis Report
3L.5.5.1 Finite Element Models
Dynamic analytical finite-element models are developed for the following ESBWR plant reactor
internal components:
• Chimney Head and Steam Separators
• Shroud and Chimney
• Steam Dryer
• SLC Line
The dynamic analytical finite-element models are used to predict the natural vibration frequency,
modal displacement, and modal strain and stress for each of the dominant vibration response
modes. Descriptions of the finite-element models are given in the following subsections.
3L.5.5.1.1 Chimney Head and Steam Separators
In order to determine the chimney head and steam separator vibration frequencies and mode
shapes, a 3-dimensional model is developed using the ANSYS computer code (Reference 3L-3).
The detailed model consists of the components that provide structural members within the
assembly. Since the separator assembly units are the standard product used on prior BWR product
lines, and that operates within the range of the design steam flow rates, detailed modeling is not
required. In this model, each nodal point has four degrees of freedom, namely:
• radial displacement
• tangential displacement
• vertical displacement
• meridian rotation
3L.5.5.1.2 Shroud and Chimney
In order to determine the shroud vibration frequencies and mode shapes, an axisymmetric shell
model is developed using the ANSYS computer code (Reference 3L-3). The detailed shell model
consists of both the RPV, chimney, chimney support, and shroud such that the hydrodynamic
interaction effects between the components are accounted for. In this model, each nodal point has
four degrees of freedom, namely:
• radial displacement
• tangential displacement
• vertical displacement
• meridian rotation

3-1508 Revision 0October 2015
Fermi 3Updated Final Safety Analysis Report
The following assumptions are made in generating the axisymmetric shell model:
1. Discrete components move in unison for steam separators, standpipes, and CRDHs and guide tubes.
2. Masses are lumped at the nodal points. Rotational inertias of the masses are neglected.
3. Stiffnesses of control rods, control rod drives, steam dryers, and in-core housings are neglected.
4. Top guide and core plate masses are lumped to the shroud.
5. Masses of CRDHs below the vessel are lumped to the bottom head.
Equivalent shells are used to model the mass and stiffness characteristics of the guide tubes,
steam separators, and standpipes such that they match the frequencies obtained from a horizontal
beam model.
Diagonal hydrodynamic mass terms are selected such that the beam mode frequencies of the shell
model agree with those from the beam model.
The RPV, chimney and shroud are modeled as thin shell elements. The shell element data are
defined in terms of thickness, mass density, modulus of elasticity, and Poisson’s ratio for the
appropriate material and temperature.
The natural frequencies and mode shapes of the shroud shell model are given in terms of two
parameters, termed “n” and “m”. The “n” parameter refers to the number of circumferential waves,
while the “m” parameter refers to the number of axial half-waves. Thus, for beam types of vibration,
n=1.
3L.5.5.1.3 Steam Dryer
The design of the steam dryer assembly for the ESBWR plant is similar to ABWR.
However, the total steam flow rate of the ESBWR plant is different from past designs. These
differences warrant a detailed vibration analysis and test monitoring to assure the adequacy of the
new design to withstand the FIV.
In the ABWR initial plant FIV test program of the steam dryer assembly, accelerometers were
located on the cover plate and several locations on the skirt, and strain gages were located directly
on the skirt, drain channels and hoods (Reference 3L-5). In addition, pressure sensors were used
to measure the pressure differentials between the inside and outside of the upper skirt adjacent to
the front hood and the lower skirt. The differential pressure fluctuation across the hoods and skirt is
the primary forcing function causing vibration of the steam dryer structure.
A dynamic finite element model of the steam dryer assembly is developed using the ANSYS
computer code (References 3L-3 and 3L-6). Due to the complicated geometry and the large size of
the analytical model, major components may be modeled with coarse meshes such that their
dynamic contributions are accounted for in the whole steam dryer assembly vibration responses.

3-1509 Revision 0October 2015
Fermi 3Updated Final Safety Analysis Report
Separate refined dynamic finite element models of the major components are then developed to
provide a high resolution of the component’s response calculation.
The structural material properties and density for the steam dryer components at temperature are
used in the model. The effect of the water on the dynamic responses is accounted for by explicitly
modeling the dynamic properties of the fluid in the submerged portions of the skirt, drain channels,
and the base ring.
Prior analytical models have predicted that the vibration modes are closely spaced. The final
as-built structural predictive vibration analysis is performed prior to startup testing for correlation to
final measurement results of acoustic loads measured on the steam dryer during startup testing, as
elements of a comprehensive vibration assessment program described in Subsection 3L.4.6.
3L.5.5.1.4 Standby Liquid Control Lines
There are two SLC pipes that enter the reactor vessel and are routed to the shroud. To accurately
predict the vibration characteristic of the SLC line, a dynamic finite element model of the entire line
is developed. In the model, the ends of the line are fixed anchor points since the lines are welded at
the vessel nozzle and the shroud attachment points. The SLC line is supported at six places. The
top vertical segment is supported at the RPV at two places along its length; the horizontal circular
segment is supported by two symmetrically placed supports at the shroud; and the two vertical
segments in the bottom length are supported at the shroud by one support in each segment.
3L.5.5.2 Stress Evaluation
Table 3L-7 lists the methods that are used for each instrumented component for the FIV test
program. Evaluation of all internals except the steam dryer is contained in this subsection; steam
dryer structural evaluation is contained in Reference 3L-6. For this section, Method I is used for
components that have many closely spaced natural vibration modes and utilizes the strain energy
weighting method applied to all modes over the frequency range of interest. This method has
previously been applied to the ABWR prototype plant startup tests of In-core Monitor housings, and
shroud. Method II is similar to Method I, except that it is applied to two frequency bands, 0-100 Hz
and 100-200 Hz. Method III is used for components that have relatively few, distinct dominant
natural modes that are matched to the analytical modes. This method has previously been applied
to the in-core guide tubes.
Maximum stress amplitude values for evaluation against allowable limits are determined from the
test data and finite element models using one of three different evaluation methods. The method
used for a particular component depends on the complexity of that component’s vibration
characteristics. Each of these methods yield conservatively high predictions of the maximum stress
anywhere on the structure. These conservatively high stress predictions are compared against
conservatively low acceptance criteria to assure that none of the components is experiencing high
stress vibrations that might cause fatigue failures. The acceptable fatigue limit stress amplitude for

3-1510 Revision 0October 2015
Fermi 3Updated Final Safety Analysis Report
the reactor internals component material is 68.9 MPa (10,000 psi), with the exception of the steam
dryer.
Method I is used for components that have many closely spaced vibration frequencies or closely
spaced natural vibration modes distributed over a relatively narrow frequency range. The method
utilizes a strain energy weighting method applied to all modes over the entire frequency range. It is
applied by determining the maximum p-p amplitude from an unfiltered time history segment. This
maximum value is multiplied by a combined shape factor (derived from the strain energy weighting
method) and stress concentration factors (SCFs) to yield the maximum stress value that could be
expected to be found anywhere on the structure. This value is then compared against the
acceptable fatigue limit stress amplitude for the component and material.
Method II is used for components that have many closely spaced vibration frequencies or closely
spaced natural vibration modes that are unevenly distributed over several frequency ranges. The
method is very similar to Method I, except that it is applied over several separate frequency bands.
The maximum stress amplitude values for each frequency band are then added together absolutely
to yield a conservatively high value for the overall maximum stress amplitude that could be found
anywhere on the structure. This value is then compared against the acceptable fatigue limit stress
amplitude for the component and material.
Method III is used for components that have relatively few, distinct dominant natural modes that can
be easily identified and matched to the modes predicted by the finite element models. This method
utilizes a mode shape factor for each vibration mode that relates the stress at the sensor location to
the stress at the maximum stress location for that mode. Appropriate SCFs are also considered in
this process. Response spectra are generated from the sensor output, from which the equivalent
maximum p-p strain amplitude for each mode can be determined. The mode shape and SCFs are
applied mode by mode to determine the maximum stress amplitude associated with each mode.
Then the maximum stress amplitudes from each of the modes are added together absolutely to
yield a conservatively high maximum overall stress amplitude for the structure. This value is then
compared against the acceptable fatigue limit stress amplitude for the component and material.
These methods have identical initial steps to obtain mode shape factors for each natural mode. The
steps for these methods are as follows: (Note: The evaluation method described here relates to
strain gages. Similar steps are used for accelerometers used in their displacement mode. The
example assumes a maximum allowable stress amplitude for the material of 68.9 MPa (10,000 psi)
for the purposes of illustration.)
1. The dynamic finite element model of each instrumented component is used to predict the natural vibration modal displacement, frequency and stress for each vibration response mode. Specifically, the computer model provides the following results for each mode:
i=Natural frequency for vibration mode i
{}i=Mass normalized displacement mode shape for vibration mode i.

3-1511 Revision 0October 2015
Fermi 3Updated Final Safety Analysis Report
(Normalized such that the generalized mass, {}iT[M]{}i, is unity, where [M] is the mass
matrix.)
{}i=Normalized stress distribution for vibration mode i.
(The stress corresponding to the mass normalized mode shape, {}i)
The theory and methods for calculation of these parameters may be found in text books
on the subject of basic vibration analysis, such as Reference 3L-4.
2. For each vibration mode, SCFs are applied at weld locations and regions with high stress gradient. From this information, the maximum stress intensity location and value is determined for each vibration mode.
i,max = Max{SCFi•i} considered over the entire structure
where
SCFi = Stress concentration factor at some location
i = Normalized stress intensity at the same location
i,max = Normalized maximum stress intensity for mode i
3. From the stress distribution of Step 1, a mode shape factor is derived relating the stress at the sensor to the stress at the maximum stress location as determined in Step 2:
where
MSFi = Mode shape factor
i,sensor = Normalized stress at sensor location for vibration mode i
4. The mode shape factor from Step 3 and the maximum allowable stress amplitude for the material [68.9 MPa (10,000 psi)] are used to determine the maximum allowable stress value at the sensor location for each mode.
where
i,sensor,allowed = Maximum allowed zero to peak stress amplitude at sensor location
for vibration mode i (stress amplitude at sensor when maximum
stress amplitude in structure is 68.9 MPa)
5. The allowable strain for mode i (i,allowed) is then calculated from this maximum allowed stress amplitude at the sensor location:
MSFi
i at maximum stress intensity location i sensor
--------------------------------------------------------------------------------------------------=
i,sensor,allowed68.9 MPa
MSFi SCFi --------------------------------------------=
i al lowedi,sensor,allowed
E----------------------------------=

3-1512 Revision 0October 2015
Fermi 3Updated Final Safety Analysis Report
where
E = Young’s modulus [e.g., 1.86 x 10⁵ MPa (27.0 x 10⁶ psi) at 160°C (320°F)]
This equation is for uniaxial stress components.
At this point, Methods I and II diverge from Method III.
3L.5.5.2.1 Methods I and II
The next two steps are identical for Methods I and II.
1. A weighting factor is determined by the strain energy method, which begins by obtaining the solution to the
following equation based on the expected forcing function:
where
{U} = A vector representing the displacement response of the structure when
subjected to the expected forcing function shape. This displacement
response to an input forcing function is calculated from the finite element
model on the computer.
{}i = Mass normalized mode shape for vibration mode i. Mode shapes were
determined from modal analysis of the finite element model. The mode
shapes are normalized such that the generalized mass, {}iT[M]{}i, is unity
(where [M] is the mass matrix).
qi = Mode i response, dependent on load distribution. These coefficients are
calculated from the previously calculated {U} and {}i using formulas derived
from the generalized Fourier Theorem.
This is an application of the generalized Fourier Theorem, which establishes that a
displacement function such as {U} can be represented by a linear sum of the eigenfunctions,
{}i. The theory and methods for calculation of these coefficients may be found in text books
on the subject of basic vibration analysis, such as Reference 3L-4.
2. The strain energy contribution, ei, for each mode is then calculated:
where
[K] = The structural stiffness matrix (For a more detailed explanation of the theory
and calculation methods, see text books on the subject vibration analysis,
such as Reference 3L-4.)
U q1 1 q2 2 + + qi i
i 1=
N
= =
ei12--- qi
2 iT K i=

3-1513 Revision 0October 2015
Fermi 3Updated Final Safety Analysis Report
3. This step is similar for both Methods I and II, the only difference being that Method I includes the entire frequency range in one group, while Method II uses several groups of frequency ranges. Then the strain energy weighted allowable strain vibration amplitude is calculated over a given frequency range by combining the weighted strain allowable values for each mode as follows:
For
where
II,allowed formula = Allowable strain value between I and II, which includes the SCF
It should be noted that this step conservatively assumes that the highest stress of each
mode occurs at the same physical location on the structure. In reality, the maximum stress
locations for different modes may occur at different locations. Since the purpose of this
calculation is just to confirm that the maximum stress is less than an acceptable limit, it is
quite acceptable to add this conservatism. However, it should be understood that the value
calculated is conservatively high, and it is not an accurate prediction of the actual stress
amplitude. If a stress calculated in this manner should exceed the limit in a few situations,
then a less conservative calculation can be used in those few cases.
The strain value in the above equation is the allowable strain used during the actual
execution of the test. It represents the strain level at the sensor location when the maximum
stress on the structure is 68.9 MPa (10,000 psi).
4. Step 9 is the same for both Methods I and II, except that it is applied to each of the multiple frequency ranges associated with Method II; whereas, Method I is only for one frequency range. The combined shape factor is derived to relate the maximum zero-to-peak strain value measured at the sensor location to the corresponding maximum zero-to-peak stress intensity value on the structure.
where
= Combined Shape Factor with the SCF included.
II,max = Maximum zero-to-peak stress value anywhere on the structure for
modes within the frequency range of I to II.
II,measured,max = Maximum measured zero-to-peak strain (one-half of maximum
measured p-p) from time history of sensor band pass filtered over
the frequency range I to II.
i 12 n II
II,allowed
e1 I,allowed e2 2,allowed ...+en n ,allowed++e1 e+
2...+en+
-------------------------------------------------------------------------------------------------------------------=
II,max
II,measured,max
II,allowed---------------------------------- 68.9 MPa II,measured,max CSF= =
CSF68.9 MPa II,allowed
----------------------------=

3-1514 Revision 0October 2015
Fermi 3Updated Final Safety Analysis Report
This is the maximum zero-to-peak stress value anywhere on the structure as determined by
Method I. For Method I, this value is compared to 68.9 MPa (10,000 psi) for determination of
acceptability.
5. One additional step remains for Method II. The maximum stress values for each frequency band are added together using the absolute sum method to determine the overall maximum stress on the structure for comparison to the 68.9 MPa (10,000 psi) limit for the material.
MAX = II,max + III,max + ...+N,max
where
MAX = Maximum overall zero-to-peak stress anywhere on structure as determined
by Method II.
N,max= Maximum zero-to-peak stress anywhere on structure within the frequency
range of N-1 to N (N-1 frequency ranges total).
MAX is compared to the 68.9 MPa (10,000 psi) limit in order to determine acceptability under
Method II.
It should be noted that this step conservatively assumes that the highest stress of each mode
occurs at the same time. In reality, the maximum stress occurs at different times. Since the purpose
of this calculation is just to confirm that the maximum stress is less than an acceptable limit, it is
quite acceptable to add this conservatism. However, it should be understood that the value
calculated is conservatively high, and it is not an accurate prediction of the actual stress amplitude.
If a stress calculated in this manner should exceed the limit in a few situations, then a less
conservative calculation can be used in those few cases.
3L.5.5.2.2 Method III
Method III uses the mode shape factor from Step 3, the SCF and the measured strain value to
determine the maximum stress amplitude anywhere on the structure for each natural mode. Picking
up after Step 5 from Subsection 3L.5.5.2:
1. Maximum stress in the structure is calculated from the measured strain value at the sensor location.
i,MAX = i,measured,max • E • MSFi • SCFi
where
σi,MAX = Maximum zero-to-peak stress anywhere on structure for mode i.
εi,measured,max = Maximum zero-to-peak strain for mode i as determined from power
spectrum from sensor signal.
E = Young’s Modulus
MSFi = Mode Shape Factor for mode i.

3-1515 Revision 0October 2015
Fermi 3Updated Final Safety Analysis Report
SCFi = Stress Concentration Factor as applicable for maximum stress
location for mode i.
2. The maximum stress values for each mode are added together using the absolute sum method to determine the overall maximum stress on the structure for comparison to the 68.9 MPa (10,000 psi) limit for the material.
MAX = 1,MAX + 2,MAX +...+ N,MAX
where
σMAX = Maximum overall zero-to-peak stress anywhere on structure as determined
by Method III.
σi,MAX = Maximum zero-to-peak stress anywhere on structure for mode i (n total
dominant modes).
σMAX is compared to the 68.9 MPa (10,000 psi) limit in order to determine acceptability under
Method III.
It should be noted that this step conservatively assumes that the highest stress of each mode
occurs at the same physical location on the structure and at the same time. In reality, the maximum
stress locations for different modes may occur at different locations and at different times. Since the
purpose of this calculation is just to confirm that the maximum stress is less than an acceptable
limit, it is quite acceptable to add these conservatisms. However, it should be understood that the
value calculated is conservatively high, and it is not an accurate prediction of the actual stress
amplitude. If a stress calculated in this manner should exceed the limit in a few situations, then a
less conservative calculation can be used in those few cases.
In summary, all three methods involve two significant conservatisms:
• The assumption of the maximum stresses occurring at the same location in a component
• The assumption that the maximum stresses for different modes occur at the same time
Inclusion of these two significant conservatisms results in significantly higher calculated stresses.
3L.5.5.3 (Deleted)
3L.6 REFERENCES
3L-1 GE Hitachi Nuclear Energy, “Reactor Internals Flow Induced Vibration Program”, NEDE-33259P-A, Revision 3, Class III (Proprietary), October 2010, and NEDO-33259-A, Revision 3, Class I (Non-proprietary), October 2010.
3L-2 General Electric Company, “BWR Steam Dryer Integrity”, Service Information Letter (SIL) 644 Revision 2, August 30, 2006.
3L-3 ANSYS Engineering Analysis System User’s Manual, see Table 3D.1-1 for the applicable revision.

3-1516 Revision 0October 2015
Fermi 3Updated Final Safety Analysis Report
3L-4 Elements of Vibration Analysis, Leonard Meirovitch, McGraw Hill Book Co., 1975.
3L-5 GE Hitachi Nuclear Energy, “Steam Dryer - Acoustic Load Definition,” NEDE-33312P, Revision 5, Class III (Proprietary), December 2013, and NEDO-33312, Revision 5 Class I (Non-Proprietary), December 2013.
3L-6 GE Hitachi Nuclear Energy, “Steam Dryer - Structural Evaluation,” NEDE-33313P, Revision 5, Class III (Proprietary), December 2013, and NEDO-33313, Revision 5, Class I (Non-Proprietary), December 2013.
3L-7 (Deleted)
3L-8 GE Hitachi Nuclear Energy, “ESBWR Steam Dryer – Plant Based Load Evaluation Methodology, PBLE01 Model Description,” NEDE-33408P, Revision 5, Class III (Proprietary), December 2013, and NEDO-33408, Revision 5 Class I (Non-proprietary), December 2013.
3L-9 (Deleted)
3L-10 Regulatory Guide 1.20, “Comprehensive Vibration Assessment Program For Reactor Internals During Preoperational and Initial Startup Testing,” Revision 3, March 2007.
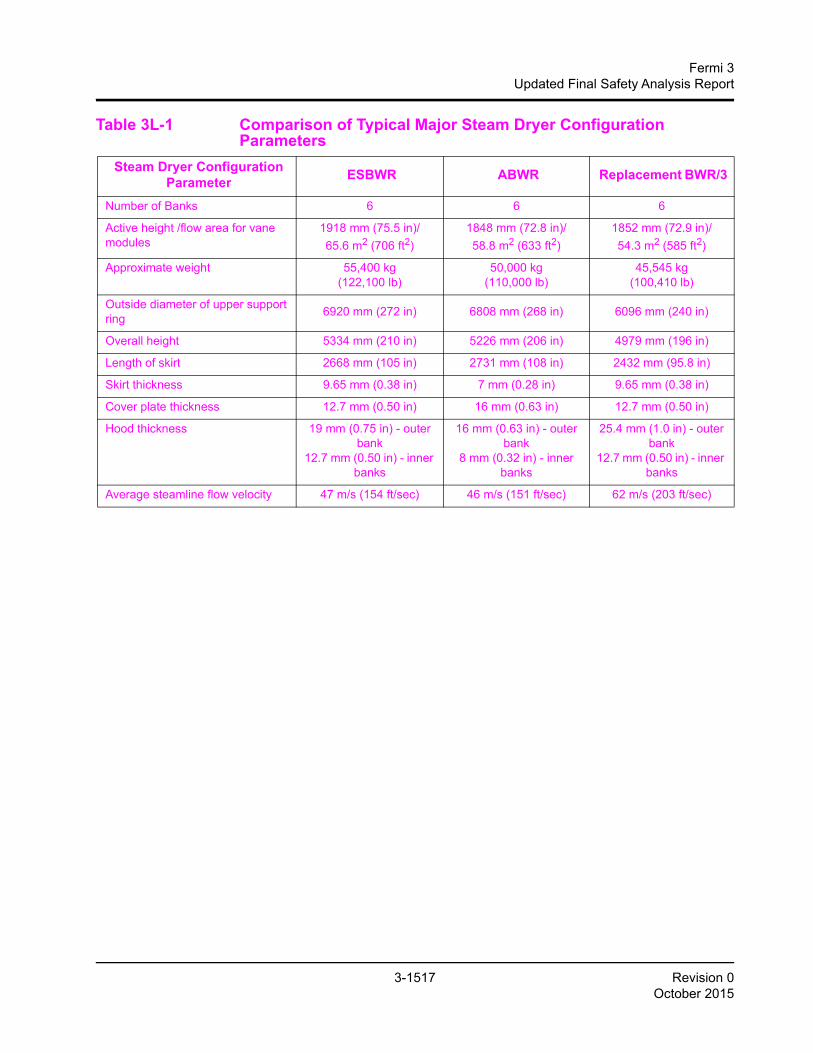
3-1517 Revision 0October 2015
Fermi 3Updated Final Safety Analysis Report
Table 3L-1 Comparison of Typical Major Steam Dryer Configuration Parameters
Steam Dryer ConfigurationParameter
ESBWR ABWR Replacement BWR/3
Number of Banks 6 6 6
Active height /flow area for vane modules
1918 mm (75.5 in)/
65.6 m2 (706 ft2)
1848 mm (72.8 in)/
58.8 m2 (633 ft2)
1852 mm (72.9 in)/
54.3 m2 (585 ft2)
Approximate weight 55,400 kg(122,100 lb)
50,000 kg(110,000 lb)
45,545 kg(100,410 lb)
Outside diameter of upper support ring
6920 mm (272 in) 6808 mm (268 in) 6096 mm (240 in)
Overall height 5334 mm (210 in) 5226 mm (206 in) 4979 mm (196 in)
Length of skirt 2668 mm (105 in) 2731 mm (108 in) 2432 mm (95.8 in)
Skirt thickness 9.65 mm (0.38 in) 7 mm (0.28 in) 9.65 mm (0.38 in)
Cover plate thickness 12.7 mm (0.50 in) 16 mm (0.63 in) 12.7 mm (0.50 in)
Hood thickness 19 mm (0.75 in) - outer bank
12.7 mm (0.50 in) - inner banks
16 mm (0.63 in) - outer bank
8 mm (0.32 in) - inner banks
25.4 mm (1.0 in) - outer bank
12.7 mm (0.50 in) - inner banks
Average steamline flow velocity 47 m/s (154 ft/sec) 46 m/s (151 ft/sec) 62 m/s (203 ft/sec)

3-1518 Revision 0October 2015
Fermi 3Updated Final Safety Analysis Report
Table 3L-2 Specific Steam Dryer Load Definition Legend
Normal (N) Normal and abnormal loads associated with the system operating conditions, including thermal loads, depending on acceptance criteria. These include deadweight, static differential pressure, and fluctuating pressure loads.
TSV Turbine stop valve closure induced loads in the main steam piping and components integral to or mounted thereon. For the steam dryer, these include acoustic and flow impact loads. Separate load cases are evaluated for load components that are separated in time (e.g., acoustic impact and flow impact).
LOCA8 Acoustic impact loads on the steam dryer due to a postulated steamline break. Separate load cases are evaluated for load components that are separated in time (e.g., acoustic impact and level swell impact).
LOCA9 Level swell impact loads on the steam dryer due to a postulated steamline break. Separate load cases are evaluated for load components that are separated in time (e.g., acoustic impact and level swell impact).
Table 3L-3 Typical Vibration Sensors
Vibration sensor type Typical sensor model
Strain gage Kyowa Model KHC-10-120-G9
Accelerometer Vibro-meter Model CA901
Dynamic pressure transducer Vibro-meter Model CP104 or Model CP211

3-1519 Revision 0October 2015
Fermi 3Updated Final Safety Analysis Report
(1) Vibration data for all equipment listed in Table 3L-4 will be acquired during initial startup and power
ascension testing.
Table 3L-4 Sensor Locations and Types
Equipment Item Location on Equipment Sensor Type Location Basis
Steam DryerSupport Ring
On top of support Accelerometer(Acceleration Mode)
Past experience of steam dryer rocking
Steam DryerSkirt
At bottom of steam dryer Accelerometer(Displacement Mode)
Modal analysis
Steam DryerHood
Dryer bank hood and end plate Strain GagePressure Transducer
Past experience of cracks at weld & to obtain forcing function data
Steam DryerDrain Channel
At top & bottom, side edge of drain channels
Strain Gage Modal analysisPast experience of cracks at weld
Steam DryerSkirt
At top & bottom of skirt Strain GagePressure Transducer
Modal analysis & to obtain forcing function data
Shroud On the outside diameter near shroud bottom at maximum stress location
Strain Gage Dynamic analysis
Separator Top On the guide ring Accelerometer Past experience to measure separator motion
Vessel Dome Region
On steam dryer FIV instrument post.
Pressure Transducer To obtain forcing function data
Chimney On the middle of chimney at 4 different azimuths
Accelerometer To obtain data on new design chimney vibration
Standby Liquid Control Line
Strain gages on the shroud penetration piping at the bottom along the principal stress directionsAccelerometer near the end of the circular header to measure radial and tangential accelerations
Strain Gage and accelerometers
New design and dynamic analysis

3-1520 Revision 0October 2015
Fermi 3Updated Final Safety Analysis Report
(1) It should be noted that the 200 Hz frequency range is approximate and is dependent on the SRV standpipe design. The frequency range monitored and evaluated in the FIV test program is adjusted to bound the range of frequencies determined for the final SRV standpipe design.
(2) Pressure sensors data reduction from steam dome, steam dryer skirt, and steam dryer hood are not included in this table. The pressure data from these components are discussed in Subsection 3L.4.6.
(3) For Method III, the spectrum method may be used in place of the Time History Method in cases with sufficient margin.
Table 3L-5 Applicable Data Reduction Method for Comparison to Criteria(2)(3)
Component Sensor Type Applicable Data Reduction Method
Frequency Bandwidth (Hz)(1)
Shroud Strain Gages Time History 0-100
Steam Dryer Skirt Strain Gages Time History 0-200
Steam Dryer Skirt Accelerometer (Displacement)
Time History 0-100
Steam Dryer Drain Channels
Strain Gages Time History 0-100, 100-200
Steam Dryer Hoods Strain Gages Time History 0-100, 100-200
Steam DryerSupport Ring
Accelerometer Time History 0-16000-80, 80-200
Separator Top Accelerometer Time History 0-100
Chimney Accelerometer Time History 0-200
Standby Liquid Control Lines
Strain Gages, Accelerometer
Time History 0-100

3-1521 Revision 0October 2015
Fermi 3Updated Final Safety Analysis Report
* It should be noted that the 200 Hz frequency range is approximate and is dependent on the SRV standpipe design. The frequency range monitored and evaluated in the FIV test program is adjusted to bound the range of frequencies determined for the final SRV standpipe design.
Table 3L-6 Parameters Used in Spectrum Generation
Parameter Value
Bandwidth 0-200 Hz*
Time length 3 minutes
No. of Fourier Lines 400
Resolution 0.5 Hz
Window Flat Top
No. of averages 90
Overlap 0%
Noise reduction None
Average Type Peak-hold
P-P Value RMS x 6
Table 3L-7 Data Evaluation Methods to be Used for Each Component
Internal Component Data Evaluation Method Used
Shroud and Chimney I
Steam Dryer See Subsection 3L.5.5.3
Standby Liquid Control Line III

3-1522 Revision 0October 2015
Fermi 3Updated Final Safety Analysis Report
Figure 3L-1 Typical Chimney Assembly
Note: All units are in mm.
26A6642AN Rev. 10
ESBWR Design Control Document/Tier 2
Note: All units are in mm.
Figure 3L-1. Typical Chimney Assembly

3-1523 Revision 0October 2015
Fermi 3Updated Final Safety Analysis Report
Figure 3L-2 Typical Steam Dryer Assembly
26A6642AN Rev. 09
ESBWR Design Control Document/Tier 2
Figure 3L-2. Typical Steam Dryer Assembly