Feature Emphasis and Contextual Cutaways for Multimodal Medical Visualization

3D Visualization and Multimodal Interaction with
Temporal Information Using Timelines
Giannis Drossis1,2, Dimitris Grammenos1, Ilia Adami
1 and Constantine Stephanidis
1,2
1 Foundation for Research and Technology - Hellas (FORTH), Institute of Computer Science
N. Plastira 100, Vassilika Vouton, GR-70013, Heraklion, Crete, Greece 2 University of Crete, Computer Science Department, Heraklion, Crete, Greece
{drossis, gramenos, iadami, cs }@ics.forth.gr
Abstract. This paper reports on the design, development and evaluation of
TimeViewer, a system allowing the storing, visualization and multimodal inter-
action with temporal and semantic information using timelines in 3D environ-
ments. We focus on the appliance of 3D interactive timelines for temporal in-
formation visualization, extending their capabilities with the novel concept of a
time-tunnel. Our work is intended to investigate beyond the current state of the
art interaction with 3D environments using a variety of input modes, such as
touch and full-body kinesthetic interaction. Qualitative results were elicited
through an evaluation with 16 users in order to assess the users’ opinion of the
system, the efficiency of the offered interactions and direct future research in
the area.
Keywords: Interactive timelines; multimodal interaction; 3D information visu-
alization; full-body interaction; virtual environment; usability evaluation.
1 Introduction
Timelines are a widespread concept for temporal information representation (i.e.,
events that took place during a time period) and are employed in various environ-
ments and contexts, ranging from exhibition spaces and museums to educational text-
books. In general, timelines aim to present information regarding specific temporal
periods along with an overview of related occurring events in condensed, yet rich,
form. The contents of a timeline can vary from historical events (e.g., [1, 25]) to nu-
merical data representation (e.g., [11, 12]), while the only limitation is that the various
items should be temporally related.
In this context, this paper reports on the design, development and evaluation of
TimeViewer, a system allowing the modeling, storing, visualization and multimodal
interaction with timelines.
TimeViewer extends the typical visualization techniques offered by the majority of
the available interactive timelines, which orders the various events in a 2D space to
denote their temporal relation by providing an innovative alternate view that aims to
highlight the time dimension and facilitate a more immersive exploration of the avail-
able information. This view employs a “time tunnel” metaphor, i.e., a long corridor
along which events are placed in chronological order, using distance to represent
time. On the tunnel sides, next to each event, exists an extendable ‘showcase’ com-
prising various multimedia objects (e.g., texts, images, videos and 3D models).
TimeViewer supports a variety of multimodal interaction techniques, even in com-
bination, so as to offer natural interaction in a wide range of hardware set-ups. Apart
from common desktop-based interaction techniques (i.e., point and click or multi-
touch gestures), TimeViewer supports non-instrumented full-body kinesthetic interac-
tion targeted to navigation and manipulation of 3D virtual environments. To assess
TimeViewer in terms of usability and user experience and also compare the various
supported interaction methods, an evaluation study was conducted with 16 partici-
pants.
2 Background and Related Work
2.1 Timeline-related concepts
Events are a common concept of timelines and represent any type of incident that
took place at some point in time. Information concerning events is represented in
chronological order and usually includes at least a title/short description, as well as
when it happened. Event occurrences may be (or considered) instant, e.g., the birth of
a person, or have a duration, e.g., the construction of a monument.
Periods are time frames during which incidents share some common characteris-
tics or hold a distinct meaning.
Finally, Categories define groups of semantically relevant events whose common
denominator can be their type, their context or a specific attribute (e.g., the director in
the case of a movie). Categories are mainly used to facilitate interaction by minimiz-
ing the amount of the displayed information through filtering out certain objects.
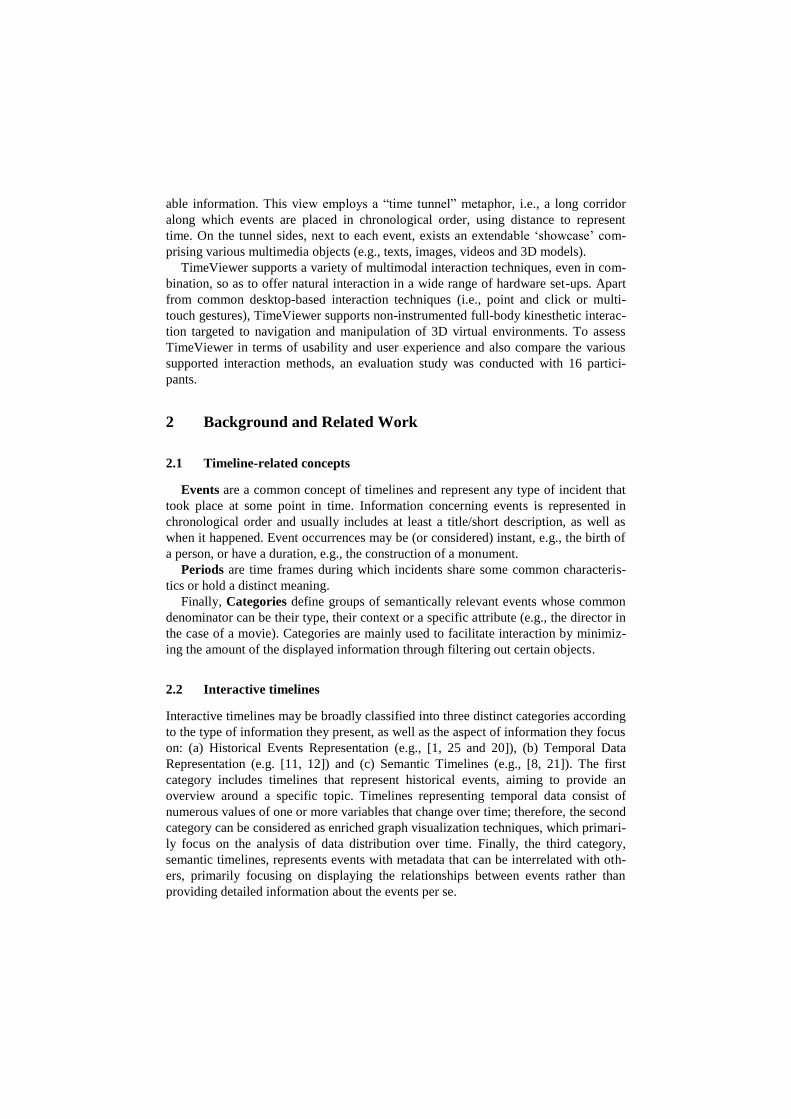
2.2 Interactive timelines
Interactive timelines may be broadly classified into three distinct categories according
to the type of information they present, as well as the aspect of information they focus
on: (a) Historical Events Representation (e.g., [1, 25 and 20]), (b) Temporal Data
Representation (e.g. [11, 12]) and (c) Semantic Timelines (e.g., [8, 21]). The first
category includes timelines that represent historical events, aiming to provide an
overview around a specific topic. Timelines representing temporal data consist of
numerous values of one or more variables that change over time; therefore, the second
category can be considered as enriched graph visualization techniques, which primari-
ly focus on the analysis of data distribution over time. Finally, the third category,
semantic timelines, represents events with metadata that can be interrelated with oth-
ers, primarily focusing on displaying the relationships between events rather than
providing detailed information about the events per se.

Faceted navigation is a common practice used for temporal data visualization in
timelines [2, 16, 23 and 25], implemented through the adoption of taxonomies to clas-
sify data in multiple ways and allows the application of filters to information. Faceted
display is implemented through hierarchical trees [23, 25], separate quantitative con-
trols [17] and separate toggle / filtering controls [10].
Existing 3D timelines include Beedocs [3] and Kullberg’s Dynamic Timelines [9],
both of which place events on a two dimensional plane. The major drawback of both
is that they do not support a formal way to acquire input from a knowledge source,
while Kullberg’s approach [9] additionally fails to provide rich interactivity and an
overview. Furthermore, another issue of these approaches is the lack of content cate-
gorization and time segmentation. In all aforementioned referenced cases user input is
provided through a mouse, a keyboard or a touch surface.
2.3 Multimodal / Natural interaction
Multimodal user interfaces support interaction techniques which may be used sequen-
tially or concurrently, and independently or combined synergistically, aiming to in-
crease the systems’ usability by the application of different modalities that each time
suit the system’s needs.
Gestures can be defined as a form of non-verbal communication in which visible
body actions communicate particular messages; gestural interaction is not only widely
studied in the literature, but is actually one of the most popular approaches that users
prefer due to its intuitiveness [13, 18, 24]. Furthermore, hand gestures can be used to
augment systems and allow supplementary interactions [7] when combined with other
means of interaction, such as single- or multi-touch. Apart from single-hand gestures,
both users’ hands may be used in combination to enrich the set of available gestures
[5]. Finally, the use of feet gesturing [18, 22] and foot tapping [4, 17] are occasionally
conceded as supplementary helpful interaction tools.
In addition to hand gestures, body movement can augment and facilitate natural in-
teraction. Body movement indicates the pose of a user’s body as mentioned in [6],
which can be tracked and used for selective interaction with the environment. Papa-
dopoulos et al. [15] use defined body poses recognition in order to allow navigation in
3D environments.
3 Motivation and Design Requirements
The overall goal of the presented work was to design, develop and assess an integrat-
ed approach for modeling, storing, retrieving, and visualizing temporal information
using multimodal, natural, interaction techniques. In brief, according to the envi-
sioned design requirements the system should:
1. allow expressing, storing and retrieving event-related data augmented with seman-
tic information, and thus be able to retrieve knowledge from a formal data model;

2. support the arbitrary grouping (categorization) of events in a non-restrictive way;
thus, apart from temporal categorization, the system should offer a content-
independent semantic categorization mechanism;
3. encompass natural user interaction techniques, such as body movement, hand and
leg gestures, which can be used independently or in combination. Any single inter-
action technique should allow users to manipulate all parts of the system in a con-
sistent way in all supported alternative views;
4. provide alternative, appropriate and complementary, ways (views) to represent in-
formation among which the user should be able to dynamically switch ‘on-the-fly’;
5. provide suitable display modes for the presentation of event information, both for
fundamental data such as titles and for extended details such as descriptive text,
images, videos and 3D models.
Brainstorming sessions with HCI experts took place in order to define the appro-
priate design, regardless of the content displayed and the timespan examined. Inter-
views were conducted with real users with no technological background, after short
experimentation with prototypes, in order to assess the fundamental functionalities
they would expect to be offered from such a system. The most significant finding of
these interviews involved the segmentation of the process of exploring a timeline in
two sections: the users expected the system to offer firstly an overview of the exam-
ined time region and secondly a technique to examine details of interest on demand.
From the early design stages it was decided to instantiate the envisioned system
through a 3D user interface, thus adding some additional requirements, as interaction
complexity in 3D space radically increases due to the additional available degrees of
freedom. In this respect:
1. interaction should be precise and rich, while remaining as simple as possible;
2. user disorientation should be prevented;
3. interaction for temporal exploration should offer means to travel both easily
through prolonged and precisely through short time frames;
4. the system should be robust and tolerant to user behavior (e.g., gestures, move-
ment) that may be beyond the foreseen ‘repertoire’ of actions, avoiding unexpected
‘reactions’ or states;
5. the system should be able to render both in 2D and stereoscopically, allowing to
explore and assess in practice the potential benefits and shortcomings of each ren-
dering approach.
4 System Overview
This section provides an overview of the characteristics and design rationale of the
TimeViewer system, which was created based on the aforementioned rationale and
requirements. In order to cover the need for semantic information to represent
knowledge, timelines are described and stored as an ontology using the Web Ontolo-
gy Language (OWL) [14], a widely used formal data model used for knowledge in-
formation representation in many state of the art systems. Data stored in the ontology
can be retrieved through the use of SPARQL queries (SPARQL Protocol and Re-

source Description Framework Query Language) executed either at initialization or at
runtime. Information retrieval is performed by a dedicated module which can easily
be substituted by another implementation which uses an alternate way to represent
knowledge.
4.1 Visualization Approach
A principal characteristic of TimeViewer is the provision of an immersive display of
temporal information supplementary to a view that favors the provision of an over-
view. In this direction, TimeViewer supports two distinct co-existing modes (i.e.,
views) for visualizing information respectively: the ‘Tunnel’ (Figures 3 and 4) and
‘Classic2D’ (Figures 1 and 2). Users can freely and seamlessly switch between the
two modes at any time. In this respect, a key design goal was to preserve the con-
sistency between alternative representations of the same information regarding both
the ‘look’ and ‘feel’ of corresponding interactive items. For example, multimedia
elements are displayed and manipulated in the same way in both modes, while, alt-
hough the actual position and scale of events may occasionally change, their appear-
ance and the way that users interact with them remains identical.
In contrast to the display differentiations required for each view of TimeViewer,
the fundamental information such as its title holds the same display in both modes for
the sake of consistency. The timeline’s title is placed at the upper side of the display
in order to inform users about the subject that the TimeViewer presents. Next to the
title, resides an interactive label showing the category of events presented. Upon se-
lection, a drop-down list appears containing all the available event categories. As
event categories in TimeViewer are mutually exclusive, only one can be active at a
time. The placement of the related interactive object next to the timeline’s title is in-
tended to aid towards understanding the functional role of categories, i.e. filtering and
hiding information. Furthermore, using a drop-down menu allows supporting a large
number of choices using minimum display estate. Similarly to simplified faceted nav-
igation [2, 16, 23,25], events not belonging to the selected category are just “dimmed”
(Figure 1) and not completely removed from the visualization, as on the one hand,
they constitute integral parts of contextual information regarding the rest ones, while,
on the other hand, hiding and showing events would result in significant changes to
the visualization of the timeline and eventually to confuse the users.
To avoid potential visualization problems (e.g., overcrowding, empty spaces) that
arise when some periods contain too many or too few events, in both modes, the visu-
al space taken up by a period can be appropriately scaled (up or down) out of propor-
tion. Furthermore, color coding is also supported to highlight the time period each
event belongs to.
Events may be ‘spontaneous’ or have a duration and can be accompanied by mul-
timedia information, including text, videos, images and 3D models. Each multimedia
type affords different interactions: images may be zoomed, videos may be played,
paused and stopped, texts may be read aloud, and 3D models may be magnified and
rotated. All multimedia types may be accompanied by a descriptive label.

Classic2D Timeline Visualization mode. The goal of this mode is to provide an
overview of the available information in a manner familiar to the user, easy to under-
stand and convenient for navigation (Figure 1). Thus, in accordance to the convention
followed by similar timelines, the horizontal axis is used to represent time. Periods are
also represented along this axis. Time and period representation is placed in the upper
side of the virtual world and acts as an upper boundary, below which all events are
displayed. The vertical axis is used for the visualization of events, taking care so that
closely occurring events do not overlap. More specifically, in the case where any two
events overlap, the one that occurs later is placed below the other, thus providing an
additional visual clue for perceiving the temporal order of closely occurring events.
Fig. 1. Enabling the category ‘Computer Systems’ in Classic2D Mode
Time legends appear over time periods, which can adapt to the current level of de-
tail (i.e., zoom level), in order to avoid overcrowding the scene with redundant infor-
mation; when not viewing the maximum detail level, respectively, the legends are
scaled up in order to remain clearly visible. Finally, a button resides at the bottom of
the display, which allows the user to switch to the Tunnel mode at any time.
When the timeline is presented at a small scale, events are displayed as rectangular
boxes containing a title and a time/date. Events not belonging to the currently selected
category are dimmed, indicating that they are not available for interaction. When an
events’ size increases, its representative item is added to the container box. Upon
selection, the event is brought to the center of the display, scaled up and its container
is transformed in order to match the need for hosting additional information: it ex-
tends so as to host two additional elements, which are placed at the sides of the box
inside an expanded case (Figure 3). The item in the center may be examined in further
detail – according to its type –, whereas the next and previous ones are placed on the
side. Apart from examining the centered item in detail, the users may proceed to the
next or previous items so as to explore all the available information regarding the
specific event. In case no further multimedia elements exist, the boxes collapse, indi-
cating that the user has no other items to further explore. At last, events that extend
over a span of time are treated as the ‘spontaneous’ ones (placed according to their
start time) differentiated only by the display of their start and end time as a time of
occurrence.

Fig. 2. Magnifying an event’s image
Tunnel Visualization mode. This mode works complementarily to Classic2D and is
targeted to supporting the task of sequential, exhaustive, exploration of the presented
information, allowing the user to physically experience the time dimension as well as
the unambiguous display of each event. The time dimension is visualized as a “tun-
nel” i.e., a long corridor, along which all information is integrated. Events are placed
on the tunnel floor, while periods are placed on the side corners of the tunnel roof.
The tunnel walls serve a dual role: they considerably constraint navigation in 3D
space, also offering rich orientation cues, and can host contextual information, such as
event-related items.
All basic timeline concepts are supported, but are transformed in an equivalent way
suitable to fit the needs of detailed event information demonstration. In essence, the
virtual tunnel is a sum of individual tunnel parts (slices). Each distinct part may either
represent an event or be just a connecting segment used to connect the various events.
The distance between events remains constant and linear, as time inside each period is
also linear, depicting the time that intervenes between their occurrences. However, in
the case where two or more events take place in a very short time, the events’ slices
would overlap as their extent is fixed. Therefore, TimeViewer adopts the idea of
“freezing” time in a region around the event, equal to its slice, in order to allow the
straightforward sequential placement of events occurring even in small time intervals.
Thus, the proposed approach is capable of supporting any time interval between two
events.
Periods are represented as horizontal signs along both sides of the tunnel roof
which are color-coded consistently to the Classic2D mode. Additionally, to further
emphasize the organization of events in periods, the lightning of tunnel sections be-
longing to a specific period follows the respective color code.
An event’s title is displayed on a board residing on the tunnel floor with an indica-
tion of the event’s occurrence time on the side. In addition to the event’s title, a ‘cavi-
ty’ with a showcase on its front is placed on the one side of the walls of the tunnel.
The cavity includes a glass showcase housing the event’s representative item, high-
lighting the visual representation of the event and providing an image to which the
users may be familiar to. The showcase is placed inside the wall and protrudes, when

the user virtually passes near an event. As indicated by a handle placed at the outer
side of the glass, the showcase may be dragged outwards so as to display additional
information regarding the event. Upon dragging the multimedia elements that host the
event’s additional information extend in a row, covering the space that the expanded
showcase occupies. Events that span over time are presented using two separate
boards, one representing the beginning being fully functional, and the ending one
being supplementary and only displaying a link to the event’s start. The display of the
end of an event with duration is altered, as its title and date is grayed out, unambigu-
ously designating its semantic difference.
Fig. 3. The nearest event is hidden in the tunnel due to categorization
Fig. 4. The view of an event with its showcase expanded
Events that do not belong to the currently selected category collapse on the axis
that the virtual tunnel extends. However, their presence is still evident, due to the fact
that the tunnel’s union with each event’s collapsed slice is specially designed so as to

be different in comparison to the rest of the tunnel’s walls, allowing the user to identi-
fy the presence of an event at that spot (Figure 3).
The user’s perception of the time currently inspected is enhanced by the presence
of a minimap in the form of a railway wagon, which is placed at the tunnel’s roof,
covering the whole timeline extent. The minimap rendered is the Classic2D represen-
tation along with a frame that provides live feedback regarding the equivalent position
in the other view of TimeViewer, while also acting as a gateway to Classic2D view.
4.2 Supported Interaction Methods
TimeViewer is designed to support diverse interaction devices and techniques includ-
ing desktop-based (e.g., touch screen) and full-body kinesthetic interaction.
Touch Screens. The user’s touch point on the screen is projected to the virtual world,
allowing the selection and dragging of items. Item selection is accomplished by either
clicking or dwelling upon (i.e., touching for some time) an item. Item lists (e.g., mul-
timedia elements related to an event) can be scrolled.
Navigation in the virtual world is achieved by dragging. In the case of Classic2D
representation, users can slide their finger anywhere on the 2D plane in order to move
left, right, up and down. Navigation inside the virtual tunnel is accomplished in a
similar way, as the view of the tunnel is changed by dragging the tunnel’s floor. The
available directions towards which the users may drag the tunnel include forward,
backward, left and right along the tunnel’s extent.
Kinesthetic Interaction. TimeViewer supports kinesthetic interaction through body
movement and gestures which are tracked using Microsoft’s Kinect. The general idea
regarding TimeViewer’s kinesthetic interaction involves the distinction of navigation
in the virtual world and interaction with the timeline’s elements: users use their feet to
move and their hands to reach out virtual elements, corresponding to a person’s ac-
tions in the real world. As TimeViewer is currently a single-user system, when multi-
ple persons are within Kinect’s field of view, only the nearest person’s actions are
taken into account, as follows.
User Position. The user’s position in comparison to the display is used as a tool
through which the user is able to manipulate TimeViewer in respect to the virtual
environment shown. Firstly, the user may stand off-center, towards either side of the
display, in order to scroll the projected view towards the respective direction in Clas-
sic2D mode. Furthermore, the system interprets the distance of the user from the
display as a zoom mechanism, enlivening the experience of his or her movement in
space. Finally, the Tunnel mode of TimeViewer aims to provide an immersive experi-
ence of the users’ actions; thus, the virtual tunnel augments the real space and the
system maps the actual position to the place from which the user looks in the tunnel,
creating the illusion of “being there”.
Virtual Hand. TimeViewer adopts the concept of using a virtual cursor to allow the
selection of items due to the remote control of the system. The cursor, in the form of a

three dimensional virtual hand, appears when the user extends his or her hand towards
the display, following and mapping the user’s real hand. Items’ selection is accom-
plished by keeping the hand cursor over them for a short period of time.
Hand Gestures. The usage of the virtual hand, however, is not the optimal solution
in some cases, where gestures may suit better: such examples may be the act of push-
ing an item away as well as scrolling through elements in a row. Therefore, Time-
Viewer offers the interpretation of users’ gestures, using either both hands or a single
one. Both user hands are tracked and a number of single and dual hand gestures are
supported.
The simplest single-hand gesture supported is the movement of one hand left or
right in order to scroll multimedia elements lists in both modes and fort navigation
purposes in Classic2D mode. Another common task in three dimensional virtual envi-
ronments is the provision of camera rotation in a straightforward way: the TimeView-
er equivalent single hand gesture involves raising the hand left or right while turning
the torso in the corresponding direction, which results to the rotation of the projected
view around its vertical axis.
Dual-hand gestures include pushing and pulling by moving both hands forward and
backward respectively. These gestures can be used with items residing in front of the
user, such as the multimedia elements. Additionally, in the Tunnel mode, users may
move to the next or previous available event by pulling or pushing respectively. In
Classic2D mode, users can push the event back to its original position when finished
examining detailed information.
Leg Gestures. Legs are a natural means for supporting navigation-related interac-
tions. Time-Viewer adopts the notion of stepping: while a user steps right, left, for-
ward and backward, navigation is achieved in the corresponding direction. In Clas-
sic2D mode, stepping forward or backward results in increasing or decreasing the
scale of the time-line respectively, while stepping left and right results in exploring
the timeline’s display at the respective direction. In Tunnel mode, stepping forward or
backward allows navigation along the tunnel, while stepping at the side results in
displaying the tunnel as if the user is looking from the equivalent side.
5 Evaluation
5.1 The Evaluation Process
The evaluation session was divided into three separate segments, one for each of
the primary interaction modes (touch and kinesthetic interaction) and a complemen-
tary one for the assessment of stereoscopic view: 3D user interfaces lately involve the
adoption of stereoscopic displays, which can offer a sense of depth in the visualized
information, creating richer representations and making the systems more immersive,
but, can also be tiresome since the related technologies has not yet matured. There-
fore, an assessment of their impact and usefulness should provide insights on their
helpfulness in comparison to traditional displays. The first evaluation segment includ-
ed the interaction using a touch screen, the second one integrated the manipulation of

the system remotely, through the use of user tracking, and the third one integrated the
usage of NVidia’s 3D Vision technology. The aim of the evaluation process was:
1. to evaluate the system design in terms of perceived usability, effectiveness, like-
ness, and learnability
2. to assess kinesthetic interaction opposed to desktop interaction, as well as provide
an insight regarding the factor of fatigue
3. to assess the effects of stereoscopic vision in comparison to two dimensional dis-
play
In order to eliminate bias towards either interaction method, users were split into
two even groups. The first group started the evaluation process using the touch screen
interaction mode first and then the hand gesturing interaction mode, whereas the sec-
ond group did the opposite. Both groups evaluated the 3D vision at the end.
The evaluation process started with informing the users of the goals and the pro-
cess of the evaluation. They were then requested to sign their consent to participating
in the evaluation and allowing the video taping of the evaluation. After the introduc-
tion, the functionality of the TimeViewer system was explained to each user, along
with the available gesture sets that TimeViewer supports.
A series of 7 user tasks were assigned to the participants for each one of the eval-
uation segments. The participants were instructed to express their thoughts aloud
(Think Aloud) throughout the completion of each task. In addition, at the end of the
evaluation they were requested to fill out a Likert type of questionnaire.
Fig. 5. The set-up of the second segment of the evaluation (projection + Kinect).
5.2 Set-up and Participants
Two different set-ups were used to evaluate the system. The first comprised a
touch screen, while the second one a short-throw projector (supporting stereoscopic

vision through the use of appropriate glasses) and a Microsoft Kinect allowing full-
body tracking.
A total of 16 volunteers participated in the evaluation, 7 females and 9 males. The
age of the participants varied from 20 to 40 years old. Twelve of the users (75%) had
intermediate or high computer expertise whereas the other participants had limited
expertise. Even though the majority of the users were familiar with computers and
touch screen systems, they did not have great familiarity with hand gesturing as a
mode of interaction with a system.
5.3 Results
Overall System Design. Overall, the users found that the two different content
presentation models, the Classic2D and the Tunnel mode, were complimentary to
each other. The majority of the users preferred using the Classic2D mode to obtain a
chronological overview of the events and the Tunnel mode to explore specific events.
This differentiation in the information display was one of the fundamental goals of
this system, as far as design is concerned, and the comments from the evaluation par-
ticipants indicate that this goal is accomplished. Classic2D mode was regarded by all
the users as efficient and intuitive in the way it presented the various periods and their
events. The users immediately knew what they were looking at. The application of
color coding to the chronological periods and their events made the information easy
to follow. The immersive design of the virtual tunnel was met with enthusiasm and
excitement by the users who in their majority commented on the “fun” factor of the
model. The users understood right away the concept of the TimeViewer and how the
information was structured in the three dimensional space.
One of the design issues exposed during the evaluations was the content categories
filtration mechanism. The users could view all content on the screen, or select one of
the available content categories from a list. However, the graphic used to note the
existence of the categories and its placement in the design did not make it obvious to
the users who failed to acknowledge its existence altogether. Another design issue had
to do with the icons used to note the various multimedia elements which proved to
create confusion to a lot of the users, as they were not representative enough of the
multimedia element.
Touch Screen Interaction. The first segment of the evaluation process indicated that
the touch interaction proved to be an efficient, effective, and intuitive way of interact-
ing with both the 2D and the 3D models. The vast majority of the users instantly un-
derstood which touch gesture they had to apply to each content element to produce
the desired action without much instruction. For example, they understood that in the
3D Tunnel they had to apply the dragging motion in order to advance through the
tunnel and the respective periods. Or, in the instance of the glass showcases, where a
grabbing hand icon would appear over the handle, the users understood that they
could drag it across the screen in order to open and reveal the showcase’s content.
Overall, the users were successful in completing the given tasks and there were only
very few instances where they needed assistance or gave up completely on a task.

One of the main comments that came up repeatedly through the evaluations was
the lack of multi-touch capabilities, as a lot of users suggested adding it as a feature.
Other suggestions made by the users included, controlling the zoom level by dragging
the slider instead of just pressing the (+) and (-) buttons, iterating through multimedia
content by dragging the slider instead of just the content elements, and using the min-
imap frame of the 3D model to navigate to the corresponding position in the 2D view.
Kinesthetic Interaction. The enthusiasm of the users was apparent during their inter-
action with TimeViewer with hand gesturing and user tracking, as only one user out
of 16 stated his preference to interact with the system using more traditional modes.
The users were captivated by the remote handling of the system achieved without the
use of any wearable component, especially as passersby and not every-day users. The
moves of the hands were regarded as very natural, as indicated by the comments dur-
ing the evaluation and the completed questionnaires. All the users found the gestures
representative of their functions and the only request made by a small percentage of
the users (4 out of 16) was that the gestures should become shorter. The rationale of
this request was due to the factor of fatigue that could emerge after prolonged interac-
tion with the system. For instance, the gestures for dragging items to the side as well
as the gestures of pulling or pushing items using both hands were proposed to be
shorter. Finally, gestures were considered easy to learn, as users were generally able
to accomplish them on their own after being shown by the evaluator.
Table 1. Qualitative results for each interaction technique, T (Touchscreen), H (Kinect/Hand
Gestures) and L (Kinect/Leg Gestures)
Questions
Strongly
Disagree
(%)
Disagree
(%)
Neutral
(%)
Agree
(%)
Strongly
Agree
(%)
T H L T H L T H L T H L T H L
I liked interacting with
the system. 0 0 0 0 0 0 19 6 31 31 44 38 50 50 31
No special training is
needed to handle it. 0 0 0 0 0 6 0 31 13 8 44 31 63 25 50
Corresponded precisely
to my actions. 0 0 6 0 6 0 6 44 0 56 44 44 38 6 50
It was awkward to use. 63 38 56 25 38 13 13 25 31 0 0 0 0 0 0
Responded promptly to
my actions. 0 0 0 0 0 6 6 31 0 63 44 38 31 25 56
It was tiring to use. 69 38 56 25 25 25 6 31 19 0 6 0 0 0 0
I would prefer another
method of interaction 56 44 50 25 31 25 6 19 19 6 6 6 6 0 0

The manipulation of the virtual hand (cursor) came easily to the users. A common
remark involved the stability of the cursor, which the users requested to be more pre-
cise in order to be able to select items which are small in size. Furthermore, some of
the users would prefer the duration of the hand being over items to be shorter so as to
select them more easily. The hand gestures were embraced without difficulty and the
users largely preferred them to the use of the virtual hand. Moreover, the system re-
acted as expected as far as hand gesturing is concerned, avoiding false interpretation
of the users’ movements.
An issue that was raised and that was common among the vast majority of the us-
ers was the fact that single-hand gestures were deliberately ignored when the cursor
was visible. This design decision was taken so as to avoid unexpected system behav-
ior, as the users could simply move their hand in one direction to select an element.
After explaining this limitation to the users, they felt comfortable with the system
interaction and managed successfully to apply gestures with respect to their goal.
Leg gesturing was almost unanimously accepted, as only one user had trouble with
navigation using his legs (Kinect failed to successfully recognize the exact placement
of his legs due to the material of his trousers). The idea of stepping in any direction in
order to travel in space came naturally to the users and interacting with the system
elements using their hands served the initial goal of discriminating the navigation
from the interaction. This observation is more evident in the non-expert users, who
supported the leg gestures even more than the expert users, as they felt more comfort-
able with handling the system naturally but in a strictly defined manner. The partici-
pants did not have any problem understanding the conceptual model of moving in the
space as they found it to be efficient, tireless and fascinating, which is clearly illus-
trated in the table containing the answers from the users’ questionnaires.
In conclusion, although kinesthetic interaction was considered as fractionally less
responsive and more tiring to use (questions 5 and 6 respectively), both hand and leg
gesturing are preferred to touch interaction (question 7). Despite the error rates not
being as good as touch in total, the users were almost unanimously (15 out of 16) in
favor of kinesthetic interaction as the fun factor was considered as more important
than mediocre precision.
Fig. 6. Touch interaction success rates
0%
20%
40%
60%
80%
100%
1 2 3 4 5 6 7
Failure Partial Success Success

Fig. 7. Kinesthetic interaction success rates
Figures 6 and 7 above display the users’ error rates for each given task as percentages.
A task is considered to be completed successfully if the user accomplishes it at the
first or second try, partially successful if the user needed some help or guidance and is
marked as a failure in the case where the user needed too much assistance, gave up on
completing the task or could not complete the task with no less than four attempts.
The tasks that users had issues on completing were due to misperception of the sys-
tem’s design rather than inability to understand how to interact with the system. This
fact is evident in task 1, where users were asked to find the existing categories of the
timeline: the users who partially succeeded or failed to find them did not observe the
category filtration mechanism, until the evaluator provided help. Upon assistance on
where to focus, the users were able to manipulate the mechanism in both interaction
methods. Some users also faced difficulties in task 2, where they were asked to ex-
plore a specific event’s information and find the types of presented information. In the
case of kinesthetic interaction, a larger user percentage needed minor guidance in
order to complete a gesture compared to touch interaction (for instance how to pull an
item). Finally, task 4 involved finding a video, where the users’ failure was due to
inability to identify a video (the video element was thought of an image). The presen-
tation of the tasks that were successfully carried out is beyond the scope of this paper,
as we focus on the aspects of the evaluation that can be used for the system’s im-
provement or provide interesting outcomes.
3D Vision. After the evaluation process regarding interaction by user tracking with
Kinect was finished, the participants were given NVidia’s 3D Vision Glasses to assess
the effects of stereoscopic information presentation. The users were overall in favor of
the stereoscopic view (table 2, last row), as 13 participants state that 3D Vision adds
up value to the system’s representation, while only two disagree and would prefer the
normal view in a total of 16 users. Another interesting outcome of great importance is
the fact that none of the participants expressed that the usage of 3D glasses was tiring
or awkward, as such an issue would be a major drawback in the future. Users did not
find that stereoscopic view had any direct effect, positive or negative, on their per-
formance (this fact is depicted in the question 5 at the table below); however, it im-
0%
20%
40%
60%
80%
100%
1 2 3 4 5 6 7
Failure Partial Success Success

proved the overall user experience and entertainment value. Some of the users stated
that they felt intrigued to further explore the timeline when using the glasses. In con-
clusion, the stereoscopic display was regarded as a feature that added up value to the
system, providing a more immersive feeling, especially in the Tunnel mode of Time-
Viewer.
Table 2. Qualitative results of stereoscopic vision.
3D Vision Questions Strongly
Disagree
Disagree Neutral Agree Strongly
Agree
I liked the interaction in 3D Vision. 0% 0% 13% 44% 44%
It was awkward to use. 75% 25% 0% 0% 0%
It was tiring to use. 56% 19% 25% 0% 0%
I prefer to interact with the system to its
normal dimension (2D).
6% 56% 31% 0% 6%
3D Vision improves the system usability 6% 25% 19% 25% 25%
3D Vision display adds up value to user
interaction experience.
0% 13% 6% 50% 31%
6 Conclusions
In this paper we have presented the design and characteristics of TimeViewer, a
system that allows the storing, 3D visualization and multimodal interaction with tem-
poral information. In addition to the typical 2D representation of timelines supported
by the majority of existing systems, this paper introduced the metaphor of a time-
tunnel in a virtual 3D environment, that can represent the same information in a dif-
ferent manner also supporting appropriate interaction methods.
TimeViewer was assessed in terms of usability and user experience through an
evaluation study with 16 participants. Overall, the results of the evaluation process
were very encouraging. As the developed system supports multiple multimodal inter-
action techniques, even in combination, so as to offer natural interaction in a wide
range of set-ups ranging from desktop-based interaction, to non-instrumented full-
body kinesthetic interaction in 3D environments, particular emphasis on the evalua-
tion was given on the comparison among all these supported interaction techniques.
To this end, the evaluation participants were excited by the diversity of the sup-
ported interaction techniques and were "open" to any new form of interaction beyond
the more traditional mouse, keyboard and touch options, embracing innovative and
state of the art natural interaction techniques. Therefore, further work should aim to
expand the possibilities of this research area, taking into consideration the factor of
fatigue after extensive use. Additionally, as the evaluation results indicate, the percep-
tion of, and interaction with, the 3D environment was easy and straightforward for all
users, thus encouraging the "expansion" of other widely used 2D visualization ap-
proaches to 3D worlds, which provide more creative options for information represen-
tation and interaction. Finally, stereoscopic rendering proved to have a positive influ-
ence to the users’ perception of the visualization.

Our future work includes further assessing the system with a larger set of users
with highly diverse profiles after refining and implementing issues that came up dur-
ing the last evaluation. Apart from improvements on existing aspects of TimeViewer,
a number of system extensions are planned, such as the capability of nesting of time-
lines inside other timelines and supporting the dynamic creation of timelines through
information retrieval from online sources, such as Wikipedia.
Acknowledgements
The work reported in this paper has been conducted in the context of the AmI Pro-
gramme of the Institute of Computer Science of the Foundation for Research and
Technology-Hellas (FORTH). Special thanks to Anthony Katzourakis for his artistic
work and 3D modeling.
References
1. Allen R. B. Visualization, Causation, and History. In Proc. iConference 2011, ACM Press
(2011), 538-545.
2. Andre P, Wilson M. L., Russell A., Smith D., Owens A. and Schraefel M.C. Continuum:
Designing Timelines for Hierarchies, Relationships and Scale. In Proc. UIST '07, ACM
(2007), 101-110.
3. Beedocs 3D Timeline, http://www.beedocs.com/timeline3D/
4. Crossan, A., Brewster, S. and Ng, A. Foot tapping for mobile interaction. . In Proc. BCS
'10, British Computer Society Swinton, UK (2010), 418-422.
5. Fikket, W., van der Vet, P., van der Veer, G. and Anton Nijholt. Gestures for large display
control. In Proc. GW'09, Springer-Verlag (2010), 245-256.
6. Jaimes A., Sebe N. Multimodal human–computer interaction: A survey. Journal Computer
Vision and Image Understanding archive Volume 108 Issue 1-2, ACM (2007), 116-134.
7. Hilliges O., Izadi Sh., Wilson A., Hodges St., Mendoza A. G. and Butz A. Interactions in
the air: adding further depth to interactive tabletop. In Proc. UIST '09, ACM (2009), 139-
148.
8. Jensen M. (2003). Visualizing Complex Semantic Timelines. NewsBlib (2003).
9. Kullberg R. L. Dynamic Timelines Visualizing Historical Information in Three Dimen-
sions. M.S. Thesis at the MIT Media Laboratory, Boston, MA, September, 1995.
10. Kumar V., Furuta R. and Allen R.B. Metadata visualization for digital libraries: interactive
timeline editing and review. In Proc. DL '98, ACM (1996), 126–133.
11. Marcus A., Bernstein M. S., Badar O., Karger D. R., Madden S. and Miller R.C. TwitInfo:
Aggregating and Visualizing Microblogs for Event Exploration. In Proc. CHI 2011, ACM
(2011). 227-236.
12. Matkovic K., Lez A., Gracanin D., Ammer A. and Purgathofer W. Event Line View: Inter-
active Visual Analysis of Irregular Time-Dependent Data. In Proc. SG'10, Springer-Verlag
(2010), 208-219.
13. Nickel K. and Stiefelhagen R. Pointing Gesture Recognition based on 3D-Tracking of
Face, Hands and Head Orientation. In Proc. ICMI '03, ACM (2003), 140 – 146.
14. OWL, Web Ontology Language Overview, http://www.w3.org/TR/owl-features/, last ac-
cessed on 22 January-2013.

15. Papadopoulos Ch., Sugarman D. and Kaufmant A. NuNav3D: A Touch-less, Body-driven
Interface for 3D Navigation. In Proc. IEEE VR 2012, IEEE (2012), 67-68.
16. Plaisant C., Milash Br., Rose A., Widoff S. and Shneiderman B. LifeLines Visualizing
Personal Histories. In Proc. CHI ’96, ACM (1996), 221 – 227.
17. Ronkainen, S., Häkkilä, J., Kalev, S., Colley, A. and Linjama, J. Tap input as an embedded
interaction method for mobile devices. In Proc. TEI ’07, ACM (2007), 263-270.
18. Sangsuriyachot N., Mi H. and Sugimoto M. Novel Interaction Techniques by Combining
Hand and Foot Gestures on Tabletop Environments. In Proc. ITS '11, ACM (2011), 268-
269.
19. Serrano M., Nihay L., Lawson J-Y.,Ramsay A., Murray-Smith R. and Denef S. The Open-
Interface Framework: A tool for multimodal interaction. In Proc. CHI '08, ACM (2008),
3501-3506.
20. Simile Project, http://www.simile-widgets.org/timeline/, accessed on 22-January-2013.
21. Stab S., Nazemi K and Fellner D. W. Sematime - timeline visualization of time-dependent
relations and semantics. In Proc. ISVC'10, Springer-Verlag (2010), 514-523.
22. Valkov D., Steinicke F., Bruder B. and Hinrichs K. Traveling in 3D Virtual Environments
with foot gestures and a multitouch enabled World in Miniature. In Proc. VRIC 2012,
IEEE (2010), 171-180.
23. Wongsuphasawat Kr., Gomez J.A.G, Plaisant C., Wang T.D., Shneiderman B. and Mai-
mom M. T. LifeFlow: Visualizing an Overview of Event Sequences. CHI 2011, ACM
Press (2011), 1747-1756.
24. Yoo B., Han J-J.,Choi Ch., Yi K., Suh S., Partk D. and Kim Ch. 3D User Interface Com-
bining Gaze and Hand Gestures for Large-Scale Display. In Proc. CHI '10, ACM (2010),
3709-3714.
25. Zhao J., Drucker S. M., Fisher D. and Brinkman D. TimeSlice: Interactive Faceted Brows-
ing of Timeline Data. In Proc. AVI '12, ACM (2012), 433-436.