flow cytometry gel electrophoresis immunoprecipitation (IP) immunoblotting microscopy

3D projection electrophoresis for single-cell immunoblotting Samantha M. Grist, Andoni P. Mourdoukoutas, and Amy E. Herr
Abstract
While single-cell resolution immunoassays and mass spectrometry are powerful protein analysis tools, key analytical bottlenecks remain in target specificity, analytical sensitivity, and measurement throughput. Advances are needed to complement single-cell genomics and transcriptomics tools. Here, we introduce highly parallel single-cell immunoblots designed to detect protein targets directly in unfixed mammalian cells. The 3D microfluidic device is comprised of a photoactive polyacrylamide gel, having one face (x-y) patterned with a high-density microwell array for cell isolation and lysis. From each microwell, single-cell lysate is ‘electrophoretically projected’ into the 3rd dimension (z-axis) for protein electrophoresis, photo-capture, and immunoprobing. Design guidelines for electrophoresis are informed by numerical simulation and empirical analyses of 3D diffusion of protein lysate. Unlike serial interrogation with capillary sampling interfaces, no automation or precision alignment is required for concurrent analysis of hundreds of cells. Importantly, cell separations are nearly synchronous (<10 s delay), whereas serial analyses impart hundreds of seconds of delay between analysis of the first and last cell in a population. We achieve an electrophoresis throughput of >2.5 cells/sec, which is 80X faster than serial sampling approaches, and perform 25 single-cell immunoblots per 1 mm2 of device area, a >10X increase over reported single-cell immunoblots. A straightforward device for parallel, synchronized single-cell immunoblotting, projection electrophoresis should advance integration of direct measurement of protein expression into the emerging single-cell atlas of genomic and transcriptomic profiles.
Introduction
Proteins are biomolecules that play a direct role in nearly all cellular processes1. As such, protein expression is a primary metric for quantifying cell state2. Although genomics and transcriptomics analysis of gene and RNA expression are powerful and complementary measurement techniques, they often do not predict protein expression at the single-cell level3–5. Proteoforms, or different forms of proteins arising from the same gene6, are also critical to understanding cell state: cellular heterogeneity at the proteoform level plays critical roles in cellular processes including regulating tumor growth7 and resistance to treatment in cancer8. Single-cell proteomic technologies have emerged for characterizing protein expression heterogeneity at the single-cell level, but many such technologies are limited to protein detection by antibodies with limited protein specificity, which may not be proteoform-specific9. Protein separations based on electrophoresis can overcome these antibody specificity limitations through dual measurements of protein size and primary antibody reactivity for protein detection.
Since the early 1990’s, capillary electrophoresis (CE) has been established as a tool for size-based protein separation from individual cells10. Early single-cell CE technologies, however, were capable of assaying 10’s of cells per day, preventing their application towards assessing single-cell heterogeneity of large cellular populations11,12. Improvements in CE throughput have been accomplished by increasing the number of capillaries per CE device for simultaneous separations of many samples. In Capillary Array Electrophoresis, 48 capillaries were run in parallel with two separations per capillary to achieve 96 separations in 8 minutes13. Although demonstrated to improve heat transfer rather than throughput, bundled microstructured fibers have been used as alternatives to glass capillaries, demonstrating 168 simultaneous separations with a single readout from the same sample14. While increasing separation throughput, parallel CE technologies have not been demonstrated for single-cell applications.
Recently, mass spectrometry has emerged as an alternative technology for performing single-cell protein detection without relying on antibody specificity. Mass spectrometry has become a powerful tool for highly multiplexed protein detection from single-cells (1000’s of targets per cell), but are able to detect only highly abundant proteins (>104 copies per cell)15,16. Furthermore, many single-cell mass spectrometry techniques demonstrated thus far employed a bottom-up mass spectrometry approach, which presents limitations in terms of proteoform detection as it can be impossible to map multiple modified peptides back to specific proteoforms. Top-down mass spectrometry approaches, in contrast, can be limited in terms of the types of proteins they are able to measure (with larger proteins presenting a measurement challenge)17. Additional obstacles arise in single-cell isolation steps, either requiring robotics for nanoliter liquid handling for dispensing cells and reagents into nanowells, or manual handling cell isolation steps, ultimately limiting throughput demonstrations in such approaches to less than 100 total cells15,16.
Important throughput increases in electrophoretic separations of analytes from individual cells have been made by devices that expedite the rate of serial single-cell analysis. Rapid CE and microfluidic systems have been instrumental in leading these advances, but such serial analysis devices face common problems when sampling larger populations of single-cells. Specifically, serial analysis requires cell incubation in the device for non-uniform times before individual cell lysis. As proteomic cell state is dynamic18, this cell-cell delay could induce artificial heterogeneity between cells residing in device environments for different lengths of time. Additionally, some throughput increases have come by limiting analysis to either intracellularly fluorescent molecules, smaller non-protein targets, or both. The Allbritton group has developed an impressive automated system that uses a single glass capillary, a microwell array for cell isolation, and a computer controlled-motorized stage for microwell alignment to the capillary tube19. This device has demonstrated throughput increase to 2.1 cells/min for cell lysis, separation and real time detection of cellular components by fluorescence readouts of 219 cells. Microfluidic devices, including etched glass and PDMS microchips, have demonstrated single-cell throughput of up to 12 cells/min and can provide significant reduction in reagent consumption compared to conventional bulk electrophoresis sytems20,21. To improve multiplexing of protein measurements, Jin et al. applied a mobile stage approach to endogenous protein detection through multiplexed western blotting, in which proteins separated by electrophoresis in a microchip are deposited (blotted) directly
certified by peer review) is the author/funder. All rights reserved. No reuse allowed without permission. The copyright holder for this preprint (which was notthis version posted October 16, 2019. . https://doi.org/10.1101/805770doi: bioRxiv preprint

onto a moving PVDF membrane for subsequent immunoprobing and imaging22. While not integrated with single-cell isolation, the approach demonstrated impressive multiplexing: it was used to detect 11 target proteins from 9 serial separations from the same aliquot of bulk cell lysate with similar total protein content to a single-cell (400ng total protein) in 8 minutes.
Single-cell western blotting is a technology that allows for rapid simultaneous lysis of single-cells and parallel separation and immobilization of endogenous proteins at a rate of ~200 cells/min23. This is accomplished by patterning a polyacrylamide gel with a microwell array to enable parallel cell isolation, protein sieving and scaffolding in a 2D (X-Y) plane of functional hydrogel. The density (number of separations per unit area) and throughput (total number of separations) of these separations is limited by the area required for the separation lane. Here, we introduce projection electrophoresis: a device for high-density single-cell immunoblotting, in which separations are performed in the previously unused Z-direction, removing the limiting parameter for microwell array density. Inspired by applications of multifunctional 3D hydrogel materials like Expansion Microscopy24 and CLARITY25, as well as Z-directional electrophoresis enabling protein transfer in western blotting26,27 and bulk separations in layered systems28,29, we sought to leverage the full volume of the gel to encapsulate 3D information describing both protein size and sample position. Using the full 3D volume improves microwell array density to 25 wells/mm2 from 2 wells/mm2 in earlier demonstrations of single cell western blotting. Additionally, the more tightly packed microwell array in projection electrophoresis allows for an order of magnitude less cell suspension volume to be used during cell settling to assay the same number of cells (25-35 μL in projection electrophoresis compared to 300 μL in 2D approaches to assay ~300 cells), resulting in a 10-fold improvement in cell sampling rate. In this work, we describe the separation performance and 3D diffusion physics governing the design of the projection electrophoresis system, and demonstrate its application to the near-simultaneous lysis and separation of proteins from hundreds of single cells.
Results and Discussion
Establishing projection electrophoresis as an analytical tool. In lieu of serial interrogation and electrophoretic analysis of individual mammalian cells, we utilize a 3D microfluidic device for parallel protein analysis of hundreds of individual cells (Figure 1a). We first sought to verify the separation mechanism governing protein electrophoresis in the concurrent analyses. To understand the protein separation mechanism, we assessed electromigration of a ladder of well-characterized protein standards (donkey immunoglobulin anti-mouse IgG, IgG: 150 kDa; bovine serum albumin, BSA: 66.5 kDa; ovalbumin, OVA: 42.7 kDa, each labelled with AlexaFluor® dyes; Figure 1b). When purified protein solution is pipetted on top of the gel block (with gel block face stippled with microwells), the protein solution partitions into the microwells (via size-exclusion partitioning in the hydrogel), thus providing a convenient, well-controlled means for sample loading into each sample injector. Across a range of elapsed separation times spanning 10-25 s, confocal fluorescence imaging (Figure 1b-d) reports representative PAGE readouts, after protein photocapture to define the PAGE endpoint. Rapid electrophoresis is required (< 30 s), given the ultra-short separation axis lengths (1 mm), which are defined by the thickness of the gel block. Analogous to our previously reported and planar (X-Y) single-cell western blot23,30, the protein PAGE performance utilized in 3D projection electrophoresis benefits from fast separation times (<1 minute) alongside the multifunctional gel that toggles from separation matrix to protein capture scaffold with 45-second UV exposure31 thus supporting fast separation immediately followed by immobilization, reducing diffusional spreading of the protein spots between assay stages.
Under these conditions, we observe proteins resolving along the separation axis (z-axis), while retaining sufficient information to map each protein separation back to the originating location of the respective microwell injector (in X-Y plane). Ferguson analysis (Figure 1d) shows a log-linear relationship with molecular mass, as expected in size-sieving gel electrophoresis32. Further, in this unique format, we observed constant-velocity and size-dependent electromigration for the ladder and additional protein species assayed by projection electrophoresis (Figure 1e; electrophoretic mobilities of OVA: 3.3-3.7x10⁻⁵ cm2/Vs; BSA: 2.5-2.9x10⁻⁵ cm2/Vs; transferrin: 1.3-1.7x10⁻⁵ cm2/Vs, lectin: 0.96-1.14x10⁻⁵ cm2/Vs; IgG: 7.4-8.0x10⁻⁶ cm2/Vs). We note that this constant-velocity migration required optimization of electromigration conditions to mitigate deleterious pH changes and bubble formation (effects of electrolysis) at the electrodes; this protocol change increased the R2 of linear fits to the protein migration data from 0.87±0.06 to 0.97±0.03 for the three ladder protein species (Figure S1, Supplementary Information). For BSA and OVA ladder species, both a protein monomer and dimer species are resolvable, as would be expected in high performance protein PAGE33–36. In addition to reduction in diffusional spreading, assay optimization for constant-velocity migration ensures that the assay operates in a size-separation regime throughout the separation duration, maximizing the separation performance possible in short electrophoresis times.
To understand the separation resolution (RS) attainable in the gel volume, we calculated the Rs of two of the well-characterized ladder proteins (OVA, BSA) in a 10%T PA gel volume (Figure 1f). By 20 s of elapsed separation time, the separation exceeded the Rs = 1.0 threshold and were fully resolved. Based on the dominant separation mechanism and rapid attainment of protein separation, analysis of the purified protein ladder solution suggests that projection electrophoresis is suitable for analytical quality protein analysis. The high performance of the rapid microfluidic protein analysis described here is in contrast to another 3D system, designed for coarse, preparatory Z-direction separation performance27,37, as previously demonstrated for bulk samples using a multilayered gel to coarsely fractionate small proteins (14-77 kDa) from large proteins (20-343 kDa)29.
Device design and imaging approach are informed by 3D diffusion of target proteins. We sought to understand and then formulate physics-based constraints governing design of the projection electrophoresis device and assay. The open microfluidic design of the projection electrophoresis device uses a microwell array to perform sample isolation and preparation, with an abutting gel volume that performs the analytical functions (protein PAGE, immunoblotting). As such, we sought to understand physics-based factors that set the minimum acceptable microwell-to-microwell spacing (microwell pitch, Dwell) and, hence, maximum number of parallel protein PAGE separations per projection electrophoresis device. As illustrated schematically in Figure 2a, the Dwell spacing is influenced by the length scale of diffusional band broadening (σxy, in X-Y plane) during protein PAGE along the Z-axis. As design guidelines, we note that the throughput of each single-cell projection electrophoresis device (number of single cells assayed per device) will be a function of Dwell (sets separation lane density) and overall usable device dimensions (Figure 2b). Further, the maximum lane density is inversely proportional to σxy
2, as computed in Figure 2c. Two density rules are
certified by peer review) is the author/funder. All rights reserved. No reuse allowed without permission. The copyright holder for this preprint (which was notthis version posted October 16, 2019. . https://doi.org/10.1101/805770doi: bioRxiv preprint

plotted: at Dwell > 4σxy, we would estimate <5% protein overlap between neighboring lanes, while at the more conservative Dwell > 6σxy, we would estimate <0.3% protein overlap assuming Gaussian protein distributions.
During electromigration, protein peaks will diffuse in three dimensions, with diffusion along the Z-axis determining separation resolution (RS) and diffusion in X-Y determining the minimum Dwell. Diffusional spreading of protein bands in all three dimensions depends on protein molecular mass, temperature, time, and the gel density (pore size)38,39. To assess the impact of protein diffusion on setting Dwell, we assessed the well-characterized fluorescently labeled OVA/BSA/IgG protein ladder during protein PAGE in a 7%T gel projection electrophoresis device.
For each time point analyzed by confocal imaging, we determined the Z position of the maximum of the summed fluorescence intensity, for an X-Y region of interest surrounding the each microwell injector. At this Z position, we assessed X-Y resolution by Gaussian fitting X and Y intensity profiles and extracting the mean fitted peak width σxy. For duplicate gels of 5 electrophoresis times, we plotted the squared peak width vs. time in gel fitting to the expected diffusional peak spreading38:
𝜎! = 𝜎"! + 2𝐷𝑡,
For each protein target, the σ0 is related to the injected peak width (dictated by size of the microwell), D is in-gel diffusion coefficient, and t is the total elapsed time since protein injection. Figure 2a shows the confocal fluorescence data for OVA and associated Dwell design rule. Applying the analysis to the full protein ladder (Figure 2d), yields estimates of Dwell, across a range of protein targets and diffusion coefficients (DOVA ~16 μm2/s, DBSA ~ 7 μm2/s, DIgG ~ 2.7 μm2/s calculated from linear fits to the plot of σxy
2 vs. diffusion time). Under the described conditions, the protein target with the largest D (OVA) suggests that a Dwell, of 200 μm will satisfy the trade-off of maximizing separation lane density while minimizing separation lane overlap (7%T gels, 30 s protein PAGE). For comparison, top-down MALDI imaging mass spectrometry utilizes a protein spot pitch of 20-200 μm40.
Building on understanding of the dominant physics, namely diffusion, we next sought to investigate computational approaches to recovery of starting concentration distributions (in the microwell array) from endpoint confocal fluorescence images of the protein PAGE (Figure 2e). In microscopy, deconvolution of an experimentally, theoretically, or computationally-determined, microscope-dependent point spread function (psf) from 2D or 3D images recovers spatial resolution by image postprocessing41–43. Inspired by deconvolution in microscopy, we explored whether we could represent the final protein projection image (I(x,y,z,t)) as the initial protein x-y pattern (p(x,y,z); the spatial arrangement of cells/microwells) convolved with a ‘diffusional point spread function’ psfdiff(x,y,z,t), in turn convolved with the imaging point spread function psfimg(x,y,z,t):
𝐼(𝑥, 𝑦, 𝑧, 𝑡) = 𝑝"(𝑥, 𝑦, 𝑧)⨂𝑝𝑠𝑓#$%%(𝑥, 𝑦, 𝑧, 𝑡))⨂𝑝𝑠𝑓$&'(𝑥, 𝑦, 𝑧, 𝑡).
We chose to describe the diffusional psf using 3D point-source diffusion44:
𝑝𝑠𝑓#$%%(𝑥, 𝑦, 𝑧, 𝑡)) =(
(*+,-)! "#∙ 𝑒𝑥𝑝4−6/
"01"02"
*,-78,
where D is again the protein diffusion coefficient, t the elapsed diffusion time, and M the starting number of molecules at the point source. Although we estimated the full 3D point spread function for each protein, we performed 2D deconvolution only on the individual slice images, without using information from neighboring focal planes (as in a “no-neighbors” deconvolution imaging method45). We used this approach to simplify processing, while recognizing that the simplification limits a full 3D reconstruction and the signal intensity improvement possible from 3D deconvolution. To perform 2D processing, we deconvolved the 2D function psfdiff (through the centre of the point spread function, at Z=0) from 2D confocal slice images at the Z-direction migration peak for each protein (the Z position at which the summed intensity for that protein in the image field of view was maximized). We neglected the convolution with the imaging point spread function, as we expect that the resolution of our measurement is more limited by diffusion (10s of microns for our typical time scales, as shown in Figure 2a) than by the resolution of confocal microscopy (typically sub-micron46).
After deconvolution of the protein PAGE images, we observe a considerable improvement in spatial resolution of XY profiles of separated BSA (Figure 2e; 5-15s elapsed PAGE duration in (i)-(iii)). Comparing the ‘original’ to the ‘deconvolved’ images illustrates that spatial resolution is reduced from σxy = 16±2 μm to σxy = 8.4±0.2 μm (47%) for 5s electrophoresis (15s total time until photocapture), σxy = 25.7±0.6 μm to σxy = 13.1±0.6 μm (49%) for 10s electrophoresis (15s total time), and σxy = 26.3±0.6 μm to σxy = 13.3±0.5 (49%) for 15s electrophoresis (26s total time). Further, the localization of the peak centre was unperturbed by reconstruction (Δμ < 1.1 μm for all analyzed protein spots, with Δμavg = 0.38 μm) and the integrated fluorescence signal of each protein sample is minimally perturbed by the reconstruction except when visible artefacts were present in the deconvolved images as shown in the lowest electrophoresis time (i) (average AUCs after postprocessing are within 2.5% of the initial values in (ii-iii), but 24% in (i)). Taken together, we see physics-based image postprocessing as a promising approach to reconstructing a map of a starting sample from the target concentration distributions in the 3D gel volume, using the endpoint fluorescence readout of protein PAGE. Design for integration of single-cell sample preparation conditions into projection electrophoresis. Having considered design of the projection electrophoresis device and assay using a well-characterized protein ladder solution, we next sought to identify factors important to high-performance protein PAGE analysis of single cells (Figure 3a). We first assessed settling of single U251 cells in 25 μm diameter microwells within the projection electrophoresis gels. Cell settling efficiencies were at 19±4% with the number of settled single cells 251±60 per 9x9 mm projection electrophoresis device. The fraction of microwells occupied by more than one cells was 1.4±0.9%. Further optimization of cell settling densities, well geometries, and settling times would likely improve these values. After cell lysis, diffusion-driven dilution of single-cell lysate occurs
certified by peer review) is the author/funder. All rights reserved. No reuse allowed without permission. The copyright holder for this preprint (which was notthis version posted October 16, 2019. . https://doi.org/10.1101/805770doi: bioRxiv preprint

rapidly in the open microwell geometries. Consequently, we sought buffer chemistries to minimize lysis and solubilization times and used diffusive immunoprobing of model proteins β-tubulin and GAPDH using immunoglobulin fragments (F(ab) fragments) to assess solubilization efficacy. Here, we assessed a range of cell lysis and protein solubilization chemistries (Figure 3b). Across a range of chemistries, we observed differences in protein electromigration and dispersion, which were dependent on buffer composition and delivery methods. We selected a dual-function lysis and solubilization buffer that utilizes the anionic detergents sodium dodecyl sulphate (SDS) and sodium deoxycholate, augmented with a strong chaotrope (8M urea). Comparing solubilization, electromigration, and dispersion of the model protein β-tubulin from U251 glioblastoma cells lysed both without (i) and with (ii) 8M urea in the lysis buffer, we observed rapid electromigration into the 3D gel from the microwell and lower protein peak dispersion with urea present. In a sub-set of separation lanes, two β-tubulin peaks were detectable (Figure 3b), suggesting delayed solubilization for a subset of the β-tubulin molecules, as might be expected depending on the intracellular state of the β-tubulin. In formulating design guidelines for the dual-function lysis/solubilization and electrophoresis buffer, we consider two additional points. First, detergents such as SDS and Triton X-100 form micelles of size on the order of nanometers47,48. Consequently, we explored the corollary hypothesis that size-exclusion partitioning49 of solutes from polyacrylamide gels may limit delivery of such molecules into the bulk of the gel. As the density of polyacrylamide gel negatively correlates with in-gel concentration of size-excluded species49, we explored whether lower density (6%T vs. 20%T) polyacrylamide lysis gels may facilitate improved protein solubilization. By moving to 6%T lysis gels, we observed higher apparent GAPDH mobility (1.08±0.03x10⁻⁴ cm2/V·s using 6%T lysis gel, compared with 0.83±0.08x10⁻⁴ cm2/V·s using 20%T lysis gel, n = 12-14 separation lanes) and potential reduction in dispersion of the protein band towards the microwell. Second, strong chaotropes like urea solubilize proteins by disrupting hydrogen bonds as well as electrostatic and hydrophobic interactions to unfold hydrophobic protein regions50. Urea-based lysis buffers can solubilize different subsets of the proteome, as compared to RIPA-like buffers51. High concentrations of urea (e.g., 8 M) can break down detergent micelles and disturb detergent-protein complexes52,53. Urea, as a small molecule, is less susceptible to size-exclusion partitioning from hydrogels. Just as in other protein separations, the ideal lysis buffer depends on the system and target of interest50. Analysis of another endogenous target protein, GAPDH, after lysis and protein PAGE in in the 8M urea lysis showed protein peaks with low dispersion (Figure 3f).
Next, to determine how the concentration of the single-cell protein lysate changes during sample preparation as described above, we used a combination of finite-element modelling and experimental monitoring of turboGFP-expressing U251 cells during cell lysis (Figure 3c-d). To compare with wide field microscopy imaging data of turboGFP cell lysis, we integrated the 3D protein concentrations over the full Z range of the model to mimic detected widefield fluorescence intensities. Using this metric, after a typical 25s lysis time, we measure 17%±11% of the initial protein intensity. Our simulated profiles overestimate the diffusional dilution of protein, predicting only 2.2% of the initial intensity for in-well lysis after 25s. We attribute the ~15% discrepancy to possible diffusion barrier on the microwell wall surface, arising from either the presence of Rhinohide in the gel matrix, or the presence of residual GelSlick or dichlorodimethylsilane used during gel fabrication. One important consideration for Z-directional projection electrophoresis is that, in contrast to other single-cell protein separation assays such as scWB23,30,54–58 and scIEF59–61, there is no actual protein ‘loss’ in in the Z direction projection platform – only dilution. While other electrophoretic cytometry assays have a fluid layer or lid gel above the thin separation gel, into which protein can diffuse and is lost, in the projection electrophoresis device most (if not all) protein is mobilized into the bulk of the 3D gel when an electric field is applied to initiate PAGE. We then sought to assess how the maximum protein concentration changes during the analytical single-cell PAGE stage (Figure 3e). Using finite-element modelling, we first modelled 25s of lysis before using the resulting concentration profile as the initial condition for a model of in-gel diffusion. From an initial protein concentration of 2 μM in a cylinder representing the cell, we estimate maximum protein concentrations of 2.1 nM (turboGFP), 4.0 nM (BSA), and 6.8 nM (HER2) after 25s lysis and 20s electrophoresis Figure 3e. We compared the expected diffusional dilution during electrophoresis to that expected in a planar system (Fig. S2, Supplementary Information) and found similar dilution during the assay steps in both systems. We note that the planar system is amenable to imaging during electrophoresis, thus our comparison (which predicts similar losses to those reported in our previous work62) serves as validation of the numerical model. From simulations of X-Y spot size from 3D diffusion of β-tubulin, we expect that the protein concentration 80 μm away from the band centre will be <5% of the maximum concentration at the peak of the protein spot, confirming that 200 μm well spacing should also be sufficient for endogenous proteins from single cells. Diffusional dilution of protein is dependent on both analyte size and gel density. The relatively large-pore-size gels used in this work (7%T) are optimal for large analytes (80-200 kDa), with adaptation for smaller analytes accommodated by moving to higher-density (smaller pore size) separation gels. Lastly, we verified the device design suggested by analysis of the well-characterized protein ladder now for the analysis of mammalian cells using the optimized cell preparation protocol (Figure 3f). We anticipated that the cell preparation steps and required time may increase lysate dilution away from that assessed using the idealized protein ladder system in Figure 2, both because diffusion of protein targets in each single-cell lysate occurs during the time required for lysis and solubilization and because single-cell PAGE is run at higher temperature (37ºC vs. 4ºC) to improve protein solubilization. As discussed above, microwell spacing dictates the achievable sample multiplexing on one device. After 10s EP, we measured σ = 32±13 μm for GAPDH in the X-Y plane. At a Dwell = 192 μm (6σ), we estimate that <0.3% of the fluorescent signal from the GAPDH in each cell lysate should bleed into the neighboring lane. Using the device and sample preparation protocols designed here, we observed protein diffusion profiles for endogenous GAPDH that confirm selection of a Dwell = 200 μm is sufficient to limit cross-contamination between adjacent separation lanes. Projection electrophoresis for immunoblotting of protein targets from single mammalian cells. We applied projection electrophoresis to immunoblotting analyses of well-characterized endogenous proteins GAPDH and actinin across populations of individual human BT474 breast cancer cells. We utilized scanning confocal microscopy (Figure 4a) and light sheet microscopy (Figure 4b) to acquire protein immunoblot readouts from the protein PAGE separation lanes filling the volume of each gel device. Each imaging modality presents a trade-off in field of view and Z-axis resolution, along with total imaging time. The laser scanning confocal imaging with 20X NA=1.0 water immersion objective (required for high-resolution optical sectioning) supported 425 x 425 μm field of view, while light sheet microscopy with 5X detection objective (NA=0.16) provided a much larger 1.75 x 1.75 mm field of view. Because its optical sectioning is facilitated by the light sheet forming objectives forming a thin illumination sheet, light sheet microscopy allows the imaging optical section thickness to be decoupled from the detection objective NA,
certified by peer review) is the author/funder. All rights reserved. No reuse allowed without permission. The copyright holder for this preprint (which was notthis version posted October 16, 2019. . https://doi.org/10.1101/805770doi: bioRxiv preprint

facilitating the use of lower NA detection objectives while maintaining optical sectioning63. The light sheet images acquired for projection electrophoresis had optical section thicknesses on the order of 10 μm, which should be sufficient to assess the Z-directional peak widths of tens of microns in our separated protein peaks. Both protein targets were detected by optical sectioning microscopy of the gel volume, with the expected differential in electrophoretic mobility and nearly equivalent peak widths for the 37 kDa and 100 kDa targets (Figure 4c). Although from diffusion theory we would expect a larger peak width for the smaller protein target, differences in peak dispersion between targets can result in wider measured peak widths. Widefield microscopy allowed comparison of live-cell fluorescence imaging – prior to endpoint immunoblotting – and endpoint probed GAPDH signal. The analysis revealed appreciable spatial correlation between live cell imaging prior to separation and separated GAPDH (Figure 4d). Comparison shows 63-74% of live cells detected are correlated with GAPDH detection. Further, light sheet microscopy detected both protein targets, with similar expected differential electrophoretic velocity and comparable peak widths of the immunoprobed targets to those measured with confocal (Figure 4e). Given similar results in detection, migration location, and peak width for the model endogenous protein targets, the substantially larger field of view of light sheet microscopy proved beneficial, allowing endpoint imaging of 10x larger number of immunoblots (n = 22 with confocal; n = 303 actinin and n = 507 GAPDH with light sheet microscopy). The imaging throughput of light sheet microscopy was >10X higher than scanning laser confocal (Figure 4f), moving from approximately 120s/lane readout time down to approximately 8s/lane. While cell lysis is not instantaneous across cells, with biological variation in lysis time on the order of seconds64, the parallel cell analysis approach described here overcomes shortcomings of serial analysis of cells. Serial interrogation of individual cells leads to asynchronous analysis of cells, with substantial time delays between analysis of the first cell and last cell in a population. Considering one example single-cell enzyme analysis separation, where individual cells are interrogated by a capillary sampler after cell lysis via a UV light pulse19, we estimate a 104 minute delay between interrogation of the first cell and interrogation of the last cell (219 cells analyzed with an analysis throughput of 2.1 cells/min). In contrast, concurrent analysis of 200-500 cells is completed with < 10 s delay between the first and last cell, assuming a small delay in cell lysis arising during the application of the lysis and solubilization buffer. By introducing a new, rapid and parallelized electrophoresis approach, we demonstrate simultaneous single-cell separations of hundreds of single cells with an active assay time of 2.5-6 cells/s (from lysis through photocapture), depending on settling efficiency – this represents a 70- to 180-fold improvement in assay throughput over serial capillary systems as depicted in Figure 4g. Compared with planar single-cell western blotting, we demonstrate a 10-fold reduction in sample volume to assay the same number of cells. Looking forward, these already impressive metrics can be improved in future work by moving to larger-area gels to further parallelize analysis, and by using our understanding of the driving small-scale physics to optimize gel materials for targets of interest and thus enable the use of even higher well densities.
Materials and Methods
Polyacrylamide gel fabrication. Substrate-free and featureless polyacrylamide gels (used for lysis and enclosing purified protein wells) were fabricated between a glass plate (McMaster-Carr) and 25x75 mm or 50x75 mm glass slide (VWR), both treated with Gel Slick® glass plate coating according to the manufacturer’s instructions. For purified protein experiments and cell seeding gels, microwell-stippled gels were cast between a methacrylate-functionalized glass slide (treated to promote gel adhesion as previously described by our group30) and a dichlorodimethylsilane (Aldrich)-treated silicon wafer (WaferPro). The wafer was patterned with SU-8 3050 (Microchem) features and was silane-treated to facilitate gel release as previously described by our group30. Wafers with 40 μm high SU-8 features (32 μm diameter microwells for purified protein experiments, or 25 μm diameter microwells for BT474 and U251 single-cell separations) were fabricated according to the manufacturer’s instructions and then silane-treated as previously described30. Our approach for substrate-free micropatterned gel fabrication was inspired by that recently developed by our group to fabricate releasable gel microparticles65. In all cases, 1 mm or 500 μm thick gels were fabricated using spacers of the appropriate thickness (C.B.S Scientific Gel Wrap) between the two glass pieces or between the wafer and glass slide.
Acrylamide precursor solutions for the various gels were prepared by diluting 30% stock acrylamide/bis-acrylamide precursor (Sigma) and Rhinohide® solution (to increase mechanical robustness of substrate-free gels) in ultrapure water (Millipore®) and 10X tris-glycine (Bio-Rad) where appropriate. Separation gels and adherent cell gels contained 3 mM final concentration BPMA: N-(3-((3-benzoylphenyl)formamido)propyl) methacrylamide, which was custom-synthesized by PharmAgra Labs (cat. no. PAL0603)30. BPMA is co-polymerized into the gel matrix and permits photo-immobilization of proteins. Gels were chemically polymerized for 60 minutes with 0.08% (w/v) ammonium persulfate (APS, Sigma) and 0.08% (v/v) TEMED (Sigma), from freshly-prepared 10% stock solutions in ultrapure water. The constituents of the various gel types used in this work are presented in Table 1, and a schematic showing the released gel fabrication and molding process is depicted in Figure S3 (Supplementary Information).
After polymerization, gels were trimmed to size using a razor blade and released from the glass substrate by carefully sliding the razor blade under the gel, applying firm pressure to the glass and gently adding water between the razor blade and gel to lubricate and prevent tearing. Separation and shield/lysis gels were stored in the appropriate buffer solution for a minimum of 12 hours and up to 4 days prior to running separations. Buffer storage conditions are presented in Table 1 and were either (1) dual function lysis-electrophoresis modified RIPA buffer (1X or 2X RIPA as described in Table 2), (2) run buffer (1X tris-glycine with 0.5% Triton X-100), or (3) 1X tris-glycine for gels to be used for cell settling. Buffers used in this work are described in Table 2.
certified by peer review) is the author/funder. All rights reserved. No reuse allowed without permission. The copyright holder for this preprint (which was notthis version posted October 16, 2019. . https://doi.org/10.1101/805770doi: bioRxiv preprint

Table 1. Fabrication conditions for the various types of polyacrylamide gels used in this work. Gel type (thickness)
Gel density
Stock acrylamide
Rhinohide BPMA Buffer Initiator(s) Polymerization time
Fabrication setup
Purified protein: separation (1 mm)
7%T or 10%T
30% (37.5:1) stock; final concentration 7% or 10% w/v Sigma-Aldrich: A3699
10% v/v final from stock
3 mM from 100 mM stock in DMSO
10% (v/v) final concentration 10X tris-glycine; stored in modified RIPA
0.08% APS (Sigma-Aldrich: A3678), 0.08% TEMED (Sigma-Aldrich: T9281)
60 mins Methacrylate functionalized glass slide and silanized silicon wafer mould
Purified protein: shield (500 μm)
20%T 30% (37.5:1) stock; final concentration 20% w/v
10% v/v final from stock
none 10% (v/v) final concentration 10X tris-glycine; stored in run buffer
0.08% APS, 0.08% TEMED
60 mins Gel Slick® (Lonza: 50640) treated glass plate and glass slide
Well gels for single cell separations and in-well lysis tests (1 mm)
7%T 30% (37.5:1) stock; final concentration 7% w/v
4.66% v/v final concentration from stock
3 mM from 100 mM stock in DMSO
10% (v/v) final concentration 10X tris-glycine; stored in PBS (lysis monitoring) or 1X tris-glycine (single cell separations)
0.08% APS, 0.08% TEMED
60 mins Methacrylate functionalized glass slide and silanized silicon wafer mould
Lysis shield gels for in-well lysis tests (1 mm)
20%T 30% (37.5:1) stock; final concentration 20% w/v
10% v/v final from stock
none None; stored in modified RIPA
0.08% APS, 0.08% TEMED
60 mins Gel Slick® treated glass plate and glass slide
Lysis shield gels for single-cell separations (1 mm)
6%T or 20%T
30% (37.5:1) stock; final concentration 6% or 20% w/v
10% (20%T) or 4.66% (6%T) v/v final from stock
none 10% (v/v) final concentration 10X tris-glycine; stored in 2X modified RIPA and transferred to 2X RIPA containing 8M urea for >10 minutes prior to separation.
0.08% APS, 0.08% TEMED
60 mins Gel Slick® treated glass plate and glass slide
Table 2. Projection electrophoresis buffers. 1X tris-glycine and 0.5% Triton X-100
1X tris-glycine 1X RIPA and 1X tris-glycine
2X RIPA and 2X tris-glycine
2X RIPA and 8M Urea
10X tris-glycine: 10% v/v Bio-Rad #1610734
10X tris-glycine: 10% v/v 10X tris-glycine: 10% v/v 10X tris-glycine: 20% v/v Urea: 8M final
Triton X-100: 0.5% v/v Sigma-Aldrich: X100
MilliQ Water: 90% v/v SDS: 0.5% w/v Sigma-Aldrich #L3771
SDS: 1% w/v 10X tris-glycine: 20% v/v
MilliQ Water: 89.5% v/v -- Sodium Deoxycholate: 0.25% w/v S Sigma-Aldrich #D6750
Sodium Deoxycholate: 0.5% w/v
SDS: 0.1% w/v
-- -- MilliQ Water: 79.8% v/v MilliQ Water: 79.8% v/v Sodium Deoxycholate: 0.5% w/v
-- -- -- -- MilliQ Water: 79.8% v/v
Z-directional electrode system. The Z-directional electrode separation system consists of planar electrodes integrated into a custom laser-fabricated alignment setup and brought into contact with two 32 mm diameter, 3 mm thick neodymium rare-earth magnets on the back side of each electrode (each magnet specified to provide 19 lbs of pull force). Constant spacing between the electrodes is facilitated by 2.5 mm (purified protein experiments) or 3 mm (cell experiments) removable polymer spacers (C.B.S Scientific Gel Wrap) at the top and bottom of the electrodes. The planar electrodes were commercial platinum-coated electrotransfer anodes (Bio-Rad Criterion anode plates) with plastic housings modified to permit close proximity of the electrode surfaces. Electric fields were provided by a power supply (Bio-Rad PowerPac® Basic) connected to the electrodes with standard banana plug interfacing. Cold packs on the back side of each electrode maintained gel temperature at approximately 4°C to help to mitigate deleterious effects of Joule heating during purified protein separations. To aid in lysis and protein solubilization57, the cold packs were heated in a 55ºC water bath for single-cell separations, yielding electrode temperatures of approximately 37ºC. Hot packs were heated for >10 minutes to equilibrate to temperature, and exchanged approximately every 15 minutes between separations.
Purified protein separation experiments. Mixed molecular weight purified protein solutions were prepared by diluting stock solutions of Alexa Fluor®555-labelled bovine serum albumin (BSA; Thermo Fisher Scientific; 5 mg/mL stock), Alexa Fluor®488-labelled ovalbumin (OVA; Thermo Fisher Scientific; 2 mg/mL stock), and Alexa Fluor®647-labelled donkey anti-mouse secondary antibody (IgG; Thermo Fisher Scientific; 2 mg/mL stock) in a run buffer consisting of 1X tris-glycine (prepared by ultrapure water dilution of 10X stock, Bio-Rad) containing 0.5% v/v Triton X-100 (Sigma). High molecular weight purified protein solutions were prepared by diluting stock solutions of Alexa Fluor®488-labelled lectin (Thermo Fisher Scientific; 2 mg/mL stock), and Alexa Fluor®647-labelled transferrin (Thermo Fisher Scientific; 5 mg/mL stock) in the same run buffer. All proteins were diluted to a final concentration of 5 μM.
1 mm thick western blotting filter paper (Thermo Fisher Scientific 84783) was cut into 12x12 mm squares and allowed to equilibrate in dual-function lysis-electrophoresis modified RIPA buffer for >10 minutes prior to starting separations. Microwell-patterned separation gels of 1 mm
certified by peer review) is the author/funder. All rights reserved. No reuse allowed without permission. The copyright holder for this preprint (which was notthis version posted October 16, 2019. . https://doi.org/10.1101/805770doi: bioRxiv preprint

thickness and shield gels of 500 μm thickness were prepared as described in Table 1, cut into squares of 9x9 mm (separation gel) or ~12x12 mm (shield gel), and equilibrated in the appropriate buffer for >12h.
We first assessed the appropriate constant current conditions to yield the target electric field. We set up a dummy separation stack consisting of the anode (bottom), the buffer-equilibrated filter paper, a separation gel, a shield gel (with bottom surface dried by placing on a clean, dry Kimwipe), and the cathode (top). We supplied a constant voltage of 13 V (the necessary voltage for an electric field of 52 V/cm) and noted the initial current through the dummy stack (typically ~33 mA). This constant current was chosen for each following separation run on a given day, and the initial and final voltages were noted during each trial to quantify the electric field and resistance changes during the separation.
To run the separations, we again stacked the anode, buffer-soaked filter paper, and separation gel, but this time dried the top (microwell-studded) surface of the separation gel gently bringing it into contact with a folded kimwipe prior to stacking on top of the filter paper. Drying the top surface of the separation gel and bottom surface of the shield gel reduces dilution of the purified protein solution prior to separation. We pipetted 3 μL of the mixed purified protein solution (either the mixed molecular weight standard or the high molecular weight standard) on top of the separation gel and spread the resulting droplet to cover the surface of the gel using a p20 pipette tip, taking care not to puncture the gel surface. We then dried the bottom side of a shield gel by placing it on a folded kimwipe, brought it into contact with the separation gel by carefully lowering it from one corner to reduce bubble entrapment, and assembled the cathode on top. We supplied constant current between the anode and cathode for varying electrophoresis times, running duplicate gels for each electrophoresis time in each experiment.
Immediately after electrophoresis was complete, the power was shut off and the system disassembled to permit optical access for a UV source (Hamamatsu). The liquid light guide-coupled UV source was used to photocapture the separated protein bands using a 45s UV exposure, holding the tip of the liquid light guide approximately 4 cm from the separation gel. The total time between beginning electrophoresis and initiating UV exposure was recorded for each test as an estimate of the in-gel diffusion time.
After photocapture, each gel was rinsed briefly in deionized water and then stored for >12 hours in 1X tris-buffered saline solution with Tween® (TBST) in a polystyrene 12-well plate prior to imaging to permit release of any non-photocaptured protein. Gels were imaged through a #1 coverslip using a Zeiss LSM 880 laser-scanning confocal microscope fitted with a 20X water dipping objective (NA=1.0, Zeiss W Plan APO 20x/1 DICIII). A confocal Z-slice spacing of 5 μm was chosen, and volumes extending ~100 μm past visible fluorophore bands were imaged. As we were not quantifying or comparing protein abundance, excitation laser powers were adjusted to permit fluorescence visibility depending on the sample brightness, as fluorescence intensities were not compared between purified protein samples. Similarly, images were brightness and contrast-adjusted in Fiji66 (based on ImageJ67, National Institutes of Health) to ensure visibility of protein bands.
Purified protein confocal datasets were analyzed using custom analysis scripts in MATLAB®. The scripts were designed to (1) find and track regions of interest (ROIs) corresponding to protein originating from each of the microwells through the depth of each confocal stack, (2) create 1-D intensity plots of summed fluorescence intensity vs. Z depth for each ROI by summing the fluorescence intensity for the ROI at each Z-plane, (3) assess the Z migration distance and peak width for each protein by Gaussian fitting each intensity profile peak, allowing the user to set bounds for fitting peaks corresponding to each purified protein, (4) measure the diffusional spreading of protein from each microwell by Gaussian fitting the summed 1-D X- and Y-intensity profiles for each protein at its Z migration peak location for each protein, (5) plot migration distance, Z-direction peak width, and X-Y peak width vs. electrophoresis time or diffusion time, comparing across multiple gels.
Zeiss CZI confocal Z-stacks and associated metadata were imported into MATLAB® (MathWorks®) using the MATLAB® Bio-Formats libraries provided by the Open Microscopy Environment68. ROIs were segmented in each Z-slice image (summing the intensities of all colour channels into one image for the purposes of segmentation) using intensity thresholding followed by morphologic open and close operations to remove erroneously-segmented small features and close incomplete contours. A fill operation was then used to close all holes in the segmented spots of protein, and all segmented objects touching the border of the image were removed. The centroids of the segmented spots of protein at each Z location were stored, and a MATLAB® particle tracking library (based on a previous IDL implementation69) made publicly accessible by Prof. Daniel Blair and Prof. Eric Defresne70 was used to track the positions of protein originating from each well through the Z depth of the image. The tracked centroids were then subject to a quality control step to remove protein spots that were only found in small portions of the full Z volume. After this was complete, the tracking code output a set of tracked ‘particles’ (protein spots originating from a given microwell), each with a list containing the x-y location of the centroid of each protein spot for every Z location in the image. To create the intensity profiles, the intensities in a 300 pixel (102 μm) square ROI were analyzed surrounding each centroid at each Z location. The data were background-subtracted by subtracting from each pixel the average measured intensity 15 μm below the bottom of the microwells, in regions at least 100 pixels (34 μm) from any segmented protein spots. After Gaussian fits to find the migration distance, z-direction peak width, and x-y peak width for each protein peak, the data from all of the ROIs from multiple gels (multiple electrophoresis times in duplicate) were plotted and fit to the expected linear physical relationship (migration distance vs. electrophoresis time, squared peak width and squared x-y peak width vs. total in-gel time).
Cell culture. U251 human glioblastoma cells stably transduced with turboGFP by lentiviral infection were kindly provided by Prof. Sanjay Kumar’s laboratory at UC Berkeley. Cells were maintained in tissue culture flasks in a standard cell culture incubator (Heracell 150i) at 5% CO2 and 37°C, in DMEM (Gibco) supplemented with 10% FBS (Gemini Bio-Products Benchmark), 1% penicillin/streptomycin (Gibco), 1X sodium pyruvate (Gibco 100X stock), and 1X non-essential amino acids (Gibco 100X stock). The cells were passaged at a density of 1:10 to 1:40 after reaching approximately 80% confluency by detaching with 0.05% Trypsin-EDTA (Gibco), centrifuging for 3 minutes at 1000 RPM, and resuspending in completed media to reseed.
BT474 human breast cancer cells were purchased from the UC Berkeley Biosciences Divisional Services Cell Culture Facility. Cells were maintained in tissue culture flasks in a standard cell culture incubator (Heracell 150i) at 5% CO2 and 37°C, in DMEM (Gibco) supplemented with 10% FBS
certified by peer review) is the author/funder. All rights reserved. No reuse allowed without permission. The copyright holder for this preprint (which was notthis version posted October 16, 2019. . https://doi.org/10.1101/805770doi: bioRxiv preprint

(Gemini Bio-Products Benchmark) and 1% penicillin/streptomycin (Gibco). The cells were passaged at a density of 1:2 to 1:8 after reaching approximately 80% confluency by detaching with 5 mM EDTA in PBS (Invitrogen), centrifuging for 3 minutes at 1000 RPM, and resuspending in completed media to reseed.
Cell lysis monitoring experiments. We compared diffusion profiles of cells lysed after settling in 32 μm diameter, 40 μm high microwells within 1 mm thick gels. 18x18 mm microwell gels and lysis gels were prepared and equilibrated in PBS for >12h as described above.
To settle cells in microwells, we followed a procedure similar to that used for single-cell western blotting30: U251-turboGFP cells were detached using 0.05% trypsin-EDTA, resuspended in PBS at a concentration of 100 000 cells/mL, and filtered using a cell strainer (Corning). The 18x18 mm microwell gels were placed well side up in a 60 mm tissue culture dish. Approximately 100 μL cell solution was pipetted onto the surface of each well gel (to cover but avoid spillage over the edge of the gel) and spread to cover the full array of microwells. The cells were allowed to settle for 5 minutes on ice, gently agitating approximately every 2 minutes, before rinsing with 1-3 mL PBS by tilting the tissue culture dish at a ~40° angle, pipetting PBS at the top surface of the microwell gel, and allowing it to flow over the surface of the microwell gel into the bottom of the petri dish. After rinsing was complete, the excess PBS/cell solution was aspirated for biohazard disposal.
To facilitate monitoring, each microwell gel was immobilized within a 60 mm petri dish by pipetting 200 μL of a warmed solution of 5% agarose in PBS beside the gel and allowing it to gel at room temperature (in contact with the edge of the gel and the petri dish). Before lysis, excess fluid was removed from the gel by tilting the petri dish and wicking away the fluid layer by bringing a folded KimWipe into contact with the corner of the gel (not touching cell-containing regions). The petri dish was then secured to the stage of an Olympus IX71 microscope for monitoring with a 4X or 10X air objective. Fluorescence excitation was provided by an X-Cite source (Excelitas Technologies) through a GFP filter set (Chroma 49011 ET), and fluorescence was measured using an EM-CCD camera (Andor iXon). Time-lapse images of the turboGFP fluorescence were captured using the MetaMorph® imaging software (Molecular Devices). After focusing, setting up the imaging settings and initiating the timelapse, the lysis gel was carefully placed on top of the cell-containing gel, starting with one corner and then smoothly bringing the rest in contact to reduce bubble entrapment between the two gels. The time at which the lysis gel was placed in the timelapse series was recorded. The lysis gel was a 20%T, 10% Rhinohide shield gel equilibrated in 2X RIPA-like lysis buffer.
The lysis monitoring data were analyzed using custom scripts written in MATLAB®. At each time point, the cells were segmented using adaptive thresholding of the median filtered (3x3 neighborhood) image. The segmentation was improved using morphologic open and close operations, and the centroids of the segmented cells were computed and stored. The MATLAB® particle tracking library (based on a previous IDL implementation69) made publicly accessible by Prof. Daniel Blair and Prof. Eric Defresne70 was used to track the centroids of each cell over the course of the experiment, although minimal drift was observed. The maximum fluorescence intensity and total fluorescence intensity in a 100 μm diameter circle surrounding the centroid of each segmented cell were tracked for each time point. All pixel intensities were background-subtracted using the average fluorescent intensity of the background region at each time point, taken to be the image regions greater than 30 μm away from all segmented regions.
Finite-element modelling of protein diffusion. We used finite-element modelling of dilute species transport in COMSOL® Multiphysics to predict protein concentrations during lysis and electrophoresis. The simulation geometries for the Z-directional simulations are presented in the cross-sectional view shown in Figure 3. 2-D axisymmetric models were used for all simulations due to the inherent symmetry of the geometry. Diffusion coefficients in free solution portions of the model were estimated from the Stokes-Einstein equation38, while in-gel diffusion was estimated from the free-solution diffusivity using the methods presented by Park, et al.39 Protein hydrodynamic radii were estimated from the number of amino acids71. Thermodynamic partitioning of protein was simulated using flux boundary conditions relating in-gel concentration to in-solution concentration using a partition coefficient k=Cgel/Csolution. Partition coefficients were estimated using the Ogsten model72 (assuming size-exclusion partitioning), using estimates of fibre radius from Tong and Anderson49 and hydrogel volume fraction from the data presented by Baselga et al.73 A temperature of 4°C was assumed for all simulations except the comparison with the single-cell western blot platform, which assumed 10°C for both platforms. The diffusion and partition coefficients for each protein at 4°C are presented in Table 3.
Table 3. Protein hydrodynamic radii (rH), diffusion coefficients (D) and partition coefficients (k) used in finite-element modelling of diffusion during lysis and electrophoresis.
Protein rH [nm] Dsol [m2/s]
D7%T
[m2/s] D20%T [m2/s] k7%T k20%T
turboGFP 2.3 6.61x10⁻¹¹ 1.36x10⁻¹¹ 9.49x10⁻¹³ 0.501 0.0415 BSA 3.01 5.05x10⁻¹¹ 7.90x10⁻¹² 3.49x10⁻¹³ 0.344 0.00744
HER2 3.76 4.04x10⁻¹¹ 4.88x10⁻¹² 1.39x10⁻¹³ 0.213 8.16x10⁻⁴
In each model, gel-solution boundaries were modelled as flux boundary conditions taking partitioning into account. The edges of each model were modelled as flux boundary conditions permitting protein to freely leave the model; however, the simulation region was sufficiently large (500x500 μm) that changing these boundary conditions to no flux resulted in negligible change to the modelled concentration profiles. The initial protein concentration in the cell region was 2 μM, while the initial concentration elsewhere in the model was zero. In models of the single-cell western blotting platform, the bottom surface of the gel was modelled as no flux to model the presence of the glass slide present in that system. The model was meshed with a physics-controlled mech calibrated for fluid dynamics, and a user-controlled override with maximum element size of 0.5 μm was used in the microwell and thin fluid layer regions to ensure sufficient mesh density.
certified by peer review) is the author/funder. All rights reserved. No reuse allowed without permission. The copyright holder for this preprint (which was notthis version posted October 16, 2019. . https://doi.org/10.1101/805770doi: bioRxiv preprint

A time-dependent study was used to model the protein concentration profile during lysis and electrophoresis. To model both in the same diffusive model, the diffusion and partition coefficients were set as step functions. For the first 25s of the model (the lysis portion), the diffusion and partition coefficients were set as in Table 3. After this 25s lysis period, all partition coefficients were set to 1, and the diffusion coefficients in all regions of the model were set to those for 7%T gel (the separation gel), effectively simulating instantaneous injection of the full protein profile into a separation gel. While this method is straightforward and does not require modelling of the electrophoresis physics, it provides a conservative (over-) estimate of Z-directional diffusional spreading because it does not model stacking of the protein band as it is injected from free solution into the gel.
After running the model, we assessed the maximum protein concentrations in the simulated geometry. We also assessed the integrated protein intensities (the protein concentrations at each radial (x) location, integrated in z) to model the wide field microscopy imaging measurements in which fluorescence from the full Z region is integrated into a 2D image. These intensities were compared with the experimental lysis monitoring data.
Single-cell separations. Adherent U251 glioblastoma and BT474 breast tumor cells were detached from culture flasks with 0.05% Trypsin-EDTA (glioblastoma) or 5 mM EDTA in PBS (BT474) and resuspended in cold PBS at a concentration of 1.5x10⁶ cells/mL. For viability staining, BT474 cells were stained with Calcein-AM in incomplete DMEM for 20 minutes at room temperature prior to resuspension. Cell suspensions were kept on ice and filtered through a cell strainer to reduce cell aggregates immediately prior to settling.
Micropatterned separation gels were stored in 1X tris-glycine (Bio-Rad) and buffer-exchanged to sucrose-dextrose dielectrophoresis buffer (DEP buffer: 2.39 g/L HEPES, 80.7 g/L sucrose, 4.5 g/L dextrose, 11.1 mg/L CaCl2; pH adjusted to pH 7.5 with NaOH)74 at least 10 minutes prior to cell settling. To settle the cells, gels were placed microwell side up inside of a 35 mm tissue culture dish. 25 µL of single-cell suspension was supplied to each 9x9 mm gel (by first pipetting 15 µL onto the gel surface, spreading with a pipette tip while taking care not to perforate the gel surface, and subsequently dispensing another 10 µL onto the surface. Cells were allowed to gravitationally settle for 20 minutes, agitating the gel periodically and covering the gel with the lid of the 35 mm tissue culture dish (to reduce drying). Settled cells were checked at the 10 minute mark, and if the cell suspension had aggregated towards the centre of the gel, an additional 10 µL of cell suspension was supplied to the gel edges.
After 20 minutes of settling, gels were rinsed by holding the petri dish at a ~40º angle and pipetting 0.5 mL of DEP buffer onto the top corner of the gel, allowing the fluid stream to wash over the full gel into the tissue culture dish. The wash fluid was aspirated for biohazardous waste disposal, and the wash was repeated with an additional 0.5 mL of DEP buffer before pipetting ~40 µL DEP buffer on top of the gel to prevent drying during imaging. Tiled images of the settled cell fluorescence were captured using the ScanSlide plugin for the MetaMorph® imaging software (Molecular Devices), using an Olympus IX51 inverted widefield fluorescence microscope fitted with an X-Cite® illumination source (Excelitas Technologies), GFP filter set (Chroma 49011 ET), and CoolSNAP HQ2 CCD camera (Teledyne Photometrics).
4 mL aliquots of lysis buffer were prepared by dissolving urea to a final concentration of 8 M in 2X RIPA-like lysis buffer in a water bath set to 55ºC. Lysis gels (14x14x1 mm) were stored in 2X RIPA-like lysis buffer and transferred to aliquots of urea lysis buffer as soon as the urea had dissolved (10-60 minutes prior to running the separations). The lysis gels in buffer aliquots were heated to 55ºC in a water bath until immediately prior to use, agitating periodically to ensure the solution was well mixed.
After cell settling and live-cell imaging, 4 mL 2X tris-glycine (Bio-Rad) was pipetted into the tissue culture dish containing the separation gel and incubated for 1 minute to reduce the concentrations of potentially unwanted ions. A 10x10x1 mm filter paper (cut to size from Thermo Fisher Scientific western blotting filter paper) was hydrated in the heated lysis buffer aliquot and placed on the anode. The separation gel was placed (microwell side up) on top of the filter paper immediately after tris-glycine incubation, placing gently to reduce bubble entrapment between the layers. The lysis gel was removed from the buffer aliquot and placed on top of the separation gel, again placing gradually so as to not introduce bubbles between the gels. The lysis timer was started as soon as the lysis gel was placed, and the electrode system was closed by placing the cathode on top of the lysis gel. After 25s lysis, the separation was initiated by supplying 80 mA of constant current (typically yielding 13-15V initial voltage) using a DC power supply (Bio-Rad PowerPac Basic) and recording the voltage at 5s intervals during electrophoresis. After electrophoresis was complete, the power supply was stopped, electrode system opened, and 45s photocapture was completed using a Hamamatsu Lightningcure UV source. The gel was then rinsed briefly in deionized water before equilibrating in tris-buffered saline with Tween® (TBST) overnight to remove any residual SDS (exchanging the buffer after 2h). Projection electrophoresis gels were blocked overnight in 5% BSA in TBST at 4°C or for between 2-4h on a shaker at room temperature prior to immunoprobing.
Immunoprobing and imaging. Single-cell projection electrophoresis immunoblotting gels were probed either diffusively (for initial characterization experiments using labelled F(ab) fragments in Figure 3) or electrophoretically (using standard primary and fluorescently-labelled secondary antibodies in Figure 4). All wash steps were performed using an electrophoretic wash platform.
In-gel probing requires high concentrations of immunoprobes to mitigate size-exclusion partitioning effects30,49. To minimize reagent consumption, we probe single-cell western blotting gels using minimal solution volumes. For the projection electrophoresis system, larger probe volumes are required to probe thicker gels; as such, we deliver probes using thin (0.5-1 mm thick) hydrogel layers to provide even probe delivery to all regions of the gel. Fluid, in contrast, tends to pool around gel edges, resulting in brighter probed signal at the gel edge. Constituents and fabrication parameters of probe delivery gels are described in Table 4.
certified by peer review) is the author/funder. All rights reserved. No reuse allowed without permission. The copyright holder for this preprint (which was notthis version posted October 16, 2019. . https://doi.org/10.1101/805770doi: bioRxiv preprint

Table 4. Probe delivery gel fabrication parameters for electrophoretic and diffusive probing.
Gel type Final agarose concentration after probe dilution
Antibody probes Gelation time
Fabrication setup
Primary antibody agarose electrophoretic probe delivery gel
1.5% g/ml (dissolved in 1X tris-glycine) UltraPure LMP Agarose, (Thermo-Fisher: 16520050)
10% v/v final from stock of each: (1) Rb α-actinin & (2) Gt α-GAPDH
5 mins on ice pack
Glass plate and glass slide
Secondary antibody agarose electrophoretic probe delivery gel
1.5% g/ml (dissolved in 1X tris-glycine)
10% v/v final from stock of each: (1) Dk α-Rb AF555 & (2) Dk α-Gt AF488
5 mins on ice pack
Glass plate and glass slide
hFAB agarose diffusive probe delivery gel
1.5% g/ml - dissolved in 1X tris-buffered saline solution with Tween® (TBST) (Santa Cruz Biotechnology, cat. no. sc-281695)
10% v/v final from stock of either: (1) Bio-Rad hFAB Rhodamine α-GAPDH or (2) hFAB Rhodamine α-tubulin
5 mins on ice pack
Glass plate and glass slide
For diffusive probe delivery, Bio-Rad hFAB probes for GAPDH (12004167) or tubulin (12004165) were mixed at a 1:10 dilution with low melting temperature agarose (Invitrogen 16520-050) solution. Agarose was dissolved in 1X tris-buffered saline solution with Tween® (TBST) to yield a final concentration of 1.5% (w/vol) after probe dilution, and maintained on a hotplate with spin bar at a temperature of ~40°C until mixing with the probes. Temperature of the solution immediately after mixing typically read approximately 30°C. The agarose gel was then immediately cast from the agarose-probe solution by pipetting between a heated (to approximately 30°C) glass plate and microscope glass slide, separated by gel casting spacers (C.B.S. Scientific GelWrap, 0.5 mm thickness). After casting, the glass plate setup was carefully moved onto a cold pack and the agarose was permitted to gel for 5 minutes before carefully disassembling the stack, cutting the gels to match the size of the separation gels, and immediately setting up the probing stacks. Each high-density separation gel was sandwiched between two 0.5 mm thick agarose probe delivery gels in a 24-well plate (with surrounding wells filled with water), sealed with a plate sealer, and incubated at 4°C in the dark for 40 hours.
For electrophoretic probe delivery, agarose probe delivery gels were fabricated in the same manner as the diffusive probe delivery gels described above; however, gels were fabricated at 1 mm thickness. Primary antibodies used were Rb α-actinin (CST 6487, lot 2) and Gt α-GAPDH (SAB2500450, lot 6377C3); secondary antibodies were Dk α-Rb AF555 (A-31572, lot 2017396) and Dk α-Gt AF488 (A-11055, lot 2059218). Immediately after casting the antibody probe delivery gel, a stack was set up for electrophoretic probe introduction. The probe delivery gel was placed against the flat (non-microwell-stippled) side of the separation gel, between two pieces of western blotting filter paper (Thermo Fisher Scientific 84783) held together using a laser-cut acrylic holder with a cut-out for the gel stacks. The holder was used to suspend the gels (with the separation gel facing the anode (+) and delivery gel facing the cathode (-)) in a slab-gel blotting module (Invitrogen X-Cell II) filled with 1X tris-glycine with 0.5% Triton X-100. Probes were transferred from the delivery gel into the separation gel at an electric field of 8 V/cm for 13 minutes; the stack was then disassembled and the separation gels were incubated at room temperature on a glass slide within a hydration chamber for 2 hours for primary antibody binding, or 1 hour for secondary antibody binding.
After each probe incubation step (primary and secondary antibodies), projection electrophoresis gels were electrophoretically washed by sandwiching between two filter papers soaked in 1X tris-glycine with 0.5% Triton X-100 (held in place by custom laser-cut acrylic with a cutout for the gels, which suspended the gels within the chamber of a slab-gel blotting module. Separation gels were submerged in 1X tris-glycine with 0.5% Triton X-100 for ~1min for rehydration immediately before electrophoretic washing. The blotting module was also filled with 1X tris-glycine with 0.5% Triton X-100. Gels were electrophoretically washed for 15 minutes at an electric field of 12 V/cm.
Gels were confocal imaged through a #1.5 coverslip using a Zeiss LSM 880 laser-scanning confocal microscope fitted with a 20X water dipping objective (NA=1.0, Zeiss W Plan APO 20x/1 DICIII). A confocal Z-slice spacing of 5 μm was chosen, and volumes extending ~100 μm past visible fluorophore bands were imaged. As we were not quantifying or comparing protein abundance, excitation laser powers were adjusted to permit fluorescence visibility depending on the sample brightness, as fluorescence intensities were not compared between cell separations. Similarly, images were brightness and contrast-adjusted in Fiji66 (based on ImageJ67, National Institutes of Health) to ensure visibility of protein bands.
For full-gel imaging, gels were imaged using a Zeiss Lightsheet Z.1 system fitted with a 5X detection objective (Zeiss EC Plan-Neofluar 420330-8210) and 4X light sheet forming objectives (Zeiss LSFM 400900-9010). Samples were excited with 488 nm and 561 nm lasers and detected using two pco.edge sCMOS cameras (with filter sets for AlexaFluor® 488 and AlexaFluor® 555). The samples were mounted to #1.5 coverslips using superglue at the gel corners, and the coverslip was glued to a custom 3D printed adapter to suspend the gel within the imaging chamber. The gels were imaged facing the detection objective (not imaged through the mounting coverslip). Tiled Z-stack images with 5-6 μm Z-slice spacing were acquired over the full gel volume, with 10% overlap between acquisition fields of view to ensure complete gel coverage. 49-56 Z-stack fields of view were typically required to cover the full gel area, each with 200-300 Z-slices.
Confocal and light sheet microscopy datasets were analyzed using custom analysis scripts in MATLAB®, similar to those described above for purified protein datasets. Intensity profiles were background-subtracted by subtracting the average intensity of a 5-pixel (light sheet) or 20-pixel (confocal) border surrounding each X-Y ROI from each ROI pixel at each Z location prior to summing the intensities to generate Z-intensity profiles. Zeiss CZI confocal Z-stacks and associated metadata were imported into MATLAB® (MathWorks®) using the MATLAB® Bio-Formats libraries provided by the Open Microscopy Environment68. A schematic representing the analysis workflow for tiled light sheet images (a similar workflow was used for confocal images but without the tiled functionality) is presented in Figure S4 of the Supplementary Information.
certified by peer review) is the author/funder. All rights reserved. No reuse allowed without permission. The copyright holder for this preprint (which was notthis version posted October 16, 2019. . https://doi.org/10.1101/805770doi: bioRxiv preprint

Acknowledgements. This work was funded in part by the National Cancer Institute of the National Institutes of Health, Cancer Moonshot award, Grant Number: 1R33CA225296-01 to A.E.H, and by the Chan Zuckerberg Biohub. S.M.G. gratefully acknowledges the support of a postdoctoral fellowship from the Natural Sciences and Engineering Research Council of Canada (NSERC). We sincerely thank Dr. Burcu Gümüscü Sefünc for her assistance with early proof-of-concept tests. Confocal and light sheet imaging experiments were conducted at the CRL Molecular Imaging Center at UC Berkeley, supported by the Helen Wills Neuroscience Institute. We acknowledge all members of the Herr Lab at UC Berkeley, as well as Dr. Ben Smith at UC Berkeley and the group of Prof. Mark Pegram at Stanford University, for useful discussions and feedback. We are also grateful to the CRL Molecular Imaging Center staff as well as Kamran Ahmed and Eva Nichols for assistance with light sheet imaging setup.
References
1. Berg, J., JL, T. & L., S. Chapter 3: Protein Structure and Function. in Biochemistry
2. Vogel, C. et al. Sequence signatures and mRNA concentration can explain two-thirds of protein abundance variation in a human cell line. Mol. Syst. Biol. 6, 1–9 (2010).
3. Darmanis, S. et al. Simultaneous Multiplexed Measurement of RNA and Proteins in Single Cells. Cell Rep. 14, 380–389 (2016).
4. Liu, Y., Beyer, A. & Aebersold, R. On the Dependency of Cellular Protein Levels on mRNA Abundance. Cell 165, 535–550 (2016).
5. Gong, H. et al. Single-cell protein-mRNA correlation analysis enabled by multiplexed dual-analyte co-detection. Sci. Rep. 7, 1–8 (2017).
6. Smith, L. M., Kelleher, N. L. & Consortium for Top Down, P. Proteoform: a single term describing protein complexity. Nat Methods 10, 186–187 (2013).
7. Harper, S. J. & Bates, D. O. VEGF-A splicing: the key to anti-angiogenic therapeutics? Nat. Rev. Cancer 8, 880–887 (2008).
8. Arribas, J., Baselga, J., Pedersen, K. & Parra-Palau, J. L. p95HER2 and breast cancer. Cancer Res. 71, 1515–9 (2011).
9. Liu, Y., Chen, X., Zhang, Y. & Liu, J. Advancing single-cell proteomics and metabolomics with microfluidic technologies. Analyst 144, 846–858 (2019).
10. Lee, T. T. & Yeung, E. S. Quantitative determination of native proteins in individual human erythrocytes by capillary zone electrophoresis with laser-induced fluorescence detection. Anal. Chem. 64, 3045–3051 (1992).
11. Olefirowicz, T. M. & Ewing, A. G. Dopamine concentration in the cytoplasmic compartment of single neurons determined by capillary electrophoresis. J. Neurosci. Methods 34, 11–15 (1990).
12. Kennedy, R. T., Oates, M. D., Cooper, B. R., Nickerson, B. & Jorgenson, J. W. Microcolumn Separations and the Analysis of Single Cells on JSTOR. Science (80-. ). 246, 57–63 (1989).
13. Simpson, P. C. et al. High-throughput genetic analysis using microfabricated 96-sample capillary array electrophoresis microplates. Proc. Natl. Acad. Sci. 95, 2256–2261 (1998).
14. Rogers, B., Gibson, G. T. T. & Oleschuk, R. D. Bundled capillary electrophoresis using microstructured fibres. Electrophoresis 32, 223–229 (2011).
15. Budnik, B., Levy, E., Harmange, G. & Slavov, N. SCoPE-MS: mass spectrometry of single mammalian cells quantifies proteome heterogeneity during cell differentiation. Genome Biol. 19, 161 (2018).
16. Zhu, Y. et al. Proteomic Analysis of Single Mammalian Cells Enabled by Microfluidic Nanodroplet Sample Preparation and Ultrasensitive NanoLC-MS. Angew. Chem. Int. Ed. Engl. 1–6 (2018). doi:10.1002/anie.201802843
17. Do, T. D. et al. Optically Guided Single Cell Mass Spectrometry of Rat Dorsal Root Ganglia to Profile Lipids, Peptides and Proteins. ChemPhysChem 19, 1180–1191 (2018).
18. Spruessel, A. et al. Tissue ischemia time affects gene and protein expression patterns within minutes following surgical tumor excision. Biotechniques 36, 1030–1037 (2004).
19. Dickinson, A. J., Armistead, P. M. & Allbritton, N. L. Automated capillary electrophoresis system for fast single-cell analysis. Anal. Chem. 85, 4797–4804 (2013).
20. Hargis, A. D., Alarie, J. P. & Ramsey, J. M. Characterization of cell lysis events on a microfluidic device for high-throughput single cell analysis. Electrophoresis 32, 3172–9 (2011).
21. Wheeler, A. R. et al. Microfluidic Device for Single-Cell Analysis. Anal. Chem. 75, 3581–3586 (2003).
22. Jin, S. et al. Multiplexed Western Blotting Using Microchip Electrophoresis. Anal. Chem. 88, 6703–10 (2016).
23. Hughes, A. J. et al. Single-cell western blotting. Nat. Methods 11, 749–55 (2014).
24. Tillberg, P. W. Expansion Microscopy : Improving Imaging Through Uniform Tissue Expansion. (Massachusetts Institute of Technology, 2016).
25. Tomer, R., Ye, L., Hsueh, B. & Deisseroth, K. Advanced CLARITY for rapid and high-resolution imaging of intact tissues. (2014). doi:10.1038/nprot.2014.123
26. Towbin, H., Staehelin, T. & Gordon, J. Electrophoretic transfer of proteins from polyacrylamide gels to nitrocellulose sheets: procedure and some applications. Proc. Natl. Acad. Sci. 76, 4350–4354 (1979).
27. Burnette, W. N. ‘Western blotting’: Electrophoretic Transfer of Proteins from Sodium Dodecyl Sulfate-Polyacrylamide Gels to Unmodified
certified by peer review) is the author/funder. All rights reserved. No reuse allowed without permission. The copyright holder for this preprint (which was notthis version posted October 16, 2019. . https://doi.org/10.1101/805770doi: bioRxiv preprint

Nitrocellulose and Radiographic Detection with Antibody and Radioiodinated Protein A. Anal. Biochem. 112, 195–203 (1981).
28. Englert, C. R., Baibakov, G. V & Emmert-buck, M. R. Layered Expression Scanning : Rapid Molecular Profiling of Tumor Samples Advances in Brief Layered Expression Scanning : Rapid Molecular Profiling of Tumor Samples. 1526–1530 (2000).
29. Zhu, L., Tangrea, M. A., Mukherjee, S. & Emmert-Buck, M. R. Layered electrophoretic transfer - A method for pre-analytic processing of histological sections. Proteomics 11, 883–889 (2011).
30. Kang, C.-C. C. et al. Single cell-resolution western blotting. Nat Protoc 11, 1508–1530 (2016).
31. Hughes, A. J., Lin, R. K. C., Peehl, D. M. & Herr, A. E. Microfluidic integration for automated targeted proteomic assays. Proc. Natl. Acad. Sci. U. S. A. 109, 5972–7 (2012).
32. Ferguson, K. A. Starch-gel electrophoresis—Application to the classification of pituitary proteins and polypeptides. Metabolism. 13, 985–1002 (1964).
33. Squire, P. G., Moser, P. & O’Konski, C. T. The Hydrodynamic Properties of Bovine Serum Albumin Monomer and Dimer. Biochemistry 7, 4261–4272 (1968).
34. Peters, T. Serum ALbumin. Adv. Protein Chem. 37, 161–245 (1985).
35. Sah, H. Stabilization of proteins against methylene chloride / water interface- induced denaturation and aggregation. 58, 143–151 (1999).
36. Oliva, A. & Farin, B. Comparative study of protein molecular weights by size-exclusion chromatography and laser-light scattering. 25, 833–841 (2001).
37. Kyhse-Andersen, J. Electroblotting of multiple gels: a simple apparatus without buffer tank for rapid transfer of proteins from polycrylamide to nitrocellulose. J. Biochem. Biophys. Methods 10, 203–209 (1984).
38. Miller, C. C. The Stokes-Einstein Law for Diffusion in Solution. Prod. Roy. Soc. Lond. 106, 724–749 (1924).
39. Park, I. H., Johnson, C. S. & Gabriel, D. A. Probe Diffusion in Polyacrylamide Gels as Observed by Means of Holographic Relaxation Methods: Search for a Universal Equation. Macromolecules 23, 1548–1553 (1990).
40. Aichler, M. & Walch, A. MALDI Imaging mass spectrometry: current frontiers and perspectives in pathology research and practice. Lab Invest 95, 422–431 (2015).
41. Sarder, P. & Nehorai, A. Deconvolution methods for 3-D fluorescence microscopy images. IEEE Signal Process. Mag. 23, 32–45 (2006).
42. Sibarita, J. B. Deconvolution microscopy. Adv. Biochem. Eng. Biotechnol. 95, 201–243 (2005).
43. McNally, J. G., Karpova, T., Cooper, J. & Conchello, J. A. Three-Dimensional Imaging by Deconvolution Microscopy. Methods 19, 373–385 (1999).
44. Pattle, R. E. Diffusion From an Instantaneous Point Source With Concentration Dependent Coefficient. Quart. J. Mech. Appl. Math. 12, 407–409 (1959).
45. Monck, J. R., Oberhauser, A. F., Keating, T. J. & Fernandez, J. M. Thin-section ratiometric Ca2+ images obtained by optical sectioning of fura-2 loaded mast cells. J. Cell Biol. 116, 745–759 (1992).
46. Pawley, J. B. Biological Confocal Microscopy. (2006).
47. Duplâtre, G., Ferreira Marques, M. F. & Da Graça Miguel, M. Size of sodium dodecyl sulfate micelles in aqueous solutions as studied by positron annihilation lifetime spectroscopy. J. Phys. Chem. 100, 16608–16612 (1996).
48. Stetsenko, A. & Guskov, A. An overview of the top ten detergents used for membrane protein crystallization. Crystals 7, (2017).
49. Tong, J. & Anderson, J. L. Partitioning and diffusion of proteins and linear polymers in polyacrylamide gels. Biophys. J. 70, 1505–1513 (1996).
50. Rabilloud, T. Solubilization of proteins for electrophoretic analyses. Electrophoresis 17, 813–829 (1996).
51. Ngoka, L. C. M. Sample prep for proteomics of breast cancer: Proteomics and gene ontology reveal dramatic differences in protein solubilization preferences of radioimmunoprecipitation assay and urea lysis buffers. Proteome Sci. 6, 1–24 (2008).
52. Wiśniewski, J. R., Zougman, A., Nagaraj, N. & Mann, M. Universal sample preparation method for proteome analysis. Nat. Methods 6, 359–362 (2009).
53. Glatter, T., Ahrné, E. & Schmidt, A. Comparison of different sample preparation protocols reveals lysis buffer-specific extraction biases in gram-negative bacteria and human cells. J. Proteome Res. 14, 4472–4485 (2015).
54. Duncombe, T. A. et al. Hydrogel Pore-Size Modulation for Enhanced Single-Cell Western Blotting. Adv Mater 28, 327–334 (2016).
55. Yamauchi, K. A. & Herr, A. E. Subcellular western blotting of single cells. Microsystems Nanoeng. 3, 16079 (2017).
56. Sinkala, E. et al. Profiling protein expression in circulating tumour cells using microfluidic western blotting. Nat. Commun. 8, 14622 (2017).
57. Kang, C.-C. C., Lin, J.-M. G. M., Xu, Z., Kumar, S. & Herr, A. E. Single-cell Western blotting after whole-cell imaging to assess cancer chemotherapeutic response. Anal Chem 86, 10429–10436 (2014).
58. Kang, C.-C. et al. Electrophoretic cytopathology resolves ERBB2 forms with single-cell resolution. npj Precis. Oncol. 2, 10 (2018).
certified by peer review) is the author/funder. All rights reserved. No reuse allowed without permission. The copyright holder for this preprint (which was notthis version posted October 16, 2019. . https://doi.org/10.1101/805770doi: bioRxiv preprint
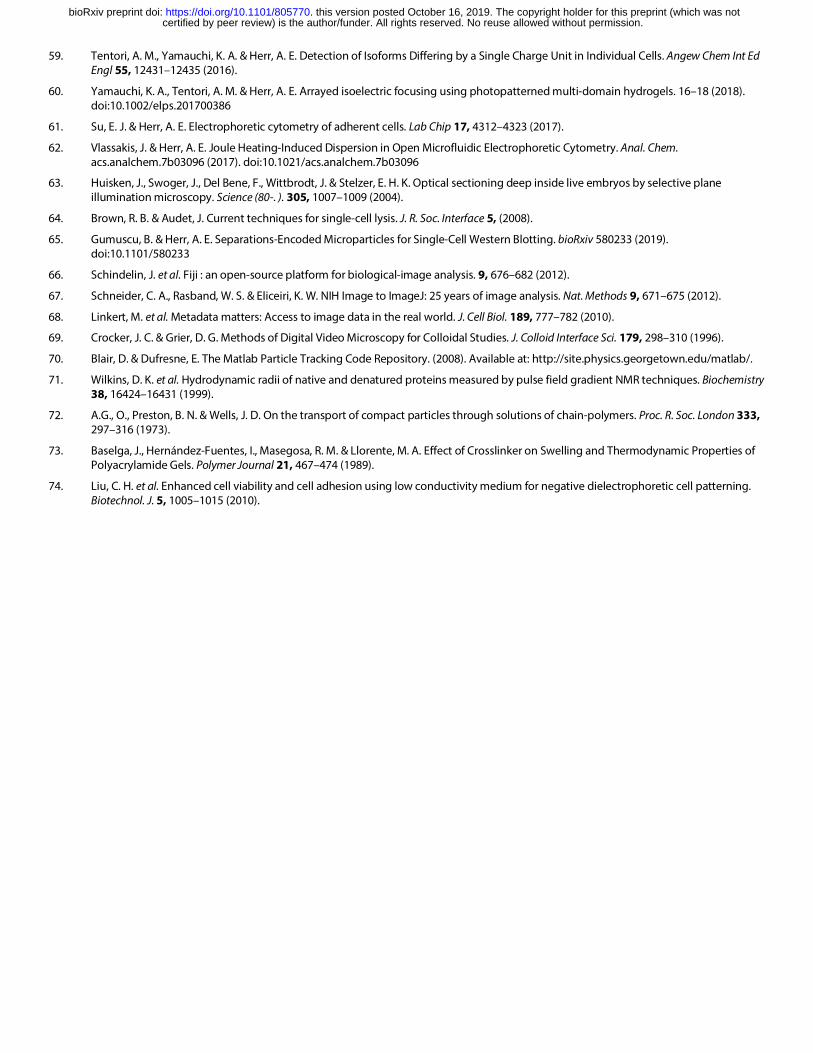
59. Tentori, A. M., Yamauchi, K. A. & Herr, A. E. Detection of Isoforms Differing by a Single Charge Unit in Individual Cells. Angew Chem Int Ed Engl 55, 12431–12435 (2016).
60. Yamauchi, K. A., Tentori, A. M. & Herr, A. E. Arrayed isoelectric focusing using photopatterned multi-domain hydrogels. 16–18 (2018). doi:10.1002/elps.201700386
61. Su, E. J. & Herr, A. E. Electrophoretic cytometry of adherent cells. Lab Chip 17, 4312–4323 (2017).
62. Vlassakis, J. & Herr, A. E. Joule Heating-Induced Dispersion in Open Microfluidic Electrophoretic Cytometry. Anal. Chem. acs.analchem.7b03096 (2017). doi:10.1021/acs.analchem.7b03096
63. Huisken, J., Swoger, J., Del Bene, F., Wittbrodt, J. & Stelzer, E. H. K. Optical sectioning deep inside live embryos by selective plane illumination microscopy. Science (80-. ). 305, 1007–1009 (2004).
64. Brown, R. B. & Audet, J. Current techniques for single-cell lysis. J. R. Soc. Interface 5, (2008).
65. Gumuscu, B. & Herr, A. E. Separations-Encoded Microparticles for Single-Cell Western Blotting. bioRxiv 580233 (2019). doi:10.1101/580233
66. Schindelin, J. et al. Fiji : an open-source platform for biological-image analysis. 9, 676–682 (2012).
67. Schneider, C. A., Rasband, W. S. & Eliceiri, K. W. NIH Image to ImageJ: 25 years of image analysis. Nat. Methods 9, 671–675 (2012).
68. Linkert, M. et al. Metadata matters: Access to image data in the real world. J. Cell Biol. 189, 777–782 (2010).
69. Crocker, J. C. & Grier, D. G. Methods of Digital Video Microscopy for Colloidal Studies. J. Colloid Interface Sci. 179, 298–310 (1996).
70. Blair, D. & Dufresne, E. The Matlab Particle Tracking Code Repository. (2008). Available at: http://site.physics.georgetown.edu/matlab/.
71. Wilkins, D. K. et al. Hydrodynamic radii of native and denatured proteins measured by pulse field gradient NMR techniques. Biochemistry 38, 16424–16431 (1999).
72. A.G., O., Preston, B. N. & Wells, J. D. On the transport of compact particles through solutions of chain-polymers. Proc. R. Soc. London 333, 297–316 (1973).
73. Baselga, J., Hernández-Fuentes, I., Masegosa, R. M. & Llorente, M. A. Effect of Crosslinker on Swelling and Thermodynamic Properties of Polyacrylamide Gels. Polymer Journal 21, 467–474 (1989).
74. Liu, C. H. et al. Enhanced cell viability and cell adhesion using low conductivity medium for negative dielectrophoretic cell patterning. Biotechnol. J. 5, 1005–1015 (2010).
certified by peer review) is the author/funder. All rights reserved. No reuse allowed without permission. The copyright holder for this preprint (which was notthis version posted October 16, 2019. . https://doi.org/10.1101/805770doi: bioRxiv preprint

Figures
Figure 1. Projection electrophoresis supports protein PAGE. (a) Schematic of serial cell analysis using capillary interrogation as compared to parallelized single-cell protein electrophoresis with projection electrophoresis device. (b) Confocal imaging of PAGE of fluorescently labeled protein ladder at 20 s elapsed separation time. Each ladder sample is injected from a 32 μm diameter microwell (x-y plane) with PAGE along the z-axis of the gel block. Summing x-y separation lane intensities (10%T PA separation gel) yields z-intensity profiles, with peak-to-peak displacement Dz and peak width σ. (c) 3D renderings and Z-intensity profiles are plotted for (i) 10s electrophoresis and (ii) 15s electrophoresis in 10%T polyacrylamide gels for comparison with the data for 20s electrophoresis shown in (a). (d) The electrophoretic mobility of the proteins depends log-linearly on protein molecular weight. Each plotted point represents an electrophoretic mobility calculated from linearly fitting migration distance vs. electrophoresis time data from 11-17 segmented separation lanes in n = 5 gels (5 electrophoresis times). (e) Electromigration distance depends linearly on electrophoresis time. Proteins migrate at constant velocity during PAGE. Migration distances are plotted from protein bands originating from 11-17 nearby microwells in two independent 7%T polyacrylamide gels containing 10% Rhinohide; 33 mA constant current; 52 V/cm initial, 2 gels for each migration time. Linear fitting yields OVA migration = 16.7t-63.42; BSA migration = 12.64t-39.3; IgG migration = 3.69t-11.54. (f) Separation resolution Rs for BSA and OVA peaks in 10%T PAGE gels. Each point depicts the mean and standard deviation of the Rs calculation from the median migration distances and peak widths from in n = 4 independent separation gels.
certified by peer review) is the author/funder. All rights reserved. No reuse allowed without permission. The copyright holder for this preprint (which was notthis version posted October 16, 2019. . https://doi.org/10.1101/805770doi: bioRxiv preprint

Figure 2. The physics of 3D diffusion dictate device design and inform image analyses. (a) Lane density (limited by minimum spacing between separation lanes Δwell) is dependent on separated protein x-y band width (σxy) to avoid well-well crosstalk. This peak width in turn depends on the 3D diffusion profile of the injected protein. (b) Throughput is a function of both lane density and usable gel area; separated protein bands parallel to the gel edges in a cross-sectional image of the gel show uniform migration across the gel. Scale bar represents 1 mm. (c) Theoretical maximum lane density at a spacing of 4σxy (~5% overlap between lanes) and 6σxy (~0.3% overlap between lanes. Maximum lane density is inversely proportional to σxy
2. (d) Measured diffusional x-y band broadening (Gaussian fit peak width σxy) from purified proteins initially partitioned into 32 μm wells, as a function of in-gel diffusion time. Left: σxy vs. diffusion time. Right: σxy
2 vs. diffusion time. After 10s electrophoresis, we measure σxy < 30 μm for all proteins, suggesting that 200 μm well spacing will be sufficient. Linear fitting yields OVA σxy
2
=32.5t-198 (R2=0.75); BSA σxy2 =14.3t+29.8 (R2=0.88); IgG σxy
2 =5.41t+153 (R2=0.42). (e) Confocal slice images of separated BSA in a 7%T gel, after varying electrophoresis times tEP (and thus in-gel diffusion times tdiff). For each example image, the original image, the image after physics-driven postprocessing (deconvolution of a point spread function modeling 3D diffusion), and summed intensity profiles for a 100 μm region surrounding each line of protein peaks in both the original and deconvolved images are shown. Deconvolution improves detected peak widths but can introduce artefacts of small protein peaks between wells as shown in the low diffusion time image (i). Each set of images is scaled to the maximum of the (brighter) deconvolved image for display purposes and displayed with an inverting LUT. (i) σxy = 16±2 μm; σDxy = 8.4±0.2 μm; error in band center Δμ=0.08±0.06 μm; error in peak AUC ΔAUC=23.9±1.4%. (ii) σxy = 25.7±0.6 μm; σDxy = 13.1±0.6 μm; Δμ=0.68±0.3 μm; ΔAUC=0.5±0.8%. (iii) σxy = 26.3±0.6 μm; σDxy = 13.3±0.5 μm; Δμ=0.1±0.2 μm; ΔAUC=3±2% (n = 9 ROIs for each case).
certified by peer review) is the author/funder. All rights reserved. No reuse allowed without permission. The copyright holder for this preprint (which was notthis version posted October 16, 2019. . https://doi.org/10.1101/805770doi: bioRxiv preprint

Figure 3. Design and verification of sample preparation for projection electrophoresis of single mammalian cells. (a) Cells are isolated in microwells within a size-sieving polyacrylamide separation gel. Settled cells are simultaneously lysed using gel delivery of bifunctional lysis/electrophoresis (EP) buffer (25s) and then single-cell lysates immediately injected and separated in the separation gel (10s). After EP separation, separated protein bands are photocaptured to the gel matrix (45s) and subsequently immunoprobed. (b) Lysis/EP buffer requires 8M urea for fast protein solubilization and electromigration. (c) Modelling and experimental quantification of diffusional dilution during lysis. Simulated and experimental top-view images of diffusional protein dilution during lysis, and side-view simulated results are shown, alongside quantification of the percent of protein remaining in the microwell region and the change in the spatial maximum protein concentration as a function of time after protein solubilization. Simulated initial TurboGFP concentration was 2 μM. (d) Illustration of top-view and side-view geometries shown in protein dilution studies. (e) Modelling the impact of diffusion during electrophoresis on detectable in-gel protein concentration. Side and top view TurboGFP concentration profiles are shown at different times during electrophoresis, alongside simulated maximum protein concentration vs. electrophoresis time, for 3 model proteins. Simulated initial TurboGFP concentration (before lysis and electrophoresis) was 2 μM. (f) Microwell packing density (impacting assay throughput) is dependent on protein band diffusion before photocapture. High-density endogenous protein bands (ii) correspond to single-cell settling in microwells (i). (iii) Maximum intensity projection 3D renderings and Z-intensity profiles of probed GAPDH bands from single cells. (iv) Protein diffusion profiles confirm that a microwell pitch of 200 μm is sufficient to resolve bands from neighboring microwells. After 10s EP, the mean peak width (σ) of the X-Y GAPDH spots is 32±13 μm. At a microwell pitch of 192 μm (3σ), <0.3% of the signal should bleed into the neighboring lane.
certified by peer review) is the author/funder. All rights reserved. No reuse allowed without permission. The copyright holder for this preprint (which was notthis version posted October 16, 2019. . https://doi.org/10.1101/805770doi: bioRxiv preprint
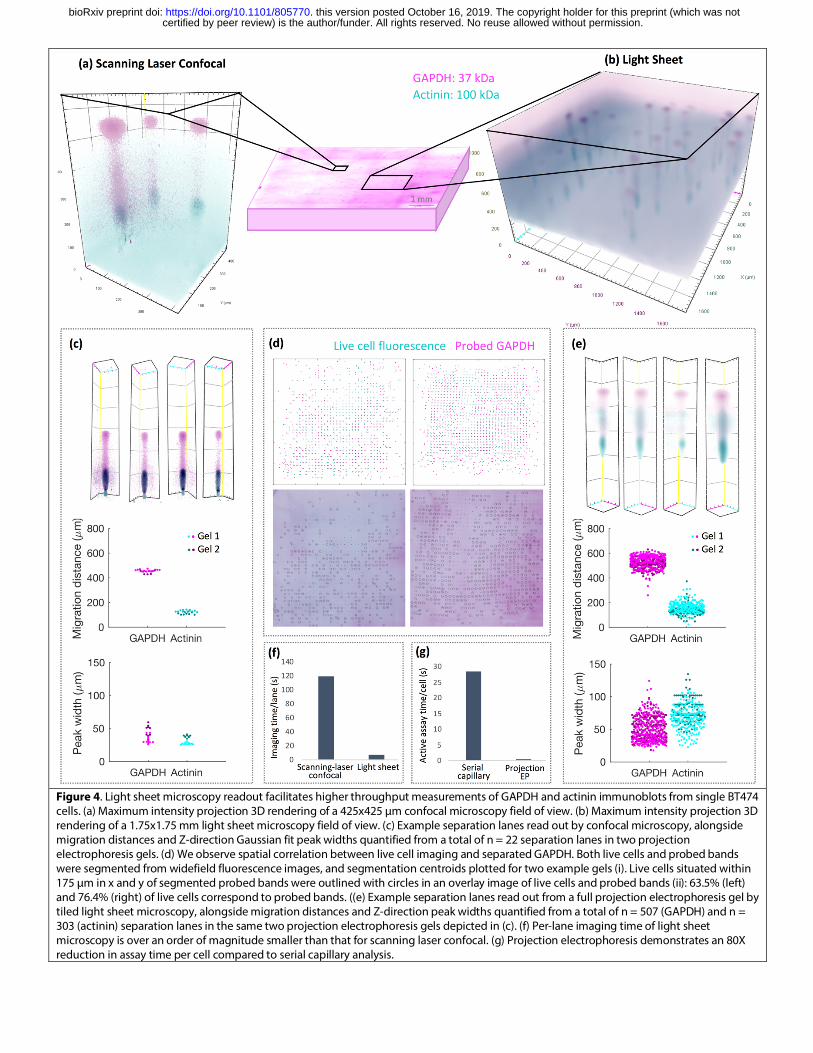
Figure 4. Light sheet microscopy readout facilitates higher throughput measurements of GAPDH and actinin immunoblots from single BT474 cells. (a) Maximum intensity projection 3D rendering of a 425x425 μm confocal microscopy field of view. (b) Maximum intensity projection 3D rendering of a 1.75x1.75 mm light sheet microscopy field of view. (c) Example separation lanes read out by confocal microscopy, alongside migration distances and Z-direction Gaussian fit peak widths quantified from a total of n = 22 separation lanes in two projection electrophoresis gels. (d) We observe spatial correlation between live cell imaging and separated GAPDH. Both live cells and probed bands were segmented from widefield fluorescence images, and segmentation centroids plotted for two example gels (i). Live cells situated within 175 μm in x and y of segmented probed bands were outlined with circles in an overlay image of live cells and probed bands (ii): 63.5% (left) and 76.4% (right) of live cells correspond to probed bands. ((e) Example separation lanes read out from a full projection electrophoresis gel by tiled light sheet microscopy, alongside migration distances and Z-direction peak widths quantified from a total of n = 507 (GAPDH) and n = 303 (actinin) separation lanes in the same two projection electrophoresis gels depicted in (c). (f) Per-lane imaging time of light sheet microscopy is over an order of magnitude smaller than that for scanning laser confocal. (g) Projection electrophoresis demonstrates an 80X reduction in assay time per cell compared to serial capillary analysis.
certified by peer review) is the author/funder. All rights reserved. No reuse allowed without permission. The copyright holder for this preprint (which was notthis version posted October 16, 2019. . https://doi.org/10.1101/805770doi: bioRxiv preprint