3D Online Display - EIVA - Maritime survey and ...download.eiva.dk/online-training/NaviModel3...
24
3D Online Display Catenary requirements Jesper Knudsen, Brian J.O. Justesen
Transcript of 3D Online Display - EIVA - Maritime survey and ...download.eiva.dk/online-training/NaviModel3...

3D Online Display Catenary requirements
Jesper Knudsen, Brian J.O. Justesen

3D Online Display - Catenary Page 2
File: I:\EIVA-PROJECTS\FILES FOR EIVA-TRAINING\NAVIMODEL3 MANUALS\3D ONLINE DISPLAY - CATENARY.DOC Page 2 of 24
Created by Jesper Knudsen / Brian J.O. Justesen Created on 30-05-2007
Contents 1 Basic requirements.............................................................................................................4
1.1 iSURVEY requirements.............................................................................................4 1.1.1 Interface .............................................................................................................4 1.1.2 Distribution to tug ..............................................................................................5 1.1.3 Correction of chain length .................................................................................6 1.1.4 Manual input ......................................................................................................6 1.1.5 Rig Display ........................................................................................................6 1.1.6 Calculations........................................................................................................6 1.1.7 Horizontal view..................................................................................................7 1.1.8 Vertical view......................................................................................................7 1.1.9 Cable lay view....................................................................................................7 1.1.10 Numeric data......................................................................................................7 1.1.11 Audio and visual alarms.....................................................................................8
1.2 Deep Ocean requirements ........................................................................................13 1.3 C&C requirements ...................................................................................................13
2 Accommodated requirements ..........................................................................................15 2.1 General setup ...........................................................................................................15 2.2 Catenary setup..........................................................................................................15
2.2.1 Physical line assembly .....................................................................................16 2.2.2 Physical cable properties..................................................................................16 2.2.3 Midline buoys properties .................................................................................16
2.3 Catenary calculations ...............................................................................................16 3 Design ..............................................................................................................................18
3.1 General setup ...........................................................................................................18 3.2 NaviPac ....................................................................................................................18
3.2.1 New Input Instruments.....................................................................................19 3.2.2 Navigation Data to Catenary............................................................................20
3.3 RigMon ....................................................................................................................20 3.4 Scene server .............................................................................................................21 3.5 Catenary Module......................................................................................................21
3.5.1 New Project......................................................................................................21 3.5.2 Calculate ..........................................................................................................22
3.6 3D display ................................................................................................................23 4 Workload..........................................................................................................................24

3D Online Display - Catenary Page 3
File: I:\EIVA-PROJECTS\FILES FOR EIVA-TRAINING\NAVIMODEL3 MANUALS\3D ONLINE DISPLAY - CATENARY.DOC Page 3 of 24
Created by Jesper Knudsen / Brian J.O. Justesen Created on 30-05-2007
Revision table Date Who Comment 30.05.2007 JUS First version (spawn of 3D Online Display.doc) 30.05.2007 OKR Added chapter Anchor Monitoring System by AS STEINCO 31.05.2007 JEK Added chapter Catenary setup 01.06.2007 JUS Added chapters ‘Accommodated requirements’ and ‘Design’;
revised chapter Catenary setup 05.06.2007 OKR Version 1 reviewed internally 07.06.2007 OKR No comments received from clients (C&C, iSurvey, Deep Ocean)
so version 1 is defined OK 07.06.2007 OKR Version 1.1 Section 3 expanded with design elements 08.06.2007 OKR Added definition of NaviPac and RigMon 15.06.2007 JEK Filled chapter 3D Display 15.06.2007 JUS Filled chapter Catenary module 19.06.2007 OKR Reviewed internally OK

3D Online Display - Catenary Page 4
File: I:\EIVA-PROJECTS\FILES FOR EIVA-TRAINING\NAVIMODEL3 MANUALS\3D ONLINE DISPLAY - CATENARY.DOC Page 4 of 24
Created by Jesper Knudsen / Brian J.O. Justesen Created on 30-05-2007
1 Basic requirements After having implemented and released the first version of EIVA’s new 3D online/real time monitoring application, we’re progressing to phase 2 – implementing the basic catenary. This document covers the requirements of setting up a catenary project, catenary computations, 2D profiling and 3D monitoring. However, only TMS and anchor handling (Rig and Barge move) is covered in this first version of catenary handling – later on we’ll include pipe- and flexible cable lay as well. It is important to note that the following parts will be based on the 3D platform implemented in phase 1. Also notice that the listed client requirements are used as inspiration for the suggested design, not a commitment to what will be implemented in the Catenary module.
1.1 iSURVEY requirements The following requirements from iSURVEY must be covered by the solution.
1.1.1 Interface A serial interface should be created for anchor monitoring system. The format should be:
<anchor id>, <length[metre]>, <tension[metric ton], <speed[metre/min]>CRLF
- also a user defined format should be considered.
Where:
<anchor id> - anchor number
<length[metre]> - chain length
<tension[metric ton]> - total tension in winch
<speed[metre/min]> - winch speed while running anchor
<workwire[metre]> - work wire out on Tug as a manual input on rig
Also an angular meter input for cable lay operations could be considered.
1.1.1.1 Anchor Monitoring System by AS STEINCO Protocol This is an ASCII protocol with a cyclic transmission of tension and length for the different anchors with a total amount of 67 characters in the telegram. This communication will send a telegram once each second and receving no telegrams from the EMP system. STX (02 hex) MSB Tension 1 (byte 2) Tension 1 (LSB) Tension 1 (MSB) Length 1 (byte 4) Length 1 (byte 3) Length 1

3D Online Display - Catenary Page 5
File: I:\EIVA-PROJECTS\FILES FOR EIVA-TRAINING\NAVIMODEL3 MANUALS\3D ONLINE DISPLAY - CATENARY.DOC Page 5 of 24
Created by Jesper Knudsen / Brian J.O. Justesen Created on 30-05-2007
(byte 2) Length 1 (LSB) Length 1 then anchor 2 to 7 MSB Tension 8 (byte 2) Tension 8 (LSB) Tension 8 (MSB) Length 8 (byte 4) Length 8 (byte 3) Length 8 (byte 2) Length 8 (LSB) Length 8 ETB (17 hex) Checksum STX: This is the character used to identify the start of the telegram. Tension: The anchor tension information is scaled in Tonne and sent with the most significant byte first. Length: The anchor length information is scaled in decimeters and sent with the most significant byte first ETB: This is the character used to identify the end of the telegram. Checksum: This is a left shifted XOR sum. The checksum is calculated for all the bytes in the telegram excluding the checksum. The calculation is performed in accordance with the procedure below: 1. Checksum = byte 1 2. Checksum = Checksum XOR Byte 2 3. Shift left Checksum 4. Checksum = Checksum XOR Byte 3 5. Shift left Checksum 6. .. and so on .. We recive this signal as: N-8-1 Baud 4800
1.1.2 Distribution to tug The data should be transmitted to Tugs trough telemetry in an intelligent way. Anchors that do not run (Speed = 0) should be transmitted on a lower user defined update rate (multiplier), or manually updated on tug by operator on rig (After a tug restart).

3D Online Display - Catenary Page 6
File: I:\EIVA-PROJECTS\FILES FOR EIVA-TRAINING\NAVIMODEL3 MANUALS\3D ONLINE DISPLAY - CATENARY.DOC Page 6 of 24
Created by Jesper Knudsen / Brian J.O. Justesen Created on 30-05-2007
The data should be received and visible in anchor handling display on Tug/Rig.
In addition the touchdown position calculated in part 2 should be distributed and displayed on Tug
1.1.3 Correction of chain length There should be an online option to correct each chain length with a positive or negative value if the anchor monitoring system is outputting erratic values.
1.1.4 Manual input There should be an online option to switch between <data input> or <manually input>. The reason for this is to be able to manually calculate touch down and/or anchor position etc. when anchor interface are not available.
1.1.5 Rig Display All the data should be visible in NaviPac either in Rigmon or a separate module.
(With possibility to show/hide values and change fonts. See 1.1.10)
1.1.6 Calculations Internationally accepted catenary algorithms should be used to compute the straight line profiles of each mooring line.
The reference will be the rig fairlead or a dynamic offset point. The end point should be a:
• Tug (with anchor on deck)
• Anchor on seabed
• Tug laying an anchor with specified work wire
• ROV/Transponder (Cable lay)
There should be an option for:
• At least 3 chain segments with different air/subsea weight should be included.
• At least 2 lift up boys with specified lift capacity and wire length should be included
• Global input of reference (fairlead) depth and winch height
• Global input to choose if calculations are based from fairlead or winch
• Global units for cable length, cable weight and tension
• Input of water depth from echo sounder, Transponder or Manual
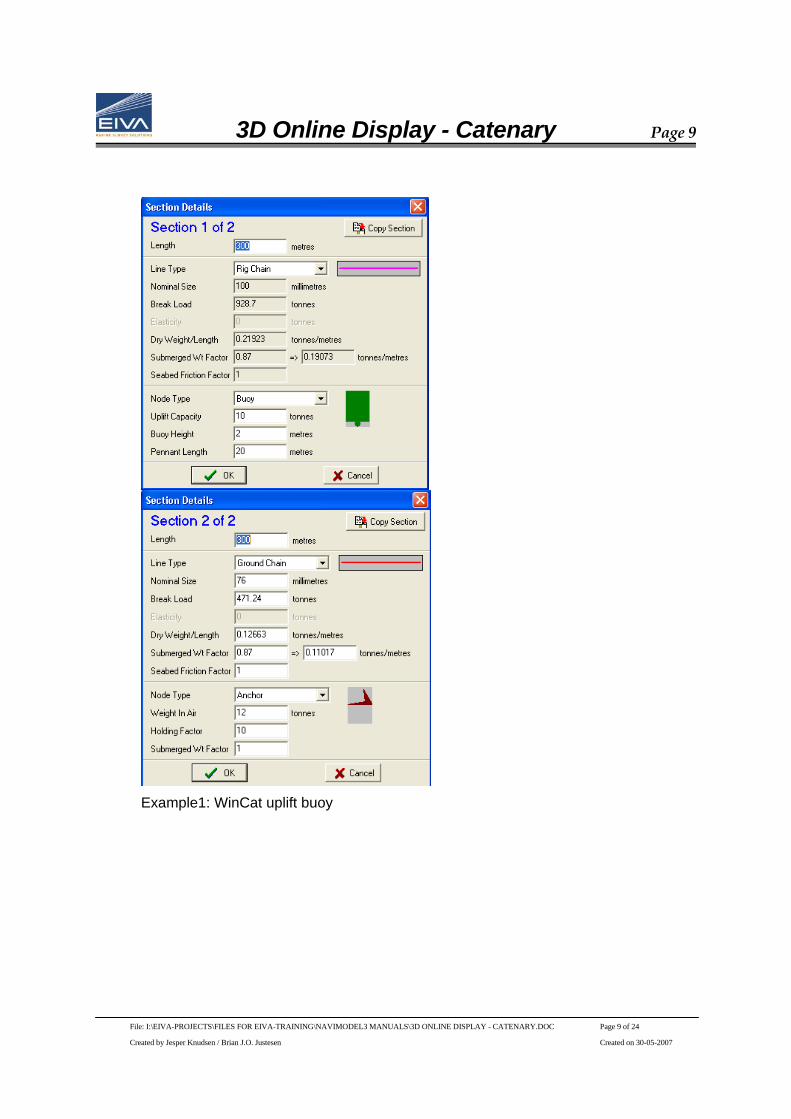
• One or more clearance points with horizontal distance from fairlead/anchor and vertical distance from surface/seabed (See example 1)
• Vertical clearance to clearance points should be calculated and displayed. (See example 1)

3D Online Display - Catenary Page 7
File: I:\EIVA-PROJECTS\FILES FOR EIVA-TRAINING\NAVIMODEL3 MANUALS\3D ONLINE DISPLAY - CATENARY.DOC Page 7 of 24
Created by Jesper Knudsen / Brian J.O. Justesen Created on 30-05-2007
• Allowing lines with priority calculating a solution on a higher update rate if this is an issue
• Save setup to jobfile
• Option to enable/disable “Send Touchdown position to HD”
1.1.7 Horizontal view Touchdown, buoy and calculated anchor positions should be presented as a dynamic object in Helmsman’s display. This to help the user to define if the object will be in correct position at all times.
1.1.8 Vertical view • Up to 12 simultaneous vertical displays with option to do manual measurements
• Possible to auto/manually adjust both axis
• Display of clearance points
1.1.9 Cable lay view The display should be designed for full screen view on a separate screen (See example 3).
1.1.10 Numeric data The numeric data should be calculated for each anchor. It should be possible to show/hide values/columns and change fonts. Conditional formatting of colour/background at alarm limit should be available.
- Status (Tracking, Laid or racked)
- Mode (Live data or planning/manual mode)
- Actual fairlead to proposed anchor (Hor dist)
- Propose fairlead to proposed anchor (Hor dist)
- Chain add-on at drop (Difference between the two above values if Rig is out of position)
- Actual Fairlead to actual anchor (Hor dist) (based on Tug position)
- Actual Fairlead to actual anchor (Hor dist) (based on manually entered chain/tension values)
- Chain counter check (Difference between the two above values)
- Total Catenary length (Seabed, Tug or laying)
- Distance to touchdown
- Grounded length
- Vertical distance to clearance point
- Winch offsets
- Fairlead intended positions E,N

3D Online Display - Catenary Page 8
File: I:\EIVA-PROJECTS\FILES FOR EIVA-TRAINING\NAVIMODEL3 MANUALS\3D ONLINE DISPLAY - CATENARY.DOC Page 8 of 24
Created by Jesper Knudsen / Brian J.O. Justesen Created on 30-05-2007
- Fairlead positions E,N
- Anchor intended positions E,N
- Anchor positions E,N
- Input Chain weight global or for each anchor
- Input Water depth global or for each anchor
- Input tension for each anchor
- Input chain lenght for each anchor
- Input Position or range bearing to clearance point
- Total tension calculated at ref (Based on depth, weight In water and catenary length)
- Angle at reference (Fairlead)
- Radius of catenary (Cable lay)
1.1.11 Audio and visual alarms Audio and visual alarms should be available if a distance reaches a user specified value.
3D Online Display - Catenary Page 9
File: I:\EIVA-PROJECTS\FILES FOR EIVA-TRAINING\NAVIMODEL3 MANUALS\3D ONLINE DISPLAY - CATENARY.DOC Page 9 of 24
Created by Jesper Knudsen / Brian J.O. Justesen Created on 30-05-2007
Example1: WinCat uplift buoy

3D Online Display - Catenary Page 10
File: I:\EIVA-PROJECTS\FILES FOR EIVA-TRAINING\NAVIMODEL3 MANUALS\3D ONLINE DISPLAY - CATENARY.DOC Page 10 of 24
Created by Jesper Knudsen / Brian J.O. Justesen Created on 30-05-2007

3D Online Display - Catenary Page 11
File: I:\EIVA-PROJECTS\FILES FOR EIVA-TRAINING\NAVIMODEL3 MANUALS\3D ONLINE DISPLAY - CATENARY.DOC Page 11 of 24
Created by Jesper Knudsen / Brian J.O. Justesen Created on 30-05-2007
Example2: WinCat Tug boat

3D Online Display - Catenary Page 12
File: I:\EIVA-PROJECTS\FILES FOR EIVA-TRAINING\NAVIMODEL3 MANUALS\3D ONLINE DISPLAY - CATENARY.DOC Page 12 of 24
Created by Jesper Knudsen / Brian J.O. Justesen Created on 30-05-2007

3D Online Display - Catenary Page 13
File: I:\EIVA-PROJECTS\FILES FOR EIVA-TRAINING\NAVIMODEL3 MANUALS\3D ONLINE DISPLAY - CATENARY.DOC Page 13 of 24
Created by Jesper Knudsen / Brian J.O. Justesen Created on 30-05-2007
Example3: iSURVEY Cable lay
1.2 Deep Ocean requirements Except the requirement of displaying seabed data collected real time all requirements are accommodated in phase 1.
1.3 C&C requirements The following requirements from C&C must be covered by the solution. Points directly supported in version 1 are highlighted.
1. Combination of the real time visualization & catenary module for the deployment and recovery of anchors for a semi-submersible in water depths to 4,000 meters.
a. I would like to see in real time a plan & profile view of the catenary in 3-D from the rig to the vessel or have the ability to zoom in and observe sea floor assets i.e. wells, manifolds, plets etc in relationship with the chain, wire rope and or combination of both. That is my client's main requirement for this software i.e. this is a risk prevention tool for his end user the Oil Company.
b. I would envision the catenary analogue data to be available and configurable on as need basis as an output on NaviPac Monitor
c. Sea floor asset drawings i.e. AutoCad from the client would be easily imported into NaviPac and displayed and scalable as required in 3-D
d. If bathy data were available, it would be imported and used within the visualization section of the software. In addition both swath data and single point data and data formats would be defined by EIVA a/s.
2. Surface and sub-surface visualization option to support intervention work utilizing an ROV
a. Support surface DGPS b. Support sub surface USBL, LBL, INS systems c. Represent sea floor assets i.e. wells, manifolds etc and be imported
drawings in the Auto Cad format and be scalable d. Import bathy data in the visualization portion of the program in both
single point and swath formats e. Represent object in the water column in 3-D
3. Perform the same functions as number #1 with a Pipe Lay Barge, not concerned with the pipe at the moment, but just with barge anchor placement around the sea floor assets in mind
4. Combination of the real time visualization & deployment of umbilical/cable & flexible pipe, similar to the requirements but replacing the anchor legs with flexible pipe or umbilical/cable.
5. Utilizing the visualization portion to observe pipe in the water column and above risk associated with sea floor from an S-lay or J-lay barge DP or Anchor, assuming ROV is acoustically positioned i.e. USBl or transponder is tied to the pipe i.e. USBL.

3D Online Display - Catenary Page 14
File: I:\EIVA-PROJECTS\FILES FOR EIVA-TRAINING\NAVIMODEL3 MANUALS\3D ONLINE DISPLAY - CATENARY.DOC Page 14 of 24
Created by Jesper Knudsen / Brian J.O. Justesen Created on 30-05-2007
6. Utilizing the visualization portion to observe pipe in the water column from an S-lay or J-lay DP or Anchor Barge, and finally on bottom to observe the pipe in relationship to the sea floor assets
7. The final request would be to utilize the visualization portion and analog to observe deployment of jackets, sub-sea assemblies, SUBMAR MATS utilizing survey sensors such as USBL, LBL input string into Navipac, Slew angle & Radius of vessels crane with vessel 's gyro reference. The idea being in deep water when a semi-rig deploys its sub-sea assembly, strong currents often effect the position of the assembly and move it to critical positions throughout the water column causing concern. In this case with the reference or the position of the semi-rig displayed and the riser string & sub-sea assembly displayed would provide a picture that a thousand words could not describe. In addition I believe this would be a wonderful for setting jackets with a RHO / THETA device such as a Fanbeam or THEODOLITE/EDM.

3D Online Display - Catenary Page 15
File: I:\EIVA-PROJECTS\FILES FOR EIVA-TRAINING\NAVIMODEL3 MANUALS\3D ONLINE DISPLAY - CATENARY.DOC Page 15 of 24
Created by Jesper Knudsen / Brian J.O. Justesen Created on 30-05-2007
2 Accommodated requirements The accommodated client requirements are listed in the following sections - but first an overall description of a general setup.
2.1 General setup The following outlines an example of a setup. The local network on the vessel connects NaviPac, a scene server and three 3D display clients.
NaviPac on the survey vessel and a number of 3D displays The terrain server is an application on the local network that provides services and information to 3D clients about a scene. A scene server on each LAN administrates the scene and distributes information to a number of clients through an ASCII protocol on the local network. Live information about the scene is sent from NaviPac to the scene server. The network protocol from NaviPac to the scene server is the existing HD protocol. The communications between scene server and 3D displays is clear ASCII. The connection between display and scene server will be automatic. The server is listening to the network for new 3D clients. Clients will broadcast a request on the local network for servers, and build a list of available servers (usually one).
2.2 Catenary setup A new catenary module will handle catenary projects. A catenary project can be defined, saved and reloaded. The project is basically a setup for one or more catenary lines (wires) –up to 16 (anchor) wires will be supported. Each catenary line is defined by a number of different cable types (sections) and fix points, e.g. start, end and MLB points.

3D Online Display - Catenary Page 16
File: I:\EIVA-PROJECTS\FILES FOR EIVA-TRAINING\NAVIMODEL3 MANUALS\3D ONLINE DISPLAY - CATENARY.DOC Page 16 of 24
Created by Jesper Knudsen / Brian J.O. Justesen Created on 30-05-2007
The setup of the instrument(s) interfaced by the catenary module will be handled by NaviPac (for the time being), but the binding to NaviPac will be as loosely as possible, making a total independence of NaviPac obtainable, at least theoretically.
2.2.1 Physical line assembly The physical setup of each line is defined by the user as a series of cables, with a winch and an anchor at each end, and possibly with a number of midline buoys in between. Example 1: Winch<->CableType<->Anchor Example 2: Winch<->CableTypeA<->CableTypeB<->Anchor Example 3: Winch<->CableTypeA<->MLB1<->CableTypeB<->MLB2<->CableTypeC<->Anchor
2.2.2 Physical cable properties Physical cable or chain parameters are defined (possibly in a cable library) by a number of physical properties defining cable behavior in air and in water.
1. Length 2. Weight of cable per meter in water 3. Weight of cable per meter in air 4. Diameter
2.2.3 Midline buoys properties Midline buoys represent a buoyancy object to hold cable above seafloor. The catenary calculation takes the following parameters into account:
1. Volume 2. Uplift/buoyancy
2.3 Catenary calculations The calculations may be run either manually, determined by the operator, or automatically triggered by exceeding some key settings or tolerances also defined by the operator, e.g. the anchor or barge has been moved or the tension has changed. To calculate the catenary curve the system needs:

3D Online Display - Catenary Page 17
File: I:\EIVA-PROJECTS\FILES FOR EIVA-TRAINING\NAVIMODEL3 MANUALS\3D ONLINE DISPLAY - CATENARY.DOC Page 17 of 24
Created by Jesper Knudsen / Brian J.O. Justesen Created on 30-05-2007
1. Physical line assembly (catenary project) 2. Position of winch (from NaviPac) 3. Water depth (from NaviPac or operator defined) 4. Slope of seafloor (operator defined) 5. Anchor patterns (status of anchors from RigMon) 6. One or both of:
a. Anchor position (from RigMon) b. Tension at winch and cable length (from interface or operator defined)
The system then outputs:
1. Graphical 2D curve with winch, MLBs and anchor (2D profiles for selected anchor) a. Curve A based on anchor position b. Curve B based on tension and cable length
2. Numerical data listed in view(s): a. Touch down point b. Vertical angle(s) at winch
i. Vertical angle A based on anchor position ii. Vertical angle B based on tension and cable length
c. Anchor position if tension is given d. Tension if anchor position is given e. Various distances
i. 2D length to TDP ii. 3D length to TDP
iii. 2D length to anchor iv. 3D length to anchor
f. Positions of MLBs (3D) 3. Wire line data to 3D online display
If both anchor position and tension is available then two vertical angle solutions will be calculated. In the first version there will be no “loopback” to NaviPac in terms of calculated wire lines, e.g. currently TMS settings will not be overridden.

3D Online Display - Catenary Page 18
File: I:\EIVA-PROJECTS\FILES FOR EIVA-TRAINING\NAVIMODEL3 MANUALS\3D ONLINE DISPLAY - CATENARY.DOC Page 18 of 24
Created by Jesper Knudsen / Brian J.O. Justesen Created on 30-05-2007
3 Design This section gives the system design as EIVA sees it based on the specification listed in the previous section.
3.1 General setup The goal is to keep the catenary stuff isolated in one component – it works together with NaviPac, TMS and 3D view – but it’s not linked hard to this environment.
NaviPac
3D Monitoring (.NET)
Catenary
Helmsman’s Display
3D Display
2D Objects,Anchor patterns
3D Objects
Vess
el, T
ugs,
RO
Vs
genSetup.db
Anch
or p
atte
rns
Kernel
Wire lines, MLBs
Wire
lines
, MLB
s
Instrument Setup
Anchor patterns
Win
ches
, MLB
s
Anchor patterns,MLBs
NaviModelRepository
RigMon
SceneServerWinches, MLBs
The data flow and the anticipated implications of existing modules will be described in the following chapters.
3.2 NaviPac There will be a few modifications required in NaviPac. This is mainly because we will aim for the most strict data flow when it comes to:
• Anchor monitor inputs • Position data to Catenary

3D Online Display - Catenary Page 19
File: I:\EIVA-PROJECTS\FILES FOR EIVA-TRAINING\NAVIMODEL3 MANUALS\3D ONLINE DISPLAY - CATENARY.DOC Page 19 of 24
Created by Jesper Knudsen / Brian J.O. Justesen Created on 30-05-2007
3.2.1 New Input Instruments NaviPac must be expanded with a series of new anchor monitoring interfaces:
• General iSurvey format (See section 1.1.1) • Steinco input (See section 1.1.1.1)
The generic interface will not be included in this version. The interfaces will occur in the special input section:

3D Online Display - Catenary Page 20
File: I:\EIVA-PROJECTS\FILES FOR EIVA-TRAINING\NAVIMODEL3 MANUALS\3D ONLINE DISPLAY - CATENARY.DOC Page 20 of 24
Created by Jesper Knudsen / Brian J.O. Justesen Created on 30-05-2007
The definition of the interface will hereafter be found in the NaviPac setup database (gensetup.db). NaviPac online will ignore the definition (DataIO skips opening the port, etc.) and leave all interfacing to the Catenary module itself.
3.2.2 Navigation Data to Catenary The catenary module needs information about all winch points (fairleads) and optional position of mid line buoys (the latter might come from RigMon instead). This might be solved via the existing output to 3D module (defined in phase 1)
But this involves a lot of setup. Instead we suggest that we add a new output:
• EIVA Catenary The output will be defined as UDP/IP on the port to the scene server (see details in phase 1 documentation) – so we re-use the output port. There is no user specification besides that. If the output is defined NaviPac will simply output position of all fairleads in one string per object. We suggest that the telegram is identical with the existing position output except that it identifies fairlead rather than ordinary object:
$EIVA3D,C,3,POS,O=<obj> E=<easting> N=<northing> Z=<height><cr><lf> The obj represents the NaviPac object numbering for fairleads – i.e. fairlead 1 is 850, etc.
3.3 RigMon RigMon must be expanded so it output’s the anchor patterns to the Catenary module (via Scene Server) as illustrated in the general setup diagram. RigMon will inherit the output defined in 3.2.2 – and if it exists then it will send the anchor pattern out on the same port as the output from NaviPac. This will be OK as we use UDP/IP ports! The anchor patterns must follow the same principles as existing output’s from RigMon (to TUG Boats and CMS)
• Each time an anchor changes status • Each time an anchor changes location • Each time MLB changes location • On user request (from RigMon menu) • With certain frequency (same as TMS output)

3D Online Display - Catenary Page 21
File: I:\EIVA-PROJECTS\FILES FOR EIVA-TRAINING\NAVIMODEL3 MANUALS\3D ONLINE DISPLAY - CATENARY.DOC Page 21 of 24
Created by Jesper Knudsen / Brian J.O. Justesen Created on 30-05-2007
There will be one telegram per anchor/MLB $EIVA3D,C,4,ANCHOR,A<id> E<easting> N<northing> S<State> T<obj><cr><lf>
• <id> identifies anchor number (1-16) • <state> identifies anchor status
0 Racked (unused) 1 Tracking (onboard a tug) 2 Laid
• <obj> if tracking – by which dynamic object $EIVA3D,C,8,MLB,B<id> E<easting> N<northing> L<2D length> <cr><lf> 2D Position of mlb. The identification numbers follows the NaviPac principles:
• 900, 901, 902 MLB on first anchor • 910, 911, 912 MLB on second anchor • etc
3.4 Scene server No modifications are expected.
3.5 Catenary Module The Catenary module will consist of 3 main views: a tree view listing hierarchical the whole project; a property view where static, dynamic and calculated data will be displayed; and lastly a tabbed graph view section where all 2D profiles are displayed in its own tab view.
3.5.1 New Project The user selects option New project and the tree and all attached views will be cleared. Then choose between 2 (3?) sessions (sub projects): Anchors (TMS), Pipe lay and Cable lay (Pipe and Cable lay might not differ?). This means that having different types of catenary cases, e.g. a TMS and a pipe lay scenario controlled by a Barge, is handled by the same instance of the module, i.e. not necessary to run more than one instance of the module. This is somewhat ambitious but nevertheless what we are aiming for in the end (however, enabled in the next phase, first we deal with the TMS case). The user will then be able to define new catenary line(s), e.g. a number of anchor lines or one pipe/cable line. Each catenary line is subdivided into smaller parts, e.g. a starting base (fairlead); one or more section(s) (line types) with joins (terminations); and finally an end point (anchor). Each catenary line may be edited, cloned, deleted, etc. In the picture below a theoretical scenario with 4 anchors is shown.

3D Online Display - Catenary Page 22
File: I:\EIVA-PROJECTS\FILES FOR EIVA-TRAINING\NAVIMODEL3 MANUALS\3D ONLINE DISPLAY - CATENARY.DOC Page 22 of 24
Created by Jesper Knudsen / Brian J.O. Justesen Created on 30-05-2007
The property view will follow and show the properties for the catenary line part being selected. In this prototype we only see some of the static data. A dynamic part will also be added, e.g. length of section, known tension, etc. As mentioned earlier all instrument setup will be handled in NaviPac. However, it might turn out to be a good idea to list entered instrument setup data in the catenary module as well. An adapting layer between the catenary module and NaviPac will be used to make the NaviPac dependency as small as possible. When a catenary project is defined the project may be persisted (saved). The format will be in XML (hence the extension .xml).
3.5.2 Calculate Calculation will be performed in the catenary module, and all calculations can be monitored iteratively in the graph window. It will be possible to calculate each session and maybe even each line. This is done manually in the start up phase but options to set up for automatically calculation will also be added. Each resulting 2D profile (see picture below) will be shown in its own tab view to the right (not shown in the above listed prototype). There will be as many tab views as defined catenary lines.

3D Online Display - Catenary Page 23
File: I:\EIVA-PROJECTS\FILES FOR EIVA-TRAINING\NAVIMODEL3 MANUALS\3D ONLINE DISPLAY - CATENARY.DOC Page 23 of 24
Created by Jesper Knudsen / Brian J.O. Justesen Created on 30-05-2007
Above we see an example of a 2D catenary profile. The full catenary line is shown with all its sections. The current (last calculated) tension is also shown, and we expect to add some more key data to the graph view as well. After a calculation the results will be distributed to the 3D Display and the 3D Display will then update and show the 3D profile accordingly. However, an option for doing calculations without distribution (offline) is expected.
3.6 3D display The 3D display should visualize everything the catenary module knows in terms of catenary positions, curves and tensions. We intend to build a general protocol for showing pipes, cables or chains that can be used by the catenary module to tell the 3D display what and where to draw. The catenary module will use the general text message protocol to control the display, and update rates are determined by the catenary module. All catenaries stay at give position until changed by the catenary module, although you will still be able to move around freely in the most recent snapshot of the catenaries. The catenary module will supply curves to the 3D display in parallel to other information being sent to the display. In the (with faked 3D catenaries) screenshot below catenaries and

3D Online Display - Catenary Page 24
File: I:\EIVA-PROJECTS\FILES FOR EIVA-TRAINING\NAVIMODEL3 MANUALS\3D ONLINE DISPLAY - CATENARY.DOC Page 24 of 24
Created by Jesper Knudsen / Brian J.O. Justesen Created on 30-05-2007
other dynamic NaviPac objects are positioned along side each other in the scene. The scene also holds an indexed terrain model.
3D catenaries along side other dynamic NaviPac objects The catenary object will pop up in the 3d display tree so that each 3d client can determine it’s own set of visualization parameters.
4 Workload Maintained in 3DPhase2.xls