
3D Monte Carlo bone marrow dosimetry for Lu-177-PSMA ...
14
ORIGINAL RESEARCH Open Access 3D Monte Carlo bone marrow dosimetry for Lu-177-PSMA therapy with guidance of non-invasive 3D localization of active bone marrow via Tc-99m-anti-granulocyte antibody SPECT/CT Astrid Gosewisch 1 , Harun Ilhan 1 , Sebastian Tattenberg 1 , Andrea Mairani 2 , Katia Parodi 3 , Julia Brosch 1 , Lena Kaiser 1 , Franz Josef Gildehaus 1 , Andrei Todica 1 , Sibylle Ziegler 1 , Peter Bartenstein 1 and Guido Böning 1* Abstract Background: The bone marrow (BM) is a main risk organ during Lu-177-PSMA ligand therapy of metastasized castration- resistant prostate cancer (mCRPC) patients. So far, BM dosimetry relies on S values, which are pre-computed for reference anatomies, simplified activity distributions, and a physiological BM distribution. However, mCRPC patients may show a considerable bone lesion load, which leads to a heterogeneous and patient-specific activity accumulation close to BM- bearing sites. Furthermore, the patient-specific BM distribution might be significantly altered in the presence of bone lesions. The aim was to perform BM absorbed dose calculations through Monte Carlo (MC) simulations and to investigate the potential value of image-based BM localization. This study is based on 11 Lu-177-PSMA-617 therapy cycles of 10 patients (10 first cycles), who obtained a pre-therapeutic Ga-68-PSMA-11 PET/CT; quantitative Lu-177 SPECT acquisitions of the abdomen 24 (+CT), 48, and 72 h p.i.; and a Lu-177 whole-body planar acquisition at 24 h post-therapy. Patient-specific 3D volumes of interest were segmented from the Ga- 68-PSMA-11 PET/CT, filled with activity information from the Lu-177 data, and imported into the FLUKA MC code together with the patient CT. MC simulations of the BM absorbed dose were performed assuming a physiological BM distribution according to the ICRP 110 reference male (MC1) or a displacement of active BM from the direct location of bone lesions (MC2). Results were compared with those from S values (SMIRD). BM absorbed doses were correlated with the decrease of lymphocytes, total white blood cells, hemoglobin level, and platelets. For two patients, an additional pre- therapeutic Tc-99m-anti-granulocyte antibody SPECT/CT was performed for BM localization. Results: Median BM absorbed doses were 130, 37, and 11 mGy/GBq for MC1, MC2, and SMIRD, respectively. Significant strong correlation with the decrease of platelet counts was found, with highest correlation for MC2 (MC1: r = - 0.63, p = 0.04; MC2: r = - 0.71, p = 0.01; SMIRD: r = - 0.62, p = 0.04). For both investigated patients, BM localization via Tc-99m- anti-granulocyte antibody SPECT/CT indicated a displacement of active BM from the direct location of lesions similar to model MC2 and led to a reduction in the BM absorbed dose of 40 and 41% compared to MC1. (Continued on next page) © The Author(s). 2019 Open Access This article is distributed under the terms of the Creative Commons Attribution 4.0 International License (http://creativecommons.org/licenses/by/4.0/), which permits unrestricted use, distribution, and reproduction in any medium, provided you give appropriate credit to the original author(s) and the source, provide a link to the Creative Commons license, and indicate if changes were made. * Correspondence: [email protected] 1 Department of Nuclear Medicine, University Hospital, LMU Munich, Marchioninistrasse 15, 81377 Munich, Germany Full list of author information is available at the end of the article Gosewisch et al. EJNMMI Research (2019) 9:76 https://doi.org/10.1186/s13550-019-0548-z
Transcript of 3D Monte Carlo bone marrow dosimetry for Lu-177-PSMA ...

Gosewisch et al. EJNMMI Research (2019) 9:76 https://doi.org/10.1186/s13550-019-0548-z
ORIGINAL RESEARCH Open Access
3D Monte Carlo bone marrow dosimetry
for Lu-177-PSMA therapy with guidance ofnon-invasive 3D localization of active bonemarrow via Tc-99m-anti-granulocyteantibody SPECT/CT Astrid Gosewisch1, Harun Ilhan1, Sebastian Tattenberg1, Andrea Mairani2, Katia Parodi3, Julia Brosch1, Lena Kaiser1,Franz Josef Gildehaus1, Andrei Todica1, Sibylle Ziegler1, Peter Bartenstein1 and Guido Böning1*Abstract
Background: The bone marrow (BM) is a main risk organ during Lu-177-PSMA ligand therapy of metastasized castration-resistant prostate cancer (mCRPC) patients. So far, BM dosimetry relies on S values, which are pre-computed for referenceanatomies, simplified activity distributions, and a physiological BM distribution. However, mCRPC patients may show aconsiderable bone lesion load, which leads to a heterogeneous and patient-specific activity accumulation close to BM-bearing sites. Furthermore, the patient-specific BM distribution might be significantly altered in the presence of bonelesions. The aim was to perform BM absorbed dose calculations through Monte Carlo (MC) simulations and to investigatethe potential value of image-based BM localization.This study is based on 11 Lu-177-PSMA-617 therapy cycles of 10 patients (10 first cycles), who obtained a pre-therapeuticGa-68-PSMA-11 PET/CT; quantitative Lu-177 SPECT acquisitions of the abdomen 24 (+CT), 48, and 72 h p.i.; and a Lu-177whole-body planar acquisition at 24 h post-therapy. Patient-specific 3D volumes of interest were segmented from the Ga-68-PSMA-11 PET/CT, filled with activity information from the Lu-177 data, and imported into the FLUKA MC codetogether with the patient CT. MC simulations of the BM absorbed dose were performed assuming a physiological BMdistribution according to the ICRP 110 reference male (MC1) or a displacement of active BM from the direct location ofbone lesions (MC2). Results were compared with those from S values (SMIRD). BM absorbed doses were correlated withthe decrease of lymphocytes, total white blood cells, hemoglobin level, and platelets. For two patients, an additional pre-therapeutic Tc-99m-anti-granulocyte antibody SPECT/CT was performed for BM localization.
Results: Median BM absorbed doses were 130, 37, and 11mGy/GBq for MC1, MC2, and SMIRD, respectively. Significantstrong correlation with the decrease of platelet counts was found, with highest correlation for MC2 (MC1: r = − 0.63,p = 0.04; MC2: r = − 0.71, p = 0.01; SMIRD: r = − 0.62, p = 0.04). For both investigated patients, BM localization via Tc-99m-anti-granulocyte antibody SPECT/CT indicated a displacement of active BM from the direct location of lesions similar tomodel MC2 and led to a reduction in the BM absorbed dose of 40 and 41% compared to MC1.
(Continued on next page)
© The Author(s). 2019 Open Access This article is distributed under the terms of the Creative Commons Attribution 4.0International License (http://creativecommons.org/licenses/by/4.0/), which permits unrestricted use, distribution, andreproduction in any medium, provided you give appropriate credit to the original author(s) and the source, provide a link tothe Creative Commons license, and indicate if changes were made.
* Correspondence: [email protected] of Nuclear Medicine, University Hospital, LMU Munich,Marchioninistrasse 15, 81377 Munich, GermanyFull list of author information is available at the end of the article

Gosewisch et al. EJNMMI Research (2019) 9:76 Page 2 of 14
(Continued from previous page)
Conclusion: Higher BM absorbed doses were observed for MC-based models; however, for MC2, all absorbed doseswere still below 2 Gy. MC1 resulted in critical values for some patients, but is suspected to yield strongly exaggeratedabsorbed doses by neglecting bone marrow displacement. Image-based BM localization might be beneficial, andfuture studies are recommended to support an improvement for the prediction of hematoxicities.
Keywords: Radioligand therapy, Dosimetry, Monte Carlo, Bone marrow, mCRPC, Lutetium, PSMA, Tc-99m-anti-granulocyte antibody scintigraphy, Bone marrow localization
IntroductionIn radioligand therapy, dosimetry is recommended forappropriate treatment planning and aims for maximizingthe absorbed dose to malignant structures, while minim-izing the absorbed dose to risk organs. A variety of strat-egies for the assessment of tissue absorbed doses exist,which can be distinguished depending on how detailedthe patient-specific information is considered or depend-ing on whether a 3D-absorbed dose model is used orabsorbed dose factors (S values) are applied [1–5].Monte Carlo techniques can be used to fully simulate allinteractions of radioactive decay particles within the sur-rounding material in a step-by-step manner. VariousMonte Carlo codes such as FLUKA or GEANT4 wereextended to applications in nuclear medicine and arecapable to consider the patient-specific 3D activity andanatomical characteristics via inclusion of the SPECT,PET, and CT data into the simulation [6–12]. Thus, 3D-absorbed dose distributions with resolution and accuracydepending on the input image data can be provided.However, the absorbed dose to risk organs or tumorsduring radioligand therapy is usually calculated viaorgan-level S values, which were pre-calculated based onstandardized anthropomorphic phantoms and whichestimate the mean absorbed dose to the whole targetregion based on the mean time-integrated activity in aspecified source region.The active bone marrow (BM) is a main organ at risk
during Lu-177-PSMA ligand therapy, especially aspatients with advanced mCRPC often present with a highbone tumor burden and a potentially reducedhematological function [13–15]. Typically, bone marrowdosimetry is performed by applying the aforementioned Svalues and accounts for the self-absorbed dose to the bonemarrow from the blood, the cross-absorbed dose from theremainder of the body (ROB), and the cross-absorbeddose from major organs and tumors as specific source re-gions [15–19]. However, during bone marrow dosimetryusing organ-level S values, simplifying assumptions haveto be made to estimate the absorbed dose from the overalltumor distribution, as no pre-calculated S values exist thatconsider all lesions in their size, shape, number, andlocation. Thus, Monte Carlo simulations may lead to
improved bone marrow absorbed dose estimates, as theyhave the potential to fully account for the patient-specific3D disease characteristics.Another limitation of classical bone marrow dosimetry
is that the actual localization of the active bone marrowis a priori unknown. Bone lesions might lead to a dis-placement of active bone marrow from the direct site ofmetastases and thus activity accumulation, which woulddrastically reduce the absorbed dose to the active bonemarrow [20, 21]. However, bone marrow dosimetryusing pre-calculated organ-level S values assumes aphysiological bone marrow distribution [16]. Clinical im-aging methods, such as magnetic resonance imaging orTc-99m-anti-granulocyte antibody scintigraphy, can beused for non-invasive active bone marrow localization,within the spatial resolution of the correspondingimaging modality [22–25]. Thus, such techniques mightovercome the limitation of an a priori unknown targetregion for bone marrow dosimetry.In this study, we performed 3D simulations of the
bone marrow absorbed dose for mCRPC patients, as-suming either an active bone marrow distribution, whichis not altered by the bone tumor load, or a displacementof active bone marrow from the location of bone metas-tasis. These results were compared to the respectivebone marrow absorbed dose estimates derived viaorgan-level S values. Subsequently, all absorbed dose es-timates were further correlated with the patient-specificchanges in hematological parameters. For a subgroup ofinvestigated patients, a Tc-99m-anti-granulocycte anti-body SPECT/CT was acquired prior to therapy, whichwas further analyzed to investigate Monte-Carlo-basedbone marrow dosimetry with and without knowledge ofthe patient-specific active bone marrow distribution.If not indicated otherwise, the term bone marrow
always refers to the active bone marrow, which repre-sents the radio-sensitive part of the overall bone marrowmixture.
Material and methodsPatients and data acquisitionThis study is based on the first cycle of 10 patients, whoshowed PSMA avid soft tissue and bone lesions on the
Gosewisch et al. EJNMMI Research (2019) 9:76 Page 3 of 14
pre-therapeutic whole-body Ga-68-PSMA-11 PET/CT.Patients P1–P4 were treated with on average 3.7 GBqLu-177-PSMA-617, while for all other patients, the dos-ing scheme was increased to 6 GBq, according to initialdosimetry results at our institution [15, 26] (Table 1).Patient P7 received a fifth therapy cycle at our institu-tion with prior image-based active bone marrowlocalization and was included as patient P8 (Table 1), asthis rare data allows for an exemplarily comparison ofpatient-specific bone marrow dosimetry without andwith knowledge of the patient-specific bone marrowdistribution. All patients received a 15-min abdominalLu-177 SPECT/CT scan and a 20-min whole-body pla-nar scintigraphy at 24 h p.i., as well as a 15-min abdom-inal SPECT at 48 h and 72 h p.i. on a dual-headedSymbia T2 SPECT/CT (Siemens Medical Solutions,Erlangen, Germany). The SPECT and planar whole-bodyacquisitions were based on a standard Lu-177 imagingprotocol, using a medium-energy low-penetration colli-mator, the photopeak at 208 keV (width 15%), and twoadditional scatter windows at 170 keV (width 15%) and240 keV (width 10%) [15, 26, 27]. For dosimetry pur-poses, five venous blood samples were drawn from each
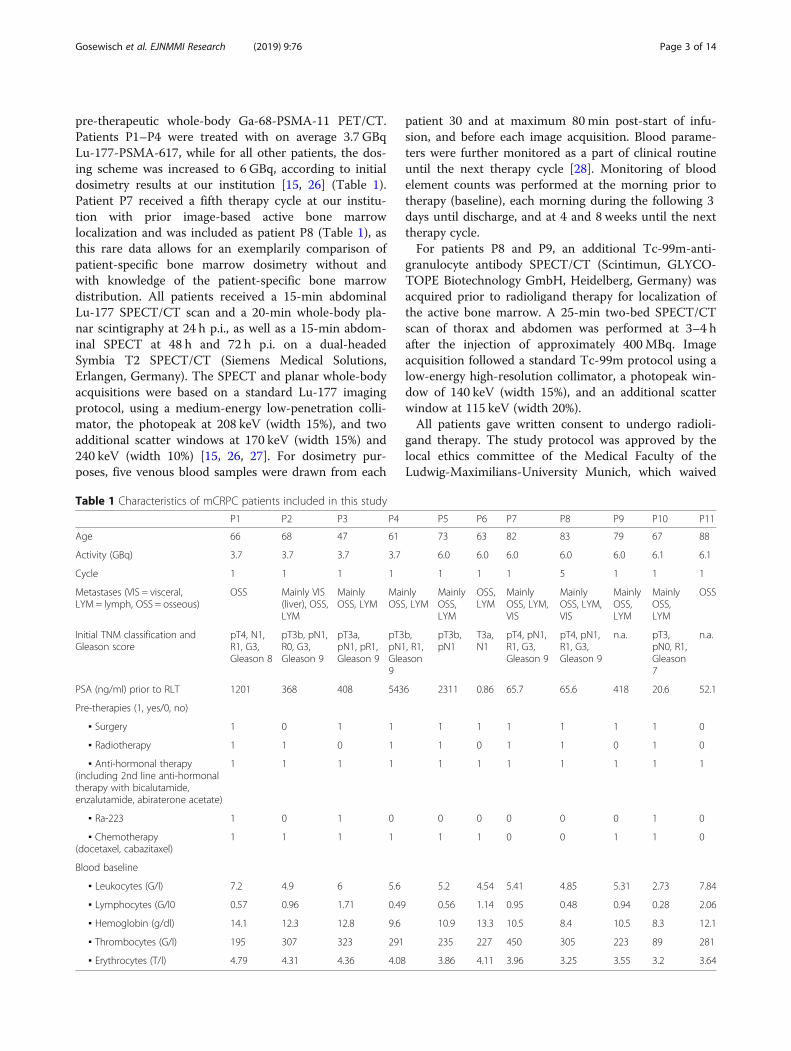
Table 1 Characteristics of mCRPC patients included in this study
P1 P2 P3 P4
Age 66 68 47 61
Activity (GBq) 3.7 3.7 3.7 3.7
Cycle 1 1 1 1
Metastases (VIS = visceral,LYM = lymph, OSS = osseous)
OSS Mainly VIS(liver), OSS,LYM
MainlyOSS, LYM
MaiOSS
Initial TNM classification andGleason score
pT4, N1,R1, G3,Gleason 8
pT3b, pN1,R0, G3,Gleason 9
pT3a,pN1, pR1,Gleason 9
pT3pN1Gle9
PSA (ng/ml) prior to RLT 1201 368 408 543
Pre-therapies (1, yes/0, no)
▪ Surgery 1 0 1 1
▪ Radiotherapy 1 1 0 1
▪ Anti-hormonal therapy(including 2nd line anti-hormonaltherapy with bicalutamide,enzalutamide, abiraterone acetate)
1 1 1 1
▪ Ra-223 1 0 1 0
▪ Chemotherapy(docetaxel, cabazitaxel)
1 1 1 1
Blood baseline
▪ Leukocytes (G/l) 7.2 4.9 6 5.6
▪ Lymphocytes (G/l0 0.57 0.96 1.71 0.49
▪ Hemoglobin (g/dl) 14.1 12.3 12.8 9.6
▪ Thrombocytes (G/l) 195 307 323 291
▪ Erythrocytes (T/l) 4.79 4.31 4.36 4.08
patient 30 and at maximum 80min post-start of infu-sion, and before each image acquisition. Blood parame-ters were further monitored as a part of clinical routineuntil the next therapy cycle [28]. Monitoring of bloodelement counts was performed at the morning prior totherapy (baseline), each morning during the following 3days until discharge, and at 4 and 8 weeks until the nexttherapy cycle.For patients P8 and P9, an additional Tc-99m-anti-
granulocyte antibody SPECT/CT (Scintimun, GLYCO-TOPE Biotechnology GmbH, Heidelberg, Germany) wasacquired prior to radioligand therapy for localization ofthe active bone marrow. A 25-min two-bed SPECT/CTscan of thorax and abdomen was performed at 3–4 hafter the injection of approximately 400MBq. Imageacquisition followed a standard Tc-99m protocol using alow-energy high-resolution collimator, a photopeak win-dow of 140 keV (width 15%), and an additional scatterwindow at 115 keV (width 20%).All patients gave written consent to undergo radioli-
gand therapy. The study protocol was approved by thelocal ethics committee of the Medical Faculty of theLudwig-Maximilians-University Munich, which waived
P5 P6 P7 P8 P9 P10 P11
73 63 82 83 79 67 88
6.0 6.0 6.0 6.0 6.0 6.1 6.1
1 1 1 5 1 1 1
nly, LYM
MainlyOSS,LYM
OSS,LYM
MainlyOSS, LYM,VIS
MainlyOSS, LYM,VIS
MainlyOSS,LYM
MainlyOSS,LYM
OSS
b,, R1,ason
pT3b,pN1
T3a,N1
pT4, pN1,R1, G3,Gleason 9
pT4, pN1,R1, G3,Gleason 9
n.a. pT3,pN0, R1,Gleason7
n.a.
6 2311 0.86 65.7 65.6 418 20.6 52.1
1 1 1 1 1 1 0
1 0 1 1 0 1 0
1 1 1 1 1 1 1
0 0 0 0 0 1 0
1 1 0 0 1 1 0
5.2 4.54 5.41 4.85 5.31 2.73 7.84
0.56 1.14 0.95 0.48 0.94 0.28 2.06
10.9 13.3 10.5 8.4 10.5 8.3 12.1
235 227 450 305 223 89 281
3.86 4.11 3.96 3.25 3.55 3.2 3.64
Gosewisch et al. EJNMMI Research (2019) 9:76 Page 4 of 14
the necessity for written consent for study entry, as thestudy is based on retrospective and irreversibly anon-ymized patient data.
Image reconstruction and quantificationQuantitative SPECT reconstruction was performed withan in-house maximum-a-posteriori reconstruction algo-rithm, which considers the correction for photon attenu-ation based on the co-registered low dose attenuationcorrection CT (AC-CT) (PMOD Version 3.609 rigid-body co-registration), correction for photon scatteringbased on the triple-energy-window (TEW) or dual-energy-window (DEW) method, and compensation ofdistance-dependent detector resolution using a Gaussiandetector response model. Final quantification was real-ized by applying a system-specific calibration factor,which was determined from an identically imaged andreconstructed cylinder phantom of homogeneous andknown activity concentration [15, 27, 29].Quantitative reconstruction of Ga-68-PSMA-11 PET/
CT scans was conducted as part of clinical routine usingthe TrueX algorithm with 3 iterations, 21 subsets, and a3D post-reconstruction Gaussian filter with a full-widthhalf maximum of 2 mm. The voxel volume in the PETdata was 4.1 × 4.1 × 5.0 mm3.All Lu-177 planar whole-body images were corrected
for photon attenuation and scattering pixel by pixel viaan in-house MATLAB routine. Correction of photon at-tenuation was achieved via a patient-specific μ-map,which was generated from the whole-body CT of thepre-therapeutic Ga-68-PSMA-11 PET/CT acquisition,while the correction of photon scattering employed theTEW method. A patient-specific calibration factor wasdetermined utilizing a cross-calibration with the corre-sponding quantitative SPECT at 24 h post-injection [28].
Reference bone marrow dosimetry using mass-scaledorgan-level S valuesBone marrow dosimetry utilizing phantom-based organ-level S values was selected as reference method in this work.It considered the blood, both kidneys, and the remainder ofbody (ROB) as specific source regions [15–19, 28]. The re-spective S values of the RADAR standardized male an-thropomorphic phantom were used [30]. All S values werescaled to the patient-specific anatomical conditions. Thetime-integrated activities for the blood and both kidneyswere determined based on a bi-exponential and a mono-exponential fit to the available time-activity measurements,respectively. For determination of the blood-to-bone mar-row absorbed dose, we employed a hematocrit-based redmarrow-to-blood activity concentration ratio (RMBLR), aswe assume no specific binding to bone marrow or bloodcells [16, 28, 31]. This assumption results in a reduced
RMBLR compared to a RMBLR of one, which is typicallyemployed for Lu-177 PRRT.The derivation of the time-integrated activity of the
ROB from a single planar whole-body scan was achievedby applying a suitable hybrid SPECT-planar model,which has been investigated in a previous study [28].Briefly, a mono-exponential curve was fitted to the totalSPECT activity over time, and this curve was scaled withthe whole-body activity at 24 h p.i. afterwards toestimate the patient-specific whole-body time-activitycurve. After integration over time, kidney and bloodtime-integrated activities were subtracted to obtain thenumber of decays within the ROB compartment [16]. Asthe patient-specific lesion distribution was highlyvariable for the patients investigated in this study, nopre-calculated S values were available, which consider alllesions in their size, shape, number, and location. Thus,the consideration of the metastases and their non-negligible activity uptake within the S value method wasachieved by including the total lesion activity within theROB compartment.In a previous study, the contribution from the ROB in-
cluding the lesion activities was found to be the domin-ating component of the total bone marrow absorbeddose [28]. However, the patient-specific lesion distribu-tion is assumed to be only inadequately considered viaclassical S value dosimetry. To investigate differences be-tween Monte-Carlo-based and classical S value bonemarrow dosimetry, all bone marrow absorbed doseswere correlated to the total bone lesion load, the time-integrated tumor uptake, and the time-integrated ROBretention (MATLAB Pearson’s correlation). The totalbone lesion load was obtained from the pre-therapeuticGa-68-PSMA-11 PET via PMOD kmeans segmentation(PMOD Version 3.609), while time-integrated tumor up-take and ROB retention were derived by integrating boththe mono-exponential ROB and lesion time-activitycurves. To obtain a total-body lesion time-activity curvefrom the sequential abdominal SPECT, the assumptionthat the kinetics of all abdominal lesions is equivalent tothat of all lesions throughout the patient body was made.The total-body lesion time-activity curve was then derivedfrom all segmented tumors within the abdominalsequential SPECT (kmeans segmentation, PMODVersion 3.609), scaled with the ratio of total-to-abdominallesion load.
Monte Carlo simulation of bone marrow absorbed doseFor each patient, the absorbed dose to the bone marrowwas simulated using the FLUKA MC code, which has beenextended and validated for applications in nuclear medi-cine, and which is capable to include the patient-specific3D anatomical and activity imaging data [6, 11, 12, 32].
Gosewisch et al. EJNMMI Research (2019) 9:76 Page 5 of 14
Anatomical and activity simulation dataThe pre-therapeutic diagnostic CT from the Ga-68-PSMA-11 PET/CT scan served as patient-specificwhole-body anatomical map during the Monte Carlosimulations. Therefore, the CT was converted to avoxel-wise map of density and anatomical compositionas described by Botta et al. and as required by the MCcode [6]. The patient-specific and time-dependent 3Dwhole-body Lu-177 activity distribution was describedby combining the information contained in the sequen-tial Lu-177 SPECT, the Lu-177 whole-body planar scin-tigraphy, and the whole-body PET/CT data. First, apatient-specific 3D whole-body volume of interest (VOI)map was generated by segmenting the kidneys, the tu-mors, and the ROB in the PET/CT volume. Using thesequential Lu-177 SPECT and the single Lu-177 whole-body planar scintigraphy, the activity in these compart-ments was assessed for each time point 24, 48, and 72 hpost-injection. Therefore, kidney VOIs and the overalltumor load were semi-automatically segmented (kmeanssegmentation, PMOD Version 3.609) from both thequantitative SPECT scan 24 h p.i. and the Ga-68-PSMA-11 PET. The segmented kidney VOIs were confirmed byvisual comparison with the AC-CT and the diagnosticCT, respectively. Both, the 24-h-based SPECT kidneyand tumor VOIs were then manually registered to thefollowing imaging days 48 h and 72 h post-administration. The time-integrated activity per voxelwas determined for both compartments, to directly as-sign a total number of decays per voxel to each VOI ofthe patient-specific activity template. Thereby, the ab-dominal lesion time-integrated activity was multipliedwith the ratio of total-to-abdominal lesion volume to es-timate the total lesion time-integrated activity from thesequential abdominal SPECT, as already described. TheROB time-integrated activity was defined via the men-tioned hybrid SPECT-planar model [28], while the ROBVOI itself was derived from a VOI outlining the wholeCT volume from the PET/CT data.
Absorbed dose to the bone marrowFor most of the skeletal sites, the bone marrow shows aheterogeneous microstructure composed of small mar-row cavities containing a composition of active bonemarrow (BM) and inactive bone marrow (iaBM), withthese cavities being separated by the spongiosa, i.e.,small ridges of hard bone (HB). This highly heteroge-neous microstructure is not visible on routine clinicalimaging modalities. Thus, for simulation and estimationof the bone marrow absorbed dose, we implemented aweighting factor-based model into the FLUKA code,similar to the two-factor mass-energy absorption coeffi-cient method described by Lee et al. [33]. It estimatesthe absorbed dose to the active bone marrow from the
absorbed dose simulated within the total bone mixture,multiplied via a weighting factor w, which describes aneffective interaction probability within the active bonemarrow. This weighting factor can be calculated from theparticle energy E of the dose-depositing photons or elec-trons; the fractions of active bone marrow, inactive bonemarrow, and hard bone (fBM, fiaBM, and fHB, respectively)present in the skeletal region of interest; the photon massattenuation coefficients (μρ) or the electron mass stopping
powers (Sρ) of the skeletal constituents:
DBM ¼ Dbone � w; ð1:1Þ
w ¼μBM Eð ÞρBM
μbone Eð Þρbone
or w ¼SBM Eð ÞρBM
Sbone Eð Þρbone
; ð1:2Þ
μbone Eð Þ ¼ f BM � μBMρBM
þ f iaBM � μiaBM Eð ÞρiaBM
þ f HB �μHB Eð ÞρHB
� or
Sbone Eð Þ ¼ f BM � SBM Eð ÞρBM
þ f iaBM � SiaBM Eð ÞρiaBM
þ f HB �SHB Eð ÞρHB
;
ð1:3Þ
f BM ¼ mBM
mboneand in general f i
¼ mi
mbone; i∈ BM; iaBM;HBf g; ð1:4Þ
f BM þ f iaBM þ f HB ¼ 1: ð1:5ÞfBM, fiaBM, and fHB reference values were available for
13 active-marrow-bearing bone regions according to theICRP 110 reference male [34]. For each patient, these 13bone regions were segmented onto the patient-specificdiagnostic CT from the Ga-68-PSMA-11 PET/CT, andthe aforementioned reference fractions fBM, fiaBM, andfHB were assigned to each voxel according to its regionaffiliation. To facilitate segmentation of these 13 regionsfor each patient, a bone region template was employed.Therefore, the whole skeleton of 5 patients wassegmented via a HU threshold of 200 on the diagnosticCT from the Ga-68-PSMA-11 PET/CT, and theremaining holes in these skeletal VOIs were manuallyfilled afterwards (PMOD Version 3.609). For templategeneration, the segmented bone VOIs from all five pa-tients were co-registered onto each other using PMODnon-rigid co-registration. Finally, all 13 regions weremanually segmented on this template. For each patient,the whole skeleton was segmented in the same manneras for template generation, and the region-specific tem-plate was non-rigidly co-registered onto each patient-specific skeletal VOI, to automatically define both thepatient-specific bone region classification and the related

Gosewisch et al. EJNMMI Research (2019) 9:76 Page 6 of 14
active bone marrow distribution containing referencevalues fBM (Fig. 1).This pre-defined active bone marrow distribution was
used in two ways during Monte-Carlo-based bone mar-row dosimetry. For model MC1, the active bone marrowdistribution remained unchanged, assuming a co-localization of lesions and active bone marrow. For thesecond model MC2, all previously segmented lesion-containing voxels were removed from the active bonemarrow distribution, to simulate the effect of a completebone marrow displacement from the metastatic sitesonto the absorbed dose estimates.As for SMIRD, absorbed dose estimates were corre-
lated to the bone lesion load, the time-integrated tumoruptake, and the time-integrated ROB retention(MATLAB Pearson’s correlation).
SimulationDuring simulation, photon production, and transportthresholds were set to 1 keV (mean range < 1mm for alltissues [35]). The corresponding electron thresholds werechosen as 10 keV (mean range < 0.01mm for all tissues).109 decays were simulated for each simulation study.
Correlation with blood parametersFor the patients included in this study, all bone marrowabsorbed doses were correlated (MATLAB Pearson’scorrelation) with the change of hematological parame-ters after the investigated therapy cycle (Table 1), i.e.,the ratio of nadir-to-baseline values of platelet, lympho-cyte, and leukocyte counts as well as of hemoglobinlevel. Particularly, the goal was to assess for the overallpatient cohort whether patient-specific Monte-Carlo-based bone marrow dosimetry results in improved cor-relation with the hematological outcome compared toclassical S value dosimetry.
Comparison of bone marrow absorbed dosesBone marrow dosimetry estimates derived from the bonemarrow models MC1, MC2, and SMIRD were comparedamong each other, and respective differences werefurther correlated with the bone lesion load, the time-
Fig. 1 Exemplary workflow for definition of skeletal compositions. a Exempbone VOI. c Automatic definition of bone regions from non-rigidly co-regis
integrated tumor uptake, and the time-integrated ROBretention (MATLAB Pearson’s correlation), to estimatewhich influencing factors of absorbed dose modelingdefine differences between the investigated models.
Bone marrow dosimetry using Tc-99m-anti-granulocyteantibody scintigraphyPre-therapeutic Ga-68-PSMA-11 PET and Tc-99m-anti-granulocyte antibody SPECT distributions were visuallycompared with respect to the overlap between tumor up-take and the accumulation in the Tc-99m-anti-granulo-cyte antibody scintigraphy. In a second step, the Tc-99m-anti-granulocyte antibody SPECT/CT was non-rigidly co-registered to the Ga-68-PSMA-11 PET/CT data (PMODVersion 3.609) and considered during the Monte Carloabsorbed dose calculation as active bone marrow VOI(gMC3). Respective absorbed dose estimates were com-pared with those from model MC1 for no bone marrowdisplacement from the direct location of metastasis, MC2assuming full bone marrow displacement, and SMIRD.
ResultsReference bone marrow dosimetry using mass-scaledorgan-level S valuesMedian bone marrow absorbed dose estimates as derivedvia S values (SMIRD) were found to be 11mGy/GBq (6–25mGy/GBq) (Table 2). Individual bone marrowabsorbed doses showed a weak positive correlation withthe bone lesion load (r = 0.36, p = 0.27, R2 = 0.13). A strongpositive correlation with the time-integrated ROB reten-tion (r = 0.87, p < 0.01, R2 = 0.74) and with the time-integrated tumor uptake (r = 0.88, p < 0.01, R2 = 0.75) wasfound.Analysis of blood parameters revealed a weak negative
correlation of bone marrow absorbed dose estimateswith the change of hemoglobin level (r = − 0.19, p = 0.60,R2 = 0.04). A moderate negative correlation was foundfor the change of lymphocyte counts (r = − 0.49, p = 0.15,R2=0.24) and total white blood cells (r = − 0.45, p = 0.20,R2=0.20), while the change of platelet counts showed astrong negative correlation (r = − 0.62, p = 0.04, R2 =0.38) (Fig. 2).
lary patient CT. b Semi-automatic segmentation of patient-specifictered template
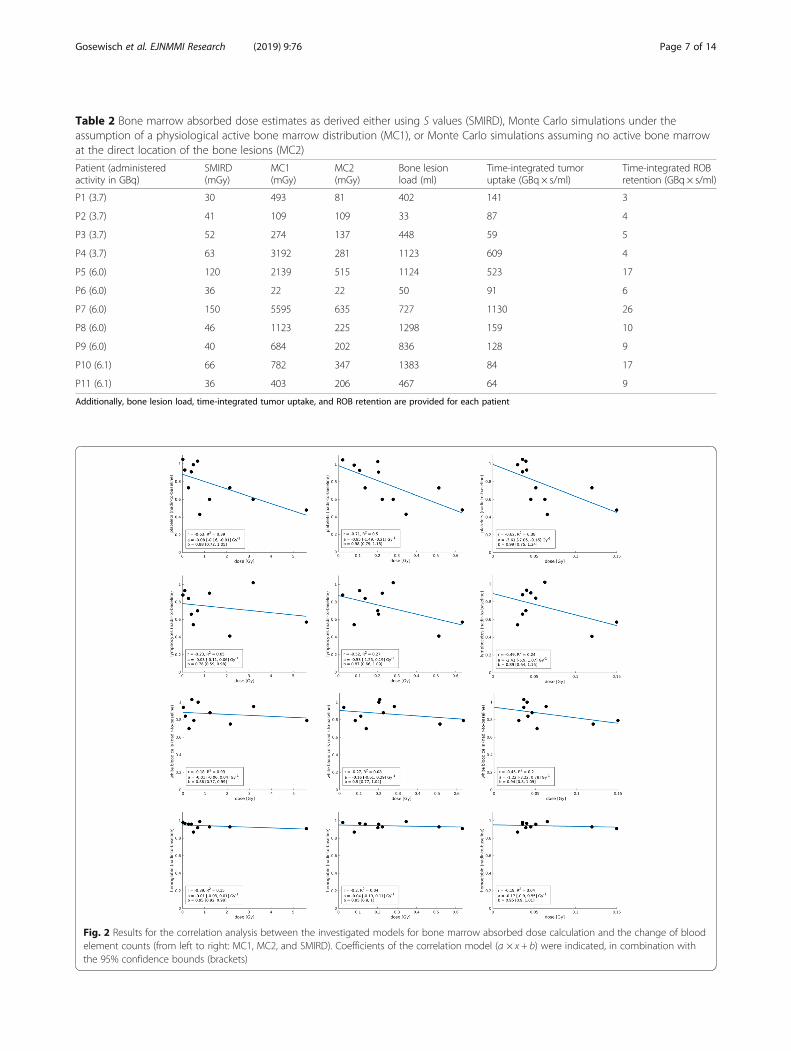
Table 2 Bone marrow absorbed dose estimates as derived either using S values (SMIRD), Monte Carlo simulations under theassumption of a physiological active bone marrow distribution (MC1), or Monte Carlo simulations assuming no active bone marrowat the direct location of the bone lesions (MC2)
Patient (administeredactivity in GBq)
SMIRD(mGy)
MC1(mGy)
MC2(mGy)
Bone lesionload (ml)
Time-integrated tumoruptake (GBq × s/ml)
Time-integrated ROBretention (GBq × s/ml)
P1 (3.7) 30 493 81 402 141 3
P2 (3.7) 41 109 109 33 87 4
P3 (3.7) 52 274 137 448 59 5
P4 (3.7) 63 3192 281 1123 609 4
P5 (6.0) 120 2139 515 1124 523 17
P6 (6.0) 36 22 22 50 91 6
P7 (6.0) 150 5595 635 727 1130 26
P8 (6.0) 46 1123 225 1298 159 10
P9 (6.0) 40 684 202 836 128 9
P10 (6.1) 66 782 347 1383 84 17
P11 (6.1) 36 403 206 467 64 9
Additionally, bone lesion load, time-integrated tumor uptake, and ROB retention are provided for each patient
Fig. 2 Results for the correlation analysis between the investigated models for bone marrow absorbed dose calculation and the change of bloodelement counts (from left to right: MC1, MC2, and SMIRD). Coefficients of the correlation model (a × x + b) were indicated, in combination withthe 95% confidence bounds (brackets)
Gosewisch et al. EJNMMI Research (2019) 9:76 Page 7 of 14

Gosewisch et al. EJNMMI Research (2019) 9:76 Page 8 of 14
Monte Carlo simulation of bone marrow absorbed doseUnder the assumption of an unaltered and physiologicalactive bone marrow distribution (MC1), medianabsorbed dose estimates were found to be 130 mGy/GBq(4–933 mGy/GBq) (Table 2). Further, for model MC1, aweak positive correlation with the bone lesion volume(r = 0.38, p = 0.24, R2 = 0.15), while a strong up to verystrong positive correlation with the time-integrated ROBretention (r = 0.71, p = 0.01, R2 = 0.50) and time-integrated tumor uptake (r = 0.98, p < 0.01, R2 = 0.97)was observed. Analysis of blood parameters revealed aweak negative correlation with the change of lymphocytecounts (r = − 0.23, p = 0.52, R2 = 0.05), total white bloodcells (r = − 0.18, p = 0.61, R2 = 0.03), and hemoglobinlevel (r = − 0.39, p = 0.26, R2 = 0.15). A strong negativecorrelation for the change of platelet counts (r = − 0.63,p = 0.04, R2 = 0.38) was found (Fig. 2).For model MC2, which assumes a full displacement of
active bone marrow from the direct location of each le-sion, median bone marrow absorbed dose estimates were37mGy/GBq (4–106 mGy/GBq) (Table 2). For MC2, amoderate positive correlation with the bone lesion volumewas found (r = 0.58, p = 0.06, R2 = 0.33), while a strong upto very strong positive correlation with the time-integratedtumor uptake and ROB retention was observed (r = 0.82,p < 0.01, R2 = 0.68 and r = 0.92, p < 0.01, R2 = 0.84). Con-cerning the blood parameters, a weak negative correlationwas found for the change of hemoglobin level (r = − 0.20,
Fig. 3 Exemplary Monte Carlo simulation results for patients 3, 4, 8, and 9.row: MIP for simulated absorbed dose within the bone marrow
p = 0.59, R2 = 0.04) and total white blood cells (r = − 0.27,p = 0.44, R2 = 0.08), while lymphocyte counts (r = − 0.52,p = 0.13, R2 = 0.27) showed a moderate negative correlation.Analysis of the change of platelet counts showed a strongnegative correlation (r = − 0.71, p = 0.01, R2 = 0.50) (Fig. 2).Exemplary simulation results are provided in Fig. 3 for
patients 3, 4, 8, and 9. Patients 4 and 8 present with acomparable bone lesion load; however, a clearly higherbone marrow absorbed dose was observed for patient 4and particularly MC1, due to a fourfold higher time-integrated tumor uptake (Table 2).
Comparison of bone marrow absorbed dosesThe median ratio between models MC1 and SMIRD wasa factor of 17 (1–50) (Table 3). The highest differenceswere observed for patients 4, 7, and 8, who showed acombination of a comparatively high bone lesion vol-ume, a high time-integrated tumor uptake, and a highratio of time-integrated tumor uptake to ROB retention(Table 3). The lowest differences were found for patients2, 3, and 6. Patients 2 and 6 showed the lowest bonelesion volume (< 50ml), while for patient 3 both acomparatively low tumor uptake and ROB retentionwere observed (Table 3). In general, the differencesbetween MC1 and SMIRD were mainly driven by thetime-integrated tumor uptake and the bone lesionvolume, respectively (r = 0.77, p < 0.01, R2 = 0.59, and r =0.60, p = 0.05, R2 = 0.36).
Upper row: MIP from pre-therapeutic Ga-68- PSMA-11 PET/CT; lower

Table 3 Ratio of bone marrow absorbed dose estimates basedon Monte Carlo simulations and S values
Patient MC1/SMIRD MC2/SMIRD MC1/MC2
P1 17 3 6
P2 3 3 1
P3 5 3 2
P4 50 4 11
P5 18 4 4
P6 1 1 1
P7 37 4 9
P8 27 5 5
P9 17 5 3
P10 12 5 2
P11 11 6 2
Median 17 4 3
Gosewisch et al. EJNMMI Research (2019) 9:76 Page 9 of 14
The comparison between model MC2 and SMIRD re-vealed a median ratio of 4 (1–6) (Table 3). The lowestdifference was obtained again for patient 6, while allother patients showed a similar deviation by a factor of 3to 6, whereupon the differences between MC2 andSMIRD mainly show a strong positive correlation withthe bone lesion volume (r = 0.63, p = 0.04, R2 = 0.40).The median ratio of MC1 to MC2 was found to be 3 (1–
11), with the highest differences being found for patients 4and 7, which both show the highest time-integrated tumoruptake (Table 3). In addition, a strong positive correlationbetween the ratios MC1 to MC2 with the time-integratedtumor uptake was found (r = 0.78, p < 0.01,R2 = 0.61).
Bone marrow dosimetry using Tc-99m-anti-granulocyteantibody scintigraphyFor patients 8 and 9, bone marrow absorbed dose esti-mates were re-analyzed using the Tc-99m-anti-granulo-cyte-based active bone marrow VOI (gMC3). For patient8, MC1 and MC2 revealed a bone marrow absorbeddose of 1223 and 225 mGy, respectively, compared to 46mGy for SMIRD. For the Tc-99m-anti-granulocyte-based VOI, an absorbed dose of 718 mGy was found, i.e.,a reduction of approximately 41% compared to MC1.The ratio of model gMC3 compared to MC2 andSMIRD was found to be 3 and 17, respectively (Table 4).For patient 9, absorbed dose estimates for MC1, MC2,and SMIRD were found to be 684, 202, and 40mGy, re-spectively. Applying the Tc-99m-anti-granulocyte-based
Table 4 Comparison of bone marrow absorbed dose estimates base
Patient MC1 (mGy) MC2 (mGy)
P8 1123 225
P9 684 202
gMC3 uses the patient-specific Tc-99m-anti-granulocyte-based active bone marrowassumes a physiological distribution, however with displacement of active bone ma
VOI yielded a bone marrow absorbed dose of 408 mGy.Thus, compared to MC1, the bone marrow absorbeddose decreased by 40%, while gMC3 produced two- andtenfold higher absorbed dose estimates compared toMC2 and SMIRD (Table 4).Furthermore, visual interpretation of Ga-68-PSMA-11
PET and Tc-99m-anti-granulocyte antibody scintigraphyindicates a low overlap between accumulation patternsand a displacement of active bone marrow from meta-static lesions for both investigated patients (Figs. 4 and 5).
DiscussionThe bone marrow is potentially the most critical organand most limiting factor of the therapeutic windowduring Lu-177-PSMA therapy of mCRPC patients, asthose patients are usually heavily pre-treated and oftenpresent with a considerable bone lesion load [14]. In astudy of Rahbar et al. with 145 patients and an averageadministered activity of 5.9 GBq per cycle, hematoxicityshowed the highest incidence for all grades as well as forgrade 3–4 events [36]. Thus, bone marrow dosimetry ishighly recommended in those patients. However, forbone marrow dosimetry to become predictive for hema-toxicity, all relevant patient-specific parameters must beconsidered. These include the patient-specific activityaccumulation over time, the anatomical characteristics,an appropriate localization of the bone marrow targetregion, and, not least, pre-therapies and the patient-specific disease and hematological baseline status.This study focuses on three relevant issues: First, we
developed an approach for Monte-Carlo-based absorbeddose calculations, which can fully consider the patient-specific 3D activity and anatomical characteristics incontrast to the classical S value dosimetry. Second, wecompared the effect of different models for active bonemarrow localization during Monte-Carlo-based bonemarrow dosimetry. The latter aspect is especially linkedto the question whether patient-specific active bonemarrow localization, e.g., via Tc-99m-anti-granulocytescintigraphy, might be beneficial to avoid bone marrowtoxicity. Third, we investigated whether for the patientcohort under study, Monte-Carlo-based absorbed dosecalculation shows an improved correlation with thechange of hematological parameters, and whether fullypatient-specific bone marrow dosimetry can potentiallyprovide an improved prediction for hematoxicities.
d on Monte Carlo simulations for patients 8 and 9
gMC3 (mGy) SMIRD (mGy)
718 46
408 40
VOI. MC1 assumes a physiological active bone marrow distribution, while MC2rrow from the direct site of metastases

Fig. 4 Results from Tc-99m-anti-granulocyte antibody SPECT/CT (b) in comparison to the Ga-68-PSMA-11 PET/CT (a) for patient 8
Gosewisch et al. EJNMMI Research (2019) 9:76 Page 10 of 14
Although the number of patients investigated in thisstudy is low, our preliminary results already indicate a largerange between bone marrow absorbed dose estimates forMonte Carlo and S value calculations. The model-specificcorrelation of bone marrow absorbed dose estimates withsegmented bone lesion volume, time-integrated tumor up-take, and ROB retention, as performed during this study,supports that multiple patient-specific factors should betaken into consideration to reduce the uncertainty of bonemarrow dosimetry. SMIRD-based bone marrow dosimetrymainly accounts for the time-integrated ROB and lesionuptake characteristics; however, respective absorbed doses
Fig. 5 Results from Tc-99m-anti-granulocyte antibody SPECT/CT (b) in com
revealed only a weak correlation with the patient-specificand highly heterogeneous 3D bone lesion distribution. ForMC2-based absorbed dose estimates, a strong and signifi-cant correlation with tumor uptake, ROB retention, andbone lesion volume was found, while bone marrowabsorbed dose calculations during model MC1 are clearlydominated by the time-integrated tumor uptake. Resultsfrom correlation analysis support that also for 3D-basedabsorbed dose calculation, the total bone lesion volume isnot the only influencing factor of the bone marrowabsorbed dose, and risk patients should be stratified accord-ing to multiple parameters.
parison to the Ga-68- PSMA-11 PET/CT (a) for patient 9

Gosewisch et al. EJNMMI Research (2019) 9:76 Page 11 of 14
With respect to the absolute values, patient-specificMonte-Carlo-based calculations resulted in higher bonemarrow absorbed doses than the classical S value ap-proach. For both models, MC2 and SMIRD, bone mar-row absorbed dose estimates were well below thetypically applied threshold of 2 Gy [19]. Although forMC2 the absorbed dose estimates were on median four-fold higher than those achieved with the reference modelSMIRD, the deduction that multiple therapy cycles areapplicable for these patients without the risk of severemarrow toxicities seems reasonable, at least with regardto the current dose limit. However, the assumption offull displacement of active bone marrow, as included inmodel MC2, might not be a priori justified in each pa-tient and might lead to an underestimation of the bonemarrow absorbed dose. For model MC1, assuming aphysiological and unaltered active bone marrow distribu-tion, median absorbed doses of 130 mGy/GBq werefound with on median 17-fold and 3-fold higherabsorbed dose estimates compared to SMIRD and MC2,respectively. According to dosimetry using model MC1,patients 4, 5, 7, and 8 would have received a bone mar-row absorbed dose close to or in some cases evenstrongly exceeding the 2 Gy limit, with the consequentrisk for severe marrow toxicities in these patients.However, none of the patients presented severe marrowdamage, even after multiple therapy cycles. This obser-vation questions the general applicability and signifi-cance of models like MC1, which do not account forbone marrow displacement by tumor lesions, especiallyin the presence of a heavy skeletal tumor burden.Visual analysis of Tc-99m-anti-granulocyte antibody
SPECT scans supports this thesis, as it indicates adisplacement of active bone marrow from the direct lo-cation of bone lesions for both exemplarily investigatedpatients. In these patients, the re-analysis of bonemarrow absorbed dose estimates using the individualTc-99m-anti-granulocyte-based active bone marrowVOIs resulted in a clear absorbed dose reduction ofapproximately 40% compared to MC1, although theabsorbed dose values were still higher than those fromMC2. However, both the Ga-68-PSMA-11 PET and theTc-99m-anti-granulocyte antibody SPECT have a finiteresolution, which intrinsically results in a certain artifi-cial overlap of both activity distributions and thus in anincreased absorbed dose estimate compared to MC2.Furthermore, co-registration between both modalities isin general not perfect, particularly for challengingregions such as the ribs or the sternum, which mightadditionally cause a local overlap between tumor andbone marrow accumulation. Both finite spatial reso-lution and imperfect co-registration interfere with a po-tential incomplete active bone marrow displacement.Despite the additional complexity introduced by the
finite resolution of the involved imaging systems and bythe imperfect co-registration, the utilization of the add-itional image data from the Tc-99m-anti-granulocyteantibody scintigraphy may improve individualized bonemarrow dosimetry by providing a realistic upper limitfor the bone marrow absorbed dose. For patient 8, theusage of a Tc-99m-anti-granulocyte-based VOI resultedin a reduction of a total bone marrow absorbed dosefrom 1.1 Gy (MC1) to an expected maximum dose of0.7 Gy. It may be hypothesized that the typically appliedupper limit for the bone marrow absorbed dose of 2 Gyis too high for patients with advanced cancer disease, ex-tensive skeletal tumor burden, and potentially decreasedhematological function due to various pre-therapies.Despite the relatively small additional bone marrowabsorbed dose (approx. 10 mSv for 400MBq), Tc-99m-anti-granulocyte antibody scintigraphy might be justifiedin such patients. Studies based on a larger patient cohortare needed to identify, whether image-based active bonemarrow localization in combination with Monte-Carlo-based absorbed dose calculation really improves thecorrelation between bone marrow dosimetry and hema-toxicities, and may therefore be suitable to guide therapyplanning in future workflows. Still, the comparison be-tween models MC1 and MC2 demonstrates that the apriori unknown patient-specific active bone marrowdistribution results in a large uncertainty of the bonemarrow absorbed doses, even if Monte Carlo techniquesare applied for absorbed dose modeling. Further, futurestudies should be performed to find an appropriatethreshold for the bone marrow absorbed dose for Lu-177-PSMA therapy [14].The resolution of non-invasive active bone marrow
localization could be further improved by MRI bonemarrow localization, which would also be beneficial ifeven small additional contributions to the bone marrowabsorbed dose must be avoided [24, 25]. However, inclinical daily routine, the localization of active bone mar-row in a large part of the patient body should be feasiblewith acceptable measurement and processing time, andit should be available for several patients per week.Further, a reduction of processing complexity and effortaccompanied by a potential enhancement of the accur-acy of the derived information is desirable. This could beachieved, for instance, by employing a standardizedmethod for patient positioning over multiple scans atthe same or at different imaging modalities via patient-adaptable storage matrasses, which facilitates image co-registration [37].To derive a patient-specific activity template from the
Ga-68-PSMA-11 PET instead from the Lu-177-SPECTreduces issues of spatial resolution during absorbed dosecalculation. Further, for the patients considered in thisstudy, only SPECT acquisitions of the abdomen were

Gosewisch et al. EJNMMI Research (2019) 9:76 Page 12 of 14
available, while for bone marrow dosimetry, the lesiondistribution in the overall body is important. Using theGa-68-PSMA-11 PET to model the 3D activity accumu-lation during therapy is an approximation and only ap-plicable if the delay between PET acquisition andtherapy is small (on average 2.5 weeks in this study) andif there is no change in the overall lesion load. To switchto a fully Lu-177-based activity template, further investi-gations are desired to improve the spatial resolution ofthe Lu-177 imaging and to enable a fast whole-body Lu-177-SPECT acquisition. Filling a fixed patient-specificactivity VOI template with the respective segmentedVOI activities from sequential Lu-177 imaging reducesco-registration errors, which could otherwise lead to anartificially increased bone marrow absorbed dose.The analysis of blood parameters revealed a significant
(p < 0.05) and strong negative correlation only for thechange of platelet counts, irrespective of the exact bonemarrow model used. The highest correlation was ob-tained with model MC2, which includes the assumptionof full displacement of active bone marrow from the dir-ect site of the bone lesions. To exploit the potential andimpact of bone marrow dosimetry for therapy planning,a more comprehensive investigation of the correlation ofthe change of blood element counts with bone marrowabsorbed dose estimates is desired. For this purpose,blood analysis should consider a higher number of pa-tients and a prolonged time period. Both the baselinehematological status and its course after therapy areknown to be affected by various parameters, such as pre-therapies or total lesion volume [17, 38–40]. Thus, a pa-tient stratification as for example proposed by Walrandet al. is mandatory, if the correlation between bone mar-row absorbed doses and hematological response to ther-apy shall be analyzed [40]. So far, the correlation of bonemarrow absorbed doses and blood parameters for differ-ent Lu-177-based radioligand therapies was assessed usingS value-based methods. Svensson et al. observed moderateand significant correlations for the decrease ofhemoglobin level, total white blood cells, and plateletcounts for Lu-177 PRRT and for 46 investigated patients[17]. By contrast, Forrer et al. found no correlation be-tween the decrease of platelet counts and bone marrowabsorbed dose estimates for Lu-177 PRRT based on 15patients and monitoring of hematological function until 6weeks after treatment [18].In clinical routine, the application of Monte Carlo
simulations for dose calculations may be too time-consuming, especially if the simulation has to consider alarge part of the patient body and small voxels (e.g.,0.05–0.001 ccm). However, Monte Carlo simulations canbe made feasible with computing clusters. In this way,results with a high statistical validity could be obtainedin 1 day, which is acceptable with respect to the time
gap between successive cycles of radioligand therapy. Anintermediate method for fast 3D dosimetry within mi-nutes, which compromises the consideration of MonteCarlo techniques and computational effectiveness, is theapplication of Monte-Carlo-based dose kernels [41, 42].Further investigations of this approach may be advisableto prospectively facilitate improved clinical dosimetry formonitoring and planning of radioligand therapies.In this work, we introduced a weighting-based model
to represent the different compartments of active and in-active bone marrow and hard bone. This model repre-sents a reasonable simplification for the application toclinical routine imaging data, which have a spatial reso-lution above the characteristic size of the bone marrowmicrostructure. Hybrid Monte-Carlo-based models thatalternate between macroscopic models of the overall pa-tient anatomy and detailed microscopic models of theskeletal system are time-consuming but might furtherimprove bone marrow absorbed dose estimates, at leastfor the understanding of important mechanisms toassess risk factors for marrow toxicities [34, 43].
ConclusionMonte-Carlo-based bone marrow absorbed doses werefound to be significantly increased compared to thosederived from classical S value dosimetry. Particularly, alarge spread between Monte-Carlo-based and S valuebone marrow absorbed doses was observed, which im-plies a large uncertainty, especially for S value dosimetrydue to the lack of an appropriate consideration of thepatient-specific highly heterogeneous 3D lesion distribu-tion. However, even for Monte-Carlo-based bone mar-row dosimetry, the a priori unknown patient-specificactive bone marrow distribution produces a large uncer-tainty of bone marrow absorbed doses. Assuming a co-localization between active bone marrow and all lesions(MC1) is hypothesized to lead to too exaggeratedabsorbed dose values (> 2 Gy per cycle for 27% of inves-tigated cycles), as these values were not in concordancewith the observation of severe hematological toxicities.Simultaneously, the a priori assumption of a fulldisplacement of active bone marrow for each patient(MC2) might underestimate the patient-specificabsorbed dose. Patient-specific image-based active mar-row localization, as performed for a small subgroup ofpatients, yielded to intermediate bone marrow absorbeddoses compared to MC1 and MC2, although issues ofco-registration and finite image resolution might inter-fere with incomplete active bone marrow displacement.Future studies based on a larger patient cohort are rec-ommended, to particularly determine whether patient-specific active bone marrow localization in combinationwith Monte-Carlo-based absorbed dose modeling canimprove the prediction of hematoxicities and thus
Gosewisch et al. EJNMMI Research (2019) 9:76 Page 13 of 14
enables to exploit the full therapeutic window of Lu-177-PSMA therapy. Preliminary results showed a signifi-cant and strong correlation between platelet decreaseand bone marrow absorbed doses, irrespective of theexact dosimetry model; however, highest correlation wasobserved for MC2.
AbbreviationsAC-CT: Low dose attenuation correction CT; BM: Bone marrow;CT: Computed tomography; ICRP: Internal Commission on RadiologicalProtection; MC: Monte Carlo; mCRPC: Metastasized castration-resistantprostate cancer; MIRD: Medical Internal Radiation Dose (Committee);PET: Positron emission tomography; PRRT: Peptide receptor radionuclidetherapy; PSMA: Prostate-specific membrane antigen; RADAR: Radiation DoseAssessment Resource; ROB: Remainder of the body; SPECT: Single-photonemission computed tomography; VOI: Volume of interest
AcknowledgementsNot applicable.
Authors’ contributionsAG, HI, AT, PB, SZ, and GB contributed to the concept and design of thestudy. AG, HI, ST, JB, and LK carried out all the data analysis. AM and KPprovided the FLUKA MC code. FJG was responsible for theradiopharmaceutical production. All authors contributed to the draft of themanuscript. All authors read and approved the manuscript.
FundingThis work was partly funded by the German Research Foundation (DFG)within the Research Training 381 Group GRK 2274.
Availability of data and materialsPlease contact the corresponding author for data request.
Ethics approval and consent to participateThis study is based on retrospective and anonymized data, which wasacquired for routine clinical dosimetry (Ethics Committee of LMU Munich).
Consent for publicationNot applicable.
Competing interestsThe authors declare that they have no competing interests.
Author details1Department of Nuclear Medicine, University Hospital, LMU Munich,Marchioninistrasse 15, 81377 Munich, Germany. 2Heidelberg Ion BeamTherapy Center, University Hospital Heidelberg, Heidelberg, Germany.3Department of Medical Physics, Ludwig-Maximilians-Universität München,Garching b. München, Germany.
Received: 14 May 2019 Accepted: 30 July 2019
References1. Stabin M, Flux G. Internal dosimetry as a tool for radiation protection of the
patient in nuclear medicine. Biomedical Imaging and Intervention Journal.2007;3(2):e28.
2. Ljungberg M, Sjögreen-Gleisner K. The accuracy of absorbed dose estimatesin tumours determined by quantitative SPECT: a Monte Carlo study. Actaoncologica. 2011;50(6):981–9.
3. Grimes J, Celler A. Comparison of internal dose estimates obtained usingorgan-level, voxel S value, and Monte Carlo techniques. Medical physics.2014;41(9):092501.
4. Cremonesi M, et al. Dosimetry in peptide radionuclide receptor therapy: areview. Journal of nuclear medicine. 2006;47(9):1467–75.
5. Bolch WE, et al. MIRD pamphlet no. 21: a generalized schema forradiopharmaceutical dosimetry—standardization of nomenclature. Journalof Nuclear Medicine. 2009;50(3):477–84.
6. Botta F, et al. Use of the FLUKA Monte Carlo code for 3D patient-specificdosimetry on PET-CT and SPECT-CT images. Physics in Medicine & Biology.2013;58(22):8099.
7. Kost SD, et al. VIDA: a voxel-based dosimetry method for targetedradionuclide therapy using Geant4. Cancer Biotherapy andRadiopharmaceuticals. 2015;30(1):16–26.
8. Ljungberg M, et al. 3D absorbed dose calculations based on SPECT:evaluation for 111-In/90-Y therapy using Monte Carlo simulations. CancerBiotherapy and Radiopharmaceuticals. 2003;18(1):99–107.
9. Ljungberg M, et al. A 3-dimensional absorbed dose calculation method basedon quantitative SPECT for radionuclide therapy: evaluation for 131I usingMonte Carlo simulation. Journal of Nuclear Medicine. 2002;43(8):1101–9.
10. Chiavassa S, et al. OEDIPE: a personalized dosimetric tool associating voxel-based models with MCNPX. Cancer biotherapy & radiopharmaceuticals.2005;20(3):325–32.
11. Fasso, A., et al, FLUKA: a multi-particle transport code. 2005, CERN-2005-10.12. Böhlen T, et al. The FLUKA code: developments and challenges for high
energy and medical applications. Nuclear data sheets. 2014;120:211–4.13. Baum RP, et al. Lutetium-177 PSMA radioligand therapy of metastatic
castration-resistant prostate cancer: safety and efficacy. Journal of NuclearMedicine. 2016. jnumed. 115.168443.
14. Kabasakal L, et al. Lu-177-PSMA-617 prostate-specific membrane antigeninhibitor therapy in patients with castration-resistant prostate cancer:stability, bio-distribution and dosimetry. Molecular imaging and radionuclidetherapy. 2017;26(2):62.
15. Delker A, et al. Dosimetry for 177 Lu-DKFZ-PSMA-617: a newradiopharmaceutical for the treatment of metastatic prostate cancer.European journal of nuclear medicine and molecular imaging. 2016;43(1):42–51.
16. Hindorf C, et al. EANM Dosimetry Committee guidelines for bone marrowand whole-body dosimetry. European journal of nuclear medicine andmolecular imaging. 2010;37(6):1238–50.
17. Svensson J, et al. A novel planar image-based method for bone marrowdosimetry in 177 Lu-DOTATATE treatment correlates with haematologicaltoxicity. EJNMMI physics. 2016;3(1):21.
18. Forrer F, et al. Bone marrow dosimetry in peptide receptor radionuclidetherapy with [177 Lu-DOTA 0, Tyr 3] octreotate. European journal of nuclearmedicine and molecular imaging. 2009;36(7):1138.
19. Sandström M, et al. Individualized dosimetry of kidney and bone marrow inpatients undergoing 177Lu-DOTA-octreotate treatment. Journal of NuclearMedicine. 2013;54(1):33–41.
20. Logothetis CJ, Lin S-H. Osteoblasts in prostate cancer metastasis to bone.Nature Reviews Cancer. 2005;5(1):21.
21. Morrissey C, Vessella RL. The role of tumor microenvironment in prostatecancer bone metastasis. Journal of cellular biochemistry. 2007;101(4):873–86.
22. Agool A, et al. Radionuclide imaging of bone marrow disorders. Europeanjournal of nuclear medicine and molecular imaging. 2011;38(1):166–78.
23. Berg BCV, et al. Magnetic resonance imaging of the normal bone marrow.Skeletal radiology. 1998;27(9):471–83.
24. Moulopoulos LA, Dimopoulos MA. Magnetic resonance imaging of thebone marrow in hematologic malignancies. Blood. 1997;90(6):2127–47.
25. Pichardo JC, Milner RJ, Bolch WE. MRI measurement of bone marrow cellularityfor radiation dosimetry. Journal of Nuclear Medicine. 2011;52(9):1482–9.
26. Fendler WP, et al. Preliminary experience with dosimetry, response andpatient reported outcome after 177Lu-PSMA-617 therapy for metastaticcastration-resistant prostate cancer. Oncotarget. 2017;8(2):3581.
27. Ljungberg M, et al. MIRD pamphlet no. 26: joint EANM/MIRD guidelines forquantitative 177Lu SPECT applied for dosimetry of radiopharmaceuticaltherapy. Journal of nuclear medicine. 2016;57(1):151–62.
28. Gosewisch A, et al. Patient-specific image-based bone marrow dosimetry inLu-177-[DOTA 0, Tyr 3]-Octreotate and Lu-177-DKFZ-PSMA-617 therapy:investigation of a new hybrid image approach. EJNMMI research. 2018;8(1):76.
29. Dewaraja YK, et al. MIRD pamphlet no. 23: quantitative SPECT for patient-specific 3-dimensional dosimetry in internal radionuclide therapy. Journal ofNuclear Medicine. 2012;53(8):1310–25.
30. Stabin MG, et al. RADAR reference adult, pediatric, and pregnant femalephantom series for internal and external dosimetry. Journal of NuclearMedicine. 2012;53(11):1807–13.
31. Herrmann K, et al. Biodistribution and radiation dosimetry for a probetargeting prostate-specific membrane antigen for imaging and therapy.Journal of Nuclear Medicine. 2015;56(6):855–61.

Gosewisch et al. EJNMMI Research (2019) 9:76 Page 14 of 14
32. Parodi K, et al. Clinical CT-based calculations of dose and positron emitterdistributions in proton therapy using the FLUKA Monte Carlo code. Physicsin Medicine & Biology. 2007;52(12):3369.
33. Lee C, et al. An assessment of bone marrow and bone endosteumdosimetry methods for photon sources. Physics in Medicine & Biology.2006;51(21):5391.
34. Hough M, et al. An image-based skeletal dosimetry model for the ICRPreference adult male—internal electron sources. Physics in Medicine &Biology. 2011;56(8):2309.
35. https://www.nist.gov/pml/stopping-power-range-tables-electrons-protons-and-helium-ions.
36. Rahbar K, et al. German multicenter study investigating 177Lu-PSMA-617radioligand therapy in advanced prostate cancer patients. Journal ofNuclear Medicine. 2017;58(1):85–90.
37. Förster GJ, et al. SPET/CT image co-registration in the abdomen with asimple and cost-effective tool. European journal of nuclear medicine andmolecular imaging. 2003;30(1):32–9.
38. Bodei L, et al. Long-term tolerability of PRRT in 807 patients withneuroendocrine tumours: the value and limitations of clinical factors. Europeanjournal of nuclear medicine and molecular imaging. 2015;42(1):5–19.
39. Bergsma H, et al. Subacute haematotoxicity after PRRT with 177 Lu-DOTA-octreotate: prognostic factors, incidence and course. European journal ofnuclear medicine and molecular imaging. 2016;43(3):453–63.
40. Walrand S, et al. Experimental facts supporting a red marrow uptake due toradiometal transchelation in 90 Y-DOTATOC therapy and relationship to thedecrease of platelet counts. European journal of nuclear medicine andmolecular imaging. 2011;38(7):1270–80.
41. Sanchez-Garcia M, et al. Implementation and validation of collapsed conesuperposition for radiopharmaceutical dosimetry of photon emitters. Physicsin Medicine & Biology. 2015;60(20):7861.
42. Sanchez-Garcia M, et al. A new approach for dose calculation in targetedradionuclide therapy (TRT) based on collapsed cone superposition:validation with 90Y. Physics in Medicine & Biology. 2014;59(17):4769.
43. Shah AP, et al. A paired-image radiation transport model for skeletaldosimetry. Journal of Nuclear Medicine. 2005;46(2):344–53.
Publisher’s NoteSpringer Nature remains neutral with regard to jurisdictional claims inpublished maps and institutional affiliations.

![Labelling Efficiency DOTA PSMA Methods - Trasis 68Ga ISRS.pdf · Objectives [68Ga]Ga-HBED-11-PSMA (PSMA) and [68Ga]Ga-DOTA-tate (DOTAtate) are two well established PET tracers for](https://static.fdocuments.in/doc/165x107/5aae60737f8b9a6b308bf490/labelling-efficiency-dota-psma-methods-68ga-isrspdfobjectives-68gaga-hbed-11-psma.jpg)


![Third-line treatment and 177Lu-PSMA radioligand therapy of ... · refractory adenocarcinomas of the prostate express prostate-specific membrane antigen (PSMA) [13]. 68Ga-PSMA HBED-CC](https://static.fdocuments.in/doc/165x107/5f0256ec7e708231d403c8b9/third-line-treatment-and-177lu-psma-radioligand-therapy-of-refractory-adenocarcinomas.jpg)