3D Map UI for Exploring Music Collections
8
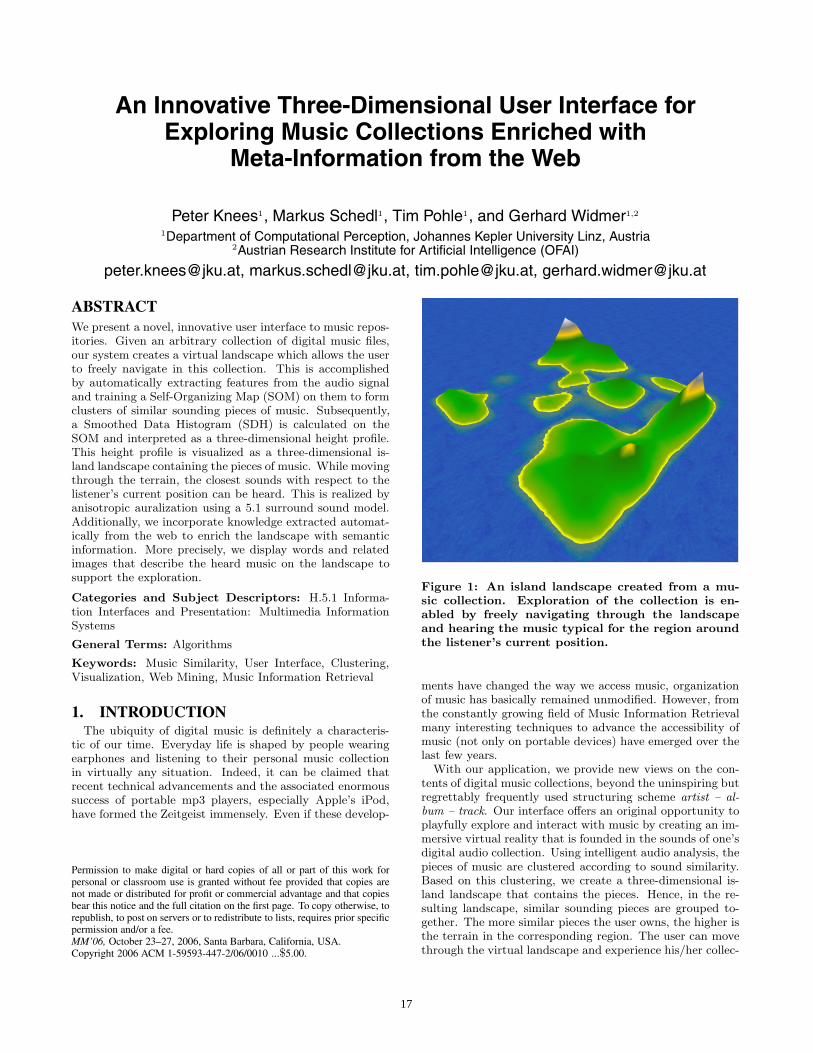
An Innovative Three-Dimensional User Interface for Exploring Music Collections Enriched with Meta-Information from the Web Peter Knees 1 , Markus Schedl 1 , Tim Pohle 1 , and Gerhard Widmer 1,2 1 Department of Computational Perception, Johannes Kepler University Linz, Austria 2 Austrian Research Institute for Artificial Intelligence (OFAI) [email protected], [email protected], [email protected], [email protected] ABSTRACT We present a novel, innovative user interface to music repos- itories. Given an arbitrary collection of digital music files, our system creates a virtual landscape which allows the user to freely navigate in this collection. This is accomplished by automatically extracting features from the audio signal and training a Self-Organizing Map (SOM) on them to form clusters of similar sounding pieces of music. Subsequently, a Smoothed Data Histogram (SDH) is calculated on the SOM and interpreted as a three-dimensional height profile. This height profile is visualized as a three-dimensional is- land landscape containing the pieces of music. While moving through the terrain, the closest sounds with respect to the listener’s current position can be heard. This is realized by anisotropic auralization using a 5.1 surround sound model. Additionally, we incorporate knowledge extracted automat- ically from the web to enrich the landscape with semantic information. More precisely, we display words and related images that describe the heard music on the landscape to support the exploration. Categories and Subject Descriptors: H.5.1 Informa- tion Interfaces and Presentation: Multimedia Information Systems General Terms: Algorithms Keywords: Music Similarity, User Interface, Clustering, Visualization, Web Mining, Music Information Retrieval 1. INTRODUCTION The ubiquity of digital music is definitely a characteris- tic of our time. Everyday life is shaped by people wearing earphones and listening to their personal music collection in virtually any situation. Indeed, it can be claimed that recent technical advancements and the associated enormous success of portable mp3 players, especially Apple’s iPod, have formed the Zeitgeist immensely. Even if these develop- Permission to make digital or hard copies of all or part of this work for personal or classroom use is granted without fee provided that copies are not made or distributed for profit or commercial advantage and that copies bear this notice and the full citation on the first page. To copy otherwise, to republish, to post on servers or to redistribute to lists, requires prior specific permission and/or a fee. MM’06, October 23–27, 2006, Santa Barbara, California, USA. Copyright 2006 ACM 1-59593-447-2/06/0010 ...$5.00. Figure 1: An island landscape created from a mu- sic collection. Exploration of the collection is en- abled by freely navigating through the landscape and hearing the music typical for the region around the listener’s current position. ments have changed the way we access music, organization of music has basically remained unmodified. However, from the constantly growing field of Music Information Retrieval many interesting techniques to advance the accessibility of music (not only on portable devices) have emerged over the last few years. With our application, we provide new views on the con- tents of digital music collections, beyond the uninspiring but regrettably frequently used structuring scheme artist – al- bum – track. Our interface offers an original opportunity to playfully explore and interact with music by creating an im- mersive virtual reality that is founded in the sounds of one’s digital audio collection. Using intelligent audio analysis, the pieces of music are clustered according to sound similarity. Based on this clustering, we create a three-dimensional is- land landscape that contains the pieces. Hence, in the re- sulting landscape, similar sounding pieces are grouped to- gether. The more similar pieces the user owns, the higher is the terrain in the corresponding region. The user can move through the virtual landscape and experience his/her collec- 17
-
Upload
pirkka-aman -
Category
Documents
-
view
230 -
download
1
Transcript of 3D Map UI for Exploring Music Collections
An Innovative Three-Dimensional User Interface forExploring Music Collections Enriched with
Meta-Information from the Web
Peter Knees1, Markus Schedl1, Tim Pohle1, and Gerhard Widmer1,2
1Department of Computational Perception, Johannes Kepler University Linz, Austria2Austrian Research Institute for Artificial Intelligence (OFAI)
[email protected], [email protected], [email protected], [email protected]
ABSTRACTWe present a novel, innovative user interface to music repos-itories. Given an arbitrary collection of digital music files,our system creates a virtual landscape which allows the userto freely navigate in this collection. This is accomplishedby automatically extracting features from the audio signaland training a Self-Organizing Map (SOM) on them to formclusters of similar sounding pieces of music. Subsequently,a Smoothed Data Histogram (SDH) is calculated on theSOM and interpreted as a three-dimensional height profile.This height profile is visualized as a three-dimensional is-land landscape containing the pieces of music. While movingthrough the terrain, the closest sounds with respect to thelistener’s current position can be heard. This is realized byanisotropic auralization using a 5.1 surround sound model.Additionally, we incorporate knowledge extracted automat-ically from the web to enrich the landscape with semanticinformation. More precisely, we display words and relatedimages that describe the heard music on the landscape tosupport the exploration.
Categories and Subject Descriptors: H.5.1 Informa-tion Interfaces and Presentation: Multimedia InformationSystems
General Terms: Algorithms
Keywords: Music Similarity, User Interface, Clustering,Visualization, Web Mining, Music Information Retrieval
1. INTRODUCTIONThe ubiquity of digital music is definitely a characteris-
tic of our time. Everyday life is shaped by people wearingearphones and listening to their personal music collectionin virtually any situation. Indeed, it can be claimed thatrecent technical advancements and the associated enormoussuccess of portable mp3 players, especially Apple’s iPod,have formed the Zeitgeist immensely. Even if these develop-
Permission to make digital or hard copies of all or part of this work forpersonal or classroom use is granted without fee provided that copies arenot made or distributed for profit or commercial advantage and that copiesbear this notice and the full citation on the first page. To copy otherwise, torepublish, to post on servers or to redistribute to lists, requires prior specificpermission and/or a fee.MM’06, October 23–27, 2006, Santa Barbara, California, USA.Copyright 2006 ACM 1-59593-447-2/06/0010 ...$5.00.
Figure 1: An island landscape created from a mu-sic collection. Exploration of the collection is en-abled by freely navigating through the landscapeand hearing the music typical for the region aroundthe listener’s current position.
ments have changed the way we access music, organizationof music has basically remained unmodified. However, fromthe constantly growing field of Music Information Retrievalmany interesting techniques to advance the accessibility ofmusic (not only on portable devices) have emerged over thelast few years.
With our application, we provide new views on the con-tents of digital music collections, beyond the uninspiring butregrettably frequently used structuring scheme artist – al-bum – track. Our interface offers an original opportunity toplayfully explore and interact with music by creating an im-mersive virtual reality that is founded in the sounds of one’sdigital audio collection. Using intelligent audio analysis, thepieces of music are clustered according to sound similarity.Based on this clustering, we create a three-dimensional is-land landscape that contains the pieces. Hence, in the re-sulting landscape, similar sounding pieces are grouped to-gether. The more similar pieces the user owns, the higher isthe terrain in the corresponding region. The user can movethrough the virtual landscape and experience his/her collec-
17
tion. This visual approach essentially follows the Islands ofMusic metaphor from [16]. Each music collection creates acharacteristic and unique landscape. Additionally to seeingthe music pieces in the landscape, the pieces closest to thelistener’s current position are played. Thus, the user gets anauditory impression of the musical style in the surroundingregion. To accomplish the spatialized audio playback, werely on a 5.1 surround sound system.
Furthermore, the system incorporates web-retrieval tech-niques to enrich the landscape with semantic and visual in-formation. Instead of displaying song title and performingartist on the landscape, the user can also choose to dis-play words that describe the heard music or images thatare related to this content. Thus, besides the intelligentand content-based organization of music, the system alsoaccounts for the cultural aspects of music by including ad-ditional information extracted from the web.
The remainder of this paper is organized as follows. Inthe next section, we will give a brief overview of existingalternative interfaces to music archives and preceding work.In Sections 3 and 4, we describe the technical fundamen-tals and the realization of the application. In Section 5,we report on a small user study we conducted. Finally, wereview our interface and propose future enhancements thatwill further increase the project’s practical applicability.
2. RELATED WORKIt is one of the manifold goals of Music Information Re-
trieval to provide new and intuitive ways to access music(e.g. to efficiently find music in online stores) and to auto-matically support the user in organizing his/her music col-lection. To this end, several techniques have been proposed.Although there exist many interesting approaches that arebased on manually assigned meta-data (e.g. [21] or Music-lens1), we will solely concentrate on systems which rely onaudio-based similarity calculations between music pieces. Ingeneral, such systems use the similarity information to au-tomatically structure a music repository and aid the user inhis/her exploration.
A very remarkable interface to discover new pieces andeasily generate playlists is presented in [5]. From streamsof music pieces (represented as discs) the user can simplypick out a piece to listen to or “collect” similar pieces bydragging a seed song into one of the streams. The differentstreams describe different moods. The number of releaseddiscs can be regulated for each mood separately by “tabs”.Furthermore, the system invites users to experiment withplaylists as all modifications can be undone easily by a socalled time-machine function. Also combining playlists isfacilitated through the intuitive drag-and-drop interface.
Other interfaces focus more on structuring and facilitat-ing the access to existing collections instead of recommend-ing new songs. Since in most cases, musical similarity isderived from a high-dimensional feature space, it is neces-sary to project the data into a lower-dimensional (latent)space in order to make it understandable to humans – atechnique also commonly used in classical Information Re-trieval [25]. For music, a frequently used approach is toapply Self-Organizing Maps (SOM) to arrange the collec-tion on a 2-dimensional map that is intuitively readable bythe user. We will explain the functionality of SOMs in Sec-
1http://www.musiclens.de
tion 3.2. The first and most important approach that incor-porated SOMs to structure music collections is Pampalk’sIslands of Music interface [13, 16]. For the Islands of Mu-sic, a SOM is calculated on Fluctuation Pattern features(cf. Section 3.1.1). It visualizes the calculated SOM byapplying a technique called Smoothed Data Histogram (cf.Section 3.3). Finally, a color model inspired by geographicalmaps is applied. Thus, on the resulting map, blue regions(oceans) indicate areas onto which very few pieces of musicare mapped, whereas clusters containing a larger quantity ofpieces are colored in brown and white (mountains and snow).In addition to this approach, several extensions have beenproposed, e.g. the usage of Aligned SOMs [14] to enable aseamless shift of focus between different aspects of similarity.Furthermore, in [19] the interface has been extended by ahierarchical component to cope with very large music collec-tions. In [12], SOMs are utilized for browsing in collectionsand intuitive playlist generation on portable devices. Otherpublished approaches use SOM derivatives [11], similar tech-niques like FastMap [4], or graph-drawing algorithms to vi-sualize the similarity of artists on portable devices [23]. Theinterface presented in [20] can utilize different approachesto map creation (including manual construction) and putsa focus on social interaction at playlist creation.
Another approach to assisting the user in browsing a mu-sic collection is spatialized music playback. In [22], an au-dio editor and browser is presented which makes use of thePrinceton Scalable Display Wall with a 16-speaker surroundsystem. In the so called SoundSpace browser, audio thumb-nails of pieces close to the actual track are played simultane-ously. In [3], sounds are represented as visual and soundingobjects with specific properties. On a grid, the user candefine a position from which all sounds that fall into a sur-rounding region (“aura”) are played spatialized according tothe position on the grid. [9] also deals with spatialized audioplayback for usage in alternative music interfaces.
With our work, we primarily follow Pampalk’s Islands ofMusic approach and (literally) raise it to the next dimen-sion. Instead of just presenting a map, we generate a virtuallandscape which encourages the user to freely navigate andexplore the underlying music collection (cf. Figure 2). Wealso include spatialized audio playback. Hence, while mov-ing through the landscape, the user hears audio thumbnailsof close songs. Furthermore, we incorporate procedures fromweb-retrieval in conjunction with a SOM-labeling strategyto display words that describe the styles of music or imagesthat are related to these styles in the different regions onthe landscape.
3. TECHNICAL FUNDAMENTALSIn this section, we briefly introduce the underlying tech-
niques of our interface. First, we describe the methodsto compute similarities based on features extracted fromthe audio files. Second, we explain the functionality ofthe Self-Organizing Map which we use to cluster the high-dimensional data on a 2-dimensional map. Third, we re-view the smoothed data histogram approach, used to createa smooth terrain from a trained SOM. The last section con-cerns on the incorporated SOM-labeling strategy to displaywords from the web that describe the heard music. Since in-corporation of related images is a straightforward extensionof the presented procedures, details on this are given laterin Section 4.3.4.
18
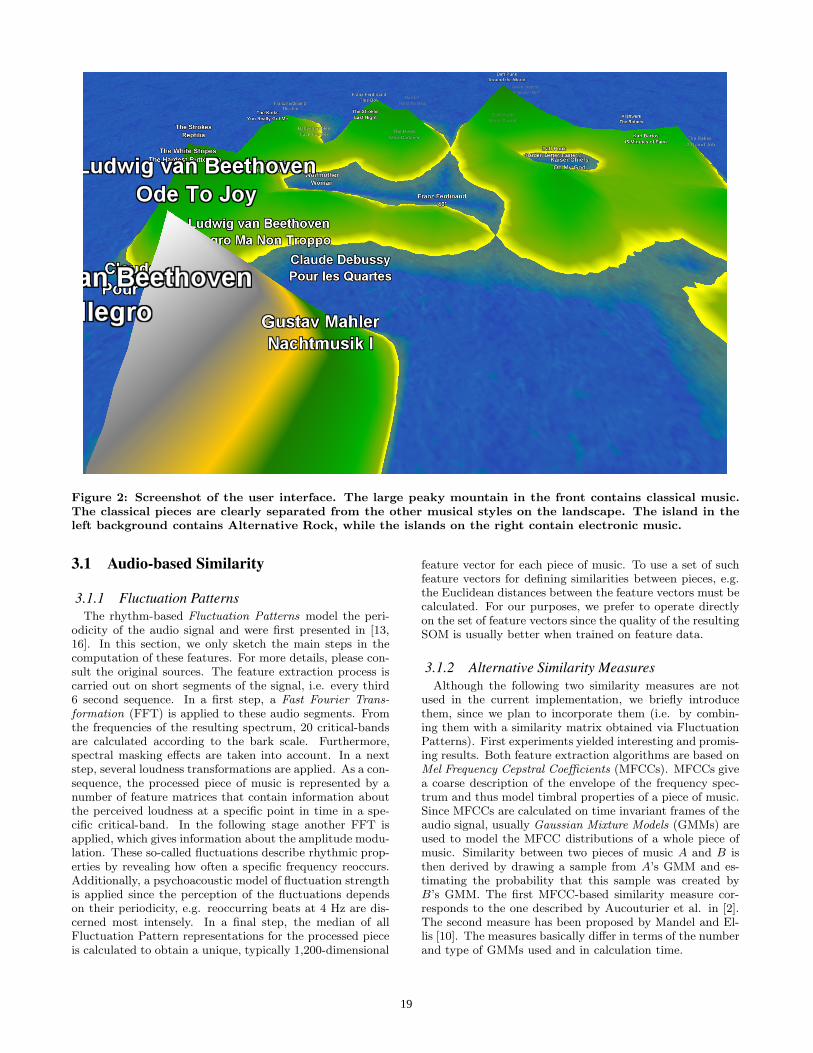
Figure 2: Screenshot of the user interface. The large peaky mountain in the front contains classical music.The classical pieces are clearly separated from the other musical styles on the landscape. The island in theleft background contains Alternative Rock, while the islands on the right contain electronic music.
3.1 Audio-based Similarity
3.1.1 Fluctuation PatternsThe rhythm-based Fluctuation Patterns model the peri-
odicity of the audio signal and were first presented in [13,16]. In this section, we only sketch the main steps in thecomputation of these features. For more details, please con-sult the original sources. The feature extraction process iscarried out on short segments of the signal, i.e. every third6 second sequence. In a first step, a Fast Fourier Trans-formation (FFT) is applied to these audio segments. Fromthe frequencies of the resulting spectrum, 20 critical-bandsare calculated according to the bark scale. Furthermore,spectral masking effects are taken into account. In a nextstep, several loudness transformations are applied. As a con-sequence, the processed piece of music is represented by anumber of feature matrices that contain information aboutthe perceived loudness at a specific point in time in a spe-cific critical-band. In the following stage another FFT isapplied, which gives information about the amplitude modu-lation. These so-called fluctuations describe rhythmic prop-erties by revealing how often a specific frequency reoccurs.Additionally, a psychoacoustic model of fluctuation strengthis applied since the perception of the fluctuations dependson their periodicity, e.g. reoccurring beats at 4 Hz are dis-cerned most intensely. In a final step, the median of allFluctuation Pattern representations for the processed pieceis calculated to obtain a unique, typically 1,200-dimensional
feature vector for each piece of music. To use a set of suchfeature vectors for defining similarities between pieces, e.g.the Euclidean distances between the feature vectors must becalculated. For our purposes, we prefer to operate directlyon the set of feature vectors since the quality of the resultingSOM is usually better when trained on feature data.
3.1.2 Alternative Similarity MeasuresAlthough the following two similarity measures are not
used in the current implementation, we briefly introducethem, since we plan to incorporate them (i.e. by combin-ing them with a similarity matrix obtained via FluctuationPatterns). First experiments yielded interesting and promis-ing results. Both feature extraction algorithms are based onMel Frequency Cepstral Coefficients (MFCCs). MFCCs givea coarse description of the envelope of the frequency spec-trum and thus model timbral properties of a piece of music.Since MFCCs are calculated on time invariant frames of theaudio signal, usually Gaussian Mixture Models (GMMs) areused to model the MFCC distributions of a whole piece ofmusic. Similarity between two pieces of music A and B isthen derived by drawing a sample from A’s GMM and es-timating the probability that this sample was created byB’s GMM. The first MFCC-based similarity measure cor-responds to the one described by Aucouturier et al. in [2].The second measure has been proposed by Mandel and El-lis [10]. The measures basically differ in terms of the numberand type of GMMs used and in calculation time.
19
3.2 The Self-Organizing MapThe SOM [7] is an unsupervised neural network that or-
ganizes multivariate data on a usually 2-dimensional mapin such a manner that data items which are similar in thehigh-dimensional space are projected to similar locations onthe map. Basically, the SOM consists of an ordered set ofmap units, each of which is assigned a “model vector” in theoriginal data space. The set of all model vectors of a SOMis called its “codebook”. There exist different strategies toinitialize the codebook. We simply use a random initializa-tion. For training, we use the batch SOM algorithm: In afirst step, for each data item x, the Euclidean distance be-tween x and each model vector is calculated. The map unitpossessing the model vector that is closest to a data item x isreferred to as “best matching unit” and is used to representx on the map. In the second step, the codebook is updatedby calculating weighted centroids of all data elements asso-ciated to the corresponding model vectors. This reduces thedistances between the data items and the model vectors ofthe best matching units and also their surrounding units,which participate to a certain extent in the adaptations.The adaptation strength decreases gradually and dependson both distance of the units and iteration cycle. This sup-ports the formation of large clusters in the beginning anda fine-tuning toward the end of the training. Usually, theiterative training is continued until a convergence criterionis fulfilled.
3.3 Smoothed Data HistogramAn approach that creates appealing visualizations of the
data clusters of a SOM is the Smoothed Data Histogram(SDH), proposed in [17]. An SDH creates a smooth heightprofile (where height corresponds to the number of itemsin each region) by estimating the density of the data itemsover the map. To this end, each data item votes for a fixednumber of best matching map units. The selected units areweighted according to the degree of the matching. The votesare accumulated in a matrix describing the distribution overthe complete map. After each piece of music has voted, theresulting matrix is interpolated in order to obtain a smoothvisualization. Additionally, a color map can be applied tothe interpolated matrix to emphasize the resulting heightprofile. We apply a color map similar to the one used inthe Islands of Music, to give the impression of an island-liketerrain.
3.4 SOM-LabelingAn important aspect of our user interface is the incorpo-
ration of related information extracted automatically fromthe web. In particular, we intend to augment the landscapewith music-specific terms that are commonly used to de-scribe the music in the current region. We exploit the web’scollective knowledge to figure out which words are typicallyused in the context of the represented artists. Details on theretrieval of these words are given in Section 4.3.
Once we have gathered a list of typical words for eachartist, we are in need of both a strategy for transferring thelist of artist-relevant words to the specific tracks on the land-scape, as well as a strategy for determining those words thatdiscriminate between the music in one region of the map andthose in another (e.g. music is not a discriminating word,since it occurs very frequently for all artists). We decidedto apply the SOM-labeling strategy proposed by Lagus and
Kaski [8]. In their heuristically motivated weighting scheme,the relevance wtc of a term for a cluster is calculated as
wtc = (tftc/X
t′tft′c) · (tftc/
P′t tft′c)P
c′ (tftc′/P
t′ tft′c′), (1)
where tftc denotes the frequency of term t in cluster c. Wesimply determine the term frequency for a term in each clus-ter as
tftc =X
a
fac · tfta, (2)
where fac gives the number of tracks of artist a in cluster cand tfta the term frequency of term t for artist a. For eachcluster, we use the 8 highest weighted terms to describe itscontent.
We also experimented with the χ2-test to find the mostdiscriminating terms for each cluster. Usually, the χ2-test isa well-applicable method to reduce the feature space in textcategorization problems (see e.g. [26] for a detailed discus-sion). However, we found the Lagus and Kaski approach toyield better results for our task.
4. APPLICATION REALIZATIONIn the following, we describe the realization of the user
interface. First, the concept and the philosophy of the in-terface are explained. Second, we want to describe a typicaluse-case for the application. Third, we describe how weincorporate the techniques reviewed in Section 3 to createthe application. Finally, we will make some remarks on theimplementation.
4.1 Interface ConceptOur intention is to provide an interface to music collec-
tions detached from the conventional computer interactionmetaphors. The first step toward this is the creation of anartificial but nevertheless appealing landscape that encour-ages the user to explore interactively.e Furthermore, we re-frain from the usage of standard UI-components, containedin almost every window toolkit. Rather than constructing aninterface that relies on the classical point-and-click schemebest controlled through a mouse, we designed the whole ap-plication to be controllable with a standard game pad asused for video game controlling. From our point of view,a game pad is perfectly suited for exploration of the land-scape as it provides the necessary functionality to navigatein three dimensions whilst being easy to handle. However,we also included the option to navigate with a mouse incases where no game pad is available (which has confirmedour opinion that a mouse is not the perfectly suited inputdevice for this application). The controlling via a game padalso suggests a closeness to computer games which is abso-lutely intended since we aim at creating an interface that isfun to use. Therefore, we kept the controlling scheme verysimple (cf. Figure 3).
Another important characteristic of the interface is thefact that the music surrounding the listener is played dur-ing navigation. Hence, it is not necessary to select each songmanually and scan it for interesting parts. While the user ex-plores the collection he/she is automatically presented withthumbnails from the closest music pieces, giving immediateauditory feedback on the style of music in the current re-gion. Thus, the meaningfulness of the spatial distribution
20
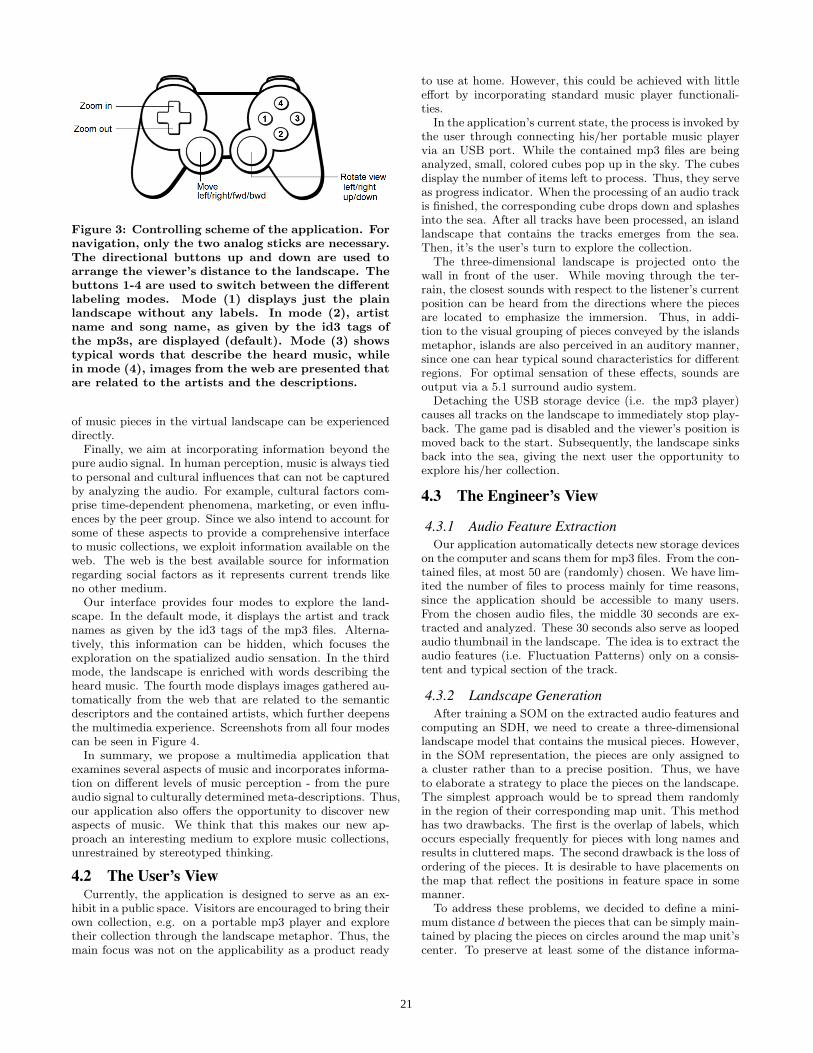
Figure 3: Controlling scheme of the application. Fornavigation, only the two analog sticks are necessary.The directional buttons up and down are used toarrange the viewer’s distance to the landscape. Thebuttons 1-4 are used to switch between the differentlabeling modes. Mode (1) displays just the plainlandscape without any labels. In mode (2), artistname and song name, as given by the id3 tags ofthe mp3s, are displayed (default). Mode (3) showstypical words that describe the heard music, whilein mode (4), images from the web are presented thatare related to the artists and the descriptions.
of music pieces in the virtual landscape can be experienceddirectly.
Finally, we aim at incorporating information beyond thepure audio signal. In human perception, music is always tiedto personal and cultural influences that can not be capturedby analyzing the audio. For example, cultural factors com-prise time-dependent phenomena, marketing, or even influ-ences by the peer group. Since we also intend to account forsome of these aspects to provide a comprehensive interfaceto music collections, we exploit information available on theweb. The web is the best available source for informationregarding social factors as it represents current trends likeno other medium.
Our interface provides four modes to explore the land-scape. In the default mode, it displays the artist and tracknames as given by the id3 tags of the mp3 files. Alterna-tively, this information can be hidden, which focuses theexploration on the spatialized audio sensation. In the thirdmode, the landscape is enriched with words describing theheard music. The fourth mode displays images gathered au-tomatically from the web that are related to the semanticdescriptors and the contained artists, which further deepensthe multimedia experience. Screenshots from all four modescan be seen in Figure 4.
In summary, we propose a multimedia application thatexamines several aspects of music and incorporates informa-tion on different levels of music perception - from the pureaudio signal to culturally determined meta-descriptions. Thus,our application also offers the opportunity to discover newaspects of music. We think that this makes our new ap-proach an interesting medium to explore music collections,unrestrained by stereotyped thinking.
4.2 The User’s ViewCurrently, the application is designed to serve as an ex-
hibit in a public space. Visitors are encouraged to bring theirown collection, e.g. on a portable mp3 player and exploretheir collection through the landscape metaphor. Thus, themain focus was not on the applicability as a product ready
to use at home. However, this could be achieved with littleeffort by incorporating standard music player functionali-ties.
In the application’s current state, the process is invoked bythe user through connecting his/her portable music playervia an USB port. While the contained mp3 files are beinganalyzed, small, colored cubes pop up in the sky. The cubesdisplay the number of items left to process. Thus, they serveas progress indicator. When the processing of an audio trackis finished, the corresponding cube drops down and splashesinto the sea. After all tracks have been processed, an islandlandscape that contains the tracks emerges from the sea.Then, it’s the user’s turn to explore the collection.
The three-dimensional landscape is projected onto thewall in front of the user. While moving through the ter-rain, the closest sounds with respect to the listener’s currentposition can be heard from the directions where the piecesare located to emphasize the immersion. Thus, in addi-tion to the visual grouping of pieces conveyed by the islandsmetaphor, islands are also perceived in an auditory manner,since one can hear typical sound characteristics for differentregions. For optimal sensation of these effects, sounds areoutput via a 5.1 surround audio system.
Detaching the USB storage device (i.e. the mp3 player)causes all tracks on the landscape to immediately stop play-back. The game pad is disabled and the viewer’s position ismoved back to the start. Subsequently, the landscape sinksback into the sea, giving the next user the opportunity toexplore his/her collection.
4.3 The Engineer’s View
4.3.1 Audio Feature ExtractionOur application automatically detects new storage devices
on the computer and scans them for mp3 files. From the con-tained files, at most 50 are (randomly) chosen. We have lim-ited the number of files to process mainly for time reasons,since the application should be accessible to many users.From the chosen audio files, the middle 30 seconds are ex-tracted and analyzed. These 30 seconds also serve as loopedaudio thumbnail in the landscape. The idea is to extract theaudio features (i.e. Fluctuation Patterns) only on a consis-tent and typical section of the track.
4.3.2 Landscape GenerationAfter training a SOM on the extracted audio features and
computing an SDH, we need to create a three-dimensionallandscape model that contains the musical pieces. However,in the SOM representation, the pieces are only assigned toa cluster rather than to a precise position. Thus, we haveto elaborate a strategy to place the pieces on the landscape.The simplest approach would be to spread them randomlyin the region of their corresponding map unit. This methodhas two drawbacks. The first is the overlap of labels, whichoccurs especially frequently for pieces with long names andresults in cluttered maps. The second drawback is the loss ofordering of the pieces. It is desirable to have placements onthe map that reflect the positions in feature space in somemanner.
To address these problems, we decided to define a mini-mum distance d between the pieces that can be simply main-tained by placing the pieces on circles around the map unit’scenter. To preserve at least some of the distance informa-
21
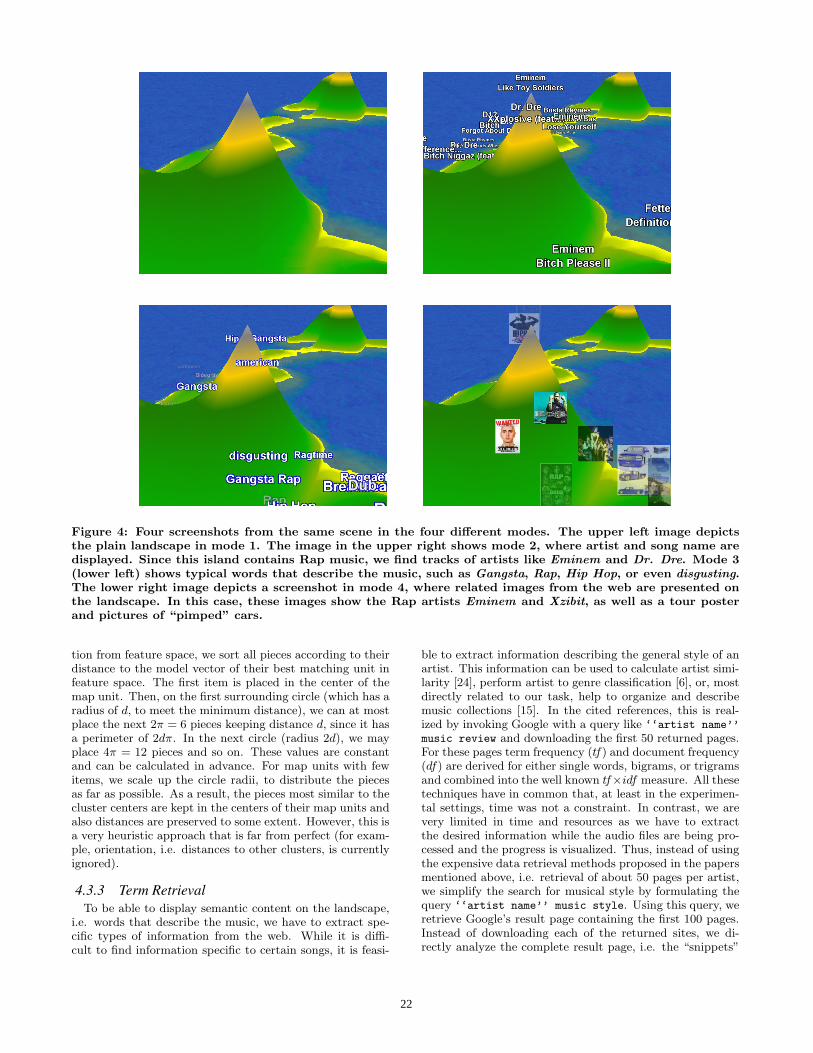
Figure 4: Four screenshots from the same scene in the four different modes. The upper left image depictsthe plain landscape in mode 1. The image in the upper right shows mode 2, where artist and song name aredisplayed. Since this island contains Rap music, we find tracks of artists like Eminem and Dr. Dre. Mode 3(lower left) shows typical words that describe the music, such as Gangsta, Rap, Hip Hop, or even disgusting.The lower right image depicts a screenshot in mode 4, where related images from the web are presented onthe landscape. In this case, these images show the Rap artists Eminem and Xzibit, as well as a tour posterand pictures of “pimped” cars.
tion from feature space, we sort all pieces according to theirdistance to the model vector of their best matching unit infeature space. The first item is placed in the center of themap unit. Then, on the first surrounding circle (which has aradius of d, to meet the minimum distance), we can at mostplace the next 2π = 6 pieces keeping distance d, since it hasa perimeter of 2dπ. In the next circle (radius 2d), we mayplace 4π = 12 pieces and so on. These values are constantand can be calculated in advance. For map units with fewitems, we scale up the circle radii, to distribute the piecesas far as possible. As a result, the pieces most similar to thecluster centers are kept in the centers of their map units andalso distances are preserved to some extent. However, this isa very heuristic approach that is far from perfect (for exam-ple, orientation, i.e. distances to other clusters, is currentlyignored).
4.3.3 Term RetrievalTo be able to display semantic content on the landscape,
i.e. words that describe the music, we have to extract spe-cific types of information from the web. While it is diffi-cult to find information specific to certain songs, it is feasi-
ble to extract information describing the general style of anartist. This information can be used to calculate artist simi-larity [24], perform artist to genre classification [6], or, mostdirectly related to our task, help to organize and describemusic collections [15]. In the cited references, this is real-ized by invoking Google with a query like ‘‘artist name’’
music review and downloading the first 50 returned pages.For these pages term frequency (tf) and document frequency(df) are derived for either single words, bigrams, or trigramsand combined into the well known tf×idf measure. All thesetechniques have in common that, at least in the experimen-tal settings, time was not a constraint. In contrast, we arevery limited in time and resources as we have to extractthe desired information while the audio files are being pro-cessed and the progress is visualized. Thus, instead of usingthe expensive data retrieval methods proposed in the papersmentioned above, i.e. retrieval of about 50 pages per artist,we simplify the search for musical style by formulating thequery ‘‘artist name’’ music style. Using this query, weretrieve Google’s result page containing the first 100 pages.Instead of downloading each of the returned sites, we di-rectly analyze the complete result page, i.e. the “snippets”
22
presented. Thus, we can reduce the effort to just one webpage per artist. To avoid the occurrence of totally unre-lated words, we use a domain-specific dictionary, which isbasically a shortened version of the dictionary used in [15].After obtaining a term frequency representation of the dic-tionary vector for each artist, we determine the importantwords for each cluster as described in Section 3.4. The re-sulting labels are distributed randomly across the map unit.
4.3.4 Image RetrievalTo display images related to the artists and the describing
words, we make use of the images search function of Yahoo!.We simply use the artist name or the term itself as query.Furthermore, we restrict results to images with dimensionsin the range of 30 to 200 pixels. To find the three mostimportant artists for each cluster, we basically perform thesame ranking method as for the terms (see sections 4.3.3and 3.4). For each important artist and every term, one ofthe first three images is chosen randomly and displayed onthe map.
4.4 Implementation RemarksThe software is written exclusively in Java. For the re-
alization of the three-dimensional landscape, we utilize theXith3D scenegraph library2, which runs on top of jogl andOpenGL. Spatialized surround sound is realized via Sound3D,joal3 , and OpenAL. To access the game controller we use theJoystick Driver for Java4. At the moment, the software runson a Windows machine. Since all required libraries are alsoavailable for Linux, it is planned to port the software soonto this platform.
Since the processing of the songs is a very resource con-suming but also very time critical task, we need a high-endPC to reduce the user’s waiting time to a minimum. Thus,we rely on a dual core state-of-the-art-machine to quicklycalculate the sound characteristics and download all webpages and images, as well as display the progress to the userwithout latencies.
5. QUALITATIVE EVALUATIONWe conducted a small user study to gain insights into the
usability of the application. Therefore, we asked 8 partici-pants to tell us their impressions after using the interface.In general, responses were very positive. People were im-pressed by the possibility to explore and listen to a musiccollection by cruising through a landscape. While the op-tion to display related images on the landscape has beenconsidered mainly as a nice gimmick, the option to displayrelated words was rated as a valuable add-on, even if someof the displayed words were confusing for some users. Thecontrolling by gamepad was intuitive for all users.
Sceptical feedback was mainly caused by music auraliza-tion in areas where different styles collide. However, in gen-eral, auralization was considered positive, especially in re-gions containing Electronic Dance Music, Rap/HipHop, orClassical Music, since it assists in quickly uncovering groupsof tracks from the same musical style. Two users suggestedto create larger landscapes to allow focused listening to cer-tain tracks in crowded regions.
2http://www.xith3d.org3https://joal.dev.java.net4http://sourceforge.net/projects/javajoystick
6. DISCUSSION AND FUTURE WORKWe have presented an innovative approach to accessing
music collections. Using our virtual reality, game-like in-terface, it is possible to explore the contents in a playfulmanner. Furthermore, we have modified existing web re-trieval approaches to enrich the generated landscape withsemantic information related to the music.
In it’s current state, the application has a focus on interac-tive exploration rather than on providing full functionalityto replace existing music players. However, we can easilyextend the application to provide such useful methods asautomatic playlist generation. To this end, we can give theuser the option to determine a start and an end song on themap. Given this information, we can then find a path alongthe distributed pieces on the map. Furthermore, we caneasily visualize such paths and provide some sort of “auto-pilot mode”, where the movement through the landscapeis done automatically by following the playlist path. Oneof the central question that arises is how to explicitly se-lect specific tracks in the landscape. At the moment, allpieces in the surrounding region are played for auditory ex-ploration, but there is no possibility to focus exclusively onone track. We are currently exploring three different op-tions. The first would be to provide a cross-hair that canbe controlled by the directional buttons of the game pad.The second option would be to reserve one (or two) buttonsto scan through all, or at least the closest tracks that arevisible. In both cases, selection of the track would need anadditional button to confirm the selection. The third optionwould display a number next to the four closest pieces andutilize the buttons 1–4 (cf. Figure 3) to directly select oneof these tracks. Before making a definitive choice, we willhave to carry out further user experiments and gain moreexperience in practical scenarios. With the ability to selectspecific tracks, we could introduce focused listening and alsopresent additional track-specific meta-data for the currentlyselected track. For example, we could display further id3tags like album or track length, as well as lyrics or albumcovers. In future work, we will also address the problem ofvisualizing very large collections. Currently, we have limitedthe number of pieces to 50 for time reasons and for reasonsof clarity. An option would be to incorporate hierarchicalextensions as proposed in [19].
Another possible extension of the application concernsforce feedback. As many game pads have built-in forcefeedback functionality, it would be an interesting option toinvolve an additional human sense, namely the tactile per-ception. First experiments regarding exploration of musiccollections based on tactile feedback have been made in [18,1]. In our case, the primary goal would not be to develop atactile description for musical pieces, but simply to deepenthe immersion in specific regions, e.g. regions that containmany pieces with very strong beats.
7. ACKNOWLEDGMENTSThis research is supported by the Austrian Fonds zur For-
derung der Wissenschaftlichen Forschung (FWF) under pro-ject number L112-N04 and by the Vienna Science and Tech-nology Fund (WWTF) under project number CI010 (Inter-faces to Music). The Austrian Research Institute for Ar-tificial Intelligence acknowledges financial support by theAustrian ministries BMBWK and BMVIT.
23
Special thanks are due to the students who implementedvital parts of the project, especially Richard Vogl, who de-signed the first interface prototype and Klaus Seyerlehner,who implemented high-level feature extractors.
8. REFERENCES[1] M. Allen, J. Gluck, K. MacLean, and E. Tang. An
initial usability assessment for symbolic hapticrendering of music parameters. In ICMI ’05: Proc. ofthe 7th international conference on Multimodalinterfaces, New York, NY, USA, 2005. ACM Press.
[2] J.-J. Aucouturier, F. Pachet, and M. Sandler. ”TheWay It Sounds”: Timbre Models for Analysis andRetrieval of Music Signals. IEEE Transactions onMultimedia, 7(6):1028–1035, December 2005.
[3] E. Brazil and M. Fernstrom. Audio informationbrowsing with the sonic browser. In Coordinated andMultiple Views In Exploratory Visualization(CMV03), London, UK, 2003.
[4] P. Cano, M. Kaltenbrunner, F. Gouyon, and E. Batlle.On the Use of Fastmap for Audio Retrieval andBrowsing. In Proc. of the International Conference onMusic Information Retrieval (ISMIR’02), Paris,France, 2002.
[5] M. Goto and T. Goto. Musicream: New MusicPlayback Interface for Streaming, Sticking, andRecalling Musical Pieces. In Proc. of the 6thInternational Conference on Music InformationRetrieval (ISMIR’05), London, UK, 2005.
[6] P. Knees, E. Pampalk, and G. Widmer. ArtistClassification with Web-based Data. In Proc. of 5thInternational Conference on Music InformationRetrieval (ISMIR’04), Barcelona, Spain, October2004.
[7] T. Kohonen. Self-Organizing Maps, volume 30 ofSpringer Series in Information Sciences. Springer,Berlin, 3rd edition, 2001.
[8] K. Lagus and S. Kaski. Keyword selection method forcharacterizing text document maps. In Proc. of 9thInternational Conference on Artificial NeuralNetworks (ICANN’99), volume 1, London, 1999.IEEE.
[9] D. Lubbers. Sonixplorer: Combining Visualization andAuralization for Content-based Exploration of MusicCollections. In Proc. of the 6th InternationalConference on Music Information Retrieval(ISMIR’05), London, UK, 2005.
[10] M. Mandel and D. Ellis. Song-Level Features andSupport Vector Machines for Music Classification. InProc. of the 6th International Conference on MusicInformation Retrieval (ISMIR’05), London, UK, 2005.
[11] F. Morchen, A. Ultsch, M. Nocker, and C. Stamm.Databionic visualization of music collections accordingto perceptual distance. In Proc. of the 6thInternational Conference on Music InformationRetrieval (ISMIR’05), London, UK, 2005.
[12] R. Neumayer, M. Dittenbach, and A. Rauber.PlaySOM and PocketSOMPlayer, AlternativeInterfaces to Large Music Collections. In Proc. of the6th International Conference on Music InformationRetrieval (ISMIR’05), London, UK, 2005.
[13] E. Pampalk. Islands of Music: Analysis, Organization,and Visualization of Music Archives. Master’s thesis,Vienna University of Technology, 2001.
[14] E. Pampalk, S. Dixon, and G. Widmer. Exploringmusic collections by browsing different views.Computer Music Journal, 28(2):49–62, 2004.
[15] E. Pampalk, A. Flexer, and G. Widmer. Hierarchicalorganization and description of music collections atthe artist level. In Proc. of the 9th EuropeanConference on Research and Advanced Technology forDigital Libraries (ECDL’05), Vienna, Austria, 2005.
[16] E. Pampalk, A. Rauber, and D. Merkl. Content-basedorganization and visualization of music archives. InProc. of the ACM Multimedia, Juan les Pins, France,December 1-6 2002. ACM.
[17] E. Pampalk, A. Rauber, and D. Merkl. Usingsmoothed data histograms for cluster visualization inself-organizing maps. In Proc. of the InternationalConference on Artifical Neural Networks (ICANN’02),Madrid, Spain, 2002.
[18] S. Pauws, D. Bouwhuis, and B. Eggen. Programmingand enjoying music with your eyes closed. In CHI ’00:Proc. of the SIGCHI conference on Human factors incomputing systems, New York, NY, USA, 2000. ACMPress.
[19] M. Schedl. An explorative, hierarchical user interfaceto structured music repositories. Master’s thesis,Vienna University of Technology, December 2003.
[20] I. Stavness, J. Gluck, L. Vilhan, and S. Fels. TheMUSICtable: A Map-Based Ubiquitous System forSocial Interaction with a Digital Music Collection. InProc. of the 4th International Conference onEntertainment Computing (ICEC 2005), Sanda,Japan, 2005.
[21] M. Torrens, P. Hertzog, and J.-L. Arcos. Visualizingand Exploring Personal Music Libraries. In Proc. of5th International Conference on Music InformationRetrieval (ISMIR’04), Barcelona, Spain, 2004.
[22] G. Tzanetakis and P. Cook. Marsyas3D: A PrototypeAudio Browser-Editor Using a Large Scale ImmersiveVisual Audio Display. In Proc. of the InternationalConference on Auditory Display, 2001.
[23] R. van Gulik, F. Vignoli, and H. van de Wetering.Mapping music in the palm of your hand, explore anddiscover your collection. In Proc. of 5th InternationalConference on Music Information Retrieval(ISMIR’04), Barcelona, Spain, 2004.
[24] B. Whitman and S. Lawrence. Inferring descriptionsand similarity for music from community metadata. InProc. of the 2002 International Computer MusicConference, Goteborg, Sweden, September 2002.
[25] J. A. Wise, J. J. Thomas, K. Pennock, D. Lantrip,M. Pottier, A. Schur, and V. Crow. Visualizing theNon-Visual: Spatial analysis and interaction withinformation from text documents. In Proc. of the 1995IEEE Symposium on Information Visualization(INFOVIS’95), Atlanta, Georgia, 1995.
[26] Y. Yang and J. O. Pedersen. A comparative study onfeature selection in text categorization. In D. H.Fisher, editor, Proc. of ICML-97, 14th InternationalConference on Machine Learning, Nashville, US, 1997.
24