3D Kinematics of Knee and Ankle During Skating - Lafontaine
17
PLEASE SCROLL DOWN FOR ARTICLE This article was downloaded by: [Canadian Research Knowledge Network] On: 21 September 2010 Access details: Access Details: [subscription number 783016864] Publisher Routledge Informa Ltd Registered in England and Wales Registered Number: 1072954 Registered office: Mortimer House, 37- 41 Mortimer Street, London W1T 3JH, UK Sports Biomechanics Publication details, including instructions for authors and subscription information: http://www.informaworld.com/smpp/title~content=t776628940 Three-dimensional kinematics of the knee and ankle joints for three consecutive push-offs during ice hockey skating starts Dany Lafontaine a a School of Human Kinetics, University of Ottawa, Ottawa, Ontario, Canada To cite this Article Lafontaine, Dany(2007) 'Three-dimensional kinematics of the knee and ankle joints for three consecutive push-offs during ice hockey skating starts', Sports Biomechanics, 6: 3, 391 — 406 To link to this Article: DOI: 10.1080/14763140701491427 URL: http://dx.doi.org/10.1080/14763140701491427 Full terms and conditions of use: http://www.informaworld.com/terms-and-conditions-of-access.pdf This article may be used for research, teaching and private study purposes. Any substantial or systematic reproduction, re-distribution, re-selling, loan or sub-licensing, systematic supply or distribution in any form to anyone is expressly forbidden. The publisher does not give any warranty express or implied or make any representation that the contents will be complete or accurate or up to date. The accuracy of any instructions, formulae and drug doses should be independently verified with primary sources. The publisher shall not be liable for any loss, actions, claims, proceedings, demand or costs or damages whatsoever or howsoever caused arising directly or indirectly in connection with or arising out of the use of this material.
-
Upload
benjamin-lee -
Category
Documents
-
view
47 -
download
2
Transcript of 3D Kinematics of Knee and Ankle During Skating - Lafontaine
PLEASE SCROLL DOWN FOR ARTICLE
This article was downloaded by: [Canadian Research Knowledge Network]On: 21 September 2010Access details: Access Details: [subscription number 783016864]Publisher RoutledgeInforma Ltd Registered in England and Wales Registered Number: 1072954 Registered office: Mortimer House, 37-41 Mortimer Street, London W1T 3JH, UK
Sports BiomechanicsPublication details, including instructions for authors and subscription information:http://www.informaworld.com/smpp/title~content=t776628940
Three-dimensional kinematics of the knee and ankle joints for threeconsecutive push-offs during ice hockey skating startsDany Lafontainea
a School of Human Kinetics, University of Ottawa, Ottawa, Ontario, Canada
To cite this Article Lafontaine, Dany(2007) 'Three-dimensional kinematics of the knee and ankle joints for threeconsecutive push-offs during ice hockey skating starts', Sports Biomechanics, 6: 3, 391 — 406To link to this Article: DOI: 10.1080/14763140701491427URL: http://dx.doi.org/10.1080/14763140701491427
Full terms and conditions of use: http://www.informaworld.com/terms-and-conditions-of-access.pdf
This article may be used for research, teaching and private study purposes. Any substantial orsystematic reproduction, re-distribution, re-selling, loan or sub-licensing, systematic supply ordistribution in any form to anyone is expressly forbidden.
The publisher does not give any warranty express or implied or make any representation that the contentswill be complete or accurate or up to date. The accuracy of any instructions, formulae and drug dosesshould be independently verified with primary sources. The publisher shall not be liable for any loss,actions, claims, proceedings, demand or costs or damages whatsoever or howsoever caused arising directlyor indirectly in connection with or arising out of the use of this material.
Three-dimensional kinematics of the knee and anklejoints for three consecutive push-offs during ice hockeyskating starts
DANY LAFONTAINE
School of Human Kinetics, University of Ottawa, Ottawa, Ontario, Canada
AbstractLittle biomechanical research has been conducted recently on hockey skating despite the sport’sworldwide appeal. One reason for this lack of biomechanical knowledge stems from the difficulty ofcollecting data. The lack of accuracy, the disputable realism of treadmills, and the large field of viewrequired are some of the technical challenges that have to be overcome. The main objective of thecurrent study was to improve our knowledge of the joint kinematics during the skating stroke. A secondobjective was to improve the data collection system we developed and the third was to establish if akinematic progression exists in the hockey skating stroke similar to that in speed skating. Relativemotions at the knee and ankle joints were computed using a joint coordinate system approach.The differences at the knee joints in push-offs indicated that the skating skill was progressively changingwith each push-off. The relative stability of the ankle angles can be attributed to the design of the skateboots, which have recently become very rigid. Further research on ice hockey skating is warranted andshould include more skaters and investigate the effect various starting strategies and variations inequipment have on skaters’ performance.
Keywords: Comparison, hockey, kinematics, spatial, stride
Introduction
Although hockey is prospering around the world (Bidini, 2001), little is known about the
mechanics of its most important skill – skating (Percival, 1992). There is, however, much
literature on the mechanics of speed skating. One group (de Koning, Thomas, Berger, de
Groot, and van Ingen Schenau, 1995) has identified an evolution from a motion similar to
running towards a gliding motion in the skating stride over distance and time during
acceleration. Of even more interest to the biomechanics community, the same research
group has revolutionized the sport of speed skating thanks to biomechanics-based
improvements in skates (de Koning, Houdijk, de Groot, and Bobbert, 2000). In their article,
de Koning and colleagues report on the improvements they observed in the performance of
speed skaters using the “klapskate” that they developed. This hinged skate blade holder
allows for powerful plantar flexion, which in turn helps increase the skater’s impulse through
a longer skating stroke.
Previous research on ice hockey skating is somewhat outdated and limited in scope. To our
knowledge, the joint kinematics of ice hockey skating have not been the subject of many
ISSN 1476-3141 print/ISSN 1752-6116 online q 2007 Taylor & Francis
DOI: 10.1080/14763140701491427
Correspondence: D. Lafontaine, School of Human Kinetics, University of Ottawa, 125 University Private, Room 337, Ottawa,
ONT K1N 6N5, Canada. Email: [email protected]
Sports Biomechanics
September 2007; 6(3): 391–406
Downloaded By: [Canadian Research Knowledge Network] At: 16:36 21 September 2010
publications. In his pioneering work, Marcotte (1974) described the blade angle orientation
relative to the direction of travel. He showed that as the number of strides increases, the angle
of the blade relative to the direction of travel decreases, while the length of the glide increases.
Other researchers in this field (Greer, 1984; Humble and Gastwirth, 1988; Marino, 1977,
1979, 1984) have focused their efforts on the acceleration phase of skating (the starts), but
mainly provide gross descriptions of the motions or identify factors that affect performance.
Some research has tried to identify the most efficient starting technique for reaching a high
velocity (Naud and Holt, 1979). More recent research on ice hockey has focused mainly on
the injuries often associated with the sport, with special attention given to head injuries
(Bailes and Cantu, 2001; Naunheim, Standeven, Richter, and Lewis, 2000). Other topics
related to hockey skating that have been the subject of recent work include: how mouth
guards affect skaters’ breathing (Montgomery, Stefik, Delaney, Pearsall, and Turcotte,
2004); the validity of skating treadmills in evaluating skating mechanics (Nobes et al., 2003;
Turcotte et al., 2004); and the mechanical means of testing the properties of skate boots
(Turcotte, Pearsall, and Montgomery, 2001). Of more interest to the current study, Pearsall
and colleagues (2001) described foot and ankle kinematics during on-ice skating using
biaxial electrogoniometers inserted in the skates. The similarities between that study and the
current one are quite limited from an instrumentation standpoint and when comparing the
tasks that were investigated. Whereas Pearsall et al. (2001) looked at steady-state skating
focusing on the kinematics of the ankle complex, we attempt here to fill partially the void in
the literature on the three-dimensional kinematics of the knee and ankle joints during ice
hockey skating, for the period of skate–ice contact. The recovery phase of the skating stroke
will not be analysed in the current study.
The distance that skaters can cover from stride to stride required the use of a large field of
view. This reduced the accuracy of the joint kinematics calculated for skating, thus creating
one of the study’s main limitations. Alternative approaches to conventional biomechanical
data collection methods were identified by Lafontaine and Lamontagne (2003), yet these
alternatives seemed inappropriate for studying skating kinematics. Therefore, the first part of
Lafontaine and Lamontagne’s (2003) paper presented a valid alternative to established data
collection methods for spatial kinematics of activities covering large distances. The current
paper will focus on the experimental data obtained during on-ice testing of hockey players
performing starts from a stationary position using the moving camera cart approach (see
Appendix). Although it was demonstrated that starts were not an integral part of actual
hockey competition (Lafontaine, 2005), the skill was nonetheless chosen to allow for a
comparison with the findings of previous research on ice hockey skating. While forward starts
were not often observed during competition, they are related to the most prevalent skating
skill: skating forward. Another factor in selecting this skill for analysis was our interest in
investigating an “evolution” in the skating stride similar to the evolution observed in speed
skating (de Koning et al., 1995). Another justification for choosing the forward start skill is
that instructional literature on ice hockey (Percival, 1992) states that it is through better
acceleration that players gain an edge over opponents when they chase the puck.
The objectives of the on-ice testing were three-fold. The main objective was to describe
and compare the spatial kinematics of the right knee joint and ankle joint from the initial
right foot push-off to the third right foot push-off. The second objective of the study was to
refine and demonstrate the usefulness of the data acquisition method. The third objective
was to determine if a kinematic evolution similar to that observed in speed skating
(de Koning et al., 1995) exists in ice hockey skating. We hoped to provide more information
on the mechanics of on-ice hockey skating, which could lead to modifications of training
protocols and even adaptations to skates to improve the efficiency of the skating motion.
D. Lafontaine392
Downloaded By: [Canadian Research Knowledge Network] At: 16:36 21 September 2010

Methods
Definitions of technical terms
. Joint coordinate system: Bone imbedded reference frame defined by external markers and
used to express the motion of adjacent segments relative to each other.
. Anatomical calibration: Defining axes of motion using surface markers, as well as
establishing the neutral (zero) positions for the joints.
. Reference frames: Axis system used to track the motion of a body, which can be either
global (or laboratory-based) or local (or segment-based).
. Time normalization: Expressing the duration of an event as 100%, to remove the “real-
time” bias between events of differing durations.
. Low-pass filtering: Data-processing procedure that removes frequency content below the
determined threshold from the signal.
The equipment [high-speed video cameras (JC Labs, HSC-250 £ 2, Mountain View, CA,
USA) and video cassette recorders (JC Labs HSR 200, Mountain View, CA, USA)] and
procedures [moving camera cart on guide rails and movement analysis system (Ariel
Performance Analysis System, APAS)] used for data collection in this study were identical to
those used during the validation of the method (Lafontaine and Lamontagne, 2003). A slight
modification was made to the guide rails after preliminary tests revealed they were not
adequate for on-ice testing. During the on-ice sessions, a single guide rail made of a half
polyvinyl chloride (PVC) pipe was screwed into the ice surface. Both of the camera cart’s left
wheels rolled in the half-pipe while a research assistant skated to push the cart along the ice
while matching the skater’s speed. Since the purpose of the current study was to determine
the joint kinematics through the relative motion of coordinate systems embedded in
adjoining segments, it was not deemed necessary to monitor the cart’s speed.
Seven adult male hockey players provided written informed consent to participate in the
study, which was approved by the University of Ottawa Research Ethics Committee.
Foot inversion (–)Foot eversion (+)
Tibial internal rotation (–)Tibial external rotation (+)
Foot abduction (–)Foot adduction (+)
Tibial abduction (+) Tibial adduction (–)
1
26
4 5
78
9
10 11
1213
14
1516
17
3
(a) (b)
Figure 1. (a) Schematic representation of the location of surface markers and local reference frames. Note: Markers
4, 5, 6, 10, 11, 12, 13, and 17 were only used during anatomical calibration trials. (b) Schematic representation of
selected joint angles. Arrows indicate direction of segment rotation for each angle.
3D kinematics of hockey skating 393
Downloaded By: [Canadian Research Knowledge Network] At: 16:36 21 September 2010
All skaters wore size 9 (US) skates (Graf Skate; Model Supra 703, Calgary, Canada) to
facilitate data collection and limit variations in joint movement that different skate designs
would produce. Skaters also wore a tight-fitting black garment to enhance marker contrast.
All test sessions were conducted at the University of Ottawa arena within a 6-week period.
Reflective markers were attached to the garment over palpable anatomical landmarks to
allow equivalent placement of markers between skaters. Skate markers were permanently
glued to the skate boot. To limit inter-tester variability, the same person applied the markers
to the skaters for each test session. A total of nine markers remained attached to the skaters
during data collection (three per segment: thigh, leg, and skate boot) with eight additional
markers (Figure 1a) being attached before data collection to allow for the joint coordinate
systems to be established (Grood and Suntay, 1983). With the joint coordinate systems, joint
motions are calculated from the relative displacements of anatomically fixed reference
frames (femoral, tibial, and foot) defined during the anatomical calibration sequence.
The anatomical calibration sequence required that skaters stand still with arms crossed over
their chests. This also served to define the neutral positions of the knee and ankle joints.
The motions of the local reference frames were tracked using the segment markers. Two
additional cameras (Panasonic model AG-188 U, Secaucus, NJ, USA) were used to define
the joint coordinate systems because all of the anatomical calibration markers were not
visible using only the cartmounted cameras. The extra cameras were calibrated using the
same calibration cube frame as for the high-speed cameras.
The joint motions were computed and filtered (low-pass digital filter, 10 Hz cut-off) from
digitized data obtained with the APAS system, using in-house analysis software (Jointdyna*).
The complete procedure and the validity of the computations performed by the software are
the subject of other publications (Lafontaine, 2005; Lafontaine, Benoit, Xu, and
Lamontagne, 2003). The validation tests of this data collection and computation system
revealed an average error of less than 38 for angular values. The entire blade–ice contact
period for the right foot was analysed for each right foot push-off and the time base normalized
to 100% of contact time for all trials. The duration of ice contact was determined by using the
video recordings from camera 1 to identify the initiation and end of blade–ice contact.
Definition of variables selected for analysis
According to the knee axes defined with the joint coordinate systems, the motions were
expressed as follows (Figure 1b): Motion of the tibial reference system about the distal
medio-lateral femoral fixed axis represented flexion (þ) and extension (2). Motion of the
tibial reference frame about the floating knee axis represented tibial abduction (þ) and
adduction (2). Motions of the tibial reference frame about its longitudinal axis were
expressed as external (þ) and internal (–) rotation. The motions of the ankle joint were
defined as follows: Motion of the foot reference frame relative to the tibial medio-lateral
axis was defined as dorsi (2) and plantar (þ) flexion. Motion of the foot reference frame
about the tibial longitudinal axis was defined as foot abduction (–) and adduction (þ).
Motion about the ankle reference frames’ floating axis constituted inversion (–) and
eversion (þ).
During data collection, each skater performed 10–15 full-out starts (forward
accelerations) and was told to initiate motion by pushing off with the right foot regardless
of leg dominance. From the video recordings, three trials made up of three consecutive
strides (two consecutive push-offs compose a stride) were selected for each skater. Push-off
1 was the first motion recorded when skaters initiated movement from a standstill. Push-off
2 was the right step of the second stride, while push-off 3 was the right step of the third stride.
D. Lafontaine394
Downloaded By: [Canadian Research Knowledge Network] At: 16:36 21 September 2010
We omitted trials in which markers went beyond the field of view of one or both cameras at
some point during the recording. Trials were also discarded if the skater skated out of the
field of view either due to his or the camera cart’s acceleration.
Data for all skaters and all trials were pooled to establish the mean skating kinematics for
each push-off. The data consisted of the three angles defined earlier for the knee and ankle
for each push-off. More specifically, the ranges of motion, angles at initiation of ice contact
and end of ice contact, as well as the maximal and minimal angles – at either the knee or
ankle – obtained for each motion were computed. These variables are defined in more detail
in Table I.
Results
The results are presented as the mean values obtained for all skaters who performed the
standard forward start as instructed. It should be noted that experimental difficulties
rendered only one trial by skater 4 available for analysis. This skater was therefore removed
from the process. Similarly, only the first and second pushoff data sets by skaters 3 and 5 were
adequate for analysis, with only two push-off 3 trials included in the analysis of these skaters.
Data from skaters 2 and 6 were eliminated from the analysis since it was revealed during
video analysis that they did not adhere in full to the experimental protocol.
Knee flexion
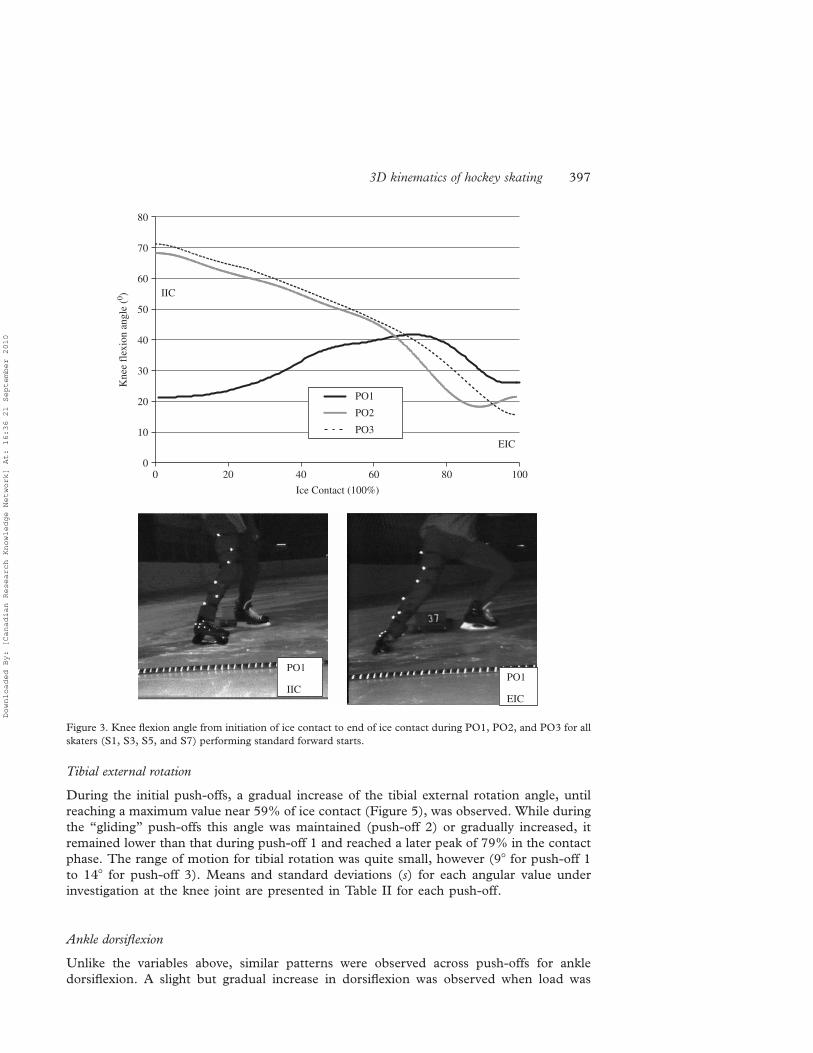
Skaters 1, 3, 5, and 7 (S1, S3, S5, and S7) used a similar strategy of gradually increasing knee
flexion during the first 70% of the push-off followed by an extension during the last 30% of the
task (Figure 2). All skaters kept their knees slightly flexed (,20–308) until end of ice contact.
All skaters initiated ice contact for push-off 2 (PO2) and push-off 3 (PO3) on a flexed knee
and gradually extended it over the duration of ice contact. This strategy was in sharp contrast
to what was observed during push-off 1 (PO1), as shown in Figure 3.
The strategies used during the second and third push-offs were similar for all available
skaters (S1, S2, S6, and S7), the ranges of motion increasing with successive push-offs. Knee
flexion range of motion differed by about 128 between push-off 1 and push-off 2, and 108
between push-off 2 and push-off 3. As was expected, higher skating velocities were attained
when skaters used higher ranges of motion. This was demonstrated by the differences
between initial push-off and subsequent push-offs.
The maximal and minimal values of knee flexion obtained by each skater varied according
to the push-off. During push-off 1, the mean maximum knee flexion angle range was 41.78,
while the mean maxima for push-off 2 and push-off 3 were over 608 of flexion. The minima
during push-off 1 were about 208, similar to push-off 3. During push-off 2, the mean
minimum value was about 278.
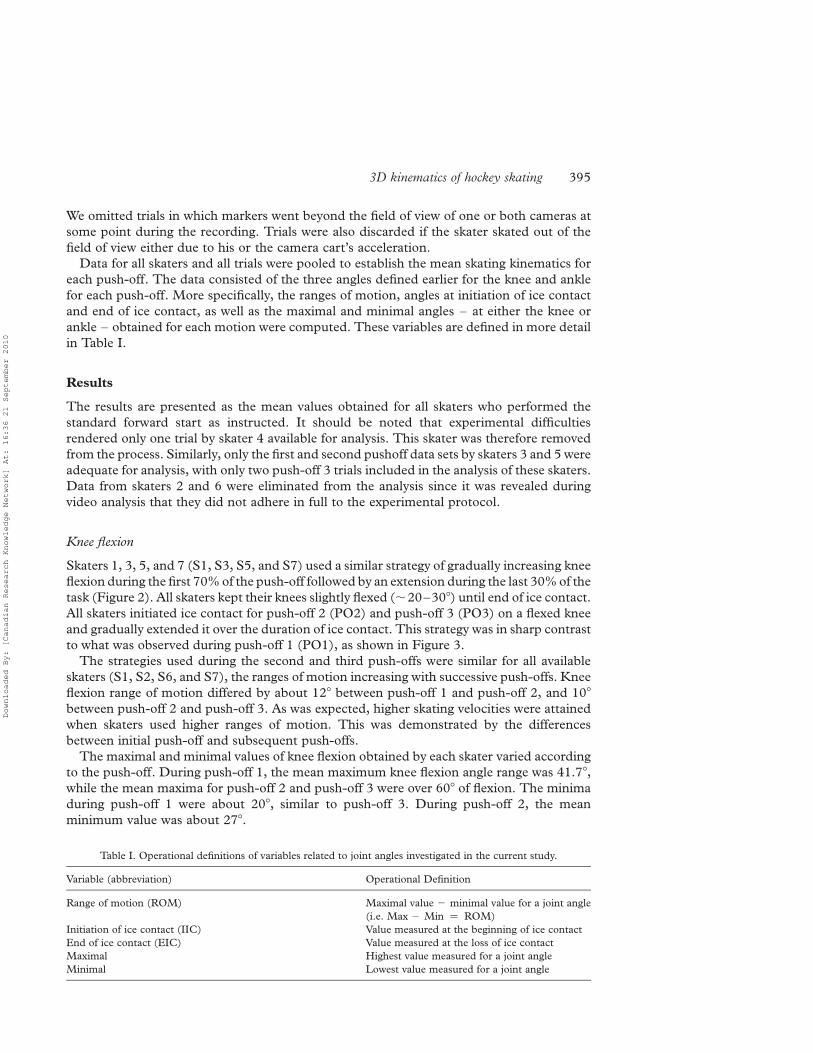
Table I. Operational definitions of variables related to joint angles investigated in the current study.
Variable (abbreviation) Operational Definition
Range of motion (ROM) Maximal value 2 minimal value for a joint angle
(i.e. Max 2 Min ¼ ROM)
Initiation of ice contact (IIC) Value measured at the beginning of ice contact
End of ice contact (EIC) Value measured at the loss of ice contact
Maximal Highest value measured for a joint angle
Minimal Lowest value measured for a joint angle
3D kinematics of hockey skating 395
Downloaded By: [Canadian Research Knowledge Network] At: 16:36 21 September 2010

Initiation of ice contact and end of ice contact values for knee flexion varied between tasks,
ranging from 218 for push-off 1 to 638 for push-off 3. End of ice contact values for knee
flexion correspond to the joint attitude in the sagittal plane at the point where skaters took
their right foot off the ice at the end of the push-off. The mean values for this variable were
similar for push-off 1 and push-off 2, while push-off 3 showed slightly lower values at 218.
Since consecutive push-offs were recorded in continuous video sequences, initiation of ice
contact foot position was not standardized between push-offs except for push-off 1.
Sequences were time normalized from initiation of ice contact to end of ice contact as
determined from the video files.
Tibial abduction
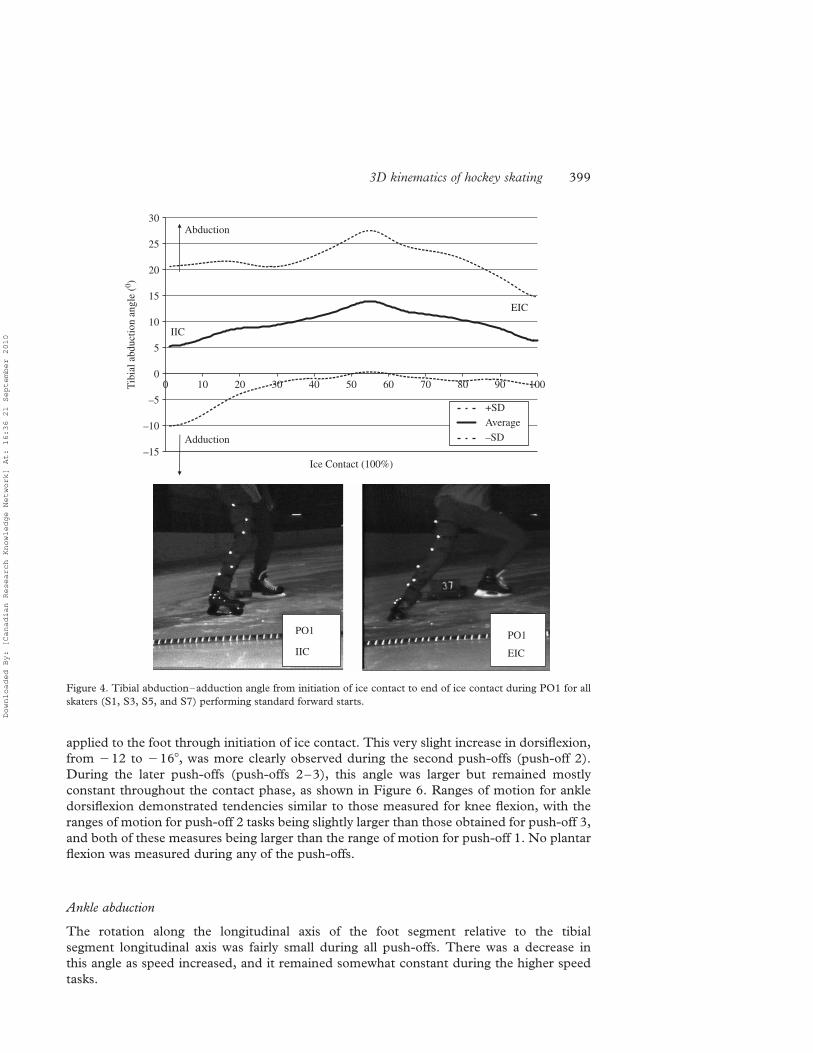
Tibial abduction varied between tasks. No clear tendency was observed between tasks for
this motion. The range of motion for all push-offs remained relatively low, except during
push-off 2 with a range of motion of 248 (Table II). Tibial abduction versus time curves
illustrate that the skaters increased tibial abduction from beginning of ice contact as they
progressed towards take-off (Figure 4).
0
10
20
30
40
50
60
0 10 20 30 40 50 60 70 80 90 100
Ice Contact (100%)
Kne
e Fl
exio
n A
ngle
(0 )
+SDAverage–SD
EIC
Extension
Flexion
IIC
PO1
IIC
PO1
EIC
Figure 2. Knee flexion angle from initiation of ice contact to end of ice contact during push-off 1 (PO1) for all skaters
(S1, S3, S5, and S7) performing standard forward starts.
D. Lafontaine396
Downloaded By: [Canadian Research Knowledge Network] At: 16:36 21 September 2010
Tibial external rotation
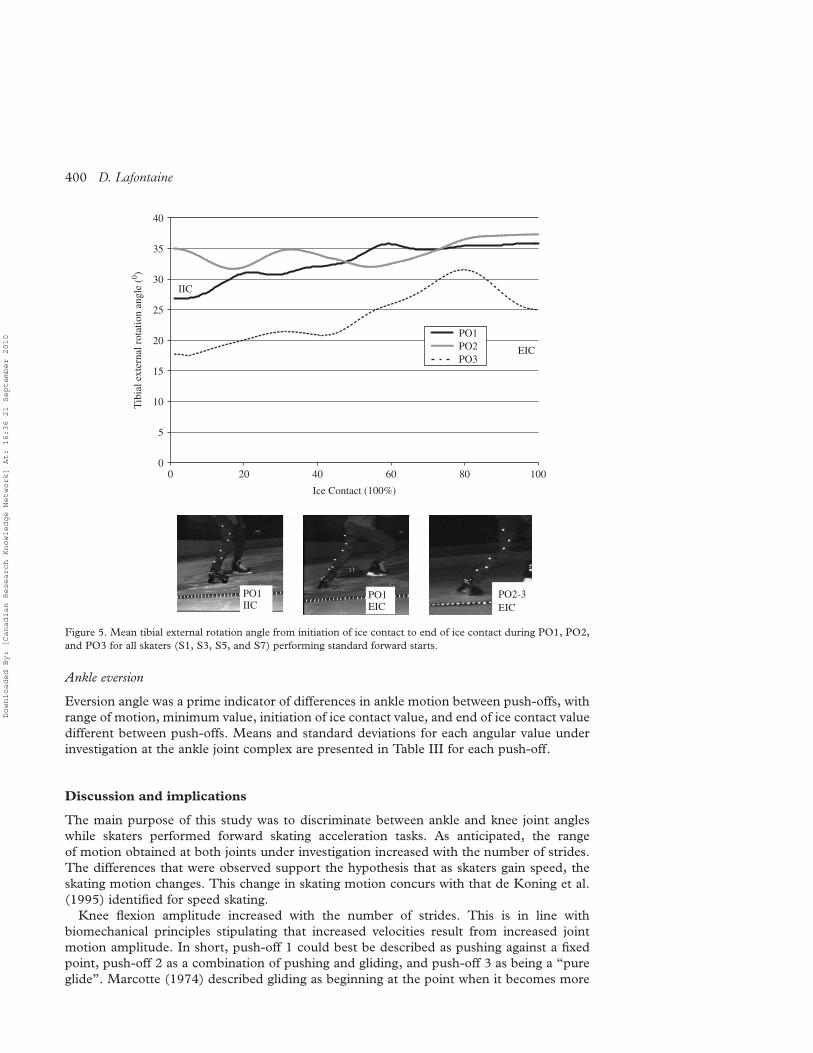
During the initial push-offs, a gradual increase of the tibial external rotation angle, until
reaching a maximum value near 59% of ice contact (Figure 5), was observed. While during
the “gliding” push-offs this angle was maintained (push-off 2) or gradually increased, it
remained lower than that during push-off 1 and reached a later peak of 79% in the contact
phase. The range of motion for tibial rotation was quite small, however (98 for push-off 1
to 148 for push-off 3). Means and standard deviations (s) for each angular value under
investigation at the knee joint are presented in Table II for each push-off.
Ankle dorsiflexion
Unlike the variables above, similar patterns were observed across push-offs for ankle
dorsiflexion. A slight but gradual increase in dorsiflexion was observed when load was
0
10
20
30
40
50
60
70
80
0 20 40 60 80 100
Ice Contact (100%)
Kne
e fl
exio
n an
gle
(0 )
PO1
PO2
PO3
IIC
EIC
PO1
IICPO1
EIC
Figure 3. Knee flexion angle from initiation of ice contact to end of ice contact during PO1, PO2, and PO3 for all
skaters (S1, S3, S5, and S7) performing standard forward starts.
3D kinematics of hockey skating 397
Downloaded By: [Canadian Research Knowledge Network] At: 16:36 21 September 2010

Table II. Summary of mean (s) angular values for the knee joint for all skaters performing standard forward starts (S1, S3, S5, and S7) for each push-off.
Knee flexion (8) Tibial abduction (8) Tibial rotation (8)
PO1 PO2 PO3 PO1 PO2 PO3 PO1 PO2 PO3
IIC 21.2 (11.9) 68.3 (18.4) 71.3 (15.8) 5.3 (15.4) 22.7 (8.5) 14.4 (10.5) 26.8 (13.8) 32.4 (14.8) 17.7 (15.0)
EIC 26.2 (5.5) 21.5 (19.6) 15.6 (35.6) 6.3 (8.5) 4.8 (9.2) 7.8 (8.9) 35.9 (8.5) 35.0 (16.8) 25.0 (23.3)
Minimum 21.2 (13.0) 18.2 (8.5) 15.6 (14.9) 5.3 (11.3) 4.8 (8.2) 7.8 (7.2) 26.8 (13.4) 27.1 (17.2) 17.5 (13.7)
Maximum 41.7 (9.6) 68.3 (18.4) 71.3 (26.3) 13.9 (13.4) 22.8 (14.4) 24.3 (10.9) 35.9 (22.1) 37.0 (16.14) 31.5 (20.3)
ROM 20.5 (5.3) 50.1 (13.3) 55.6 (14.1) 8.6 (7.0) 18.1 (7.72) 16.5 (6.3) 9.1 (8.6) 9.9 (1.3) 14.1 (6.7)
D.Lafon
taine
398
Downloaded By: [Canadian Research Knowledge Network] At: 16:36 21 September 2010
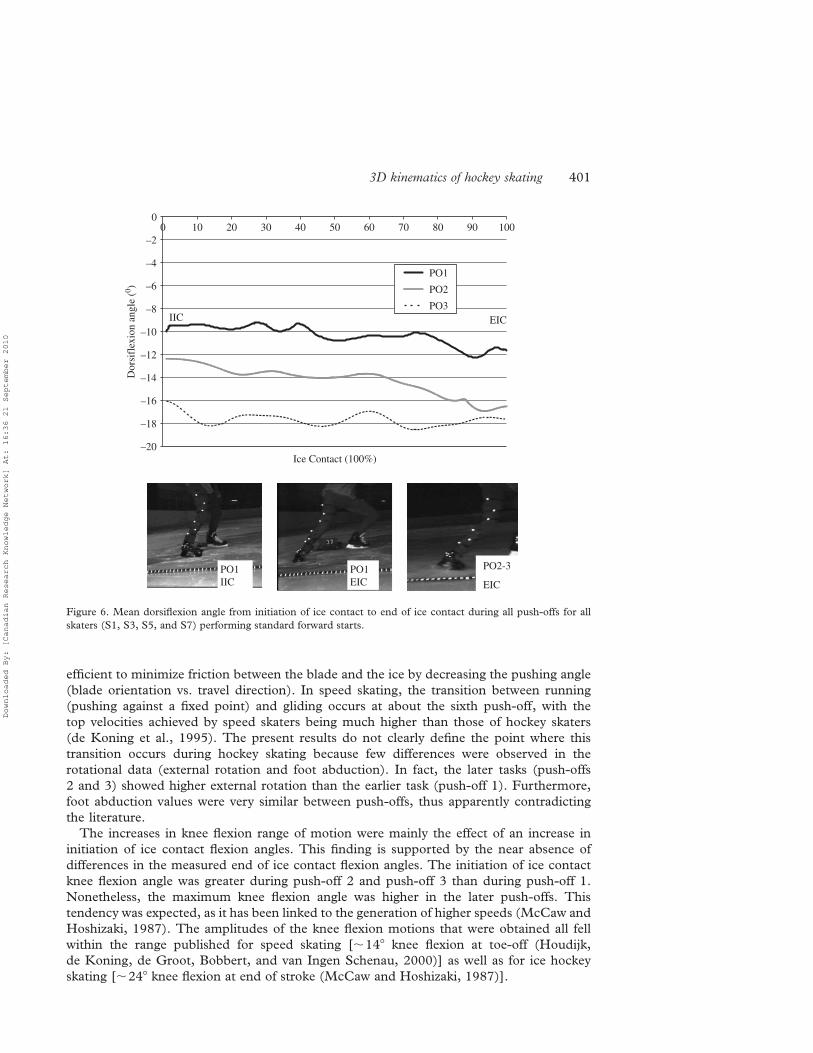
applied to the foot through initiation of ice contact. This very slight increase in dorsiflexion,
from 212 to 2168, was more clearly observed during the second push-offs (push-off 2).
During the later push-offs (push-offs 2–3), this angle was larger but remained mostly
constant throughout the contact phase, as shown in Figure 6. Ranges of motion for ankle
dorsiflexion demonstrated tendencies similar to those measured for knee flexion, with the
ranges of motion for push-off 2 tasks being slightly larger than those obtained for push-off 3,
and both of these measures being larger than the range of motion for push-off 1. No plantar
flexion was measured during any of the push-offs.
Ankle abduction
The rotation along the longitudinal axis of the foot segment relative to the tibial
segment longitudinal axis was fairly small during all push-offs. There was a decrease in
this angle as speed increased, and it remained somewhat constant during the higher speed
tasks.
–15
–10
–5
0
5
10
15
20
25
30
0 10 20 30 40 50 60 70 80 90 100
Ice Contact (100%)
Tib
ial a
bduc
tion
angl
e (0 )
+SD
Average
–SD
Abduction
Adduction
IIC
EIC
PO1
IIC
PO1
EIC
Figure 4. Tibial abduction–adduction angle from initiation of ice contact to end of ice contact during PO1 for all
skaters (S1, S3, S5, and S7) performing standard forward starts.
3D kinematics of hockey skating 399
Downloaded By: [Canadian Research Knowledge Network] At: 16:36 21 September 2010
Ankle eversion
Eversion angle was a prime indicator of differences in ankle motion between push-offs, with
range of motion, minimum value, initiation of ice contact value, and end of ice contact value
different between push-offs. Means and standard deviations for each angular value under
investigation at the ankle joint complex are presented in Table III for each push-off.
Discussion and implications
The main purpose of this study was to discriminate between ankle and knee joint angles
while skaters performed forward skating acceleration tasks. As anticipated, the range
of motion obtained at both joints under investigation increased with the number of strides.
The differences that were observed support the hypothesis that as skaters gain speed, the
skating motion changes. This change in skating motion concurs with that de Koning et al.
(1995) identified for speed skating.
Knee flexion amplitude increased with the number of strides. This is in line with
biomechanical principles stipulating that increased velocities result from increased joint
motion amplitude. In short, push-off 1 could best be described as pushing against a fixed
point, push-off 2 as a combination of pushing and gliding, and push-off 3 as being a “pure
glide”. Marcotte (1974) described gliding as beginning at the point when it becomes more
0
5
10
15
20
25
30
35
40
0 20 40 60 80 100
Ice Contact (100%)
Tib
ial e
xter
nal r
otat
ion
angl
e (0 )
PO1PO2PO3
IIC
EIC
PO1IIC
PO1EIC
PO2-3EIC
Figure 5. Mean tibial external rotation angle from initiation of ice contact to end of ice contact during PO1, PO2,
and PO3 for all skaters (S1, S3, S5, and S7) performing standard forward starts.
D. Lafontaine400
Downloaded By: [Canadian Research Knowledge Network] At: 16:36 21 September 2010
efficient to minimize friction between the blade and the ice by decreasing the pushing angle
(blade orientation vs. travel direction). In speed skating, the transition between running
(pushing against a fixed point) and gliding occurs at about the sixth push-off, with the
top velocities achieved by speed skaters being much higher than those of hockey skaters
(de Koning et al., 1995). The present results do not clearly define the point where this
transition occurs during hockey skating because few differences were observed in the
rotational data (external rotation and foot abduction). In fact, the later tasks (push-offs
2 and 3) showed higher external rotation than the earlier task (push-off 1). Furthermore,
foot abduction values were very similar between push-offs, thus apparently contradicting
the literature.
The increases in knee flexion range of motion were mainly the effect of an increase in
initiation of ice contact flexion angles. This finding is supported by the near absence of
differences in the measured end of ice contact flexion angles. The initiation of ice contact
knee flexion angle was greater during push-off 2 and push-off 3 than during push-off 1.
Nonetheless, the maximum knee flexion angle was higher in the later push-offs. This
tendency was expected, as it has been linked to the generation of higher speeds (McCaw and
Hoshizaki, 1987). The amplitudes of the knee flexion motions that were obtained all fell
within the range published for speed skating [,148 knee flexion at toe-off (Houdijk,
de Koning, de Groot, Bobbert, and van Ingen Schenau, 2000)] as well as for ice hockey
skating [,248 knee flexion at end of stroke (McCaw and Hoshizaki, 1987)].
PO1IIC
PO1EIC
PO2-3
EIC
–20
–18
–16
–14
–12
–10
–8
–6
–4
–2
00 10 20 30 40 50 60 70 80 90 100
Ice Contact (100%)
Dor
sifl
exio
n an
gle
(0 )
PO1
PO2
PO3IIC EIC
Figure 6. Mean dorsiflexion angle from initiation of ice contact to end of ice contact during all push-offs for all
skaters (S1, S3, S5, and S7) performing standard forward starts.
3D kinematics of hockey skating 401
Downloaded By: [Canadian Research Knowledge Network] At: 16:36 21 September 2010
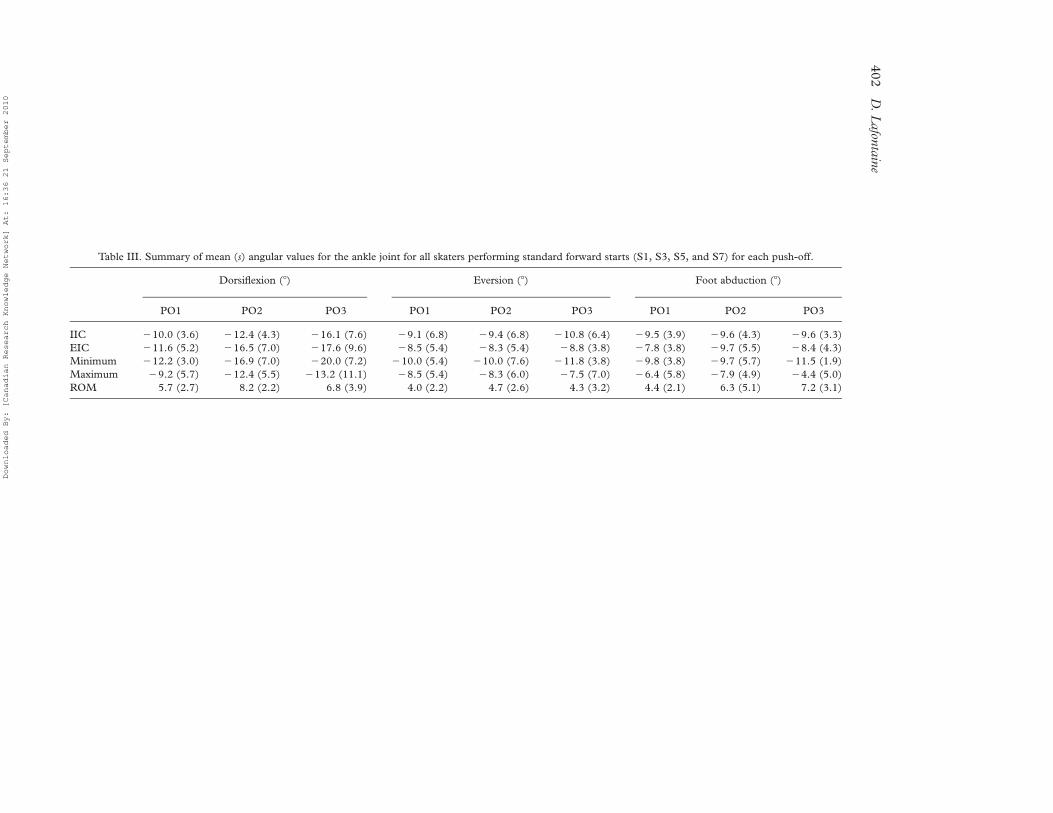
Table III. Summary of mean (s) angular values for the ankle joint for all skaters performing standard forward starts (S1, S3, S5, and S7) for each push-off.
Dorsiflexion (8) Eversion (8) Foot abduction (8)
PO1 PO2 PO3 PO1 PO2 PO3 PO1 PO2 PO3
IIC 210.0 (3.6) 212.4 (4.3) 216.1 (7.6) 29.1 (6.8) 29.4 (6.8) 210.8 (6.4) 29.5 (3.9) 29.6 (4.3) 29.6 (3.3)
EIC 211.6 (5.2) 216.5 (7.0) 217.6 (9.6) 28.5 (5.4) 28.3 (5.4) 28.8 (3.8) 27.8 (3.8) 29.7 (5.5) 28.4 (4.3)
Minimum 212.2 (3.0) 216.9 (7.0) 220.0 (7.2) 210.0 (5.4) 210.0 (7.6) 211.8 (3.8) 29.8 (3.8) 29.7 (5.7) 211.5 (1.9)
Maximum 29.2 (5.7) 212.4 (5.5) 213.2 (11.1) 28.5 (5.4) 28.3 (6.0) 27.5 (7.0) 26.4 (5.8) 27.9 (4.9) 24.4 (5.0)
ROM 5.7 (2.7) 8.2 (2.2) 6.8 (3.9) 4.0 (2.2) 4.7 (2.6) 4.3 (3.2) 4.4 (2.1) 6.3 (5.1) 7.2 (3.1)
D.Lafon
taine
402
Downloaded By: [Canadian Research Knowledge Network] At: 16:36 21 September 2010
Caution must be taken when interpreting the external rotation values, mainly for push-off
2. These values were higher at initiation of ice contact for push-off 2 than for the other
push-offs. Further analysis of the data revealed that these physiologically unlikely tibial
rotations were due to skater 3 producing external rotations that were 11.88 larger at initiation
of ice contact than the nearest skater (S1) and a range of motion that was double the mean
value across all skaters. While it is possible that skater 3 can generate such high external
rotations at the knee joint, it is more probable that an experimental error, likely kinematic
crosstalk (Zatsiorsky, 1998), resulted in very large angles being computed. Similar problems
are thought to have occurred for tibial abduction computations, as this value was also clearly
much larger than physiologically possible during push-off 2.
All the skaters included in the current study clearly picked their left foot up from the
ice surface when initiating motion with their right foot. Skaters 2 and 6 exhibited a
different means to initiate motion, although they did respect the experimental instruction
to start the motion with their right foot. Upon qualitative review of the video files, we
determined that these two skaters performed a “T-push”, similar to the “thrust and glide”
Naud and Holt (1979) described. Other skaters’ starts were classified as standard forward
starts.
Ankle motions were more consistent throughout the tasks, as fewer differences were found
between the various ankle motions. This consistency was anticipated, however, since the
anatomical range of motion of the ankle joint is much less than that of the knee joint. This
consistency could be further explained by the fact that all skaters wore the same model of
skates, which should control ankle motions. In fact, these skates kept skaters’ ankles in
dorsiflexion throughout the tasks. Across push-offs, eversion was the ankle angle that
changed the most. This motion can be linked to the blades’ “angle of attack” on the ice.
The results suggest that as speed increases, eversion also increases, thus allowing skaters to
apply force to the ice in a more tangential direction on the ice surface. These more tangential
forces help them achieve higher velocities.
The results obtained for the ankle joint in the current study were similar to those reported
by Pearsall et al. (2001). It must be noted that contrary to running studies, skate boot-
mounted markers do not lead to an overestimation of ankle motions. In fact, they have been
demonstrated (Al Hadi, 2001) to underestimate ankle joint motions. Due to the complexities
of piercing holes in skate boots to expose the skin and how these holes could modify the
skates’ material properties, boot-mounted markers can be used to assess motion of the ankle
joint complex during skating.
According to the results presented here, knee flexion angles are the angles most affected by
increasing skating velocity, as different joint attitudes were measured for successive push-
offs. Conversely, the angles that were least affected by the increase in speed are the angles
measured when the foot leaves the ice.
From a more practical standpoint, it would appear that hockey skaters would gain from
training programmes involving motions of large amplitude. More specifically, multiple-stride
plyometric-style training involving progressively deeper knee flexions should be encouraged.
Since acceleration has been identified in the instructional literature as a key component of
hockey performance, this skill should also be favoured in any on-ice or off-ice training
programme for hockey players. This could be achieved by performing explosive motions
of short duration and large amplitude. On-ice drills emphasizing these movement
characteristics should also be encouraged by coaches.
In summary, motions of large amplitude should be emphasized when designing training
programmes for hockey players. Although the hip joint was not studied in the current paper,
it is evident that the powerful hip extensors must also be targeted when training hockey
3D kinematics of hockey skating 403
Downloaded By: [Canadian Research Knowledge Network] At: 16:36 21 September 2010

players. Deep squats, full-range knee extensions, and full-range leg presses are exercises that
need to be incorporated into a hockey training programme, since these exercises mobilize the
lower extremities through a range of motion similar to that for hockey skating.
Conclusions
The main objective of this study was to investigate the spatial joint kinematics during
consecutive push-offs in ice hockey skating. This goal was accomplished. A second objective
was to apply an innovative method for kinematic data collection to the analysis of a task that
covered a large distance. This goal, too, was attained. The third objective of this study was
to determine if there was an evolution similar to that found in the literature on speed skating.
Our results appear to show that this is the case.
Further research on this topic is needed, however, since only a small sample of skaters was
tested and not all data were available for analysis. The small sample size, while preventing the
use of inferential statistics, does not diminish the importance of these findings, since the
information provided has not been presented elsewhere. As is always the case with studies
comprising few skaters, these results cannot be generalized to the average skater, but they at
least provide a stepping-stone for future studies of this nature.
In the future, it is important to add the hip joint to the analysis of the task since large
muscles are active at this joint. Different skate models should also be tested to determine if
and how they affect the skating motion. A skate design where plantar flexion is not inhibited,
as is the case with speed skating klapskates, could lead to improvements in skating speed.
However, modifications to skates to allow increased plantar flexion would need to continue
to provide the protection currently afforded by hockey skates to the Achilles tendon. The stiff
lateral supports hockey players require to turn and stop with agility should also be
maintained in any prototype that is developed.
Refinements to the tracking system need to be implemented to limit the probability of the
loss of data we experienced with skater 4, who repeatedly slipped out of one of the cameras’
field of view. The same phenomenon was responsible for how few push-off 3 trials were
available for analysis for skaters 3 and 5. Finally, a means to limit the effects of kinematic
crosstalk, thought to have produced large angular values for some skaters, needs to be
implemented in the experimental protocol.
Acknowledgements
The author would like to thank the following individuals for their assistance:
M. Lamontagne, D. Theoret, M. Kendall, M. Al Hadi, P. Stothart, N. Champagne and
his crew at the University of Ottawa Arena, and NSERC for its partial funding of this study.
References
Al Hadi, M. (2001). Motion of the foot inside a hockey skate: As measured from bone, skin and skate markers, Unpublished
master’s thesis, University of Ottawa.
Bailes, J. E., and Cantu, R. C. (2001). Head injury in athletes. Neurosurgery, 48, 26–45.
Bidini, D. (2001). Tropic of hockey – My search for the game in unlikely places. Toronto: McClelland & Stewart.
de Koning, J. J., Houdijk, H., de Groot, G., and Bobbert, M. F. (2000). From biomechanical theory to application in
top sports: The klapskate story. Journal of Biomechanics, 33, 1225–1229.
de Koning, J. J., Thomas, R., Berger, M., de Groot, G., and van Ingen Schenau, G. J. (1995). The start in speed
skating: From running to gliding. Medicine and Science in Sports and Exercise, 27, 1703–1708.
Greer, N. L. (1984). Application of biomechanics to ice hockey. American Hockey Magazine, 5 (7), 21–23.
D. Lafontaine404
Downloaded By: [Canadian Research Knowledge Network] At: 16:36 21 September 2010
Grood, E. S., and Suntay, W. J. (1983). A joint coordinate system for the clinical description of three-dimensional
motions: Application to the knee. Journal of Biomechanical Engineering, 5, 136–144.
Houdijk, H., de Koning, J. J., de Groot, G., Bobbert, M. F., and van Ingen Schenau, G. J. (2000). Push-off mechanics
in speed skating with conventional skates and klapskates.Medicine and Science in Sports and Exercise, 32, 635–641.
Humble, R. N., and Gastwirth, B. W. (1988). The biomechanics of forward power skating. Clinics in Podiatric
Medicine and Surgery, 5, 363–376.
Lafontaine, D. (2005). Development and validation of a mobile motion capture system for long distance human movements:
Application to the kinematics of hockey skating. Unpublished PhD thesis, University of Ottawa.
Lafontaine, D., Benoit, D. L., Xu, L., and Lamontagne, M. (2003). Validation of joint rotation and translation
calculations using a joint coordinate system approach. Paper presented at the the. 12th Annual Meeting of the
European Society of Movement Analysis for Adults and Children. France: Marseille.
Lafontaine, D., and Lamontagne, M. (2003). Ice hockey skating kinematics determined using a mobile camera
array, Part 1: Development and validation of the mobile data-acquisition system. Journal of Applied Biomechanics,
19, 372–377.
Marcotte, G. (1974). Mecanique du patinage. Mouvement, 9, 65–71.
Marino, G. W. (1977). Kinematics of ice skating at different velocities. Research Quarterly, 48, 93–97.
Marino, G. W. (1979). Acceleration–time relationships in an ice-skating start. Research Quarterly, 50, 55–59.
Marino, G. W. (1984). Analysis of selected factors in the ice skating strides of adolescents.CAPHERJournal, 50, 4–8.
McCaw, S. T., and Hoshizaki, T. B. (1987). A kinematic comparison of novice, intermediate, and elite ice skaters.
In B. Jonsson (Ed.), Biomechanics X-B (pp. 637–642), Champaign: Human Kinetics.
Montgomery, D. L., Stefik, C., Delaney, J. S., Pearsall, D. J., and Turcotte, R. A. (2004). Does a bimolar
mouthguard alter ventilation of hockey players?, In D.J. Pearsall and A.B. Ashare (Eds.), Safety in ice hockey:
Fourth volume (pp. 237–243). ASTM STP #1446. West Conshohocken: ASTM International.
Naud, R. L., and Holt, L. E. (1979). A comparison of selected hockey skating starts. Canadian Journal of Applied
Sports Sciences, 4, 8–10.
Naunheim, R. S., Standeven, J., Richter, C., and Lewis, L. M. (2000). Comparison of impact data in hockey,
football, and soccer. Journal of Trauma, 45, 938–941.
Nobes, K. J., Montgomery, D. L., Pearsall, D. J., Turcotte, R. A., Lefebvre, R., and Whittom, F. (2003). A comparison
of skating economy on-ice and on the skating treadmill. Canadian Journal of Applied Physiology, 28, 1–11.
Pearsall, D. J., Turcotte, R. A., Lefebvre, R., Bateni, H., Nicolaou, M., Montgomery, D. L. et al. (2001). Kinematics
of the foot and ankle during forward ice hockey skating. In J. R. Blackwell (Ed.), Proceedings of XIX International
Symposium on Biomechanics in Sports (pp. 78–81). San Francisco: ISBS.
Percival, L. (1992). The hockey handbook. (revised edn.) Toronto: McLelland & Stewart.
Turcotte, R. A., Pearsall, D. J., and Montgomery, D. L. (2001). An apparatus to measure stiffness properties of ice
hockey skate boots. Sports Engineering, 4, 43–48.
Turcotte, R. A., Pearsall, D. J., Montgomery, D. L., Lefebvre, R., Ofir, D., and Loh, J. (2004). Comparison of ice
versus treadmill skating – plantar force distribution patterns. In D. J. Pearsall, and A. B. Ashare (Eds.), Safety in
ice hockey: Fourth volume (pp. 265–271). ASTM STP #1446. West Conshohocke: ASTM International.
Zatsiorsky, V. (1998). Kinematics of human movement. Champaign: Human Kinetics.
Appendix: Technical details about data collection system
In this study, a moving camera data collection system was used, similar to that described
by Lafontaine and Lamontagne (2003) and shown schematically in Figure 7. As noted in the
main text, slight modifications were made to the system to better accommodate the
constraints of the testing environment, mainly through the use of a single guide rail.
The basics of the system remained the same as in Lafontaine and Lamontagne (2003).
The field of view of the cameras remained the same (,1.5 m), and focused only on the
skaters’ right lower extremity. The calibration cube frame remained a 1 £ 1 £ 1 m cube.
Camera (JC Labs, HSC-250 £ 2, Mountain View, California, USA) sampling rate remained
200 frames per second. Extra cameras were used (Panasonic model AG-188 U) for the joint
coordinate system anatomical calibration sequence and were calibrated using the same
calibration cube frame; these cameras operated at the standard NTSC sampling rate. As well
as removing the guide rail farthest from the skaters, the travel length was increased to about
20 m. The single guide rail was screwed into the ice surface with the screw heads flush to the
3D kinematics of hockey skating 405
Downloaded By: [Canadian Research Knowledge Network] At: 16:36 21 September 2010
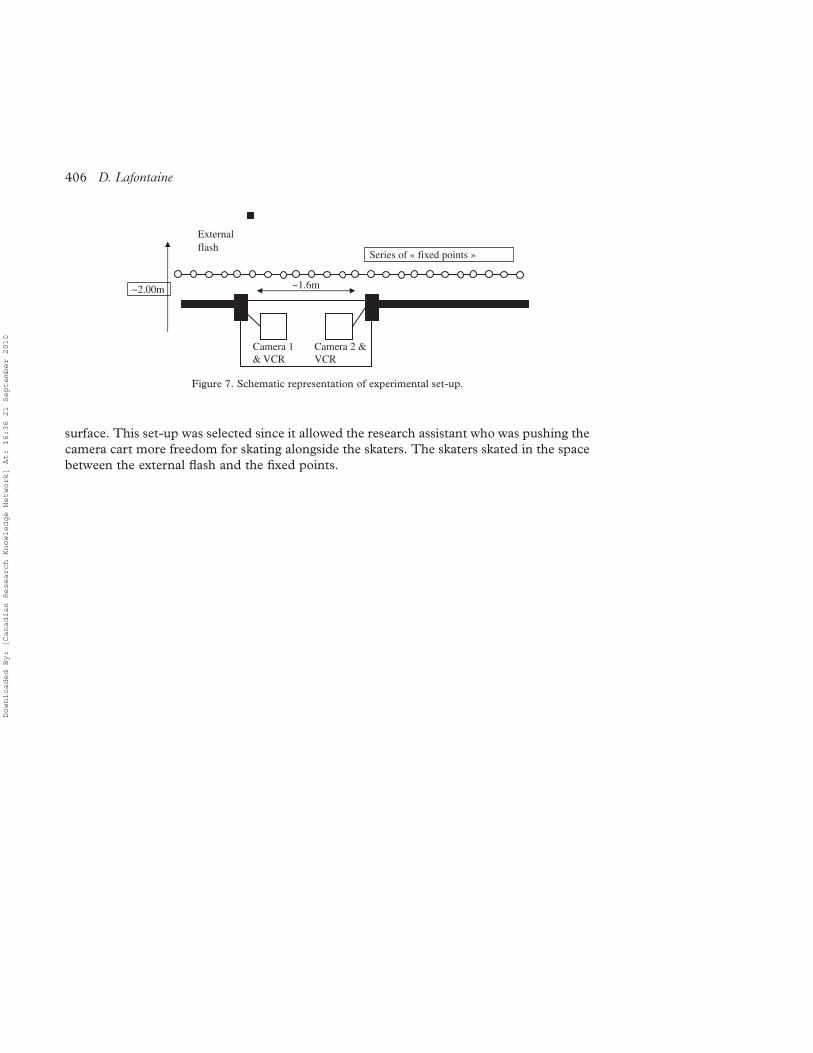
surface. This set-up was selected since it allowed the research assistant who was pushing the
camera cart more freedom for skating alongside the skaters. The skaters skated in the space
between the external flash and the fixed points.
~2.00m ~1.6m
Series of « fixed points »
Camera 1& VCR
Camera 2 &VCR
External flash
Figure 7. Schematic representation of experimental set-up.
D. Lafontaine406
Downloaded By: [Canadian Research Knowledge Network] At: 16:36 21 September 2010