3D Geological Modelling of the Double Eagle Black Thor Intrusive … · 3D Geological Modelling of...
115
3D Geological Modelling of the Double Eagle – Black Thor Intrusive Complexes, McFaulds Lake Greenstone Belt, Ontario, Canada. by Alexandra Laudadio A thesis submitted to the Faculty of Graduate and Postdoctoral Affairs in partial fulfillment of the requirements for the degree of Master of Science in Earth Sciences Carleton University Ottawa, Ontario © 2019 Alexandra Laudadio
Transcript of 3D Geological Modelling of the Double Eagle Black Thor Intrusive … · 3D Geological Modelling of...

3D Geological Modelling of the Double Eagle – Black
Thor Intrusive Complexes, McFaulds Lake Greenstone
Belt, Ontario, Canada.
by
Alexandra Laudadio
A thesis submitted to the Faculty of Graduate and Postdoctoral
Affairs in partial fulfillment of the requirements for the degree of
Master of Science
in
Earth Sciences
Carleton University
Ottawa, Ontario
© 2019
Alexandra Laudadio

ii
Abstract
The Ring of Fire region in northwestern Ontario hosts many valuable magmatic ore
deposits, including six major chromite and one significant Ni-Cu-(PGE) deposit. A 3D
geological model was developed to examine the subsurface architecture and structural
disposition of the Double Eagle and Black Thor intrusive complexes that host these
deposits. The model is constrained by diamond drillhole datasets, regional geological
maps and a refined structural interpretation based on high-resolution magnetic data.
Employing implicit and explicit modelling methods, a 3D representation of the intrusive
complexes was generated by fitting triangulated surfaces to relevant drillhole constraints.
Through the examination of the spatial relationships between the main shear zones and
the intrusive units of the DEIC and BTIC, the primary and post-ore deformation
geometries of the complexes were evaluated, increasing our understanding of the
magmatic plumbing system and supporting the interpretation of a single, connected
ultramafic complex dissected and transposed by ductile deformation.

iii
Acknowledgements
A big thank you to my supervisors, Ernst Schetselaar and Jim Mungall, for their careful
guidance, support and encouragement, and for allowing me this incredible opportunity.
Thank you to Michel Houlé for his time, guidance and many discussions as well as
Michael Hillier for his help with SURFE. I would also like to thank Natural Resources
Canada’s Targeted Geoscience Initiative Program for provided funding and support for
this research.
I am grateful to Noront Resources Ltd. (Alan Coutts, Ryan Weston, Matt Downey,
Stephen Flewelling, Matt Deller, Geoff Heggie, Cory Exell, Rob Lyght, Tristan Megan
and Roydon Spence) for providing access to properties, geological information and for
very informative discussions throughout project development. This research activity
would not have reached fruition without their knowledge and strong support. Moe
Lavigne from KWG is also thanked for providing access to properties, diamond drill
cores, geological information and for ongoing support and discussions.
Finally, I would like to express my deepest gratitude for my family and friends. This
work would not have been possible without your ongoing supporting and encouragement.

iv
Table of Contents
Abstract .............................................................................................................................. ii
Acknowledgements .......................................................................................................... iii
Table of Contents ............................................................................................................. iv
List of Tables .................................................................................................................... vi
List of Figures .................................................................................................................. vii
Chapter 1: Introduction .................................................................................................. 1
1.1 The Ring of Fire.............................................................................................................. 1
1.2 Thesis Objective .............................................................................................................. 3
1.3 Background on 3D Modelling Methods .......................................................................... 4
1.4 3D Modelling Methodology ............................................................................................ 6
1.5 Field Work ...................................................................................................................... 8
1.6 Previous Work .............................................................................................................. 10
Chapter 2: Geologic Context......................................................................................... 12
2.1 Ultramafic-Mafic Layered Intrusions ........................................................................... 12
2.2 McFaulds Lake Greenstone Belt .................................................................................. 12
2.3 Double Eagle Intrusive Complex .................................................................................. 17
2.4 Black Thor Intrusive Complex ...................................................................................... 19
Chapter 3: Magnetic Interpretation............................................................................. 22
3.1 Introduction .................................................................................................................. 22
3.2 Magnetic Susceptibility ................................................................................................ 25
3.3 Refined Structural Interpretation ................................................................................. 31
3.4 Reconstruction of Deformation in the DEIC ................................................................ 37
Chapter 4: Regional 3D Geological Model .................................................................. 41

v
4.1 Introduction .................................................................................................................. 41
4.2 Database Design .......................................................................................................... 42
4.3 Building the Fault Block Model.................................................................................... 47
4.4 Modelling the Intrusive and Lithostratigraphic Contacts ............................................ 51
4.5 Discussion..................................................................................................................... 58
Chapter 5: 3D Chromite Model .................................................................................... 71
5.1 Introduction .................................................................................................................. 71
5.2 Modelling the Chromitite Horizons .............................................................................. 73
5.3 Model Description ........................................................................................................ 75
5.3.1 Black Thor Intrusive Complex ................................................................................. 75
5.3.2 Double Eagle Intrusive Complex ............................................................................. 78
5.4 Geological Insights ....................................................................................................... 85
Chapter 6: Summary and Conclusions ........................................................................ 95
References ........................................................................................................................ 99

vi
List of Tables
Table 1.1. Drill core samples collected during field work for petrography ........................ 9
Table 4.1. Constraints used for each geologic surface during 3D modelling .................. 50

vii
List of Figures
Figure 1.1. Map of terrane and domain boundaries of the Superior Province, Ontario ...... 2
Figure 1.2. Simple 3D modelling workflow ....................................................................... 7
Figure 2.1. Simplified geological map of the McFaulds Lake greenstone belt ................ 14
Figure 2.2. Geological map of the Double Eagle – Black Thor intrusive complexes ...... 16
Figure 2.3. Schematic of lithostratigraphy in the Black Thor intrusive complex ............. 18
Figure 3.1. Geological map of the previous geological and structural interpretation ....... 23
Figure 3.2. Medium resolution magnetic data with previous structural interpretation ..... 24
Figure 3.3. Box and whisker plots for magnetic susceptibility measurements ................. 26
Figure 3.4. Thin section photomicrograph of chromite grains with magnetite rims ........ 28
Figure 3.5. Spatial distribution of magnetic susceptibility measurements ....................... 29
Figure 3.6. Revised structural interpretation based on high-resolution magnetic data ..... 30
Figure 3.7. Updated geologic map, Double Eagle – Black Thor intrusive complexes ..... 33
Figure 3.8. Shear fabrics observed in drill core ................................................................ 35
Figure 3.9. 2D reconstruction of post-ore deformation .................................................... 39
Figure 4.1. Database structure of the MS Access© relational drillhole database ............. 44
Figure 4.2. Hierarchical structure of lithologies and their log descriptive codes ............. 46
Figure 4.3. Hierarchical classification structure used in the Lithoclassification table ..... 48
Figure 4.4. A 3D scene of the Double Eagle – Black Thor intrusive complexes ............ 49
Figure 4.5. Preliminary 3D fault network and volumetric fault block model ................... 52
Figure 4.6. Preliminary 3D model of faults/shear zones and lithostratigraphic contacts . 54
Figure 4.7. Implicit modelling of the Eagle’s Nest conduit .............................................. 56
Figure 4.8. 3D model of the Double Eagle – Black Thor intrusive complexes ................ 57

viii
Figure 4.9. Location of U-Pb age date in felsic volcanic rock ......................................... 59
Figure 4.10. 3D reconstruction of post-ore deformation .................................................. 62
Figure 4.11. Truncation of bimodal metavolcanics by the ultramafic-mafic intrusions ... 63
Figure 4.12. Brecciation and stoping along the roof of the Eagle’s Nest conduit ............ 65
Figure 4.13. Eagle’s Nest conduit and AT12 displayed with sulphur assay data points .. 66
Figure 4.14. Idealized upper crustal portion of a magmatic plumbing system ................. 68
Figure 5.1. 2D scene depicting the surface geometry of 3D modelled surfaces ............... 72
Figure 5.2. 3D model of chromite horizons in the Black Thor intrusive complex ........... 77
Figure 5.3. 3D model of the Black Creek and Big Daddy chromite horizons .................. 79
Figure 5.4. Sinistral-apparent offsets observed in the Black Thor intrusive complex ...... 80
Figure 5.5. 3D model of chromitite zones in the Double Eagle intrusive complex .......... 82
Figure 5.6. 3D model and composite slice image of the Blackbird1 chromite horizon ... 83
Figure 5.7. Connection of chromitite horizons in the Double Eagle intrusive complex .. 84
Figure 5.8. 2D reconstruction of deformation for 3D modelled chromitite zones ........... 91
Figure 5.9. Schematic diagram showing the dynamic emplacement of sill complexes ... 99

1
Chapter 1: Introduction
1.1 The Ring of Fire
The McFaulds Lake greenstone belt (MLGB) in northern Ontario, a.k.a. the Ring of Fire
(RoF), is an arcuate shaped, magnetic high with a diameter of 60 km (Fig. 1.1). Located
within the James Bay lowlands, the surrounding landscape of the MLGB is very flat and
swampy with scattered areas of exposure dominantly occurring along the incision of
streams through the Paleozoic cover (Metsaranta and Houlé, 2013; Mungall et al., 2010).
As a result, the local geology has been inferred from scattered outcrops, localized
diamond drillholes and airborne geophysical surveys where the later was critical in order
to extrapolate the geological units along sparse observation points (Metsaranta et al.,
2015).
Exploration in the McFaulds Lake area first began between 1959 and 1990 by the
Geological Survey of Canada. This resulted in the discovery of the Attawapiskat
kimberlite cluster in 1988 by Monopros, the Canadian subsidiary of De Beers. During the
mid-1990s, Spider Resources Inc. and KWG Resources Inc. discovered the Good Friday
and MacFayden kimberlites. The first two VMS deposits were discovered in 2001,
followed by six more in 2003 which were later drilled by Probe Mines Ltd. in 2006. In
2007, while searching for VMS mineralization, Noront Resources Ltd. discovered the
major Ni-Cu-(PGE) Eagle’s Nest deposit (Noront Resources Ltd., 2015). Since then, a
number of Cr-(PGE) and Ni-Cu-(PGE) deposits were discovered in the McFaulds Lake
greenstone belt, specifically within the ultramafic-mafic Double Eagle (DEIC) and Black
Thor (BTIC) intrusive complexes, including the world class Black Thor Cr-(PGE) deposit

2
Figure 1.1. Superior Province displayed with terrane and domain boundaries showing the
location of the McFaulds Lake greenstone belt, northern Ontario (after Stott et al., 2010).

3
(e.g., Metsaranta et al., 2015; Mungall et al., 2010). The Black Thor deposit is one of the
largest and best-preserved chromite deposits in the world, having indicated and inferred
resources exceeding 102 Mt with an average bulk ore grade of 31% Cr2O3 for zones up to
3 km in length and 100 m in thickness (e.g., Carson et al., 2013; Weston and Shinkle,
2013). The Eagle’s Nest Ni-Cu-(PGE) deposit, on the other hand, has 6.9 Mt of indicated
resources at an ore grade of 2.04% Ni, 0.95% Cu, 1.3 ppm Pt and 3.4 ppm Pd as well as
inferred resources of 4.3 Mt of 1.42% Ni, 0.87% Cu, 0.8ppm Pt and 3.4 ppm Pd
(Metsaranta et al., 2015; Murahwi et al., 2012).
The Black Thor chromite deposit as well as other chromite deposits within the BTIC
(Black Label, Black Creek and Big Daddy) and DEIC (Blackbird1, Blackbird2 and Black
Horse), are hosted by smaller intrusions that are thought to be stratiform in structure and
lenticular in shape resulting from flow through feeder sills and magma conduits (Carson
et al., 2015). As the tectonic and structural influences on the plumbing systems of these
Cr-(PGE) and Ni-Cu-(PGE) deposits are not well-constrained, it remains to be
determined whether the BTIC and DEIC formed as a single complex that has been
tectonically dismembered or as two separate intrusive complexes derived from the same
magmatic source (Houlé et al., 2017a). It is important to note that in the context of this
research, the word complex refers to a volume of rock that has formed by the stacking
and amalgamation of intrusive ultramafic-mafic rock over time.
1.2 Thesis Objective
The primary goal of this research project, conducted as part of the Targeted Geoscience
Initiative program of the Geological Survey of Canada, is the development of a 3D

4
geological model to identify magma pathways and facilitate the examination of the
subsurface architecture and structural disposition of the DEIC and BTIC. Specific
objectives of this study are to provide a refined structural interpretation of the study area
based on high resolution magnetic survey data in addition to two 3D geological models: a
regional-scale model defining the major tectonic and lithostratigraphic structures of the
DEIC and BTIC as well as a model of the 3D subsurface geometry of the chromitite
mineralized horizons within the complexes.
1.3 Background on 3D Modelling Methods
In recent years, 3D geological modelling has become an increasingly prominent tool in
exploration geology. Originally developed for hydrocarbon reservoir modelling in basins,
new advances in geological software have made 3D modelling a powerful tool in
enhancing our understanding of more complicated geological environments (Schetselaar,
2015). In complex hard rock areas like the RoF, 3D modelling of intrusive bodies can be
difficult due to their intricate topologies and variable shapes that are typically poorly
constrained at depth by exploration drilling (de Kemp et al., 2016). This activity becomes
even more challenging when working at the regional scale as the density of data is
significantly reduced compared to working at the camp or mine scale. A number of data-
constrained modelling algorithms can be employed to generate 3D surfaces in sparse data
areas. However, as many of these algorithms seek to fit a smooth best fit function to
produce a surface regardless of geological context, the resulting model may not be
geologically reasonable (Montsion, 2017). Therefore, it is necessary to apply geological
knowledge in order to fill data gaps and provide meaningful interpretations. This data-

5
knowledge based approach consists of many codependent and multi-iterative stages that
can become quite convoluted. The development and implementation of a 3D modelling
workflow is done in an effort to streamline these stages and operates as a loop where
updated versions of the model can be generated as new data and interpretations become
available (de Kemp, 2015; Montsion, 2017).
A 3D modelling workflow utilizes a number of surface modelling techniques that can be
categorized as either explicit or implicit modelling methods (Hillier et al., 2014; Caumon
et al., 2007). Common in early 3D geological modelling, explicit methods constitute a
more hands-on, knowledge-driven approach within a computer-aided design environment
(CAD) that provides the geoscientist the freedom to shape surfaces according to their
interpretation (Mallet, 1997; Sprague and de Kemp, 2005; Lindsay et al., 2013;
Montsion, 2017). These methods typically involve the interpolation of 3D triangulated
surfaces from a set of on-contact points that represent the location where the structure is
interpreted to exist in the subsurface. While this data-knowledge based approach
facilitates the visualization of structures in sparse data regions, it introduces a certain
degree of subjective bias. This can lead to a number of different solutions that honour the
same set of geological constraints, but may not all be geologically reasonable (Hillier et
al., 2014). Implicit techniques, on the other hand, form a more automated and data-driven
approach that permits the modelling of an enclosed volume or closed surface using a
variety of geological data types, including on- and off-contact constraints and orientation
data (Montsion, 2017; Lindsay et al., 2013). The main advantage of this method is its
capability of modelling multiple surfaces with complex geometries and arbitrary topology
at once within the scalar field. As implicit modelling requires less manual interaction, it is

6
generally considered to be a more efficient and reliable method of 3D modelling (Hillier
et al., 2014).
1.4 3D Modelling Methodology
Over the course of this MSc study, a simple 3D modelling workflow (Fig. 1.2) was
defined and implemented to facilitate the development of the regional 3D geological
model. This workflow consists of a series of co-dependent and iterative steps that serve to
build and refine the 3D surfaces that represent the major tectonic and lithostratigraphic
structures within the DEIC and BTIC. The first of these steps is drillhole database
normalization, which involves building a thematic and systematically encoded relational
drillhole database to harmonize the available data from the various exploration claims in
the area. Drill logs from approximately 1700 drillholes (492370 total meters) across the
McFaulds Lake area have been compiled into a single database, with records organized
into multiple thematic tables (lithostratigraphy, lithology, mineralization, alteration and
structure). Drill log records belonging to these five themes were parsed out and
systematically categorized into multiple levels of generalization (Laudadio et al., 2017;
see Chapter 4 for more details). This thematic standardization of the drill log records
facilitated establishing hole-to-hole correlations of laterally-persistent lithostratigraphic
contacts and key structures (e.g., faults and shear zones).
Detailed drill log records in conjunction with the high-resolution magnetic data were used
to refine the previous 2D structural interpretation of Metsaranta and Houlé (2017b),
producing an updated geological map of the DEIC and BTIC that constrained the 3D
geological model (see Chapter 3). Following the drillhole database normalization and

7
Figure 1.2. Methodology (modified from Schetselaar et al., 2016) used during the 3D
modelling of tectonic and lithostratigraphic surfaces in the DEIC and BTIC based on
drillhole data, existing geological maps (Metsaranta and Houlé, 2017b) and a high-
resolution (75 m line spacing) airborne magnetic survey.

8
interpretation of high-resolution magnetic survey data, explicit and implicit modelling
techniques were used to generate the 3D geological model. This was done by fitting
triangulated 3D surfaces to pre-selected drillhole markers and their corresponding 2D
surface traces from previously-published (Metsaranta and Houlé, 2017b) and updated
regional geological maps completed as part of the current study. The 3D geological
model was validated by re-logging 38 drillholes from across the McFaulds Lake area.
Further details of this 3D modelling workflow, together with the resulting geological
interpretation, are discussed in Chapter 4.
1.5 Field Work
Fieldwork for this project was carried out during August 2017 at the Noront Resources
Ltd. “Esker Camp” in the James Bay Lowlands, northern Ontario. Numerous intervals of
drill core from 38 drillholes were re-logged and a total of 31 samples (Table 1.1) were
taken for microscopic and petrographic study. The primary intention of this field
investigation was to establish contact relationship between specific lithostratigraphic
units, validate the refined structural interpretation of the magnetic data and verify
problematic intervals identified during the harmonization of the diamond drillhole
database (see Chapter 4). The findings that emerged from this drillhole logging campaign
served to validate and further refine the regional 3D geological model.

9
Table 1.1. Drill core samples collected during field work for petrography.
Sample ID Hole ID Depth From (m) Depth To (m)
AL01 NOT-08-1G079 201.15 201.185
AL02 BT-10-119 105.96 N/A
AL03 BT-10-119 92.65 N/A
AL04 BT-10-143B 228.46 N/A
AL05 FW-08-06 104.25 104.32
AL06 FNCB-13-037 283.27 283.35
AL07 NOT-08-1G078 317.00 317.08
AL08 NOT-08-1G078 182.61 182.76
AL09 NOT-08-1G078 425.57 N/A
AL10 NOT-08-1G078 118.84 118.95
AL11 NOT-08-1G078 233.52 N/A
AL12 NOT-08-1G078 239.90 N/A
AL13 NOT-09-1G134 31.39 N/A
AL14 NOT-10-1G191 646.59 N/A
AL15 NOT-10-1G191 649.70 N/A
AL16 NOT-10-1G191 518.00 N/A
AL17 NOT-10-1G191 522.90 N/A
AL18 NOT-10-1G191 704.66 704.72
AL19 NOT-10-1G191 731.90 N/A
AL20 NOT-16-1G001 1163.82 N/A
AL21 NOT-08-1G040 150.75 N/A
AL22 NOT-10-1G194 268.10 268.23
AL23 NOT-10-1G194 611.70 N/A
AL24 NOT-10-1G194 245.32 245.45
AL25 NOT-10-1G194 378.15 378.26
AL26 NOT-10-1G194 313.16 313.25
AL27 NOT-10-1G194 539.90 540.00
AL28 NOT-10-196 160.64 160.74
AL29 FN-10-15 218.58 218.66
AL30 FN-10-15 78.47 78.57
AL31 FN-10-21 192.50 192.60
AL32 NOT-11-1G198 113.43 113.53
AL33 NOT-11-1G198 298.48 298.73
AL34 NOT-11-1G199 22.93 23.08
AL35 NOT-11-1G199 143.01 143.16
AL36 NOT-11-1G199 350.36 350.47
AL37 NOT-11-1G200 478.79 478.97
AL38 NOT-08-1G34 176.56 176.72
AL39 NOT-08-1G32 535.37 535.54
AL40 NOT-08-1G32 188.34 188.39
AL41 NOT-09-1G105 243.97 244.03
AL42 NOT-09-1G105 265.00 265.13
AL43 NOT-11-1G199 257.96 258.10

10
1.6 Previous Work
Previous work that has been completed in the McFaulds Lake area includes:
• Three 1:100,000 scale bedrock geological maps of the McFaulds Lake
greenstone belt and surrounding host rocks (“Ring of Fire”) produced from the
interpretation of medium resolution airborne magnetic survey data (Ontario
Geological Survey and Geological Survey of Canada, 2011) and diamond drill
core logs (Metsaranta and Houlé, 2017a, b, c).
• A paper discussing the use of various geophysical methods to detect and define
chromite deposits in the Ring of Fire, specifically in the Black Thor intrusive
complex (Rainsford et al., 2017).
• A revised geological framework of the McFaulds Lake greenstone belt
(Metsaranta et al., 2015).
• The development of a comprehensive, Superior craton-wide inventory of
significant Cr-(PGE)/Ni-Cu-(PGE) mineralized mafic and ultramafic intrusions
(Houlé et al., 2017b).
• Studies on Ni-Cu-(PGE) mineralization at Eagle’s Nest (Mungall et al., 2010,
Zuccarelli et al., 2018) and Black Thor – Black Label (Farhangi et al., 2013).
• Studies on the mineralization within the Double Eagle (Azar, 2010) – Black Thor
(Laarman, 2014) intrusive complexes concerning mineralogy and geochemistry.
• A study on the geochemistry, petrogenesis and stratigraphy of the Black Thor
intrusive complex (Carson et al., 2015).
• A petrographic, mineralogical and geochemical study of the Black Label
chromitite (Mehrmanesh et al., 2013).

11
• A study on the implications of the Late Websterite Intrusion on the Black Thor
and Black Label chromite horizons (Spath, 2017).

12
Chapter 2: Geological Setting
2.1 Ultramafic-Mafic Layered Intrusions
Many ultramafic-mafic layered intrusions around the world occur in sequences of the
Earth’s earliest greenstone belts. Predominantly of Archean and Proterozoic age, most
ultramafic-mafic intrusions have been emplaced in stable cratonic settings or during
major rift-related events (Schulte et al., 2010). These intrusions typically form as funnel-,
saucer- or boat-shaped sill-like bodies with prominent magmatic layering (Irvine, 1975;
Barnes and Mungall, 2018), extending as much as 180 km along strike and up to 15 km
thick. However, the vertical extent of some intrusions is still unknown due to erosion and
post-ore deformation (e.g., Rustenberg Layered Suite of the Bushveld Complex, South
Africa; Schulte et al., 2010).
Economically significant Ni-Cu-(PGE) and Cr-(PGE) deposits are common in many
ultramafic-mafic layered intrusions (e.g., Keays, 1995; Schulte et al., 2010). Whereas
stratiform chromite deposits are usually confined to the lower ultramafic portions (e.g.,
Bushveld Complex, South Africa; Stillwater Complex, USA; Kemi Complex, Finland;
Great Dyke, Zimbabwe), economic grade Ni-Cu-(PGE) sulphide deposits typically occur
within magma conduits/feeder dikes that comprise the magmatic plumbing systems (e.g.,
Voisey’s Bay, Canada; Noril’sk, Russia; Jinchuan, China; Schulte et al., 2010; Li et al.,
2001; Maier et al., 2001; Naldrett 1997).
2.2 McFaulds Lake Greenstone Belt
The McFaulds Lake greenstone belt (MLGB) lies within the central part of the Oxford-

13
Stull Domain in the greater Archean Superior Province (e.g., Houlé et al., 2015). At ca.
2720 Ma the Oxford-Stull Domain, previously referred to as the Sachigo Subprovince,
was welded to the North Caribou Terrane during the first collision event of the Northern
Superior orogeny (Percival et al., 2012). The Oxford Stull Domain forms an intracratonic
rift setting separating the North Caribou Terrane from the Hudson Bay Terrane creating
the northern part of the Superior Province (see Fig. 1.1; Stott et al., 2010; Bédard and
Harris, 2014). It trends east-southeast from northwestern Manitoba to north-central
Ontario where it extends below the Paleozoic sandstone and platform carbonate cover of
the James Bay lowlands (e.g., Stott et al., 2010; Metsaranta et al., 2015; Mungall et al.,
2010). This 2870-2707 Ma Neoarchean domain is comprised of multiple supracrustal
greenstone belts that concentrically wrap around granitoid batholith domes.
The MLGB is an extensive (>200 km along strike) arcuate-shaped greenstone belt
composed of metasedimentary and meta igneous rocks with the presence of silicate- and
oxide-facies iron formation (Mungall et al., 2010). The northern and central parts of the
MLGB, referred to as the Muketei assemblage, consist of a dominantly felsic to
intermediate metavolcanic succession (ca. 2735 Ma) and a bimodal to mafic
metavolcanic succession respectively (Metsaranta et al., 2015). In the central portion of
the MLGB, rocks of the Muketei assemblage are interpreted to be bound to the south by
the Victory assemblage, juxtaposed by a regionally extensive shear zone (Metsaranta et
al., 2015). The MLGB is dominated by Neoarchean ultramafic-mafic intrusions (ca.
2734-2733 Ma) defined as the Ring of Fire intrusive suite (RoFIS), hosted by the 2773
Ma foliated biotite tonalite to granodiorite Muketei River pluton (Fig. 2.1; Metsaranta
and Houlé, 2012, Metsaranta et al., 2015; Houlé et al., 2015). It is
14
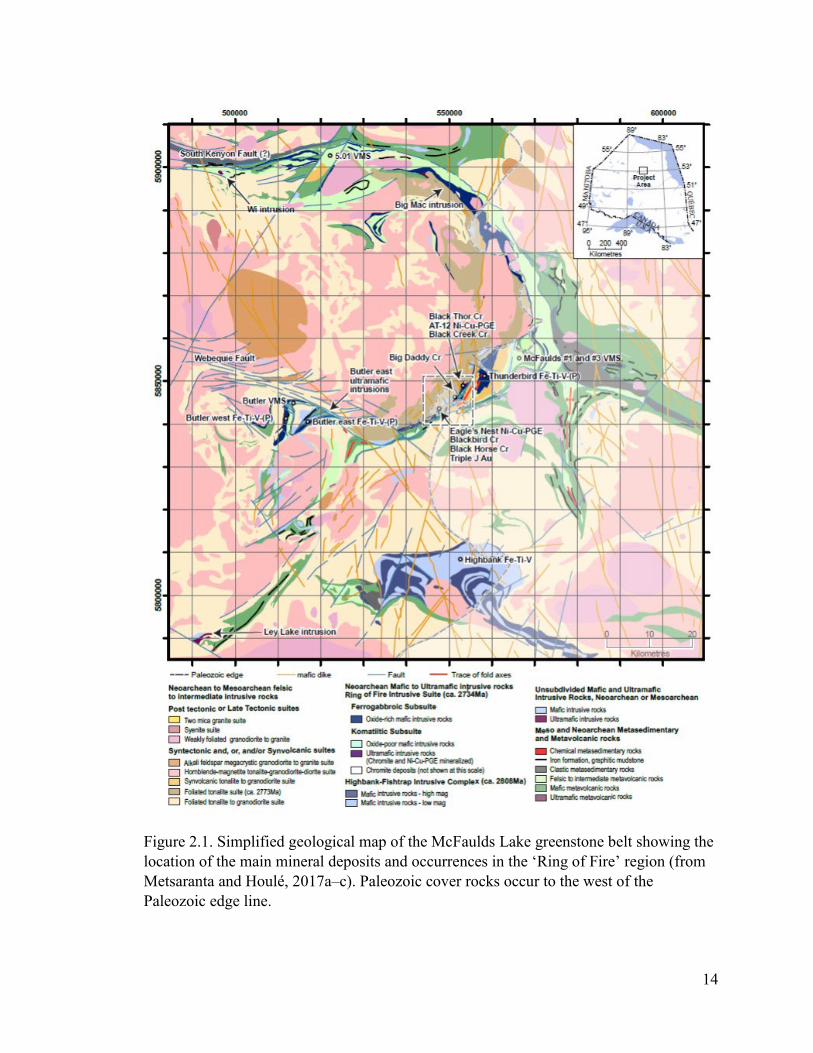
Figure 2.1. Simplified geological map of the McFaulds Lake greenstone belt showing the
location of the main mineral deposits and occurrences in the ‘Ring of Fire’ region (from
Metsaranta and Houlé, 2017a–c). Paleozoic cover rocks occur to the west of the
Paleozoic edge line.

15
possible that during emplacement these ultramafic-mafic intrusions exploited rift-related
fault structures beneath the MLGB, intruding along the unconformity separating the
greenstones from the older felsic basement (Azar, 2010).
The ultramafic-mafic intrusions of the RoFIS comprise two intrusive complexes, the
Double Eagle (DEIC) and Black Thor (BTIC) intrusive complexes, which host a number
of world class Cr-(PGE) deposits (e.g., Black Thor, Black Label, Big Daddy, Black
Horse, Blackbird, Black Creek) and a major Ni-Cu-(PGE) deposit (e.g., Eagle’s Nest)
(Fig. 2.2; Houlé et al., 2017b). These intrusions can be subdivided into two main
magmatic subsuites, an ultramafic-dominated subsuite (Carson et al., 2015) and a mafic-
dominated “ferrogabbro” subsuite (Kuzmich et al., 2015; Sappin et al., 2015). The
ultramafic-dominated subsuite is divided into a lower zone of ultramafic sequences and a
thinner mafic upper sequence. The ultramafic sequences consist of dunite, peridotite
(harzburgite), pyroxenite and chromite metamorphosed to lower greenschist facies.
Dunite and peridotite lithologies are composed predominantly of serpentinized or talc-
replaced olivine (75-95%) with a fine dusting of magnetite throughout as well as along
chromite rims due to the serpentinization process (Azar, 2010). These rocks also exhibit
carbonate (i.e. magnesite) alteration. The pyroxenite consists primarily of orthopyroxene
that has undergone pervasive talc alteration. This rock is often altered to a very soft talc
schist with post-deformational tremolite and some chlorite (Azar, 2010). Associated
chromitite occurs in a variety of mineralization styles (e.g. very thinly laminated to very
thickly bedded, lightly to heavily disseminated, and interbedded massive to semi-massive
chromitite) typically within intervals of dunite and peridotite, less commonly in the
pyroxenite (Carson et al., 2015; Spath, 2017). In contrast, the overlying mafic sequence

16
Figure 2.2. Geological map illustrating the locations of significant Ni-Cu-(PGE) and Cr-
(PGE) mineralization within the Double Eagle – Black Thor intrusive complexes (after
Metsaranta and Houlé, 2017b).

17
consists of mela-, meso- and leucogabbro with lesser anorthosite that have undergone
minor chlorite alteration (Fig. 2.3; Carson et al., 2015; Azar and Ferguson, 2012). On the
other hand, the mafic-dominated “ferrogabbro” subsuite comprises layered, locally
magnetite- and ilmenite-rich gabbro, anorthosite, anorthositic gabbro, and rare pyroxenite
(Metsaranta et al., 2015; Metsaranta and Houlé, 2017b). In addition to the metasediments
and metavolcanic rocks of the greenstone belt, these ultramafic-mafic intrusions are
hosted by a medium-grained granodiorite-tonalite that has undergone minor sericite-
epidote-chlorite alteration. Generally, the host rock lithologies exhibit mineral
assemblages typical of greenschist facies metamorphism (Spath, 2017).
2.3 Double Eagle Intrusive Complex
The DEIC hosts the Eagle’s Nest, a major Ni-Cu-(PGE) sulphide deposit, and the
Blackbird and Black Horse chromite deposits (Fig. 2.2). The Eagle’s Nest is a strongly
differentiated intrusion with deposit host rocks of harzburgite, lherzolite and some
gabbro. The mineralization consists of massive, disseminated and net-textured sulphide
minerals (e.g. pyrite, chalcopyrite, pyrrhotite) and magnetite that form sheets extending
approximately 200 m in strike length and up to 50 m in thickness to a depth of more than
1600 m (e.g., Zuccarelli et al., 2017). Having accumulated in a sub-horizontal keel
structure at the base of a chonolith, the body has been subsequently tilted to a subvertical
dip, striking north-south over a distance of approximately 500 m (Mungall et al., 2010;
Zuccarelli et al., 2017; Zuccarelli et al., 2018). Near the surface, mineralization is
confined to the northwestern margin of the peridotite host dike but tends to be more
concentrated near the western and northern extremities extending to the east (Fig. 4.13a;

18
Figure 2.3. Schematic diagram showing the lithostratigraphy of the Black Thor intrusive
complex (BTIC) with chromite mineralization (black) and adjacent hanging and footwall
rocks (from Spath, 2017 after Carson et al. (in prep)).

19
Mungall et al., 2010; Zuccarelli et al., 2017; Zuccarelli et al., 2018). The peridotite dike is
closed at its northern and southern ends and, despite some local deformation, the body is
not significantly deformed. Occurring within the main dunite sequence near Eagle’s Nest,
the Blackbird chromite deposit (Fig. 2.2) comprises a series of overturned and steeply
dipping chromitite lenses that become younger to the east (Azar, 2010).
2.4 Black Thor Intrusive Complex
The ultramafic series of the BTIC can be divided into a lower, middle and an upper
ultramafic series (Fig. 2.3; Carson et al., 2015): 1) the lower ultramafic series, consisting
of interlayered dunite and lherzolite with minor olivine websterite; 2) the middle
ultramafic series, hosting the thinner stratiform Black Label chromitite zone (BLCZ),
within sequences of interlayered dunite, lherzolite and websterite; and 3) the upper
ultramafic series, consisting of the thicker Black Thor stratiform chromitite zone (BTCZ),
within sequences of lherzolite, websterite, feldspathic websterite and olivine websterite.
The overlying mafic series, separated from the upper ultramafic series by a major
northeast trending shear zone, comprises sequences of melagabbro, mesogabbro,
leucogabbro and minor anorthosite (Carson et al., 2015).
After emplacement but before complete crystallization, rocks of the lower and middle
ultramafic series of the BTIC were cut by the extensive Late Websterite Intrusion (LWI;
Spath et al., 2015; Spath, 2017). Composed predominantly of websterite and lesser
feldspathic websterite, the LWI is localized mostly within the feeder zone and basal
peridotite while also intruding the lower dunitic zones and the lower BLCZ (Spath et al.,
2013). Emplacement of the LWI caused local brecciation of the BLCZ, resulting in a

20
variety of hybridized rock types termed the Black Label hybrid zone (BLHZ) (Carson et
al., 2015; Spath et al., 2015). These hybrid rock types include pyroxene peridotite,
pyroxene oikocrystic peridotite, olivine pyroxenite, pyroxene oikocrystic chromitite and
angular to amoeboidal chromitite breccias from the thermomechanical erosion of pre-
existing BTIC units (Spath et al, 2013). Chromitite layers within the BTCZ and the
undisrupted sections of the BLCZ are thinly-laminated to thickly-bedded and massive,
alternating with partially-continuous serpentinized dunite (Carson et al., 2015). The
BTCZ is the most extensive chromite deposit in the region, measuring approximately 3
km in length along strike, followed by the BLCZ at 1.5 km along strike (e.g., Carson et
al., 2015). Although extensive, individual chromitite layers in the BTCZ and central parts
of the BLCZ appear to be thicker and lenticular in the center of the intrusion above the
feeder zone. With increasing distance from the feeder zone, layers become thinner and
more sheet-like, and therefore difficult to correlate along strike (Carson et al., 2015). The
BLCZ appears to have been originally less continuous than the BTCZ (Mehrmanesh et al.
2013). In addition to Black Thor and Black Label, the BTIC hosts the Black Creek and
Big Daddy chromite deposits, located roughly 2.5 and 4 km southwest of Black Thor,
respectively. The entire complex trends southwest to northeast and is steeply overturned
with sub-vertical dips ranging between 70ᵒ and 85ᵒ northwest (Laarman, 2014).
Ni-Cu-(PGE) mineralization within the BTIC occurs predominantly in the lower
ultramafic series and includes multiple generations and styles (e.g., Farhangi et al., 2013;
Carson et al., 2015): 1) early magmatic mineralization along the basal contact of the
intrusion and at the AT-12 extension (Fig. 2.2); 2) intermediate magmatic reef style
mineralization within the chromitite horizons; 3) late magmatic mineralization within the

21
brecciated parts of the Black Label horizon, and NW breccia zone associated with the
LWI; and 4) tectonically/hydrothermally mobilized local mineralization along the shear
zone between the upper ultramafic and mafic series.

22
Chapter 3: Magnetic Interpretation
3.1 Introduction
The significant overburden and lack of exposed bedrock in the Ring of Fire region has
left the geologic setting of the McFaulds Lake greenstone belt to be determined primarily
through the analysis and interpretation of diamond drill core and airborne geophysical
data (Azar, 2010; Mungall et al., 2010). Previous work completed in the area includes a
set of three regional geological maps (Metsaranta and Houlé, 2017a, b, c) that cover the
whole of the McFaulds Lake greenstone belt. The McFaulds Lake sheet (i.e., Central
sheet; Fig. 3.1) is based on sparse surface exposures, near-surface drillhole intervals and
publicly available medium-resolution (250 m line spacing) airborne magnetic data (Fig.
3.2; Ontario Geological Survey and Geological Survey of Canada, 2011), providing the
foundation on which the revised magnetic interpretation presented in this Chapter is
based.
High-resolution airborne magnetic survey data, provided by Noront Resources Ltd.,
covers the entirety of the Double Eagle (DEIC) – Black Thor (BTIC) intrusive complexes
with a final survey block comprising a total of 3997 line kilometers with a 75 m line
spacing (Scott Hogg and Associates Ltd., 2014). The total magnetic intensity (TMI) grid
and its tilt derivative (TMI-Tilt) were analyzed in an attempt to refine the pre-existing
geological and structural interpretation of this area. In addition to the TMI grid, the TMI-
Tilt is advantageous when interpreting magnetic anomalies as it enhances the response of
weakly magnetic bodies compared to that of strongly magnetic bodies (Salem et al.,
2007). The revised structural interpretation greatly benefits from the analysis of this high-
23
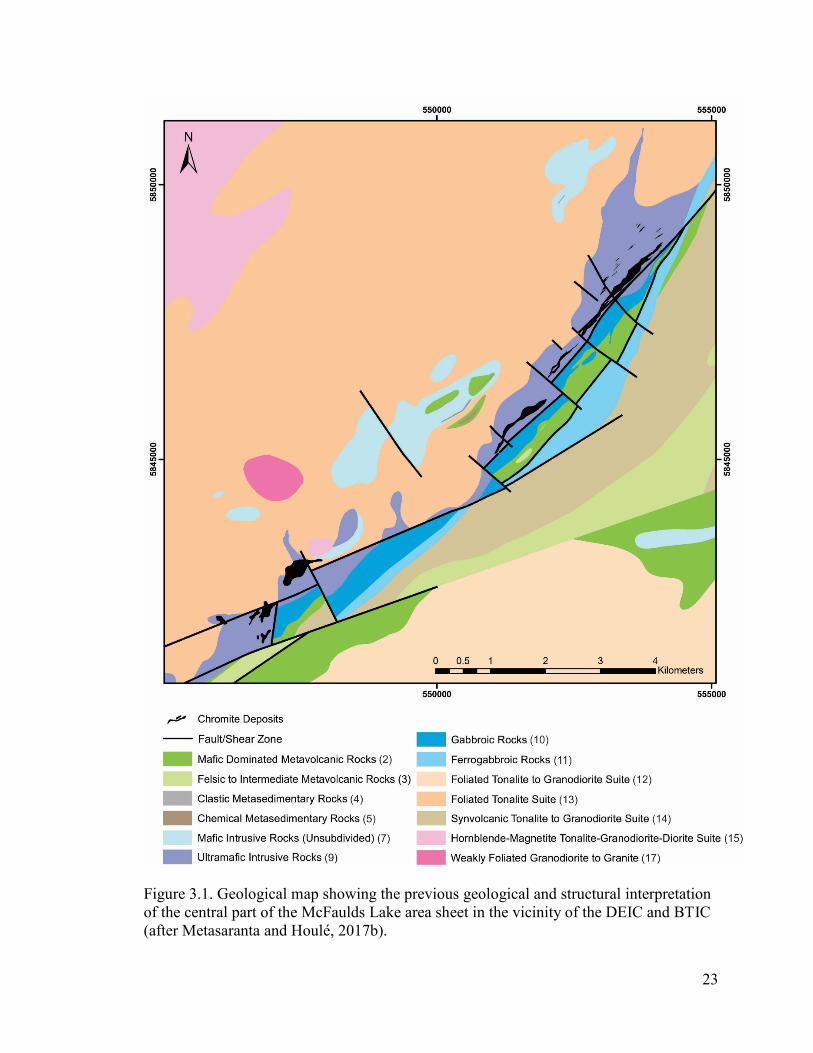
Figure 3.1. Geological map showing the previous geological and structural interpretation
of the central part of the McFaulds Lake area sheet in the vicinity of the DEIC and BTIC
(after Metasaranta and Houlé, 2017b).

24
Figure 3.2. Medium resolution magnetic data (gridded from 250 m line spacing; Ontario
Geological Survey and Geological Survey of Canada, 2011) displayed with histogram
equalization and overlay of structural elements interpreted by Metsaranta and Houlé
(2017b).

25
resolution magnetic data as it provides additional information for delineating the tectonic
structures and sub-vertical lithological contacts of the DEIC and BTIC.
3.2 Magnetic Susceptibility
Although the existing geological map (Metsaranta and Houlé, 2017b) in combination
with drill log descriptions form a sound basis for the refinement of geological structures
and rock units, the new interpretation of the magnetic data also benefitted from the
analysis of magnetic susceptibility measurements acquired in 288 drillholes. These
magnetic susceptibility measurements, ranging from 0.000001 to 2000 SI units, were
cross referenced with drill log lithology records in order to categorize them into six of the
rock units defined by Metsaranta and Houlé (2017b). These rock units include: mafic and
felsic to intermediate metavolcanic, ultramafic intrusive (deformed and undeformed),
gabbro, ferrogabbro and foliated tonalite whose variations in magnetic susceptibility are
displayed in Figure 3.3.
Susceptibility measurements acquired from ultramafic rocks (unit 9) have been identified
from drill log descriptions as either undeformed or deformed. Records classified as
deformed ultramafic rocks include those described as mylonite, phyllonite, fault zone,
fault breccia, shear zone, strongly sheared and strongly foliated. The undeformed
ultramafic rocks (unit 9a) including peridotite, dunite, websterite and pyroxenite exhibit
the highest magnetic susceptibilities, followed by the deformed ultramafics and
ferrogabbro unit respectively (units 9b and 11). The other rock units (2, 3, 10, 13) have
much lower magnetic susceptibilities. The elevated magnetic susceptibility of the
ultramafic rocks (unit 9) relative to the other rock types is explained by high percentages

26
Figure 3.3. Box and whisker plots showing the variations in magnetic susceptibility of
major rock units within the DEIC and BTIC. n = number of samples.

27
of magnetite (from the serpentinization of olivine, see Chapter 2) as seen in drill core and
thin section (Fig. 3.4). Furthermore, the presence of disseminated to heavily disseminated
iron-oxides may explain the generally high susceptibility values of the ferrogabbroic unit
(unit 11), which was found to be locally magnetite- and ilmenite-rich (Metsaranta and
Houlé, 2017b). With the exception of the ultramafic rocks (unit 9a and 9b) and possibly
the ferrogabbro (unit 11), the significant overlap of magnetic susceptibility displayed by
the various units makes it generally impossible to differentiate one from the other.
However, despite this overlap, it does appear that felsic units (3 and 13) generally exhibit
a lower magnetic susceptibility than mafic units (2 and 10).
Additionally, Airo (2002) states that ductile deformation leaves a distinct fingerprint on
aeromagnetic data where zones of deformation exhibit weakened magnetic properties due
to the gradual destruction of magnetite by the injection of oxidizing fluids or
hydrothermal alteration. In the Linnajavri area, Norway, the breakdown of magnetite
during serpentinite carbonation was observed, correlating to a decrease in magnetic field
intensity (Tominaga et al., 2017). This is consistent with observations in other locations
including in the DEIC and BTIC where talc-carbonate alteration from metasomatic fluids
along major shear zones is associated with lower magnetic susceptibility values in
serpentinized rock (Azar, 2008a; Azar, 2010; Laarman, 2014). In order to test this
hypothesis, the spatial variations of magnetic susceptibility in relation to a major
deformation zone were evaluated for intervals of ultramafic rocks within the BTIC (Fig.
3.5). Intervals of dunite (a) and peridotite (b) were parsed out of the diamond drillhole
database and their magnetic susceptibility values were plotted relative to their distance
from a major shear zone (3BSZ; Fig. 3.6). Both lithologies exhibit very similar

28
Figure 3.4. Thin section photomicrograph in reflected light. Euhedral chromite in
moderately sheared peridotite-pyroxenite with magnetite-rich rims identified due to
higher reflectance relative to chromite at 10x magnification. Drillhole NOT-10-1G191 at
518 m.

29
Figure 3.5. Spatial distribution of magnetic susceptibility measurements (in SI units) for
dunite (a), peridotite (b), and ultramafic phyllonite (c) with increasing distance from the
3B shear zone (3BSZ).

30
Figure 3.6. Colour-relief-shaded medium-resolution magnetic data, with inset (white
dotted square) of proprietary high-resolution magnetic data (gridded from 75 m line
spacing), displayed with histogram equalization and overlain with the revised structural
interpretation and magnetic domain boundaries based on previously defined map units by
Metsaranta and Houlé (2017b). FSZ = Frank shear zone; MFSZ = McFaulds Lake shear
zone; 3BSZ = 3B shear zone; 1 = undefined; 2 = mafic dominated metavolcanics; 2a =
sequences of banded iron formation within the mafic dominated metavolcanics; 5 =
sequences of banded iron formation within unsubdivided mafic intrusive rocks; 9 =
ultramafic intrusive rocks; 9a = late websterite intrusion (LWI); 10 = non-magnetic
intrusive gabbro to anorthosite; 11 = locally magnetite- and ilmenite-rich intrusive
ferrogabbro. The northwest-southeast trending dikes within the granodiorite (unit 13)
north of the complexes are believed to be late stage and were not involved in the
formation of the complexes.

31
distributions; data points appear to cluster around 100 SI units for up to 700 m away from
the shear zone while a second group of lower susceptibility samples (~0.5-10 SI units)
cluster within the first 100 m. In comparison, deformed ultramafic phyllonite intervals are
all located within 100 m of the shear zone with a number of low susceptibility samples
(~0.5-3 SI units) clustering within the first 20 m. The magnetic susceptibility
distributions for both dunite and peridotite become increasingly bimodal (particularly
within a distance of 100 m from the shear zone) with decreasing distance from the shear
zone, reducing the average magnetic susceptibility. Furthermore, the distribution
observed for phyllonite reaffirms that sheared ultramafic intervals concentrated along the
deformation zone present highly-variable magnetic susceptibilities with lower average
values relative to less-deformed ultramafic intervals. Therefore, these results provide
additional evidence for the presumption that major faults and shear zones will typically
occur as linear to curvilinear magnetic lows in the airborne data.
3.3 Refined Structural Interpretation
On the basis of the previous interpretation (Metsaranta and Houlé, 2017b), analysis of
magnetic susceptibility data and drill log descriptions, the high-resolution colour relief-
shaded TMI grid was divided into a number of domains ranging in magnitude from -836
to 13944 nT, each representing a distinct response of the magnetic anomaly field (Fig.
3.6).
In the northwest, the mottled moderate magnetic response is interpreted as the
hornblende-magnetite tonalite-granodiorite-diorite suite (unit 15) defined by Metsaranta

32
and Houlé (2017b). Directly southeast of this felsic to intermediate unit is a magnetic low
corresponding to the foliated tonalite suite (unit 13; granodiorite). This unit is bound on
its southeastern margin by an alignment of highly magnetic bodies trending northeast-
southwest (unit 9). These magnetic highs define sill-like ultramafic intrusions composed
of layered dunite, peridotite, pyroxenite and chromitite emplaced between the granitoid
basement and supracrustal mafic-dominated volcanic rocks. Magnetic lows along the
southern contact of the ultramafic rocks define the upper mafic portion (unit 10) of this
layered intrusive complex. As the complex has been tilted to a sub-vertical orientation
from the presumably original horizontal attitude at which it was emplaced (see Chapter
2), the contact between the foliated tonalite suite (unit 13) and the ultramafic intrusive
rocks (unit 9) forms the basal contact of the intrusive complex which spans the entire
length of the DEIC and BTIC (Figs. 3.6 and 3.7). Areas to the north and immediate
southeast of the ultramafic-mafic layered intrusion are characterized by a series of
magnetic highs. This local bedrock magnetization appears to result from the presence of
iron formation (unit 2a) within the mafic dominated volcanic unit (unit 2; Metsaranta et
al., 2015) and the intrusion of the locally magnetic coeval ferrogabbro (unit 11). Based on
drill log descriptions, the sill-like intrusion of ferrogabbro appears to have been
preferentially emplaced along the contact of the mafic dominated metavolcanic unit (2)
and the overlying synvolcanic tonalite to granodiorite suite (unit 14), locally crosscutting
the gabbro unit (10; Metsaranta and Houlé, 2017b).
Additionally, the TMI grid shows a general pattern of northeast-trending linear to
curvilinear magnetic lows (Figs. 3.6). Largely corresponding to those on the medium
resolution magnetic data (Fig. 3.2), these magnetic lows were outlined and further refined

33
Figure 3.7. Geological map of the central part of the McFaulds Lake greenstone belt re-
interpreted after Metsaranta and Houlé (2017b). Chromite deposits are the surficial
representation of the respective ore zones lying at and below the surface. FSZ = Frank
shear zone; 3BSZ = 3B splay of the FSZ; MFSZ = McFaulds Lake shear zone.

34
with the detail provided by the high-resolution TMI-Tilt grid. Expected to represent
large-scale faults or shear zones, these linear to curvilinear magnetic lows were cross-
referenced with drill log descriptions to confirm their structural significance. This ground
truthing verified the presence of three major northeast-southwest trending shear zones
(FSZ, MFSZ and 3BSZ) and three brittle faults trending northwest-southeast (Fig. 3.6).
The interpretation of their regional extent and their spatial relationship with the various
rock units of the DEIC and BTIC facilitated local refinement of the previously published
geological map (Metsaranta and Houlé, 2017b; Fig. 3.7). Findings that emerged from this
campaign are reviewed in the following paragraphs, previously published in a progress
report in Laudadio et al (2018a).
Drill core observations of shear fabrics (Figs. 3.8a-c and e-f), aligned for several
kilometers along strike, confirm that the linear to curvilinear magnetic lows are spatially
associated with a series of southwest-northeast trending anastomosing shear zones (Figs.
3.6 and 3.7). Quartzo-feldspathic protomylonitic fabrics in granodiorite (Fig. 3.8a),
strongly foliated intrusive ultramafic schist (Fig. 3.8b) and felsic volcanics (Fig. 3.8c)
within the mafic-dominated metavolcanic unit indicate that these regionally significant
structures formed in a predominantly ductile deformation regime. The Frank shear zone
(FZS; Fig. 3.7) dipping 60° to the northwest, is interpreted as one of the main tectonic
structures accommodating displacement of lithological units and ore zones within the
DEIC (M. Deller, pers. comm., 2017). The footwall of this structure is structurally higher
than its hanging wall, presuming that the sequence youngs to the southeast. Following
this shear zone along strike, it transects the granodiorite (Fig. 3.8a) of the foliated tonalite
suite in the southwest before it follows the contact between this unit and the talcose

35
Figure 3.8. a) Sheared, medium-grained granodiorite of the Frank shear zone (FSZ) that
exhibit a planar fabric composed primarily of biotite and ribbons of blue-grey quartz
wrapping around plagioclase porphyroclasts. Drillhole NOT-10-1G194 at 538.23 m. b)
Highly sheared, fine grained, talc-carbonate altered peridotite of the FSZ exhibiting
strong foliation. Drillhole NOT-10-1G194 at 541.86 m. c) Mylonitized felsic volcanic
rock interval within the mafic-dominated volcanic unit. The mylonitic foliation is defined
by coarse blue-grey quartz porphyroclasts wrapped by fine grained light bands of
carbonate and quartz and dark bands of chlorite and biotite. Drillhole NOT-08-1G079 at
423.8 m. d) Sharp intrusive contact between granodiorite (left) and serpentinized
peridotite (right) with preserved medium grained cumulate texture (pseudomorphic
pyroxene and olivine). Drillhole FW-08-06 at 103.51 m. e) Sheared, fine grained green
chlorite/calcite altered mafic volcanics, within the mafic dominated volcanic unit, that
exhibit a strong planar fabric. Drillhole NOT-08-1G078 at 386.5 m. f) Fine to medium
grained felsic lapilli tuff with a fine-grained matrix of quartz and biotite forming
foliation. Rounded to angular lapilli composed of quartz and feldspar within the mafic
dominated volcanic unit. Drillhole NOT-08-1G079 at 307 m. Core diameter is 4.5 cm.

36
peridotite of the DEIC (Fig. 3.8b). Drill core observations indicate that in this area, the
high strain zone extends for several tens of meters into both units. The variations in
thickness and strain intensity of these sheared intervals suggest that the FSZ is
heterogeneous in nature. Furthermore, examination of the FSZ along this granodiorite-
peridotite contact in the DEIC resulted in the identification of a very strong mineral
lineation within the granodiorite suggesting reverse displacement (north over south)
along the shear zone (Mungall, 2009).
Further toward the northeast, the FSZ juxtaposes the lobate intrusive ultramafic units in
the hanging wall with the upper gabbroic sequence of the DEIC in the footwall (Fig. 3.7).
The lobe-shaped ultramafic unit in the hanging wall furthest to the southwest hosts the
Eagle’s Nest deposit, interpreted as one of the feeders of the DEIC layered intrusion
(Houlé et al., 2017a). Further toward the northeast, the FSZ transects the gabbro, mafic-
dominated volcanic host rocks and ferrogabbro intrusions. The high strain zones of the
FSZ and the 3B shear zone (3BSZ; the northeast-southwest striking shear zone
transecting the BTIC) predominantly overprint the contact between the ultramafic and
mafic intrusive phases in both complexes (Fig. 3.7). Additionally, the similar curvilinear
anomaly patterns of the FSZ and 3BSZ, are both transposed parallel to the contact
between the ultramafic and gabbro lithostratigraphic units. This suggest that these shear
zones may have originally formed a single continuous structure within the DEIC and
BTIC, inferred to be offset at a later stage along a newly developed splay forming a
'zipper' or 'freeway' triple-junction (Passchier and Platt, 2017). Elsewhere, the irregular
shape of the intrusive ultramafic-granodiorite contact on the geologic map (Fig. 3.7) and
the preservation of sharp contacts between undeformed serpentinized peridotite and

37
granodiorite, as observed in drill core (Fig. 3.8d), indicate that the primary intrusive basal
contact of the layered intrusion is largely intact in both the DEIC and BTIC.
The McFaulds shear zone (MFSZ), identified as the strong northeast trending curvilinear
magnetic low southwest of Blackbird2, is another regionally-significant structure of the
McFaulds greenstone belt (Metsaranta and Houlé, 2017b). Located south of the
complexes, the MFSZ follows the contact between the intrusive ultramafic rocks of the
DEIC and the mafic-dominated volcanic unit (Fig. 3.8b, c, e, f) adjacent to the
Blackbird2 chromite deposit. Drill core observations show that the MFSZ steps
north/south away from the intrusive contact with strongly-developed shear fabrics in
felsic intervals (Fig. 3.8c, f) of the mafic-dominated volcanic units (Fig. 3.8e). These
felsic rocks appear to have acted as preferential zones of weakness during shear zone
deformation. Toward the east-northeast, the MFSZ transects the mafic dominated
volcanic rocks, ferrogabbro intrusion and synvolcanic tonalite. A series of late-stage
northwest-southeast striking brittle faults with minor offsets of 100-200 m displace
sections of the BTIC (Figs. 3.6 and 3.7). These faults appear to be consistent with
‘domino’ or ‘bookshelf’ extensional imbricate fault systems as they exhibit steeply
dipping parallel geometries with sinistral-apparent offsets and are not interpreted to be
regionally extensive on the high-resolution magnetic data (Ferril et al., 1998).
3.4 Reconstruction of Deformation in the DEIC
A better understanding of the original relationship between the DEIC and BTIC can be
attained through the reconstruction of the structural evolution of rock units; restoring the
relative displacement along major faults and shear zones. The most basic method for

38
determining the displacement along a shear zone is through the identification and
kinematic analysis of shear zone indicators with reference to the incremental and finite
strain ellipsoid (Passchier and Trouw, 2005). Although such indicators were occasionally
observed in the field, due to a lack of oriented drill core, these could not be linked to
inferences on the movement direction based on the strike-slip and dip-slip components
defined by the measured orientations of stretching or mineral lineations. This
reconstruction is therefore limited to restoring an apparent horizontal strike-slip
displacement assuming homogeneous flow in a regime of simple shear. Hence, the offset
observed between units on either side of a shear zone that forms at an angle to unit
contacts represents the overall apparent displacement along the shear zone.
The large-scale map pattern, specifically the sigmoidal curvature of the gabbro and mafic
dominated volcanic units near the Y-shaped triple junction (Fig. 3.7), strongly suggest a
dextral apparent sense of shear along the FSZ. In this area, two piercing points mark the
termination of the gabbro-mafic metavolcanic contact in the foot wall and its continuation
in the hanging wall (Fig. 3.9). In the Cartesian reference frame, a simple 2D vector was
drawn connecting both piercing points along the FSZ revealing a minimum offset of 1.5 -
2 km (Fig. 3.9a-I). This displacement is consistent with that observed to the southwest
where the DEIC sulphide-mineralized feeder (Eagle’s Nest deposit) north of the FSZ is
separated from the chromite deposits south of the FSZ (Eagle Two, Black Horse,
Blackbird1 and Blackbird2; Fig. 3.7 and 3.9a-II). It is impossible to determine the total
amount of lateral displacement that has occurred along the 3BSZ because it occurs along
strike in the BTIC overprinting the ultramafic-gabbro contact. Whereas Mungall (2009)
indicated a reverse sense of shear displacement along the FSZ as recorded by ductile

39
Figure 3.9. Conceptual restoration of deformation of the DEIC and BTIC showing the
current structural configuration (a), restoration along the splay (b), and pre-deformation
configuration (c). The restored rock units and surface projected sulphide mineralization
(red stars) suggest an offset of approximately 1.5 km with a dextral component of
displacement. Note that within the DEIC, the FSZ dips 60ᵒ NW becoming more vertical
along strike towards the NE. Unlike the chromite within the BTIC which lies in the
hanging wall, surface projected chromite deposits within the DEIC lie within the footwall
of the FSZ at depth maintaining their position throughout the reconstruction (Laudadio et
al., 2018b).

40
fabrics in the tonalite, the present analysis assumes that the predominant map-scale
displacement was sub-horizontal. It is possible that the fabrics observed by Mungall
were recorded in the tonalites at an early stage of deformation when the ultramafic rocks
remained rigid, prior to serpentinization, whereas fabrics currently observed in the
phyllonites were produced at later times when the hydrated ultramafic rocks were more
ductile, however this remains speculative and impossible to confirm. The reconstruction
illustrated in Figure 3.9 lends itself to a simplified interpretation for the original
emplacement of the DEIC and BTIC before the apparent displacement along the FSZ. In
the reconstruction, the offset observed in the DEIC and near the Y-shaped triple junction
has realigned the intrusive contacts to match in both locations (Fig. 3.9b, c). The lobate
ultramafic rocks in the DEIC that are currently juxtaposed against the gabbro were
originally positioned adjacent to the ultramafic portions in the foot wall (Fig. 3.9c).
Additionally, as previously argued, the contact between the gabbro and mafic dominated
metavolcanic rocks is inferred to have occurred originally as a continuous structure
throughout the DEIC and BTIC (Fig. 3.9c).
Although this 2D reconstruction provides valuable information regarding the evolution of
the surficial geometry of these complexes, the resulting interpretation is largely
hypothetical. A better understanding of the subsurface architecture in this complex
geologic setting can be achieved through the visualization of the 2D map traces in
conjunction with various drill log intervals in 3D space. The development, evolution and
interpretation of the regional 3D geological model is presented in the Chapter below.

41
Chapter 4: Regional 3D Geological Model
4.1 Introduction
Three-dimensional geological modelling is a time intensive process consisting of many
co-dependent and multi-iterative stages (Montsion, 2017). The first stage in this, as in any
modelling endeavor, included data preparation and database normalization, which
improved the organization of the large amount of available data. This database
normalization is essential to the 3D modelling process as it facilitates the extraction of
relevant information (via the formulation of database queries), including sub-surface
drillhole markers (XYZ-referenced subsurface points marking the location of unit
contacts), mineralization occurrences and tectonic structures to constrain faults, shear
zones and lithostratigraphic contacts. Following data preparation, Paradigm’s 3D
structural knowledge universal approach (SKUA®) workflow was implemented to model
the regional-scale tectonic structures and faulted geometry of lithological units within the
DEIC and BTIC. SKUA®, including the ‘Structure and Stratigraphy’ workflow, is based
on the space-time mathematical framework (Mallet, 2004), which benefits the modelling
process by taking into account the structural setting prior to the generation of
lithostratigraphic surfaces. The framework begins by creating a fault block model of the
principal structures that offset the lithostratigraphic units. A coordinate transformation is
then estimated using the UVT transform algorithm to model the geologic structures to
their undeformed paleogeographic state. An inverse of the UVT transform algorithm is
later applied in order to model these structures on a faulted-curvilinear grid (Schetselaar,
2013).

42
Subsequent to data preparation methods, explicit and implicit modelling techniques
employed during this research are reviewed and the geometry of the 3D geological model
is examined. Building on the structural interpretation presented in Chapter 3, geological
insights into tectonic and stratigraphic relationships are discussed, followed by discussion
of the insights gained into the magmatic plumbing system in this 3D framework.
4.2 Database Design
In an area with such minimal exposure as in the RoF drillhole data is extremely important
as it provides almost all the constraints of the 3D geological model. Consequently, all the
available drillhole data, government and proprietary industry datasets (Noront Resources
Ltd and KWG Resources Inc.), have been compiled into a single thematic and
systematically encoded Microsoft (MS) Access© database. Contrary to a flat file
spreadsheet consisting of a single table, a relational database, in which large amounts of
data can be stored in multiple linked tables, provides an optimal query environment for
searching specific data records for the 3D visualization or modelling task at hand.
Considering that drillhole data typically consists of a significant number of records with
multi-thematic overlapping FROM-TO depth intervals, this database structure is
advantageous as it eliminates data redundancies while enforcing semantic integrity. Such
a database is essential for modelling the regional-scale tectonic structures and lithological
contacts as it facilitates the organization, extraction and joint visualization of multi-
thematic drillhole data in 3D space.
The relational drillhole database compiled in support of this thesis research archives
drillhole data for approximately 1700 drillholes. This data, consisting of collar

43
information, surveys (deviation logs), drill log descriptions and physical rock properties,
was provided in numerous MS Excel© spreadsheets. Collected from several drilling
programs over the course of 10 years by a number of different exploration companies, the
drillhole data needed harmonization to reduce variations in drill log coding and
classification. Therefore, drillhole records from several Excel workbooks were organized
into multiple thematic tables (Fig. 4.1), including: 1) major lithology, 2) lithostratigraphy,
relating lithology records to predetermined map unit codes (Metsaranta and Houlé,
2017b) that represent the lithostratigraphic units of the ultramafic-mafic intrusion and
surrounding host rocks, 3) mineralization indicating the presence/absence of Ni-Cu-
(PGE) and Cr-(PGE) forming minerals, 4) presence or absence of alteration minerals and
5) primary, secondary, tertiary and quaternary structure types (e.g., bedding, contact,
fault, foliation, shear zone etc.) with core angle measurements. Physical rock property
data such as 6) assays and 7) magnetic susceptibility data are organized in tables of the
same name. The grouping of drill log records into thematic tables is critical for the
identification and hole-to-hole correlation of lithostratigraphic markers at the regional
scale (Schetselaar et al., 2015). With the exception of lithostratigraphy, records belonging
to these tables are relationally linked to the ‘Collars’ table by their drillhole identifier
‘HoleID’ using many-to-one relationships (Fig. 4.1). Additionally, the ‘Major Lithology’
table is linked to three hierarchically structured classification tables:
‘LithoClassification’, ‘Litholink’ and ‘Lithostratigraphy’. These tables are hierarchically
structured to facilitate the encoding, reclassification and visualization of detailed
lithology records at multiple levels of generalization.
The ‘LithoClassification’ table serves to categorize the most detailed drill log

44
Figure 4.1. Database structure of the MS Access© relational drillhole database for the
RoFIS. Tables consisting of various drill log descriptions are linked to their drillhole
identifier ‘HoleID’ by one-to-many relationships.

45
descriptions from the ‘MajorLithology’ table at four levels of generalization.
Consequently, the ‘LithoClass4’ field contains the most detailed lithology class for a
particular FROM-TO interval while the ‘LithoClass1’ field contains the most generalized
lithology class. Note that when a mixture of lithologies exists in roughly equal
abundances for a given interval, the ‘LithoClass4’ field encodes both lithologies whereas
the ‘LithoClass3’ field encodes only the most dominant. Each unique lithology record
was assigned an abbreviated log descriptive code that follows the same hierarchical
structure as the full name fields in the table (Fig. 4.2). The ‘Litholink’ table uses these
lithology specific codes as a means of establishing many-to-many relationships in order
to relationally link multiple records in the ‘LithoClassification’ table with multiple
lithology records in the ‘MajorLithology’ table. The ‘Lithostratigraphy’ table, on the
other hand, assigns each unique lithology record in the ‘MajorLithology’ table with an
alphanumerical code representative of the corresponding map units published by
Metsaranta and Houlé (2017b). This is a many-to-one relationship, therefore an
additional ‘Litholink’ table is not required. Considering that the encoding process
involved the interpretation of lithology records with a level of uncertainty, it is possible
that coding errors may have been propagated during this stage of data standardization.
As this considerable dataset consists of drill core that has been logged and relogged by
numerous industry and government professionals, as well as graduate students, it is
important to note that inconsistencies in rock classification and log description detail may
exist within the database. Ambiguities presented during the interpretation and logging of
drill core intervals, especially for intervals exhibiting a mixture of two or more
lithologies, may have resulted in the propagation of minor lithological and

46
Figure 4.2. Schematic showing the hierarchical structure of lithologies and their log
descriptive codes within the ‘Lithoclassification’ table. INTR = intrusive; INTRUM =
intrusive ultramafic; INTRUMDN = intrusive ultramafic dunite; INTRUMDNPER =
intrusive ultramafic dunite-peridotite.

47
lithostratigraphic coding discrepancies during the data harmonization process. However,
the hierarchical nature of the database structure works to mitigate these errors as it is
likely that intervals with conflicting class labels at detailed levels will merge into a single
class label at increased levels of generalization (Fig. 4.3).
Once all drill log records were systematically encoded in the relational database, queries
were designed to export lithostratigraphic logs for joint 3D visualization with geological
map units in the SKUA-GOCAD™ 3D modelling environment (Fig. 4.4) in preparation
for fitting 3D geological surfaces to these surface and subsurface data constraints. The 3D
modelling methodology used to generate and refine these geological surfaces (see
Chapter 1, Fig.1.2 - steps 3 to 6) is discussed in detail in the following sections.
4.3 Building the Fault Block Model
The first step in building a 3D geological model is to create a network of faults and/or
shear zones. As these tectonic surfaces are used to determine the amount and sense of
displacement of lithological units from one fault block to the next (Schetselaar et al.,
2013) it is only relevant to include the structures that have an angular relationship with
the lithological contacts, since these structures define the magnitude of their faulted
offsets. The study area, fully encompassing the mapped contacts, structures and drillhole
intervals of the DEIC and BTIC, comprises three major shear zones (the FSZ, 3BSZ and
MFSZ) and three minor brittle faults (see Chapter 3). Each modelled fault or shear zone
was constrained by its mapped surface trace as well as drillhole markers extracted from
the drillhole database (Table 4.1).

48
Figure 4.3. Schematic representation of the hierarchical classification structure used in
the Lithoclassification table (Fig.4.1) to organize lithology records into four levels of
generalization. Note that any discrepancies in lithology logs, especially at the most
detailed level, are still correctly classified by the upper level lithology classes.

49
Figure 4.4. A 3D scene (a) of the Double Eagle (b) – Black Thor (c) intrusive complexes
(from Laudadio, 2017) showing the joint visualization of geologic map units and FROM-
TO drillhole intervals queried from the diamond drillhole database and displayed
according to their respective geological map unit codes (after Metsaranta and Houlé,
2017b).

50
Table 4.1. Constraints from drillhole data and the updated geologic map (surface traces)
that were used for 3D modelling of faults/shear zones and lithostratigraphic contacts.
Three-Dimensionally Modelled Surface Drillhole
Intersections
Geologic Map
Trace (m)
Fault/shear zone surface
McFaulds Lake shear zone (MFSZ) 6 20661
Frank shear zone (FSZ) 111 11145
Brittle Fault (1)
533
Brittle Fault (2)
617
Brittle Fault (3) 548
Lithostratigraphic surface
Top of the granodiorite (foliated
tonalite suite) 131 19859
Top of the ultramafic unit 136 17127
Top of the mafic unit 43 8900
Top of the bimodal metavolcanic unit 17 24148
Top of the ferrogabbro unit 2 11235

51
For some of the late brittle faults where subsurface constraints could not be confidently
identified, a 3D surface was generated by projecting the mapped surface trace vertically
into the subsurface. Utilizing the SKUA GOCAD ‘Structure and Stratigraphy’ workflow,
care was taken to ensure a seamless fault network model (Fig. 4.5a) in order to accurately
determine the displacement of lithological units across modelled faults and shear zones
and effectively partition the 3D grid model into volumetric fault blocks (Fig. 4.5b). For
the northwest-southeast trending minor brittle faults within the BTIC such a volumetric
partitioning was not possible. These structures were, on the basis of their limited offsets
of lithological contacts, modelled as dying faults with displacements terminating at their
tips.
Though the 3BSZ is an integral part of the regional 3D model, it is omitted from the fault
network and thus the fault block model. This is because it is a strata-parallel shear zone
(see Chapter 3) with unknown displacement that has not resulted in significant offsets of
the lithological units at an angle to its trace.
4.4 Modelling the Intrusive and Lithostratigraphic Contacts
Despite the intrusive nature of the complexes, the DEIC and BTIC are defined by a
conformable sequence of layered lithological units (see Chapter 2). Listed from
stratigraphic bottom to top, these include the granodiorite host rock, ultramafic-mafic
intrusive rocks, bimodal volcanic rocks and intrusive ferrogabbro (Fig. 3.7). Following
the development of the fault block model, 3D triangulated surfaces representing the top
of each of the lithological units were generated proceeding with the SKUA GOCAD
‘Structure and Stratigraphy’ workflow. Displacements along the shear zones were

52
Figure 4.5. a) Preliminary modelled 3D surfaces representing fault and shear zones and b)
seamless volumetric fault block model of the study area. MFSZ = McFaulds Lake shear
zone; FSZ = Frank shear zone. Structures labeled 1, 2 and 3 refer to minor northwest-
southeast trending brittle faults numbered from west to east based on the updated
geologic map (Figure 3a). Note: colour scheme is arbitrarily chosen by the modelling
software and has no significance.

53
considered during this stage of modelling. Similar to the fault network, these lithological
contacts are constrained by drillhole markers extracted from the drillhole database and
their corresponding surface traces taken from the updated geological map (see Chapter 3;
Table 4.1).
The resulting lithostratigraphic model is expressed as a series of smooth and conformable
3D surfaces (a consequence of the SKUA® workflow; Fig. 4.6). As each surface is
compelled to follow the general shape and orientation of those adjacent to it (see Chapter
1), the irregularities at the base of the intrusive body are poorly represented. Therefore,
the manual editing of lithological surfaces (particularly magmatic conduits and feeders
along the basal contact of the complexes) was necessary in order for their geometry to
more accurately honour the available drillhole constraints. Combining these constraints
with the updated geological map data in 3D space facilitated the validation of the various
contact relationships.
Modelling the Eagle’s Nest conduit demanded a different approach. SURFE, a SKUA
GOCAD plugin developed based on an implicit modelling approach using radial basis
functions (Hillier et al., 2014), is an automated data-driven method that minimizes human
bias unlike the hands-on knowledge-driven methods of explicit modelling. This method
proved ideal for generating the intrusive contact of the Eagle’s Nest conduit as it permits
the modelling of an enclosed volume or closed surface. In order to produce a closed
surface, SURFE required the input of drillhole constraints marking intersections of the
intrusive contact of the conduit within the granodiorite host rock in the subsurface (see
Chapter 1 for more information on 3D modelling methods). Therefore, a dataset was
created consisting of three weighted classes of points defined by a single numerical value
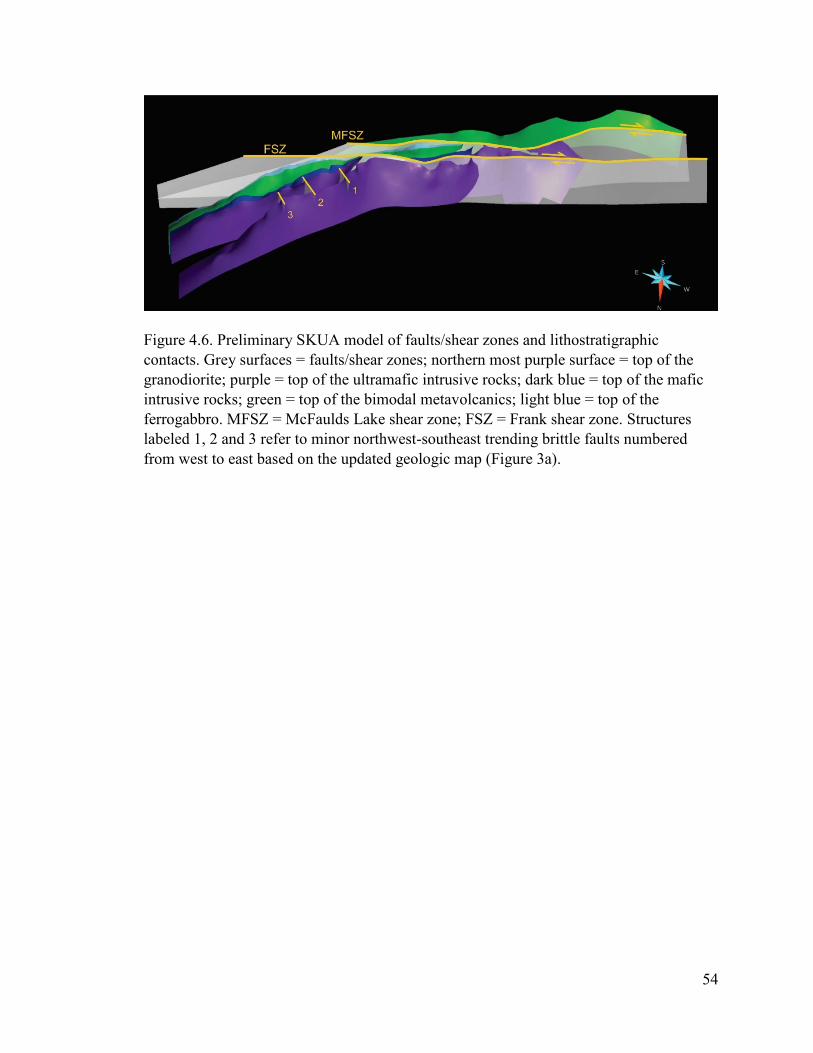
54
Figure 4.6. Preliminary SKUA model of faults/shear zones and lithostratigraphic
contacts. Grey surfaces = faults/shear zones; northern most purple surface = top of the
granodiorite; purple = top of the ultramafic intrusive rocks; dark blue = top of the mafic
intrusive rocks; green = top of the bimodal metavolcanics; light blue = top of the
ferrogabbro. MFSZ = McFaulds Lake shear zone; FSZ = Frank shear zone. Structures
labeled 1, 2 and 3 refer to minor northwest-southeast trending brittle faults numbered
from west to east based on the updated geologic map (Figure 3a).

55
(Fig. 4.7a); representing points within the conduit (+1), points representing the
granodiorite-conduit contact (0), and points within the granodiorite (-1). The resulting
model is expressed in three-dimensions as a flattened tube measuring up to 120 m wide
by at least 300 m long and constrained by exploration drilling to a depth of 1300 m (Fig.
4.7b), more-or-less corroborating previous descriptions of the Eagle’s Nest conduit (see
the discussion section of this Chapter; Mungall et al., 2010; Zuccarelli et al., 2017;
Barnes and Mungall., 2018).
The completed 3D geological model, spanning about 4.7 by 24.5 km to a depth of 1.6
km, comprises 12 3D-modelled surfaces representing the lithostratigraphic and tectonic
structures that define the internal geometry of the DEIC and BTIC and their surrounding
host rocks (Fig. 4.8). Although this model aims to identify the subsurface architecture of
the complexes, generalization of features and structures is unavoidable due to the
regional scale of the project and the available data. Therefore, it is important to note that
the ultramafic portions of the DEIC and BTIC were generalized and modelled as a
distinct volume of intrusive ultramafic rocks, not to be interpreted as a homogeneous
intrusion derived from a single magma pulse. Furthermore, the concentration of
exploration drilling along ore horizons within the ultramafic portions of the layered
intrusion leaves some surfaces poorly constrained (Table 4.1) and interpreted almost
exclusively from the high-resolution magnetic survey data (see Chapter 3). As a result,
this model represents one of several possible interpretations that could be made for the
DEIC and BTIC and the surrounding host rocks. Additional drilling in poorly constrained
areas (see Table 4.1) would yield a more comprehensive understanding of the complexes.

56
Figure 4.7. a) Drillhole curves displayed with the point dataset used to constrain the
Eagle’s Nest conduit during implicit modelling. Inset shows the weighted values of the
colour-coded points; -1 = points located within the granodiorite host rock, 0 = points
located along the intrusive contact, and +1 = points located within the ultramafic rock of
the conduit. b) Subsurface 3D geometry of the Eagle’s Nest conduit with approximate
dimensions.

57
Figure 4.8. Completed 3D model of the DEIC and BTIC. The red triangle defines the
location of the freeway triple junction. Inset shows close up of the Eagle’s Nest conduit
alongside two potential magmatic conduits (AT 5 and ‘Lobe 3’). MFSZ = McFaulds
Lake shear zone; FSZ = Frank shear zone; 3BSZ = 3B shear zone. Structures labeled 1, 2
and 3 refer to minor northwest-southeast trending brittle faults numbered from west to
east based on the updated geologic map (Figure 3a).

58
4.5 Discussion
The architecture of the 3D geological model of the DEIC and BTIC generally agrees with
previous interpretations of the regional scale tectonic and lithological structures in the
area (Metsaranta et al., 2015; Metsaranta and Houlé, 2017b). Diamond drillhole and
magnetic survey data provided over the course of this research has allowed for the
refinement of the respective 3D surfaces from this complex hard-rock setting, increasing
our understanding of the subsurface geometry of the intrusive complexes. The following
sections will discuss these geological insights.
As discussed in Chapter 3, the DEIC and BTIC are transected by a composite zone of
ductile southwest-northeast trending anastomosing shear zones. Along the southwestern
margin of the DEIC, sequences of bimodal metavolcanic rocks are present on either side
of the MFSZ (Fig. 4.8; see Chapter 3, Fig. 3.7) which is interpreted to have juxtaposed
the rocks of the Muketei assemblage (ca. 2735 Ma) with the much older rocks of the
Victory assemblage (ca. 2797-2780 Ma) south of the MLGB (Metsaranta et al, 2015). A
single U-Pb zircon date of 2782.2 ± 5.2 Ma from a sheared felsic interval within the
bimodal metavolcanics provides evidence for this relationship (J. Mungall, pers. comm,
2018; Metsaranta and Houlé, 2017b). Until now, the subsurface location of this interval
with respect to the MFSZ was unclear, however the 3D geological model confirms its
location just south of the shear zone (Fig. 4.9) corroborating previous interpretation that
the MFSZ is in fact a regional scale tectonic structure that has bound the Victory
assemblage to the southern margin of the Muketei assemblage (Metsaranta et al., 2015;
Metsaranta and Houlé, 2017b).
The main tectonic structure accommodating displacement within the DEIC is the FSZ

59
Figure 4.9. Location of the U-Pb age date for a felsic interval from drillhole NOT-08-
1G079 at 423.7-425 m (red point), indicating the presence of the Victory assemblage
south of the McFaulds Lake shear zone (MFSZ). MFSZ = McFaulds Lake shear zone;
FSZ = Frank shear zone.

60
(see Chapter 3). Previously referred to as the Triple J fault (Noront Resources Ltd.), the
geometry of the FSZ is of interest to exploration mining companies working in the area
as the focusing of hydrothermal fluid flow within the shear zone has resulted in
deposition of gold mineralization (Azar, 2008b; Karrei and Nelligan, 2010; unpublished
internal report: Noront Resources Ltd.). High-density drilling within the DEIC has left
the FSZ well-constrained between the Blackbird1 and Black Horse chromite deposits.
Drilling confirms the presence of the shear zone up to 1 km northeast of Black Horse, just
south of AT-5 (Fig. 4.8). The extension of the FSZ to the east, transecting the upper
lithological units of the DEIC, is substantiated by additional industry drillhole data
provided for this study. Limited drill log descriptions and drill core observations indicate
that the same lithostratigraphic sequence (ultramafic-mafic-metavolcanic-ferrogabbro-
tonalite) identified in both the DEIC and BTIC also exists between them as thinner
intervals. More importantly, this data reveals the presence of 30 m of highly sheared
ultramafic-talc schist, characteristic of the FSZ, located roughly 1 km west of the triple
junction. Akin to the FSZ, the entire sheared interval measures approximately 100 m
thick and overprints the intrusive ultramafic-mafic contact (drillhole FN-10-21 at a depth
of 220-312 m).
At depth, drillhole constraints are consistent with the surface interpretation presented in
Chapter 3 and provide additional support for the 2D restoration of the 1 to 1.5 km
displacement observed along the FSZ. As the throw of the FSZ has not yet been
determined, the same simple strike-slip relationships were considered during the
translation of lithological surfaces located in the footwall. The result is a 3D model in
which the DEIC and BTIC are connected by relatively linear, continuous intervals of

61
ultramafic-mafic rocks (Fig. 4.10a and b). This new geometry, although lacking the dip-
slip component in the restoration of the shear zone displacement, strongly suggests that
both complexes originally formed a single, connected ultramafic complex that was
dissected and displaced with an apparent dextral sense of shear. By returning the tilted
geometry of the restored complex to its original stratigraphic orientation, the boat-shaped
structure of the ultramafic sills is emphasized with downward dike-like keels (Fig. 4.10c;
Tuchscherer et al. 2010; Carson et al. 2015; Spath et al. 2015; Spath et al. 2017; Barnes
and Mungall, 2018), specifically within the BTIC. Between the DEIC and BTIC, the
geometry of the granodiorite-ultramafic contact resembles a possible high in the
granodiorite. Thinner sequences of ultramafic-mafic intervals in this area may have
resulted from pinching and swelling during ductile deformation along regional shear
zones. Along the eastern contact of the ultramafic-mafic intrusion in the BTIC, truncation
of the overlying bimodal metavolcanic unit (Fig. 4.11) indicates that active erosion and
assimilation of country rock (Laarman, 2014) were main processes involved during
magma emplacement (Barnes and Mungall, 2018).
Similar to most economic grade Ni-Cu-(PGE) deposits around the world (e.g., Voisey’s
Bay, Noril’sk, Jinchuan, Shurugwi; Naldrett 1997; Li et al., 2001; Maier et al., 2001;
Pendergast, 2008), the majority of the sulphide mineralization in the DEIC and BTIC is
primarily hosted in what appear to be magma conduits of the plumbing system, within the
Eagle’s Nest conduit (Mungall et al., 2010; Zuccarelli et al., 2017) and the Blue Jay
occurrence of the AT-12 keel (Houlé et al., 2015) respectively, as opposed to the
overlying layered intrusions. Sulphide segregation and therefore mineralization within
magmatic plumbing systems (as well as at the base of komatiite flows) is attributed to the

62
Figure 4.10. a) Top view showing the post-deformation spatial relationships of the
ultramafic-mafic intrusive contacts of the DEIC and BTIC visualized in their primary
horizontal orientation, consistent with the high-resolution magnetic data. b)
Reconstruction of the displacement observed along the FSZ highlighting the relatively
continuous lithostratigraphic contacts that appear to form a single ultramafic-mafic
layered intrusion at the time of emplacement. c) Perspective view showing the primary
orientation of the Eagle’s Nest conduit, as well as AT5 and ‘Lobe 3’, and their apparent
pre-deformation spatial relationship with the overlying layered intrusion. The top of the
mafic (gabbro) phase is highlighted in blue, followed by the top of the ultramafic phase
highlighted in pink and the basal contact of the intrusion with the granodiorite host rock
highlighted in orange.

63
Figure 4.11. 3D scene showing the truncation (white circles) of the overlying bimodal
metavolcanic unit (green) by the intrusive ultramafic (purple)-mafic (blue) phases of the
BTIC indicating processes of active erosion and assimilation during magma
emplacement. Lithostratigraphic units are listed from stratigraphic top to bottom (with
highlight colour): top of the ferrogabbro (light blue), top of the mafic (gabbro) phase
(blue), top of the ultramafic phase (pink) and, the basal contact of the intrusion with the
granodiorite host rock (orange).

64
contamination of the S-undersaturated komatiitic magma achieved through the
assimilation of sulfur-rich country rock (Lesher and Groves, 1986; Naldrett, 1999;
Spandler et al., 2005; Song et al., 2011).
Evidence for the assimilation of country rock in the Eagle’s Nest conduit is present along
its southern margin where thermal and thermomechanical erosion has led to stoping of
the conduit roof (Fig. 4.12a and b) and preferential widening of the side walls (Barnes
and Mungall, 2018; Barnes et al., 2015). Although the irregular lobate shape of the
conduit (Fig. 4.7b) is likely an artifact of radial basis interpolation during the implicit
modelling process (see Chapter 1), visualization of drill core intervals in 3D space do
suggest the presence of apophyses extending out from the dike-like intrusion. In addition,
the visualization of assay data with the modelled conduit confirms previous interpretation
by Mungall et al. (2010) and Zuccarelli et al., (2017), suggesting sulphide mineralization
is concentrated along the north-northwestern margin (basal edge) of the conduit (Fig.
4.13a). Therefore, similar to the blade-like dikes of the Raglan South – Expo intrusive
suite, the Eagle’s Nest conduit is interpreted to have been a laterally extensive blade-
shaped dike with a vertical intermediate axis at the time of emplacement (Barnes and
Mungall, 2018). Despite the abundance of local deformation observed along drillhole
intervals, preservation of chilled margins on both sides of the Eagle’s Nest conduit
suggests that the primary intrusive contact remains intact (Mungall et al., 2010). At
depth, drillhole constraints indicate narrowing of the conduit but its termination remains
to be mapped out in detail. Considering this, the 3D geometry of the FSZ, and their close
proximity in the subsurface, it is therefore likely that the conduit and the FSZ converge.
This requires that the continuation of Eagle’s Nest sulphides below the shear zone has

65
Figure 4.12. Drill core from drillhole NOT-08-039 showing (a) brecciated and partially
melted medium-grained clasts of granodiorite mingling with peridotite (549-552m) and,
(b) peridotite xenolith and granodiorite block within a fine-grained matrix (566m),
indicating stoping along the roof of the Eagle’s Nest conduit.

66
Figure 4.13. Perspective view of the Eagle’s Nest conduit (a) and AT12 “Blue Jay” (b)
with sulphur assay data (wt%) showing the concentration of sulphide mineralization
along the basal edge of both feeder dikes.

67
been displaced to an undetermined location within the footwall.
Approximately 10 km northeast of the Eagle’s Nest conduit is the AT12 “Blue Jay”
sulphide occurrence located in the northern tip of the downward dike-like keel structure
along the northern margin of the BTIC (Fig. 4.8 and 4.10a, b). Similar to the Jinchuan
(831.8 Ma; Chai and Naldrett, 1992; Li et al., 2005) and Huangshandong (ca. 0.28 Ga;
Han et al., 2004; Barnes and Mungall, 2018) intrusions in north-central and western
China respectively (likely associated with the accretion of allochthonous terranes during
the breakup of Rodinia), the geometry of the dike-like keel hosting “Blue Jay” is
interpreted to reflect the widening of a feeder dike into the overlying intrusion (Spath et
al., 2015; Spath et al., 2017). The occurrence of sulphide minerals within this structure
and around the base of the intrusion is likely due to the settling of dense sulphide liquids
during the slowing of magma flow as the dike/conduit widened into the main body
(Naldrett, 1997; Song et al., 2011; Fig. 4.13b and 4.14). Despite its distance from Eagle’s
Nest, the texture and composition of the intercepted sulphide mineralization at AT12 is
“effectively identical” to that observed within the Eagle's Nest magmatic conduit
(Mungall et al., 2010; Noront Reports AT12 Results 2010). Though drillhole markers
indicate that the granodiorite-ultramafic contact on either side of AT12 is close to vertical
at depth, exploration drilling has only constrained this geometry to a depth of 352 m. As a
result, its 3D subsurface geometry below this point may not be accurately represented.
However, considering the dike-like nature of the feeder, it is possible that the ultramafics
do not pinch out and that higher grade sulphide mineralization lies deeper within the
structure (Fig. 4.14). Interpreted as feeders to the overlying layered intrusion, the Eagle’s
Nest conduit and AT12 dike exhibit very similar orientations, having been emplaced at

68
Figure 4.14. Schematic of an idealized upper crustal portion of a magmatic plumbing
system after Barnes et al. (2015), illustrating the slowdown of crustal-contaminated and
sulfur-rich magma resulting in sulphide accumulations in the tips of blade-shaped dikes
and conduit necks due to density currents and backflow of magma.

69
high angles to the main intrusive body. Considering that steeply dipping, blade-like dikes
similar to Eagle’s Nest and AT12 typically occur in series during the intrusion of magma
into rift zones (Rubin and Pollard, 1988), it is possible that additional conduits
contributed to the formation of the complexes. Just northeast of Eagle’s Nest, two
irregular-shaped ultramafic lobes (AT5 and ‘Lobe 3’) define the basal contact of the
complex within granodiorite host rocks of the footwall (Figs. 4.8 and 4.10c). While a lack
of targeted drilling has left the subsurface structure of ‘Lobe 3’ entirely undefined, AT5
is poorly constrained by exploration drilling. This drilling of AT5 has yet to reveal
significant sulphide mineralization, though adcumulate to mesocumulate olivine grains
(4-6 mm) typical of conduits were observed (unpublished internal report: Noront
Resources Ltd.; Houlé, unpublished data). Moreover, when comparing the 3D subsurface
geometry and surficial expression of these lobes with those observed for Eagle’s Nest and
AT12, their analogous shape and orientation suggests that AT5 and ‘Lobe 3’ may
represent other magmatic conduits with the potential to host additional Ni-Cu-(PGE)
mineralization at depth (Fig. 4.10b and c).
Similar to many ultramafic-mafic intrusions hosting large Ni-Cu-(PGE) deposits (the
Great Dyke, Voisey’s Bay, Noril’sk, Jinchuan and Pechenga; Naldrett, 2004), the RoFIS
is interpreted to have been emplaced during intracontinental rifting (see Chapter 2),
where it is believed that deep regional faults permit the ascent of mantle-derived magma
(Song et al., 2011). The hypothesis that magma preferentially invades parallel fractures in
the wall rock along these deep structures, greatly influencing the shape of the intruding
bodies (Delaney et al., 1986; Rubin and Pollard, 1988; Song et al., 2011; Barnes et al.,
2015; Barnes and Mungall., 2018), may provide a plausible explanation for the parallel

70
orientation of dike-like feeder conduits within the DEIC and BTIC. Eagle’s Nest, AT5,
‘Lobe 3’ and AT12 appear to be emplaced laterally along the same northeast-southwest
strike plane. Their parallel orientation suggests they were intruded along regional fracture
planes where the dike-like feeders of the complexes likely represent the upper crustal
portion of a deeper sill-dike complex (Barnes et al., 2015). Additionally, the geometry of
the ultramafic unit in the DEIC shows minor offsets along the basal contact near these
blade-shaped feeder dikes (Fig. 4.10b and c), suggesting that these regional fracture
planes were acting as extensional faults during magma emplacement.
The present rudimentary reconstruction of deformation observed along the FSZ has led to
meaningful insights into the original architecture and spatial relationships of structures
and lithological units within the DEIC and BTIC. The 3D characterization of this
geometry, especially that of Eagle’s Nest and AT 12 has shed some light on the nature of
sulphide mineralization within the magmatic plumbing system (Fig. 4.13a, b and Fig.
4.14). However, since building the regional model required some generalization of
geologic structures, the detailed configurations of chromitite horizons hosted within the
ultramafic rocks of the complexes demanded additional 3D modelling at a smaller scale.
In Chapter 5, the modelling of the chromitite ore horizons is discussed and their detailed
geometry is examined in order to provide a better understanding of their spatial
relationships between the chromite mineralization and the ultramafic host rocks.

71
Chapter 5: 3D Chromite Model
5.1 Introduction
As previously discussed in Chapter 2, the bulk of chromite mineralization in the RoFIS
occurs within the number of world-class magmatic Cr-(PGE) deposits confined to the
ultramafic series of the BTIC (Black Label, Black Thor, Black Creek and Big Daddy;
Fig. 5.1b) and DEIC (Blackbird1, Blackbird2 and Black Horse; Fig. 5.1c). This
ultramafic series is composed of varying amounts of dunite, peridotite (±lherzolite) and
pyroxenite (±websterite) and is semi-continuous for roughly 15 km along strike with a
maximum apparent thickness of 1.5 km (Fig. 5.1a). The deposits consist of stratiform
chromitiferous zones that are characterized by numerous layers of varying mineralization
styles (e.g. very thinly laminated to very thickly bedded, lightly to heavily disseminated,
and interbedded massive to semi-massive chromitite) within predominantly
dunite/peridotite sequences (Spath, 2017). Previous work has been conducted in an
attempt to correlate chromitite layers, particularly for the Black Thor and Black Label
deposits, however individual layers proved very difficult to follow along strike (Carson et
al., 2015). In view of these complications, chromitite layers throughout both complexes
were generalized into two types of mineralization, massive and intercalated sequences,
based on Cr2O3 assay data. Sequences defined as massive chromitite are characterized as
having ≥35% Cr2O3 while intercalated sequences consist of ≥15% to ≤35% Cr2O3. On
account of these generalizations, it is important to note that individual horizons of
massive chromitite do not represent a single layer of massive chromitite but rather a
package of chromitite and chromite-rich cumulate layers that are correlated along strike

72
Figure 5.1. a) 2D scene depicting the surface geometry of 3D modelled surfaces
(faults/shear zones, lithostratigraphic contacts and chromitite horizons) for the BTIC (b)
and DEIC (c). Note that the geometry shown for the Black Horse and Blackbird1
chromite horizons are projected to the surface as they occur at depth in the footwall of the
FSZ. FSZ = Frank shear zone; MFSZ = McFaulds Lake shear zone; BH = Black Horse;
BB1 = Blackbird1; BB2 (A, B) = Blackbird2. Lithostratigraphic contacts are represented
by specific colours: top of the ultramafic phase (pink), the basal contact of the intrusion
with the granodiorite host rock (orange). Massive (red) and intercalated (green)
chromitite.
73
owing to their similar compositions and stratigraphic positioning. Additionally, in
instances where hole-to-hole correlations of massive chromitite intervals could not be
established with confidence, the intervals in question were amalgamated into the adjacent
intercalated layers. It is also important to recognize that within the intercalated sequences
no distinction has been made between uniformly disseminated chromite and intercalated
thin layers of chromitite and dunite. Since disseminated chromite may suffer from
metamorphic overgrowths of magnetite that make it unsuitable for smelting (e.g., Fig.
3.5), these domains would require more detailed examination for local structural and
textural features before they could be used in modeling of a mineral resource (Barnes,
2000).
5.2 Modelling the Chromitite Horizons
When modelling the DEIC and BTIC chromitite mineralization, design-based explicit
modelling techniques (see Chapter 1) were employed in an attempt to correlate horizons
along strike. This hands-on knowledge-driven approach can supply the geoscientist with
the freedom to build and shape surfaces to their interpretation but may also introduce a
significant amount of user bias.
In the case of the DEIC and BTIC, drill core has been logged by a number of individuals
(industry, government and student) that have utilized a variety of classification schemes
to describe units and intervals of chromite mineralization with varying degrees of
generalization. Many chromite mineralized FROM-TO intervals (e.g. massive,
disseminated, interbedded) in the drill logs are ambiguous, representing groups of layers
(e.g. interbedded, disseminated) classified based on the dominant mineralization style.

74
For example, a number of disseminated chromitite intervals are described as
heterogeneous, transitioning between lightly and heavily disseminated textures or
consisting of disseminated chromitite alternating with semi-massive beds. Furthermore,
some records are described solely as chromite and lack any further comment or
description.
As a result, the drill logs pertaining to chromite mineralization were not consistent
enough in order to model the horizons based on drill log descriptions alone. Therefore,
horizons were identified exclusively from Cr2O3 assay data. This was beneficial as the
visual-recognition of spatial patterns in the data facilitated the identification and
correlation of multiple chromite mineralized zones between drillholes at depth.
Explicit modeling methods, such as DSI and manual CAD methods (see Chapter 1),
provided the flexibility required in order to effectively generate and fit multiple 3D
triangulated surfaces to the drillhole constraints of horizon boundaries. However, a major
pitfall of this approach is that the interpretation of structures, especially in areas with
limited data, comes with an increasing level of uncertainty (Sprague and de Kemp, 2005).
As a means of reducing uncertainty when delineating mineralized zones, 3D surfaces
were generated only in areas where intervals of massive chromitite could be confidently
correlated between drillholes. Furthermore, as exploration drilling fails to fully constrain
many of the massive and intercalated chromitite zones in both complexes, the resulting
geometries of each chromitite horizon have been left open at depth implying their
continuation into the subsurface. Thus, in reality the ore zones may be more continuous
with larger lateral dimensions than what is implied by the 3D modelled surfaces.
Although the lateral and vertical continuity of the chromite horizons within the DEIC and
75
BTIC was difficult to ascertain, the modelling results presented in this Chapter allows us
to better assess their general geometry and orientation. Furthermore, examining the
geometry of the chromitite mineralization can also provide critical insights into the
formation of the ultramafic-mafic layered intrusions that host them.
5.3 Model Description
The 3D geometry of the chromitite model generally agrees with previous 2D
interpretations based on drill core observations (e.g., Carson et al., 2013, 2015; Spath,
2017; Houlé et al., 2019) and previous geological interpretation by industry partners
(Micon, 2009; Sibley Group, 2014; Sibley Group, 2015).
5.3.1 Black Thor Intrusive Complex
Within the BTIC, the ultramafic series can be divided into three distinct zones; a lower,
middle and upper zone. Chromite mineralization occurs within the middle and upper
zones of the ultramafic series (Chapter 2) and is hosted by the Big Daddy, Black Creek,
Black Thor and Black Label deposits (Fig. 5.1a, b). The Black Label chromite zone
(BLCZ), confined to the middle ultramafic series roughly 900 m above the AT12 feeder
dike, contains intercalations of very thinly laminated to very thickly bedded layers of
lightly disseminated to massive chromite (Spath, 2017). Hole-to-hole correlations of
these intervals, however, were difficult to establish due to brecciation of the BLCZ by the
late websterite intrusion (LWI), particularly in the core of the complex. As a result, the
BLCZ was delineated in 3D as a broad zone of intercalated chromite within
dunite/peridotite extending roughly 1.3 km along strike with a maximum thickness of 150

76
m (Fig. 5.1b).
Overlying the BLCZ approximately 200 m to the southeast are a number of chromitite
zones that comprise, from northeast to southwest, the Black Thor, Black Creek and Big
Daddy chromite deposits. Conformable with the geometry of their host intrusion, these
chromitite horizons are semi-continuous and can be broadly correlated for up to 5 km
along strike within the upper ultramafic series of the BTIC (Fig. 5.2a). These horizons
exhibit similar orientations striking northeast-southwest with sub-vertical dips ranging
from 81ᵒ NW to 65ᵒ SE. Discontinuities present between chromitite horizons of each
deposit, emphasized by a lack of exploration drilling, spatially correspond with the three
northwest-southeast trending brittle faults (Chapter 3, Fig. 3.8; Fig. 5.2a).
The Black Thor chromite zone (BTCZ) is the most extensive of these zones, spanning a
strike length of approximately 2.25 km with an observed thickness of up to 100 m. The
BTCZ is defined by 4 contiguous horizons of massive chromitite (horizons A-D; Fig.
5.2b) separated and underlain by sequences of intercalated chromite in dunite/peridotite
and overlain by sequences of pyroxenite and peridotite. Correlated down dip to depths of
at least 595 m (D), these chromite horizons appear to bifurcate along strike (horizons C
and D; Fig. 5.2b), splitting into two parallel seams divided by thin intervals of heavily
disseminated chromite in dunite and peridotite. Within the areas of discontinuity, the
massive chromitite horizons on either side appear to be sinistrally offset. To the
southwest, horizon D terminates, cut by a brittle fault (BrittleFault3; Fig. 5.1b). Assay
data does not indicate the immediate continuation of the horizon on the other side of the
fault. However, approximately 300 m southwest of BTCZ, mineralization continues in
the Black Creek deposit, followed by the Big Daddy deposit, roughly 400 m southwest of

77
Figure 5.2. a) 3D scene of modelled chromite horizons (Black Thor, Black Label, Black
Creek and Big Daddy) within the BTIC. b) Deconstructed 3D model of the Black Thor
chromitite zone (BTCZ) consisting of four distinct horizons (A-D). Green surfaces
represent zones of intercalated chromite while red surfaces represent zones of massive
chromite.

78
Black Creek (Fig. 5.1b).
The Black Creek deposit can be correlated along strike for up to 600 m, pinching out to
the northeast and thickening to the southwest (Fig. 5.3a). A thinner seam of massive
chromitite is present at depth above the main horizon to the southwest. Although
exploration drilling failed to constrain the geometry of the horizon up to the adjacent
brittle fault to the southwest (BrittleFault2; Fig. 5.1b), it is likely that the horizon
continues along strike until truncated by the brittle fault.
The Big Daddy chromitite consists of two horizons of massive chromitite; a smaller
horizon about 300 m long that pinches out to the northeast and southwest, and a larger
overlying horizon correlated roughly 1 km along strike and 390 m at depth (Fig. 5.1b and
5.3b). This main horizon is underlain by a conformable layer of intercalated chromite in
dunite/peridotite and overlain by pyroxenite. To the southwest, a brittle fault
(BrittleFault1) cuts this horizon where chromitite on either side of the fault appear to
exhibit sinistral offsets (Fig. 5.3b).
The sinistral-apparent sense of displacement observed within the BTCZ appears to be
analogous with that observed along the larger brittle faults within the BTIC that separate
the Black Thor, Black Creek and Big Daddy (Fig. 5.4). The variations in dip orientation
observed for chromitite horizons from one fault block to the next suggest that this series
of steeply dipping, northwest-southeast trending parallel brittle faults is the product of
late stage extensional imbricate or “bookshelf” faulting (Ferril et al., 1998).
5.3.2 Double Eagle Intrusive Complex
The ultramafic series of the DEIC, hosting the Blackbird1, Blackbird2 and Black Horse

79
Figure 5.3. 3D model of the Black Creek (a) and Big Daddy (b) chromite horizons.

80
Figure 5.4. 2D scene depicting the surface geometry of 3D modelled surfaces
(faults/shear zones, lithostratigraphic contacts and chromitite horizons) for the BTIC,
with inset of the Black Thor chromite zone (BTCZ), emphasizing sinistral-apparent
offsets observed for a series of parallel northwest-southeast trending brittle faults at the
local and regional scale. Note the appearance of bifurcations in horizons C and D of the
BTCZ. BF(1-3) = Brittle fault. Lithostratigraphic contacts are represented by specific
colours: top of the ultramafic phase (pink), the basal contact of the intrusion with the
granodiorite host rock (orange). Massive (red) and intercalated (green) chromitite.

81
chromite deposits (Fig. 5.1c and 5.5), is composed primarily of serpentinized and talc-
altered peridotite and dunite. Confined to the northwestern most edge of the complex, just
south of the FSZ, lies the Blackbird1 deposit. Consisting of a single layer of massive
chromitite approximately 25 m thick, this lens-shaped body dips 67ᵒ northwest to a depth
of 520 m (Fig. 5.6). Visualization of the Cr2O3 assay data in 3D space indicates that the
horizon is closed off at both its northern and southern ends as well as at depth. As
exploration drilling fails to constrain the upper portion of Blackbird1, the horizon was
modeled as an enclosed volume, however, the presence of a gravitational anomaly
(Mungall, 2009) suggests that Blackbird1 may continue to the surface.
About 750 m east of Blackbird1 is the Blackbird2 deposit. Overlain by thin sequences of
talc-altered pyroxenite, the Blackbird2 chromitite runs parallel to the ultramafic-mafic
intrusive contact and consists of two massive chromite horizons (BB2-A and BB2-B
dipping 76NW and 75NW respectively), aligned in the same northeast-southwest strike
plane (Fig. 5.1c and 5.5a, b). Closer inspection of the assay data revealed the presence of
a very thin (~2 m) layer of massive chromite that appears to connect both Blackbird2
horizons. However, due to significant differences in modelling scale, this thin chromitite
layer is not represented in the 3D model. Although exploration drilling has left this area
poorly constrained, the presence of this thin intercalated layer and the spatial alignment
of the Blackbird2 and Black Horse chromitite (Fig. 5.7a, b) strongly suggest the
connection of these horizons along strike. This connection is also discussed in NI 43-101
technical reports (Sibley Group, 2014; Sibley Group, 2015).
The Black Horse chromite deposit lies approximately 295 m at depth within the foot wall
of the FSZ (Fig. 5.5a, b). Of the several drillholes that intersect Black Horse only 4 were

82
Figure 5.5. 3D model of chromitite mineralization (Blackbird1, Blackbird2, Black Horse
and intercalated chromite layers) within the DEIC observed from the northwest (a) and
the southeast (b). FSZ = Frank shear zone; MFSZ; McFaulds Lake shear zone; BH =
Black Horse; BB1 = Blackbird1; BB2 (A, B) = Blackbird2.

83
Figure 5.6. 3D model (a) and composite slice image (b) of the Blackbird1 chromite
horizon.

84
Figure 5.7. 2D scene (a) depicting the surface geometry of 3D modelled surfaces
(faults/shear zones, lithostratigraphic contacts and chromitite horizons) in the DEIC and
3D model (b) of chromitite mineralization (Blackbird1, Blackbird2, Black Horse and
intercalated chromite layers) within the DEIC. The dashed yellow lines represent thin
intercalated layers of chromite mineralization connecting the Blackbird2 horizons with
the Black Horse chromitite. FSZ = Frank shear zone; MFSZ; McFaulds Lake shear zone;
BH = Black Horse; BB1 = Blackbird1; BB2 (A, B) = Blackbird2. Lithostratigraphic
contacts are represented by specific colours: top of the ultramafic phase (pink), the basal
contact of the intrusion with the granodiorite host rock (orange). Massive (red) and
intercalated (green) chromitite.

85
provided with Cr2O3 assay data, leaving the model of this deposit poorly constrained.
Down dip, the horizon appears to bifurcate into two horizons of massive chromite
increasing in thickness at depth. Despite having limited dip extent, the 3D visualization
of Cr2O3 assay data indicates that the Black Horse chromitite rakes up towards
Blackbird2 (BB2-A) in the form of a thin, continuous “belt” shaped layer running parallel
to the FSZ (Fig. 5.7a, b); a possible extension of the Blackbird2 chromitite (Sibley
Group, 2014; Sibley Group, 2015).
Additionally, between Blackbird1 and Blackbird2 there are three seemingly distinct
layers of intercalated chromite within the talc-altered peridotite. These intercalated layers,
though somewhat irregular in form, share similar orientations to the Blackbird2 horizons
(Fig. 5.5a, b). While the assay data does not indicate the termination of the intercalated
layers or the Blackbird2 horizons at depth, it does suggest that they become thinner with
increased vertical extent.
5.4 Geological Insights
As discussed in Chapter 4, the geometry of the DEIC and BTIC is interpreted to represent
a single sill-like ultramafic-mafic complex, possibly comprising multiple intrusive units,
that was dissected and displaced by post-ore deformation. Stratigraphically underlain by
multiple dikes interpreted as feeders to the sill-like portions, the true mode of
emplacement for the complexes and their respective chromite mineralization is still
unclear.
The fundamental issue concerning the genesis of chromite mineralization, specifically
within the BTIC, is how such large quantities of chromite could accumulate (Carson et

86
al., 2015). A number of hypotheses have been proposed for the formation of stratiform
chromitite in similar ultramafic-mafic layered complexes (e.g., Bushveld Complex, South
Africa; Stillwater Complex, USA), including: 1) the contamination of primitive magma
from the assimilation of felsic rocks or iron formation (Irvine, 1975; Rollinson, 1997), 2)
magma mixing (e.g., Campbell and Murck, 1993; Irvine, 1977), and 3) pressure increases
in the magma chamber (Lipin, 1993). However, these hypotheses alone are still unable to
adequately explain how such laterally extensive layers were formed (Jenkins and
Mungall, 2018).
When the primary mechanisms of a model are assumed to be fractional crystallization
and gravitational settling in a large closed magma chamber, magma thickness estimations
have concluded that large amounts of magma would be needed to produce relatively thin
layers of monomineralic massive chromitite. For example, Campbell and Murck (1993)
demonstrated that a 2-12.4 km thickness of magma would be needed in order to produce
a 1 m thick layer of massive chromitite in the Stillwater Complex while mass balance
calculated by Marques and Filho (2003) estimated that a magma thickness of more than
10 km was required for the formation of the main chromitite layer in the Ipueira-Medrado
sill in Brazil. Similarly, in the case of the Big Daddy chromite deposit of the BTIC,
Naldrett (2010) proposed that roughly 6 km of 0.2 wt% Cr magma would be needed in
order to generate a 20 wt% Cr mineralized zone that is 36 m thick. Therefore, considering
the thickness of the ultramafic-mafic complex (~500-1500 m) relative to the aggregate
thickness of the stratiform chromitite zones (~25-100 m) in the DEIC and BTIC,
significantly more magma would be required in order to produce the horizons than what
is currently observed in the system (Azar, 2010). Alternatively, open system behavior

87
was proposed (Lipin, 1993; Lipin and Zientek, 2001) as a means of rectifying the
discrepancies between observed and estimated magma thicknesses (based on mass
balance calculations). An open system allows material and energy to flow freely across
system boundaries (e.g. assimilation of country rock) and is now considered inherent in
most genetic models (Jenkins and Mungall, 2018). In fact, open system behavior has
already been suggested for the DEIC (Azar, 2010) and BTIC as the chromitite
mineralized zones appear to be hosted by smaller intrusions. These intrusions are
dominated by cumulates and interpreted to represent flow-through feeder sills and
magma conduits that are stratiform in structure and lenticular in shape (Carson et al.,
2013; Carson et al., 2015).
Akin to Ni-Cu-PGE mineralization (see Chapter 4), magma contamination by the
assimilation of country rock is frequently regarded as a critical process in the
precipitation and mineralization of chromitite in ultramafic-mafic intrusions as the
addition of silica and alkali minerals would suppress olivine crystallization and force the
melt into the chromite stability field (e.g., Irvine, 1975; Kinnaird et al., 2002; Spandler et
al., 2005; Mungall et al., 2016; Barnes and Mungall, 2018; Jenkins and Mungall, 2018).
Within the RoF, rare earth element (REE) trend analysis has demonstrated that the crustal
contamination of komatiitic magma is associated with the mineralization of chromitite in
the DEIC (Azar, 2010) and BTIC (Laarman, 2014). Furthermore, Laarman (2014)
indicated that within the BTIC, the degree of contamination varies between chromitite
deposits (Black Label, Black Thor, Black Creek and Big Daddy). Therefore, it was
proposed that the chromitites crystallized via mixing of a primitive magma with highly
contaminated magma in the magma chamber. This process would have seemingly

88
involved the intermittent pulsing and episodic pooling of primitive magma that mixed
with pyroxenite from the roof of the initial magma chamber under dynamic conditions,
driving the magma into chromite stability (Laarman, 2014; Irvine, 1977). Although a
possibility, fractionation of chromite from magma mixing would still require a significant
volume of melt and crystal settling in order to produce the chromite layers (Laarman,
2014). Additionally, layering within these deposits does not always conform to the
previously accepted cyclic unit model involving gravitational settling/in situ
crystallization (Jackson, 1961, 1963, 1970; Irvine, 1982). This is also observed in the
Stillwater complex where it is suggested that this kind of deviation from the cyclic unit
model may have actually resulted from separately injected batches of crystal-laden melt
that experienced varying degrees of contamination prior to emplacement (Jenkins and
Mungall, 2018). As previously discussed in Chapter 4, the geometry of the DEIC and
BTIC points to two known feeder conduits (Eagle’s Nest and AT-12; Fig. 4.8) as well as
two proposed feeders (AT-5 and ‘Lobe 3’; Fig. 4.8). Considering this new geometry, it is
not unreasonable to assume that each conduit/feeder dike represents an individual magma
pathway that may have imposed a slightly different degree of contamination for each
injected batch of through-flowing magma; similar to that proposed for the origin of the
Stillwater chromitite (Jenkins and Mungall, 2018).
Furthermore, stratiform chromitite was more recently suggested to have formed through
the mechanical sorting of crystals in magmatic slurries (Mondal & Mathez, 2006; Azar,
2010; Maier et al., 2012; Mungall et al., 2016). Jenkins and Mungall (2018) have
demonstrated, based on evidence from the Peridotite Zone of the Stillwater complex, that
a highly contaminated (20% Archean granodiorite and 1% iron formation) komatiitic

89
magma carrying 10-20% suspended crystals could form relatively thick seams of
monomineralic chromitite interlayered with dunite. During the lateral transportation of
crystal-rich magma, crystals settle into a cumulate pile in which chromite is separated
from silicate minerals through mechanical sorting as the residual magma exits the system.
This process requires only four times as much melt as cumulates to form relatively thick
chromitite layers; significantly less than previously proposed models (Jenkins and
Mungall, 2018). Likewise, Mondal and Mathez (2006) suggest that mechanical sorting
has contributed to the formation of the UG2 chromitite layer in the Bushveld complex.
Mechanical sorting in the Stillwater complex is supported by chromitite layers that
appear to bifurcate (similar bifurcations exist in the Bushveld complex; Pebane &
Latypov, 2017) and slump having graded and reverse-graded beds and lack of continuity
along strike; sedimentary-like features consistent with some form of bed-load transport
(Jenkins and Mungall, 2018). Similarly, it appears that bifurcations of chromitite layers
also exist in the BTCZ (Fig.5.4), based on the generalized geometry of the 3D geological
model. Furthermore, chromitite layering, particularly in Black Thor and Black Label,
lack lateral continuity being very difficult to follow along strike at a local scale and
appear to exhibit sill-like characteristics (thicker and lenticular in shape in the central part
of the intrusion above the feeder zone, but thinner and more sheet-like away from the
feeder; Fig. 5.1a, b, c; Carson et al., 2015). While the mechanism of mechanical
separation of chromite from silicate minerals cannot be definitively extrapolated from the
Stillwater or Bushveld complex to the BTIC, flow separation and crystal sieving
processes have already been proposed for the formation of the economically viable
chromite deposits of the DEIC (Azar, 2010).

90
While mechanical sorting is an attractive model for the formation of stratiform chromitite
in ultramafic-mafic layered intrusions, the formational relationship between the DEIC
and BTIC is still up for debate. As discussed in Chapter 4, the simple reconstruction of
deformation suggests that the ultramafic portions of both complexes were originally
connected prior to ductile deformation. Consequently, two possibilities exist: either the
complexes formed as a single connected volume that was tectonically dismembered, or as
two separate complexes derived from the same magmatic source that eventually
amalgamated over time through magma inflation or through sequential emplacement and
complete solidification of multiple injections of magma in the same place.
Considering the first possibility, one would anticipate that chromite mineralization would
form as a continuous or semi-continuous layer transgressing both the DEIC and BTIC.
When considering the geometry of the chromitite in relation to the reconstruction
presented in Chapter 3 and 4, chromitite horizons of both complexes appear to have very
similar orientations, broadly aligned along strike and, with the exception of the BLCZ,
generally lie at the same stratigraphic height (Fig. 5.8). Minimal drilling between the
complexes makes it difficult to determine whether a connection exists based on drill logs
and the 3D geometry alone. For instance, drill logs from 9 drillholes that intersect the
ultramafic portion of the DEIC within about 600 m northeast of Black Horse reveal the
presence of massive to semi-massive chromitite layers. Additionally, two drillholes (FN-
14-38 and FN-10-21) that intersect the narrow ultramafic sequence along the FSZ
extension reveal the existence of sheared intermittent chromitite (within 50 m from the
FSZ) to interbedded semi-massive and massive chromitite and disseminations in
peridotite. While this indicates that chromite mineralization occurs within the narrow

91
Figure 5.8. a) 2D scene depicting the current surface geometry of 3D modelled surfaces
(faults/shear zones, lithostratigraphic contacts and chromitite horizons) for the DEIC and
BTIC. b) Surface geometry of the same 3D modelled surfaces reconstructed for ductile
deformation along the FSZ. FSZ = Frank shear zone; MFSZ; McFaulds Lake shear zone;
BH = Black Horse; BB1 = Blackbird1; BB2 (A, B) = Blackbird2. Lithostratigraphic
contacts are represented by specific colours: Top of the mafic (gabbro) phase (blue), top
of the ultramafic phase (pink), the basal contact of the intrusion with the granodiorite host
rock (orange). Massive (red) and intercalated (green) chromitite.

92
ultramafic series between the complexes, implying that semi-continuous chromitite
extends across the DEIC (similar to BTIC chromitite), it does not provide sufficient
evidence to suggest that these mineralized zones are fragments of what was originally a
single continuous structure that transgressed both complexes.
Alternatively, if we believe that mechanical sorting was a primary mechanism in the
formation of chromitite in the BTIC and DEIC, it can be speculated that the complexes
were emplaced over time through multiple intrusions of highly contaminated primitive
magma. As hot komatiitic magma ascends from the mantle, it would assimilate crustal
rock and begin to cool, precipitating olivine, chromite and possibly orthopyroxene along
the way (Jenkins and Mungall, 2018). This low viscosity magma could have migrated
upwards along regional fracture planes (Chapter 4) until it began to move laterally along
the boundary between the granodiorite and overlying mafic dominated volcanic rocks. It
is possible that multiple conduits (i.e., Eagle’s Nest, AT5, ‘Lobe 3’ and AT12) delivered
small batches of crystal-laden melt from the same magmatic source to separate locations
along this horizontal interface. With sustained magma input over time, these injections of
magma could be emplaced above or below preexisting intrusions or interleaved between
them (Fig. 5.9). Ultimately, the accretion of these small sill-like intrusions would increase
the total apparent thickness of the intruded material, producing the thick ultramafic-mafic
packages observed for the DEIC and BTIC (see Chapter 3, Fig.3.8). Provided the
duration between distinct magma pulses is short enough and sufficient latent heat
remains, new injections may stay hotter for longer facilitating their lateral extension and
the eventual amalgamation of the ultramafic-mafic portions of the complexes (Magee et
al., 2016 and references therein). While evidence for the stacking and amalgamation of

93
Figure 5.9. Schematic diagram showing the dynamic emplacement of sill complexes and
coalescence of sills from separate feeder dikes. The emplacement of one intrusion may
facilitate the emplacement of another provided sufficient latent heat remains in the
system between injections (Annen et al., 2015; modified from Magee et al., 2016).

94
sill-like intrusions have not been observed in drillcore, the auto-intrusive contacts of
these intrusions would be relatively impossible to recognize due to the absence of
observable chilled margins along such hot erosive boundaries (Mungall et al., 2016).
95
Chapter 6: Summary and Conclusions
On the basis of the results presented in this thesis, the DEIC and BTIC are interpreted as
two intrusive complexes originating from the same magmatic source. It is likely that
these complexes were emplaced through multiple successive intrusions that eventually
coalesced to form a single connected ultramafic-mafic complex prior to being dissected
and dismembered by post-ore deformation.
The DEIC and BTIC are transected by a series of southwest-northeast trending
anastomosing shear zones interpreted from high-resolution aeromagnetic data as linear to
curvilinear magnetic lows. Late tectonic structures include:
• The Frank shear zone (FSZ), a steeply north-dipping tectonic structure that
displaces the main lithological units and ore zones in the DEIC.
• The 3B shear zone (3BSZ) appears to be connected to the FSZ forming a ‘zipper’
or ‘freeway’ triple junction. Consequently, the FSZ and 3BSZ are interpreted to
have originally developed as a single continuous structure that was later offset
along a newly developed splay; overprinting the ultramafic-mafic contact in the
DEIC and BTIC respectively.
• The McFaulds shear zone (MFSZ), another regionally significant tectonic
structure, has bound the Victory assemblage to the southern margin of the
Muketei assemblage just southwest of the Blackbird2 chromite deposit in the
DEIC.
• A series of late stage northwest-southeast striking brittle faults transect the
ultramafic-mafic portions of the BTIC. These structures resulted in minor

96
sinistral-apparent offsets and exhibit geometries consistent with an extensional
imbricate fault system.
With respect to the high-resolution magnetic data, the sigmoidal curvature of gabbro and
mafic dominated volcanic units in the large-scale map pattern strongly suggests a late
dextral apparent sense of shear with a minimum offset of 1.5 – 2 km along the FSZ.
Reconstruction of this displacement realigns the lobate ultramafic rocks in the hanging
wall of the DEIC with those in the footwall while also inferring that the contact between
the gabbro and the mafic dominated metavolcanics originally occurred as a continuous
structure transgressing both complexes. Rendition of this 2D reconstruction in 3D space
resulted in the alignment of the ultramafic-mafic portions of the DEIC with that of the
BTIC, strongly suggesting that the complexes evolved into a single, connected intrusive
complex prior to ductile deformation.
The examination of the 3D geometry of the region geological model and the chromitite
model has led to several conclusions about the structural disposition of the complexes
and their respective sulphide and chromite mineralization:
• Truncation of the mafic dominated metavolcanics observed along the eastern
contact in the BTIC indicates that active erosion and assimilation of country rock
were primary processes involved in the emplacement of the complexes.
• The dike-like keel at the base of the BTIC depicts the widening of the feeder dike
into the larger overlying intrusion.
• Eagle’s Nest is confirmed to be a minimally-deformed, laterally extensive blade-
shaped dike with sulphide mineralization concentrated along the basal (north-
northwestern) edge. The conduits proximity to the FSZ suggests that the Eagle’s

97
Nest sulphides likely continues at depth, displaced to an undetermined location
within the footwall of the FSZ.
• The feeder dikes (Eagle’s Nest, AT5, ‘Lobe 3’ and AT12) exhibit parallel
orientations that are likely a result of their emplacement along regional fracture
planes that were subsequently transposed by the main ductile deformation fabric.
Minor offsets observed near the blade-shaped feeder dikes suggest that these
fracture planes may have been acting as extensional faults at the time of magma
emplacement.
• Migration of primitive magma along multiple pathways (Eagle’s Nest, AT5,
‘Lobe 3’ and AT12) likely imposed a slightly different degree of contamination
for each injected batch of through-flowing magma. Variable contamination
provides a possible explanation for the disparate ore textures along the main
mineralized chromitite-bearing corridor.
• Drill logs indicate that chromite mineralization is present even within the narrow
ultramafic series between the complexes, however, there is insufficient evidence
to suggest that this mineralization was once a single continuous layer that
transgressed both the DEIC and BTIC, due to a lack of exploration drilling.
• Lack of lateral continuity and evidence for bifurcations of chromitite layers
suggest that mechanical sorting may have been a main mechanism responsible for
the formation of the thick, almost monomineralic layers of chromitite within the
BTIC and possibly the DEIC. This implies that the formation of chromitite within
an open system does not necessitate a staging chamber and can occur within

98
smaller sill-like conduits.
• Considering mechanical sorting for the formation of chromitite in the DEIC and
BTIC, the complexes may have been emplaced over time through multiple
intrusions of highly contaminated primitive magma. The accretion of these
intrusions increased the total apparent thickness of the intruded material resulting
in the thick successions of ultramafic-mafic layers observed in the DEIC and
BTIC.
Through the examination of the spatial relationships between the main shear zones and
the intrusive units of the DEIC and BTIC, the pre- and post-ore deformation geometries
of the complexes were evaluated. This activity has increased our understanding of the
magmatic plumbing system and provided insights in support of a single, connected
ultramafic complex dissected and transposed by ductile deformation.
This research could benefit from additional study in order to further our understanding of
this complex geologic setting and provide guidance for continued research and
exploration in the McFaulds Lake greenstone belt. For example: 1) a full kinematic
analysis of the faults and shear zones using oriented core to better understand the tectonic
history of the area, 2) detailed re-logging of chromite mineralization in drill core to
ensure consistency in drill log descriptions, and 3) conducting and analyzing seismic
surveys in 3D space to provide more detail of the tectonic and lithostratigraphic
structures with increasing depth.

99
References
Airo, M.L., 2002. Aeromagnetic and aeroradiometric response to hydrothermal
alteration. Surveys in Geophysics, 23(4), pp.273-302.
Azar, B.A. and Ferguson, S., 2012. Core Reference Booklet. Internal Noront Resources
Ltd. Report. Unpublished.
Azar, B.A., 2010. The Blackbird Chromite Deposit, James Bay Lowlands of Ontario,
Canada: Implications for Chromitite Genesis in Ultramafic Conduits and Open Magmatic
Systems. M.Sc. thesis, University of Toronto, p. 1-154.
Azar, B.A., 2008a. Petrographic Report of the Host Rocks of the Blackbird Deposits,
Ring of Fire, ON. Internal Noront Resources Ltd. Report. Unpublished.
Azar, B.A., 2008b. Petrographic Report of the Rocks of the Triple J “Zone” and Central
Claims, Ring of Fire, ON. Internal Noront Resources Ltd. Report. Unpublished.
Barnes, S.J. and Mungall, J.E., 2018. Blade-Shaped Dikes and Nickel Sulfide Deposits: A
Model for the Emplacement of Ore-Bearing Small Intrusions. Economic Geology, 113(3),
pp.789-798.
Barnes, S.J., Cruden, A.R., Arndt, N. and Saumur, B.M., 2016. The mineral system
approach applied to magmatic Ni–Cu–PGE sulphide deposits. Ore Geology Reviews, 76,
pp.296-316.
Barnes, S.J., 2000. Chromite in komatiites, II. Modification during greenschist to mid-
amphibolite facies metamorphism. Journal of Petrology, 41(3), pp.387-409.
Bédard, J.H. and Harris, L.B., 2014. Neoarchean disaggregation and reassembly of the
Superior craton. Geology, 42(11), pp.951-954.
Campbell, I. H. & Murck, B. W. (1993). Petrology of the G and H chromitite zones in the
Mountain View area of the Stillwater Complex, Montana. Journal of Petrology, 34(2),
pp.291-316.
Carson, H.J.E., Lesher, C.M., and Houlé, M.G. 2015. Geochemistry and petrogenesis of
the Black Thor intrusive complex and associated chromite mineralization, McFaulds
Lake greenstone belt, Ontario, In: Targeted Geoscience Initiative 4: Canadian Nickel-
CopperPlatinum Group Elements-Chromium Ore Systems — Fertility, Pathfinders, New
and Revised Models, (ed.) D.E. Ames and M.G. Houlé; Geological Survey of Canada,
Open File 7856, p. 87–102. Doi:10.4095/296674
Carson, H.J.E., Lesher, C.M., Houlé, M.G., Weston, R.J., and Shinkle, D.A. 2013.
Stratigraphy, geochemisty and petrogenesis of the Black Thor intrusive complex and
associated chromium and nickel-copper-platinum group element mineralization,
McFaulds Lake greenstone belt, Ontario. In: Summary of Field Work and Other
Activities 2013, (ed.) G.P. Beakhouse, R.M. Easton, A.F. Bajc, R.T. Metsaranta, O.M.
Burnham, S. Préfontaine, S.M. Hamilton, M. Duguet, F.R. Brunton, P.J. Barnett, R.D.
Dyer, J.R. Parker and E.J. Debicki; Ontario Geological Survey, Open File Report 6290,
p. 52-1 to 52-15.

100
Caumon, G., Antoine, C. and Tertois, A.L., 2007. Building 3D geological surfaces from
field data using implicit surfaces. In Proceedings of the 27th Gocad Meeting, Nancy (Vol.
6).
Chai, G. and Naldrett, A.J., 1992. The Jinchuan ultramafic intrusion: cumulate of a high-
Mg basaltic magma. Journal of Petrology, 33(2), pp.277-303.
de Kemp, E.A., Schetselaar, E.M., Hillier, M.J., Lydon, J.W. and Ransom, P.W., 2016.
Assessing the workflow for regional-scale 3D geologic modeling: An example from the
Sullivan time horizon, Purcell Anticlinorium East Kootenay region, southeastern British
Columbia. Interpretation, 4(3), pp.SM33-SM50.
de Kemp, E.A., 2015. Achieving Geologically Reasonable 3D Models, in: Saying
Goodbye to a 2D Earth International Conference on 3D Geological Modelling. Margaret
River, Western Australia, pp. 14–17.
Delaney, P.T., Pollard, D.D., Ziony, J.I. and McKee, E.H., 1986. Field relations between
dikes and joints: emplacement processes and paleostress analysis. Journal of Geophysical
Research: Solid Earth, 91(B5), pp.4920-4938.
Farhangi, N., Lesher, C.M., and Houlé, M.G. 2013. Mineralogy, geochemistry and
petrogenesis of nickel-copper-platinum group element mineralization in the Black Thor
intrusive complex, McFaulds Lake greenstone belt, Ontario, In: Summary of Field Work
and Other Activities 2013, (ed.) G.P. Beakhouse, R.M. Easton, A.F. Bajc, R.T.
Metsaranta, O.M. Burnham, S. Préfontaine, S.M. Hamilton, M. Duguet, F.R. Brunton,
P.J. Barnett, R.D. Dyer, J.R. Parker and E.J. Debicki; Ontario Geological Survey, Open
File Report 6290, p. 55-1 to 55-7.
Ferrill, D.A., Morris, A.P., Jones, S.M. and Stamatakos, J.A., 1998. Extensional layer-
parallel shear and normal faulting. Journal of Structural Geology, 20(4), pp.355-362.
Han, B., Ji, J., Song, B., Chen, L. and Li, Z., 2004. SHRIMP zircon U-Pb ages of
Kalatongke No. 1 and Huangshandong Cu-Ni-bearing mafic-ultramafic complexes, North
Xinjiang, and geological implications. Chinese Science Bulletin, 49(22), pp. 2424-2429.
Hillier, M.J., Schetselaar, E.M., de Kemp, E.A. and Perron, G., 2014. Three-dimensional
modelling of geological surfaces using generalized interpolation with radial basis
functions. Mathematical Geosciences, 46(8), pp.931-953.
Houlé, M.G., Lesher, C.M., Schetselaar, E., Metsaranta, R.T., and McNicoll, V.J., 2017a.
Architecture of magmatic conduits in Cr-(PGE)/Ni-Cu-(PGE) ore systems; in Targeted
Geoscience Initiative – 2016 Report of Activities, (ed.) N. Rogers; Geological Survey of
Canada, Open File 8199, p. 55–58.
Houlé, M.G., Lesher, C.M., McNicoll, V.J., and Bécu, V., 2017b. Ni-Cr Metallotect:
Synthesis, updates, and revised models for the Superior Province; in Targeted Geoscience
Initiative – 2016 Report of Activities, (ed.) N. Rogers; Geological Survey of Canada,
Open File 8199, p. 59-61. doi:10.4095/299573

101
Houlé, M.G., Lesher, C.M., McNicoll, V.J., Metsaranta, R.T., Sappin, A.-A., Goutier, J.,
Bécu, V., Gilbert, H.P., and Yang, X.M., 2015. Temporal and spatial distribution of
magmatic Cr-(PGE), Ni-Cu-(PGE), and Fe-Ti-(V) deposits in the Bird River–Uchi–
Oxford- Stull–La Grande Rivière–Eastmain domains: a new metallogenic province
within the Superior Craton, In: Targeted Geoscience Initiative 4: Canadian Nickel-
Copper-Platinum Group Elements-Chromium Ore Systems — Fertility, Pathfinders, New
and Revised Models, (ed.) D.E. Ames and M.G. Houlé; Geological Survey of Canada,
Open File 7856, p. 35–48.
Irvine, T.N., 1982. Terminology for layered intrusions. Journal of Petrology, 23(2),
pp.127-162.
Irvine, T.N., 1977. Origin of chromitite layers in the Muskox intrusion and other
stratiform intrusions: A new interpretation. Geology, 5(5), pp.273-277.
Irvine, T.N., 1976. Crystallization sequences in the Muskox intrusion and other layered
intrusions—II. Origin of chromitite layers and similar deposits of other magmatic ores.
In Chromium: its Physicochemical Behavior and Petrologic Significance (pp. 991-1020).
Pergamon.
Jackson, E.D., 1970. The cyclic unit in layered intrusions—a comparison of repetitive
stratigraphy in the ultramafic parts of the Stillwater, Muskox, Great Dyke, and Bushveld
Complexes. South Africa (ZAF), Geological Society of South Africa, Johannesburg,
South Africa (ZAF), pp.391-424.
Jackson, E.D., 1963. Stratigraphic and lateral variation of chromite composition in the
Stillwater Complex. Mineralogical Society of America Special Paper, 1, pp.46-54.
Jackson, E. D. (1961). Primary textures and mineral associations in the Ultramafic zone
of the Stillwater Complex, Montana. U.S. Geological Survey Professional Paper 358,
103.
Jenkins, M.C. and Mungall, J.E., 2018. Genesis of the Peridotite zone, Stillwater
Complex, Montana, USA. Journal of Petrology, 59(11), pp.2157-2189.
Karrei, L. and Nelligan, K., 2010. Summary of the Noront Resources Ltd. Triple J Gold
Zone Re-Sampling Program, Internal Noront Resources Ltd. Report. Unpublished.
Keays, R.R., 1995. The role of komatiitic and picritic magmatism and S-saturation in the
formation of ore deposits. Lithos, 34(1-3), pp.1-18.
Kinnaird, J.A., Kruger, F.J., Nex, P.A.M. and Cawthorn, R.G., 2002. Chromitite
formation—a key to understanding processes of platinum enrichment. Applied Earth
Science, 111(1), pp.23-35.
Kuzmich, B., Hollings, P., and Houlé, M.G., 2015. Petrogenesis of the ferrogabbroic
intrusions and associated Fe-Ti-V-(P) mineralization within the McFaulds greenstone
belt, Superior Province, northern Ontario, In: Targeted Geoscience Initiative 4: Canadian
Nickel-Copper-Platinum Group Elements Chromium Ore Systems — Fertility,
Pathfinders, New and Revised Models, (ed.) D.E. Ames and M.G. Houlé; Geological
Survey of Canada, Open File 7856, p. 101–109.

102
Laarman, J.E. 2014. A detailed metallogenic study of the McFaulds Lake chromite
deposits, northern Ontario; Ph.D. thesis, University of Western Ontario, London, Ontario,
529 p.
Laudadio, A.B., Schetselaar, E., Houlé, M.G., and Samson, C., 2018a. 3D geological
modelling of the Double Eagle – Black Thor intrusive complexes, McFaulds Lake
greenstone belt, Ontario; in Targeted Geoscience Initiative: 2017 report of activities,
volume 2, (ed.) N. Rogers; Geological Survey of Canada, Open File 8373, p. 35–41.
http://doi.org/10.4095/306599
Laudadio, A.B., Schetselaar, E.M., Houlé, M.G. and Samson, C., 2018b. 3D geological
modelling of the Double Eagle – Black Thor intrusive complexes, McFaulds Lake
greenstone belt, Ontario, Canada. Poster presented at: Prospectors and Developers
Association of Canada; PDAC-SEG Student Minerals Colloquium. Mar 4-7; Toronto,
ON.
Laudadio, A.B., Schetselaar, E.M., Houlé, M.G., and Samson, C., 2017. 3D geological
modelling of the Double Eagle – Black Thor intrusive complexes, McFaulds Lake
greenstone belt, Ontario, Canada; Abstract, PDAC-SEG Student Minerals Colloquium,
Prospectors and Developers Association of Canada, Toronto, Ontario http://cmic-
footprints.ca/ smc/2017 [accessed February 11, 2018].
Lesher, C.M. and Groves, D.I., 1986. Controls on the formation of komatiite-associated
nickel-copper sulfide deposits. In Geology and metallogeny of copper deposits (pp. 43-
62). Springer, Berlin, Heidelberg.
Li, X.H., Su, L., Chung, S.L., Li, Z.X., Liu, Y., Song, B. and Liu, D.Y., 2005. Formation
of the Jinchuan ultramafic intrusion and the world's third largest Ni‐Cu sulfide deposit:
Associated with the ∼ 825 Ma south China mantle plume? Geochemistry, Geophysics,
Geosystems, 6(11).
Li, C.S., Naldrett, A.J., Ripley, E.M., 2001. Critical factors for the formation of a nickel-
copper deposit in an evolved magma system: lessons from a comparison of the Pants
Lake and Voisey’s Bay sulfide occurrences in Labrador, Canada. Mineralium Deposita
36 (1), 85–92.
Lindsay, M.D., Jessell, M.W., Ailleres, L., Perrouty, S., de Kemp, E. and Betts, P.G.,
2013. Geodiversity: Exploration of 3D geological model space. Tectonophysics, 594,
pp.27-37.
Lipin, B. R. & Zientek, M. L. (2001). The Stillwater Complex, The root of a flood basalt
province? Geological Society of America Abstracts 1–3.
Lipin, B.R., 1993. Pressure increases, the formation of chromite seams, and the
development of the ultramafic series in the Stillwater Complex, Montana. Journal of
Petrology, 34(5), pp.955-976.
Magee, C., Muirhead, J.D., Karvelas, A., Holford, S.P., Jackson, C.A., Bastow, I.D.,
Schofield, N., Stevenson, C.T., McLean, C., McCarthy, W. and Shtukert, O., 2016.
Lateral magma flow in mafic sill complexes. Geosphere, 12(3), pp.809-841.

103
Maier, W.D., Barnes, S.J. and Groves, D.I., 2013. The Bushveld Complex, South Africa:
formation of platinum–palladium, chrome-and vanadium-rich layers via hydrodynamic
sorting of a mobilized cumulate slurry in a large, relatively slowly cooling, subsiding
magma chamber. Mineralium Deposita, 48(1), pp.1-56.
Maier, W.D., Li, C. and De Waal, S.A., 2001. Why are there no major Ni–Cu sulfide
deposits in large layered mafic-ultramafic intrusions?. The Canadian Mineralogist, 39(2),
pp.547-556.
Mallet, J.L., 2004. Space–time mathematical framework for sedimentary
geology. Mathematical geology, 36(1), pp.1-32.
Mallet, J.L., 1997. Discrete modeling for natural objects. Mathematical geology, 29(2),
pp.199-219.
Mallet, J.L., 1992. Discrete smooth interpolation in geometric modelling. Computer-
aided design, 24(4), pp.178-191.
Marques, J.C. and Filho, C.F.F., 2003. The chromite deposit of the Ipueira-Medrado sill,
Sao Francisco craton, Bahia state, Brazil. Economic Geology, 98(1), pp.87-108.
Mehrmanesh, K., Carson, H.J.E., Lesher, C.M., and Houlé, M.G. 2013. Stratigraphy,
geochemistry and petrogenesis of the Black Label chromitite horizon, Black Thor
intrusive complex, McFaulds Lake greenstone belt, Ontario, In: Summary of Field Work
and Other Activities 2013, (ed.) G.P. Beakhouse, R.M. Easton, A.F. Bajc, R.T.
Metsaranta, O.M. Burnham, S. Préfontaine, S.M. Hamilton, M. Duguet, F.R. Brunton,
P.J. Barnett, R.D. Dyer, J.R. Parker and E.J. Debicki; Ontario Geological Survey, Open
File Report 6290, p. 53-1 to 53-6.
Metsaranta, R.T., and Houlé, M.G. 2017a. Precambrian geology of the Winiskisis
Channel area, “Ring of Fire ” region, Ontario— northern sheet; Ontario Geological
Survey, Preliminary Map P.3804; Geological Survey of Canada, Open File 8200, scale
1:100 000. doi: 10.4590/299708
Metsaranta, R.T., and Houlé, M.G. 2017b. Precambrian geology of the McFaulds Lake
area, “Ring of Fire ” region, Ontario— central sheet; Ontario Geological Survey,
Preliminary Map P.3805; Geological Survey of Canada, Open File 8201, scale 1:100 000.
doi:10.4095/299711
Metsaranta, R.T., and Houlé, M.G. 2017c. Precambrian geology of the Highbank Lake
area, “Ring of Fire ” region, Ontario— central sheet; Ontario Geological Survey,
Preliminary Map P.3806; Geological Survey of Canada, Open File 8202, scale 1:100 000.
doi:10.4095/299712
Metsaranta, R.T., Houlé, M.G., McNicoll, V.J., and Kamo, S.L. 2015. Revised geological
framework for the McFaulds Lake greenstone belt, Ontario, In: Targeted Geoscience
Initiative 4: Canadian Nickel-Copper-Platinum Group Elements-Chromium Ore Systems
— Fertility, Pathfinders, New and Revised Models, (ed.) D.E. Ames and M.G. Houlé;
Geological Survey of Canada, Open File 7856, p. 61–73.

104
Metsaranta, R.T. and Houlé, M.G. 2013. An update on regional bedrock geology
mapping in the McFaulds Lake (“Ring of Fire”) region; in Summary of Field Work and
Other Activities 2013, Ontario Geological Survey, Open File Report 6290, p.50-1 to 50-
12.
Metsaranta, R.T. and Houlé, M.G., 2012. Progress on the McFaulds Lake (“Ring of
Fire”) Region Data Compilation and Bedrock Geology Mapping Project. In: Summary of
Field Work and Other Activities 2012, (ed.) G.P. Beakhouse, R.D. Dyer, R.M. Easton,
O.M. Burnham, B.R. Berger, A.F. Bajc, S. Préfontaine, S.M. Hamilton, F.R. Brunton,
J.R. Parker and E.J. Debicki; Ontario Geological Survey, Open File Report 6280, p. 43-1
to 43-12.
Mondal, S.K. and Mathez, E.A., 2006. Origin of the UG2 chromitite layer, Bushveld
Complex. Journal of Petrology, 48(3), pp.495-510.
Micon International Limited, Technical Report on the Mineral Resource Estimate for the
Blackbird Chrome Deposits, James Bay Lowlands, Northern Ontario, Canada, effective
date December 31, 2009.
Montsion, R., 2017. 3D Regional Geological Modelling in Structurally Complex
Environments: Gaining Geological Insight for the Northern Labrador Trough (Master’s
Thesis, Université d'Ottawa/University of Ottawa).
Mungall, J.E., Kamo, S.L. and McQuade, S., 2016. U–Pb geochronology documents out-
of-sequence emplacement of ultramafic layers in the Bushveld Igneous Complex of
South Africa. Nature Communications, 7, p.13385.
Mungall, J.E., Harvey, J.D., Balch, S.J., Azar, B., Atkinson, J. and Hamilton, M.A. 2010.
Eagle’s Nest: A Magmatic Ni-Sulfide Deposit in the James Bay Lowlands, Ontario,
Canada. In: The Challenge of Finding New Mineral Resources: Global Metallogeny,
Innovative Exploration, and New Discoveries Volume II: ZincLead, Nickel-Copper-PGE,
and Uranium. Society of Economic Geologists Special Publication Number 15, pp. 539-
557.
Mungall J.E., 2009. Report on the Double Eagle Exploration Project. Internal Noront
Resources Ltd. Report. Unpublished.
Murahwi, C., San Martin, A.J., Gowans, R.M. and Spooner, J., 2012. Technical report on
the updated mineral resource estimate for the Blackbird chrome deposits McFaulds Lake
property, James Bay Lowlands, Ontario, Canada. NI 43-101. Toronto, On. Available at:
http://norontresources.com/wp-
content/uploads/2014/10/pdf/3%20Blackbird%20NI%2043-
101%20Technical%20Report.pdf (Accessed: April, 2017).
Naldrett, A.J., 2010. Secular variation of magmatic sulfide deposits and their source
magmas. Economic Geology, 105(3), pp.669-688.
Naldrett, A.J., 2004. Magmatic Sulfide Deposits: Geology, Geochemistry and
Exploration. Springer, New York, pp. 1-730
Naldrett, A.J., and Lightfoot, P.C., 1999, Ni-Cu-PGE deposits of the Noril’sk region,
Siberia: Their formation in conduits for flood basalt volcanism: Geological Association
of Canada Short Course 13, pp. 195–249.

105
Naldrett, A.J., 1997. Key factors in the genesis of Noril'sk, Sudbury, Jinchuan, Voisey's
Bay and other world‐class Ni‐Cu‐PGE deposits: Implications for exploration. Australian
Journal of Earth Sciences, 44(3), pp.283-315.
Noront Resources Ltd., 2015. Annual Information Form, April 2, 2015. Available at:
http://norontresources.com/wp-content/uploads/2015/04/Noront-2014-AIF-Final-April-2-
2015.pdf (Accessed: April, 2017).
Noront Reports AT12 Results, 2010, Noront Resources Ldt., viewed 2 September 2018,
< http://norontresources.com/noront-reports-at12-results/>
Ontario Geological Survey-Geological Survey of Canada, 2011. Ontario airborne
geophysical surveys, gravity gradiometer and magnetic data, grid and profile data (ACSII
and Geosoft® formats) and vector data, McFaulds Lake area; Ontario Geological Survey,
Geophysical Data Set 1068.
Passchier, C.W. and Platt, J.P., 2017. Shear zone junctions: Of zippers and
freeways. Journal of Structural Geology, 95, pp.188-202.
Passchier, C.W. and Trouw, R.A., 2005. Microtectonics. Springer Science & Business
Media.
Pebane, M. and Latypov, R., 2017. The significance of magmatic erosion for bifurcation
of UG1 chromitite layers in the Bushveld Complex. Ore Geology Reviews, 90, pp.65-93.
Percival, J.A., Skulski, T., Sanborn-Barrie, M., Stott, G.M., Leclair, A.D., Corkery, M.T.
and Boily, M., 2012. Geology and tectonic evolution of the Superior Province,
Canada. Tectonic Styles in Canada: The LITHOPROBE Perspective. Edited by JA
Percival, FA Cook, and RM Clowes. Geological Association of Canada Special
Paper, 49, pp.321-378.
Prendergast, M.D., 2008. Archean komatiitic sill-hosted chromite deposits in the
Zimbabwe craton. Economic Geology, 103(5), pp. 981-1004.
Rainsford, D.R.B., Diorio, P.A., Hogg, R.L.S., and Metsaranta, R.T., 2017. The use of
geophysics in the Ring of Fire, James Bay Lowlands – The chromite story, in:
Proceedings of Exploration 17: Sixth Decennial International Conference on Mineral
Exploration, (ed.) V. Tschirhart and M.D. Thomas; p. 649-662.
Rollinson, H., 1997. The Archean komatiite-related Inyala chromitite, southern
Zimbabwe. Economic Geology, 92(1), pp.98-107.
Rubin, A.M. and Pollard, D.D., 1988. Dike-induced faulting in rift zones of Iceland and
Afar. Geology, 16(5), pp.413-417.
Salem, A., Williams, S., Fairhead, J.D., Ravat, D. and Smith, R., 2007. Tilt-depth
method: A simple depth estimation method using first-order magnetic derivatives. The
Leading Edge, 26(12), pp.1502-1505.

106
Sappin, A.-A., Houlé, M.G., Lesher, C.M., Metsaranta, R.T., and McNicoll, V.J., 2015.
Regional characterization of mafic-ultramafic intrusions in the Oxford-Stull and Uchi
domains, Superior Province, Ontario, In: Targeted Geoscience Initiative 4: Canadian
Nickel-Copper-Platinum Group ElementsChromium Ore Systems — Fertility,
Pathfinders, New and Revised Models, (ed.) D.E. Ames and M.G. Houlé; Geological
Survey of Canada, Open File 7856, p. 75–85.
Schetselaar, E., Pehrsson, S., Devine, C., Lafrance, B., White, D. and Malinowski, M.,
2016. 3-D geologic modeling in the Flin Flon mining district, Trans-Hudson orogen,
Canada: Evidence for polyphase imbrication of the Flin Flon-777-Callinan volcanogenic
massive sulfide ore system. Economic Geology, 111(4), pp.877-901.
Schetselaar, E.M., de Kemp, E.A., Ransom, P., Buenviaje, R., Nguyen, K., Montsion, R.,
and Joseph, J., 2015. 3D Drillhole Database of the Purcell Anticlinorium, British
Columbia, Geological Survey of Canada, Open File 7817, 1 .zip file. doi:10.4095/297050
Schetselaar, E.M., 2013. Mapping the 3D lithofacies architecture of a VMS ore system on
a curvilinear-faulted grid: A case study from the Flin Flon mining camp, Canada. Ore
Geology Reviews, 53, pp. 261-275.
Schetselaar, E., Pehrsson, S., Devine, C., Currie, M., White, D. and Malinowski, M.,
2010. The Flin Flon 3D Knowledge Cube, Geological Survey of Canada, Open File 6313,
p. 35.
Schulte, R.F., Taylor, R.D., Piatak, N.M., and Seal, R.R., II, 2010. Stratiform chromite
deposit model: U.S. Geological Survey Open-File Report 2010–1232, 7 p., available at
http://pubs.usgs.gov/ofr/2010/1232.
Scott Hogg & Associates Ltd., 2014. Operations and processing report, Heli-GT, 3 axis
magnetic gradient survey, Eagle’s Nest northern Ontario. Prepared for: Noront Resources
Ldt. August 20, 2014.
Sibley Group Geological Consulting Services Limited, NI 43-101 Technical Report,
Black Thor, Black Label and Big Daddy chromite deposits, McFaulds Lake Area,
Ontario, Canada, effective date July 27, 2015.
Sibley Group Geological Consulting Services Limited, NI 43-101 Technical Report, Big
Daddy chromite deposit McFaulds Lake Area, Ontario, Canada, effective date November
12, 2014.
Song, X., Wang, Y. and Chen, L., 2011. Magmatic Ni-Cu-(PGE) deposits in magma
plumbing systems: Features, formation and exploration. Geoscience Frontiers, 2(3),
pp.375-384.
Spandler, C., Mavrogenes, J. and Arculus, R., 2005. Origin of chromitites in layered
intrusions: Evidence from chromite-hosted melt inclusions from the Stillwater
Complex. Geology, 33(11), pp.893-896.
Spath III, C.S., 2017. Geology and genesis of hybridized ultramafic rocks in the black
label hybrid zone of the black thor intrusive complex, McFaulds Lake Greenstone Belt,
Ontario, Canada (Master’s Thesis, Laurentian University of Sudbury).

107
Spath, C.S. III, Lesher, C.M., and Houlé, M.G., 2015. Hybridized ultramafic rocks in the
Black Label hybrid zone of the Black Thor intrusive complex, McFaulds Lake greenstone
belt, Ontario, In: Targeted Geoscience Initiative 4: Canadian Nickel-Copper-Platinum
Group Elements-Chromium Ore Systems — Fertility, Pathfinders, New and Revised
Models, (ed.) D.E. Ames and M.G. Houlé; Geological Survey of Canada, Open File
7856, p. 103–114.
Spath, C.S. III, Lesher, C.M., and Houlé, M.G., 2013. Geology and genesis of mobilized
chromitite in the Black Label pyroxenite zone of the Black Thor intrusive complex,
McFaulds Lake greenstone belt, Ontario, In: Summary of Field Work and Other
Activities 2013, (ed.) G.P. Beakhouse, R.M. Easton, A.F. Bajc, R.T. Metsaranta, O.M.
Burnham, S. Préfontaine, S.M. Hamilton, M. Duguet, F.R. Brunton, P.J. Barnett, R.D.
Dyer, J.R. Parker and E.J. Debicki; Ontario Geological Survey, Open File Report 6290,
p. 54-1 to 54-7.
Sprague, K.B., de Kemp, E.A., 2005. Interpretive tools for 3-D structural geological
modelling part II: Surface design from sparse spatial data. Geoinformatica 9, 5–32.
doi:10.1007/s10707-004-5620-8
Stott, G.M., Corkery, M.T., Percival, J.A., Simard, M., and Goutier, J., 2010. A revised
terrane subdivision of the Superior Province, In: Summary of Field Work and Other
Activities 2010; Ontario Geological Survey, Open File Report 6260, p. 20-1 to 20-10.
Tominaga, M., Beinlich, A., Lima, E.A., Tivey, M.A., Hampton, B.A., Weiss, B. and
Harigane, Y., 2017. Multi-scale magnetic mapping of serpentinite carbonation. Nature
communications, 8(1), p.1870.
Tuchscherer, M.G., Hoy, D., Johnson, M., Shinkle, D., and Holmes, M., 2010. Fall 2008
to winter 2009 technical drill report on the Black Thor chromite deposit-Black Label
chromite zone and associated Ni-Cu-PGEs, McFaulds Lake property, James Bay
Lowlands, Northern Ontario; Internal technical report, Freewest Resources Canada Inc.,
filed February 2010, 57 p.
Weston, R. and Shinkle, D.A. 2013. Geology and stratigraphy of the Black Thor and
Black Label chromite deposits, James Bay Lowlands, Ontario, Canada, In: Proceedings;
12th Biennial SGA Meeting, Uppsala, Sweden, August 12–15, 2013, p. 1069–1071.
Zuccarelli, N., Lesher, C.M., and Houlé, M.G., 2018. Sulphide textural variations and
multiphase ore emplacement in the Eagle’s Nest Ni-Cu-(PGE) deposit, McFaulds Lake
greenstone belt, Ontario; in Targeted Geoscience Initiative: 2017 report of activities,
volume 2, (ed.) N. Rogers; Geological Survey of Canada, Open File 8373, p. 29–34.
https://doi.org/10.4095/306598
Zuccarelli, N., Lesher, C.M., Houlé, M.G., and Weston, R.J., 2017. Sulfide textural
variations and multiphase ore emplacement in the Eagle’s Nest Ni-Cu-PGE deposit,
McFauld’s Lake greenstone belt, Ontario, Canada; Proceedings of Mineral Resources to
Discover: 14th SGA Biennial Meeting, v. 2, p. 583–586.