
3838958
23
Bank Competition and Access to Finance: International Evidence Author(s): Thorsten Beck, Asli Demirgüç-Kunt and Vojislav Maksimovic Source: Journal of Money, Credit and Banking, Vol. 36, No. 3, Part 2: Bank Concentration and Competition: An Evolution in the Making A Conference Sponsored by the Federal Reserve Bank of Cleveland May 21-23, 2003 (Jun., 2004), pp. 627-648 Published by: Ohio State University Press Stable URL: http://www.jstor.org/stable/3838958 . Accessed: 29/04/2014 18:44 Your use of the JSTOR archive indicates your acceptance of the Terms & Conditions of Use, available at . http://www.jstor.org/page/info/about/policies/terms.jsp . JSTOR is a not-for-profit service that helps scholars, researchers, and students discover, use, and build upon a wide range of content in a trusted digital archive. We use information technology and tools to increase productivity and facilitate new forms of scholarship. For more information about JSTOR, please contact [email protected]. . Ohio State University Press is collaborating with JSTOR to digitize, preserve and extend access to Journal of Money, Credit and Banking. http://www.jstor.org This content downloaded from 202.43.95.117 on Tue, 29 Apr 2014 18:44:03 PM All use subject to JSTOR Terms and Conditions
-
Upload
muhammad-irka-irfa-d -
Category
Documents
-
view
213 -
download
0
Transcript of 3838958

Bank Competition and Access to Finance: International EvidenceAuthor(s): Thorsten Beck, Asli Demirgüç-Kunt and Vojislav MaksimovicSource: Journal of Money, Credit and Banking, Vol. 36, No. 3, Part 2: Bank Concentration andCompetition: An Evolution in the Making A Conference Sponsored by the Federal ReserveBank of Cleveland May 21-23, 2003 (Jun., 2004), pp. 627-648Published by: Ohio State University PressStable URL: http://www.jstor.org/stable/3838958 .
Accessed: 29/04/2014 18:44
Your use of the JSTOR archive indicates your acceptance of the Terms & Conditions of Use, available at .http://www.jstor.org/page/info/about/policies/terms.jsp
.JSTOR is a not-for-profit service that helps scholars, researchers, and students discover, use, and build upon a wide range ofcontent in a trusted digital archive. We use information technology and tools to increase productivity and facilitate new formsof scholarship. For more information about JSTOR, please contact [email protected].
.
Ohio State University Press is collaborating with JSTOR to digitize, preserve and extend access to Journal ofMoney, Credit and Banking.
http://www.jstor.org
This content downloaded from 202.43.95.117 on Tue, 29 Apr 2014 18:44:03 PMAll use subject to JSTOR Terms and Conditions
THORSTEN BECK
ASLI DEMIRGUC-KUNT VOJISLAV MAKSIMOVIC
Bank Competition and Access to Finance:
International Evidence
Using a unique database for 74 countries and for firms of small, medium, and large size we assess the effect of banking market structure on the access of firms to bank finance. We find that bank concentration increases obstacles to obtaining finance, but only in countries with low levels of economic and institutional development. A larger share of foreign-owned banks and an efficient credit registry dampen the effect of concentration on financing obstacles, while the effect is exacerbated by more restrictions on banks' activities, more government interference in the banking sector, and a larger share of government-owned banks.
JEL codes: G30, G10, 016, K40 Keywords: financial development, financing obstacles,
small and medium enterprises, bank concentration, bank competition.
WHILE THE RECENT empirical literature provides empirical evidence on the positive role of the banking sector in enhancing economic growth through more efficient resource allocation, less emphasis has been put on the structure of the banking system.1 Theory makes conflicting predictions about the relation
1. For cross-country studies on finance and growth, see Beck, Levine, and Loayza (2000), Rousseau and Wachtel (2001), and Wurgler (2000). Demirgtiu-Kunt and Maksimovic (1998) and Rajan and Zingales (1998) show the importance of financial development for industry and firm growth.
This paper's findings, interpretations, and conclusions are entirely those of the authors and do not necessarily represent the views of the World Bank, its Executive Directors, or the countries they represent. We would like to thank Agnes Yaptenco for assistance with the manuscript, Arturo Galindo and Margaret Miller for sharing their data on credit registries with us, and Emre Ergungor, Robert Hauswald, Patrick Honohan, Michel Robe, Greg Udell, an anonymous referee, the editor, and participants at the Fedesarrollo seminar in Cartagena, seminar participants at the American University, the Bank Concentration and Competition Conferences at the World Bank and the Federal Reserve Bank of Cleveland for useful comments.
THORSTEN BECK is a senior economist, Finance Team, Development Research Group, The World Bank. E-mail: [email protected] ASLI DEMIRGUC-KUNT is a research manager, Finance Team, Development Research Group, The World Bank. E-mail: ademirguckunt@ worldbank.org VOJISLAV MAKSIMOVIC is a Bank of America Professor of Finance, Robert H. Smith School of Business at the University of Maryland. E-mail: [email protected]
Received May 29, 2003; and accepted in revised form May 29, 2003.
Journal of Money, Credit, and Banking, Vol. 36, No. 3 (June 2004, Part 2) Published in 2004 by The Ohio State University Press.
This content downloaded from 202.43.95.117 on Tue, 29 Apr 2014 18:44:03 PMAll use subject to JSTOR Terms and Conditions

628 : MONEY, CREDIT, AND BANKING
between bank market structure and the access to and cost of credit. While general economic theory points to inefficiencies of market power, resulting in less loans supplied at a higher interest rate, information asymmetries and agency problems might result in a positive or nonlinear relation between the market power of intermediaries and the amount of loans supplied to opaque borrowers in a dynamic setting. Similarly, empirical studies have derived conflicting results; most of these studies, however, focus on a specific country, mostly the U.S.
This paper explores the impact of bank competition on firms' access to credit for a cross-section of 74 developed and developing countries. Specifically, we use survey data on the financing obstacles perceived by firms and relate these data to the competitive environment in the country's banking market. We use both the market share of the largest three banks and regulatory policies that influence the competitive framework in which banks operate, such as share of bank license applications rejected and restrictions on banks' activities. We control for the ownership structure and the institutional environment. We assess the impact of the market structure on firms of different sizes, while at the same time controlling for a large number of other firm characteristics.
Our results indicate that in more concentrated banking markets, firms of all sizes face higher financing obstacles. This effect decreases as we move from small to medium and large firms. Further, there seems to be an important interaction between bank concentration, on the one side, and regulatory and institutional country charac- teristics and the ownership structure of the banking system, on the other side. The relation of bank concentration and financing obstacles turns insignificant in countries with high levels of GDP per capita, well-developed institutions, an efficient credit
registry, and a high share of foreign banks. Public bank ownership, a high degree of
government interference in the banking system, and restrictions on banks' activities, on the other hand, exacerbate the impact of bank concentration on financing obstacles.
Our results provide evidence for theories that focus on the negative effects of bank market power on access to credit, especially for developing countries. For the most part, the results are not consistent with theories that predict a positive impact of bank concentration on alleviating financing obstacles for small firms and allowing them access to credit. Our findings underline the importance of taking into account the institutional and regulatory framework when assessing the impact of bank concentration on firm's financing obstacles, thus broadening the focus to the competitive and regulatory environment in which banks operate. They also stress the importance of regulations, institutions, and ownership structure for policy makers who are interested in alleviating financing obstacles. For example, removing activity restrictions in a concentrated banking system alleviates the negative impact of bank concentration on access to finance.
This paper makes several contributions to the literature. First, while most empirical papers assessing the effect of bank concentration focus on a specific country, mostly the U.S., this paper uses cross-country analysis, including developed, developing, and transition economies. Given the specific regulatory and institutional development
This content downloaded from 202.43.95.117 on Tue, 29 Apr 2014 18:44:03 PMAll use subject to JSTOR Terms and Conditions

THORSTEN BECK, ASLI DEMIRGUO-KUNT, AND VOJISLAV MAKSIMOVIC : 629
of the U.S., a cross-country approach is important for drawing conclusions for policy makers in developing countries.
Second, to our knowledge this is the first paper using firm-level data to evaluate the effect of market structure on firms' financing obstacles across a broad cross- section of countries and firms of different sizes.2 Large parts of the theoretical literature on bank concentration has focused on small and young firms, so that being able to differentiate firms by size is important in testing these theories. We use firm- level data from 74 countries from the World Business Environment Survey (WBES), a major cross-sectional firm level survey, which includes the assessment of growth obstacles as perceived by firms of different sizes. The detailed information provided about the firms and the inclusion of small and medium-size firms makes this data- base unique.
Third, unlike previous studies we can exploit cross-country variance not only in bank concentration but also in the regulatory environment and the ownership struc- ture of the banking sector. We are thus able to take a broader perspective on the competitive environment of the banking market by including measures of the share of bank license applications rejected, restrictions on bank's activities and the ownership structure. We use data from Barth, Caprio, and Levine (2001).
This paper is related to three other recent papers. Cetorelli and Gambera (2001) show that industries that depend more on external finance grow relatively faster in more concentrated banking sectors, while the overall effect of bank concentration on growth is negative. However, while they can exploit the variance across industries in term of dependence on external finance, they cannot exploit variance in the size of firms as in this paper. Beck, Demirgiic-Kunt, and Maksimovic (2001a) explore the effects of financing and legal obstacles as well as corruption on firm growth, using the WBES database. They find that firms that report higher obstacles grow more slowly. This effect is stronger for small firms but is dampened in countries with higher levels of financial and institutional development. Here we focus on financing obstacles and explore how the structure of the banking market affects them. Finally, our paper is closely related to a recent paper using similar data by Clarke, Cull, and Martinez Peria (2001) that assesses the impact of foreign bank ownership on financ- ing obstacles and the share of investment financed with bank finance. They find that a larger foreign bank presence decreases financing obstacles and increases the share of investment financed with bank finance, results that are robust to controlling for bank concentration and regulatory entry restrictions. However, because their study focuses on the impact of foreign penetration on access to credit, they neither explore whether concentration impacts large and small firms differently nor do they explore whether the impact is different in countries at different levels of institutional development.
The remainder of the paper is organized as follows. Section 1 discusses the motivation and theoretical underpinnings of our empirical analysis. Section 2 pres- ents the data, and Section 3 describes the econometric methodology. Section 4 discusses the results and Section 5 concludes.
2. As discussed below, Clarke, Cull, and Martinez-Peria (2001) include concentration in their firm- level analysis but focus on the effects of foreign bank entry.
This content downloaded from 202.43.95.117 on Tue, 29 Apr 2014 18:44:03 PMAll use subject to JSTOR Terms and Conditions

630 : MONEY, CREDIT, AND BANKING
1. MOTIVATION
Theory makes contradictory predictions about the effects of bank concentration on the supply and cost of loans. On the one side, standard economic theory predicts that market power results in a lower supply at a higher cost, thus reducing firm growth (we refer to this prediction as the structure-performance hypothesis). On the other side, taking into account informational asymmetries and agency costs leads to theories that predict a positive or nonlinear relation between market power and access to loans for opaque borrowers in a dynamic setting. We refer to this set of theories as the information-based hypothesis. This section will discuss the different theories and the existing empirical literature.3
Standard economic theory suggests that any deviation from perfect competition results in less access by borrowers to loans at a higher cost (structure-performance hypothesis). Using an endogenous growth model, Pagano (1993) interprets the ab- sorption of resources, resulting in a savings-investment ratio of less than one, and thus the spread between lending and deposit rates as reflecting "the X-inefficiency of the intermediaries and their market power." Guzman (2000) shows that a banking monopoly is more likely to result in credit rationing than a competitive banking market and leads to a lower capital accumulation rate.
Informational asymmetries between lender and borrower, resulting in adverse selection, moral hazard, and hold-up problems, however, may change the relation between market structure and access to loans from a negative to a positive or nonlinear one, as shown in several theoretical contributions. Petersen and Rajan (1995) show that banks with market power have more incentives to establish long- term relationships with young borrowers, since they can share in future surpluses. Similarly, Marquez (2002) shows that borrower-specific information becomes more disperse in more competitive banking markets, resulting in less efficient borrower screening and most likely in higher interest rates. Dinq (2000), on the other hand, shows that there is an inverted U-shaped relation between the amount of relationship lending and the number of banks, with an intermediate number of banks able to sustain the maximum amount of relationship lending. Similarly, Cetorelli and Peretto (2000) show that there are offsetting effects of bank concentration. While bank concentration reduces the total amount of loanable funds, it increases the incentives to screen borrowers and thus the efficiency of lending. The optimal banking market structure is thus an oligopoly rather than a monopoly or perfect competition.
However, all these models assume a high degree of enforcement of contracts and of the capacity of banks to screen potential borrowers and do not model differences in the legal and institutional environments in which banks operate. These assumptions are theoretically important and empirically relevant. The positive relation between market power and lending to small and young borrowers might only hold if lenders are able to recover their collateral in case of failure and if they are able to screen the
3. See also Cetorelli (2001a) for an overview about the empirical and theoretical literature on bank concentration.
This content downloaded from 202.43.95.117 on Tue, 29 Apr 2014 18:44:03 PMAll use subject to JSTOR Terms and Conditions

THORSTEN BECK, ASLI DEMIRGU,C-KUNT, AND VOJISLAV MAKSIMOVIC : 631
borrowers beforehand. Recent empirical literature has established a relation between availability and cost of loans and the legal and informational environment in which lenders and borrowers operate.4 These findings suggest that institutions might affect the relation between market structure and access to loans.
The regulatory structure of the banking system might have important implications for the relation between market concentration and access to finance. High regulatory entry barriers might reduce the contestability and thus competitiveness of the banking system, independent of the actual market structure. Regulatory restrictions and government interference in the intermediation process, on the other hand, do not have a priori clear relation with the competitiveness of the banking system and borrowers' access to finance. These restrictions might decrease the competitiveness and efficiency in the banking system and impede banks from using their informational advantages. Restricting banks in their activities, however, might also increase their competition in the area they are limited to.
The ownership structure of banks might also influence the relation between market power and access to and costs of external financing. Domestically owned banks might have more information and better enforcement mechanisms than foreign- owned banks and so might be more willing to lend to opaque borrowers.5 Gov- ernment-owned banks are mostly nonprofit-maximizing and often have the explicit mandate to lend to certain groups of borrowers.6 The relation between bank concen- tration and access to loans might therefore differ across different ownership structures.
Most empirical studies of the effect of bank concentration on access to external finance and firm growth have focused on individual countries and mostly the U.S. Hannan (1991) finds strong evidence that concentration is associated with higher interest rates across U.S. banking markets. Similarly, Black and Strahan (2002) find evidence across U.S. states that higher concentration results in less new firm forma- tion, especially in states and periods with regulated banking markets. Petersen and Rajan (1995), on the other hand, find that small firms are more likely to receive financing at a lower cost in more concentrated local banking markets in the U.S. DeYoung, Goldberg, and White (1999) find across local U.S. banking markets that concentration affects small business lending positively in urban markets and negatively in rural markets. Jackson and Thomas (1995) find a positive effect of bank concentration across U.S. states on the employment growth rate of new firms in manufacturing industries, and a negative effect on the employment growth rate of mature firms.7 Finally, using survey data from a panel of small U.S. firms, Scott
4. For the importance of legal institutions for firm and industry growth and creation of new establish- ments see Beck and Levine (2002), Demirgiiu-Kunt and Maksimovic (1998), Rajan and Zingales (1998), and Claessens and Laeven (2003). Jappelli and Pagano (2002) show empirically the importance of information sharing between intermediaries for financial development.
5. There is mixed evidence on the effects of foreign bank entry on small borrowers' access to finance. Compare the survey by Clarke et al. (2003) and the literature quoted therein.
6. La Porta, Lopez-de-Silanes, and Shleifer (2002), however, show that bank lending is more concentrated in banking systems that are dominated by government-owned banks.
7. Using data for Italian provinces, Bonaccorsi di Patti and Dell'Ariccia (2003) and Bonaccorsi di Patti and Gobbi (2001) also find a nonlinear relation between concentration and growth and firm financing.
This content downloaded from 202.43.95.117 on Tue, 29 Apr 2014 18:44:03 PMAll use subject to JSTOR Terms and Conditions
632 : MONEY, CREDIT, AND BANKING
and Dunkelberg (2001) find that a Herfindahl index of bank concentration is not robustly correlated with the availability and cost of credit, while a firm-based assessment of the competitive environment is.
Cetorelli and Gambera (2001) use industry-level data for 41 countries and find that while bank concentration imposes a deadweight loss on the overall economy, it fosters the growth of industries whose younger firms depend heavily on external finance. However, this positive effect is offset in banking systems that are heavily dominated by government-owned banks. Using a similar model, Cetorelli (2001b), however, shows that financially dependent industries are more concentrated in coun- tries with more concentrated banking systems.
Overall, both theoretical and empirical contributions yield contradictory conclu- sions. The structure-performance hypothesis predicts a negative relation between bank concentration and access to credit, while the information-based hypothesis predicts a positive or nonlinear relation. Further, the relation might vary for firms of different sizes and across different institutional environments and ownership structures of the banking system. Using a panel data set of both developed and developing countries and of firms of different sizes, we will therefore test:
1. Is bank concentration positively or negatively related to financing obstacles? 2. Does the relation between concentration and financing obstacles vary across
firms of different sizes? 3. Does the relation between concentration and financing obstacles vary across
different regulatory regimes, ownership structures, and institutional environments?
2. DATA AND SUMMARY STATISTICS
This section describes the different data sources and the variables we will be using in the empirical analysis. Our empirical analysis uses data from three main sources: the WBES for firm-level data, BankScope for our main concentration indica- tor, and Barth, Caprio, and Levine (2001) for country-level data on bank ownership structure and regulatory measures. Table 1 presents the country-level variables for the 74 developed and developing countries in our sample. Descriptive statistics and correlations are given in Table 2.8
The WBES firm-level data consist of firm survey responses of over 10,000 firms in 80 countries, both developed and developing. The survey has a large number of questions on the business environment in which firms operate including assessment of growth obstacles firms face. The database also includes information on ownership, firm sales, industry, growth, financing patterns, and number of competitors.
We use survey responses on to what extent entrepreneurs perceive finance as an obstacle to growth. To explore the link between bank market structure and the financing obstacles we use the survey question: "How problematic is financing for the operation and growth of your business?" Answers vary between 1 (no obstacle),
8. Detailed definitions and sources of the data are available in an appendix, available on request.
This content downloaded from 202.43.95.117 on Tue, 29 Apr 2014 18:44:03 PMAll use subject to JSTOR Terms and Conditions

TABLE 1
BANKING MARKET STRUCTURE AND OBSTACLES TO FIRM GROWTH
General financing Concen- GDP per Fraction Banking Credit Institutional Private Public Foreign obstacle tration capita Restrict denied freedom registry development credit bank share bank share Countries
Argentina 3.03 0.34 8001 Armenia 2.65 0.88 844 Azerbaijan 2.86 0.96 408 Belarus 3.28 0.81 2235 Belize 2.69 1.00 2738 Bolivia 3.04 0.46 939 Botswana 2.34 0.90 3546 Brazil 2.71 0.40 4489 Bulgaria 3.13 0.66 1418 Cameroon 3.07 0.91 631 Canada 2.07 0.54 20,549 Chile 2.43 0.46 4992 China 3.34 0.80 677 Colombia 2.68 0.32 2381 Costa Rica 2.51 0.66 3641 Cote d'Ivoire 2.81 0.90 763 Croatia 3.34 0.58 3846 Czech Republic 3.13 0.61 5163 Dominican Republic 2.58 0.61 1712 Ecuador 3.34 0.67 1538 Egypt 3.00 0.57 1108 El Salvador 2.87 0.68 1706 Estonia 2.49 0.85 3664 Ethiopia 2.97 0.97 109 France 2.76 0.27 27,720 Georgia 3.23 0.81 411 Germany 2.54 0.32 30,794 Ghana 3.07 0.75 393 Guatemala 2.97 0.26 1503 Haiti 3.48 0.97 369 Honduras 2.85 0.41 708 Hungary 2.67 0.51 4706 India 2.54 0.35 414 Indonesia 2.86 0.39 1045 Italy 2.11 0.27 19,646 Kazakhstan 3.17 0.81 1313 Kenya 2.84 0.54 339 Lithuania 2.88 0.86 1907 Madagascar 3.13 0.95 238 Malawi 2.74 0.94 154 Malaysia 2.65 0.36 4536 Mexico 3.40 0.63 3393 Moldova 3.44 0.76 666 Namibia 1.91 0.79 2325 Nicaragua 3.17 0.41 447 Nigeria 3.14 0.50 254 Pakistan 3.28 0.63 503 Panama 2.18 0.22 3124 Peru 3.04 0.46 2335 Philippines 2.68 0.36 1125 Poland 2.41 0.51 3216 Portugal 1.73 0.43 11,582 Romania 3.30 0.83 1365 Russia 3.22 0.38 2214 Senegal 3.00 0.78 563
7 0.00 3.80 0.60 3.00 2.00
13 0.00 3.00 0.69 3.00
12 1.00 3.60 0.59 10 0.00 3.80 10 0.74 3.00 0.83
3.00 2.20
7 0.00 4.00 11 1.00 3.00 0.65 14 0.25 3.00
4.00 0.53 3.00 0.80 3.00
7 3.00 0.56 8 0.36 5.00
3.00 0.49 3.00 0.49
13 1.00 3.40 13 0.00 4.00 8 0.00 4.00 0.65
2.00 6 0.00 3.00
2.00 5 0.00 3.60 0.45
12 0.80 3.00 13 0.30 3.60 0.56
1.60 0.44 9 0.20 3.00 9 0.50 3.80
10 0.55 2.00 14 1.00 2.80 10 0.27 3.60 0.51
2.00 10 0.85 3.60 9 0.67 2.75
2.00 13 0.00 3.00 10 1.00 3.00 0.07 12 2.00 0.51 7 0.60 2.60
11 0.67 4.00 2.80
0.00 2.20 3.40
8 0.00 5.00 0.49 8 0.00 4.00 0.63 7 0.00 3.00
10 0.00 3.00 9 0.00 3.00 0.40
13 0.38 3.00 8 3.60 0.38
3.00 0.15
0.33 0.21 30.00 -0.43 0.04 -0.78 -0.76 0.06 67.30
0.41 0.02 0.51 0.00 0.56 0.11 2.39 0.00 0.32 51.50 0.01 0.14
-0.72 0.14 1.43 0.83 0.00 0.88 0.68 11.70
-0.20 0.85 -0.41 0.36
0.81 0.15 -0.19 0.26
0.03 0.00 36.99 0.68 0.58 19.00
-0.11 0.24 -0.32 0.30 -0.15 0.33 66.60 -0.03 0.36 7.00
0.61 0.16 0.00 -0.12 0.21
1.03 0.84 -0.61
1.37 1.06 42.00 -0.14 0.05 37.90 -0.51 0.18 7.61 -1.14 0.12 -0.43 0.26 1.10
0.87 0.22 2.50 0.00 0.21 80.00
-0.77 0.52 44.00 0.91 0.57 17.00
-0.53 -0.78 0.34
0.26 0.11 44.00 -0.38 0.13 -0.17 0.11 48.90
0.51 1.30 0.00 -0.07 0.22 25.00 -0.20 0.06 7.05
0.47 0.38 -0.41 0.31 -1.00 0.08 13.00 -0.59 0.23
0.11 0.78 11.56 -0.18 0.18 2.50
0.21 0.50 12.12 0.70 0.12 43.70 1.20 0.73 20.80
-0.08 0.09 70.00 -0.54 0.08 68.00 -0.30 0.21
49.00
2.80
42.30 97.61 16.70
32.00
6.67 26.00
4.20 12.50 85.00
4.20 54.30 4.93
1.60 62.00 0.00 7.00 5.00
48.00
8.30 18.00 19.90 33.37
0.00
38.33 40.40 12.79 26.40 11.70 8.00 9.00
(Continued)
This content downloaded from 202.43.95.117 on Tue, 29 Apr 2014 18:44:03 PMAll use subject to JSTOR Terms and Conditions

634 : MONEY, CREDIT, AND BANKING
TABLE 1
CONTINUED
General financing Concen- GDP per Fraction Banking Credit Institutional Private Public Foreign
Countries obstacle tration capita Restrict denied freedom registry development credit bank share bank share
Singapore 1.85 0.60 25,374 8 1.00 4.00 1.44 1.11 0.00 50.00 Slovakia 3.31 0.65 3805 3.00 0.28 0.30 Slovenia 2.29 0.60 10,226 9 1.00 4.00 0.85 0.26 39.60 4.60 South Africa 2.45 0.67 3920 8 0.33 3.00 0.11 1.18 0.00 5.20 Spain 2.24 0.47 15,858 7 0.00 3.60 0.16 1.10 0.79 0.00 11.00 Sweden 1.89 0.72 28,258 9 0.08 3.60 0.61 1.53 0.82 0.00 1.80 Tanzania 3.00 0.77 182 3.00 -0.13 0.09 Thailand 3.11 0.56 2835 9 1.00 3.00 0.43 0.15 1.46 30.67 7.16 Trinidad & Tobago 3.03 0.70 4526 9 0.50 4.00 0.59 0.40 15.00 7.90 Tunisia 1.69 0.48 2200 3.60 0.30 0.60 Turkey 3.13 0.54 3007 12 4.00 0.29 -0.33 0.16 35.00 6.00 Uganda 3.13 0.56 324 3.00 -0.34 0.04 Ukraine 3.45 0.57 867 2.20 0.48 -0.58 0.01 United Kingdom 2.25 0.40 20,187 5 5.00 1.50 1.16 0.00 United States 2.33 0.18 29,253 12 0.00 4.00 0.83 1.30 1.84 0.00 4.70 Uruguay 2.72 0.72 6114 3.80 0.51 0.57 0.27 Venezuela 2.49 0.53 3471 10 0.00 3.20 0.49 -0.37 0.10 4.87 33.72 Zambia 2.71 0.76 394 13 0.00 4.00 -0.20 0.06 23.00 64.00 Zimbabwe 3.03 0.62 693 3.00 -0.53 0.29
NOTES: General financing obstacle is the response to the question "How problematic is financing for the operation and growth of your business?" Answers vary between 1 (no obstacle), 2 (minor obstacle), 3 (moderate obstacle), and 4 (major obstacle). Concentration is the share of the largest three banks in total banking assets. GDP per capita is real GDP per capita in US$. Restrict is an indicator of the degree to which banks' activities are restricted outside the credit and deposit business. Fraction denied is the share of bank license applications rejected. Banking freedom is a general indicator of the absence of government interference in the banking sector. Credit registry is an aggregate indicator of the information available through credit registries. Institutional development is an average of six indicators measuring voice and accountability, control of corruption, regulatory quality, political stability, rule of law, and government efficiency. Private credit is claims on the private sector by financial institutions as share of GDP. Public bank share is the share of assets in banks that are majority state owned. Foreign Bank Share is the share of assets in banks that are majority foreign owned. Detailed variable definitions and sources are given in the appendix, available on request.
2 (minor obstacle), 3 (moderate obstacle), and 4 (major obstacle). Table 1 shows that perceived financing obstacles do not only vary across firms within a country but also significantly across countries. Portuguese firms rate financing obstacles as less than minor (1.73), while firms in Haiti rate financing obstacles as more than moderate (3.48). Overall, 38% of all firms in the sample report financing as major obstacle, 27% as moderate obstacle, 17% as minor, and 18% as no obstacle.
Using data based on self-reporting by firms may produce concerns that a firm's
response might be driven by the economic, institutional, and cultural environment in the country. However, if this were pure measurement error, it would bias the results against finding a relation between banking market structure and firms' financ-
ing obstacles. Further, there is evidence that these survey responses do indeed capture financing obstacles. First, Hellman et al. (2000) show that in a subsample of 20
countries, there is a close connection between responses and measurable outcomes.
They find no systematic bias in the survey responses. Second, Beck, Demirgiic- Kunt, and Maksimovic (2001a) show that reported firm financing obstacles are
highly, negatively correlated with firm growth, even after controlling for many firm and country characteristics and using instrumental variables to control for endogen- eity. Finally, firms report higher financing obstacles in countries with higher net
This content downloaded from 202.43.95.117 on Tue, 29 Apr 2014 18:44:03 PMAll use subject to JSTOR Terms and Conditions
THORSTEN BECK, ASLI DEMIRGUi-KUNT, AND VOJISLAV MAKSIMOVIC : 635
interest margins, an indicator of the availability of credit and the efficiency of the
banking system.9 We control for several firm attributes such as ownership. Government takes on
the value one if the firm is owned by the government, and Foreign takes on the value one if the firm is foreign owned. Our sample includes 13% government-owned firms and 18% foreign firms. We include dummy variables for exporting firms, the
manufacturing and service sector, as well as the log of the number of competitors. Thirty-six percent of the firms in our sample are in manufacturing and 45% in service, and on average they face 2.4 competitors. Finally, we include the log of sales in USD as indicator of size, which ranges from -2.12 to 25.3, with an average of 9.6. The correlation analysis in Table 2 (panel B) indicates that government-owned firms, domestically owned firms, nonexporting firms, smaller firms (as measured by sales), and firms with more competitors face higher financing obstacles.
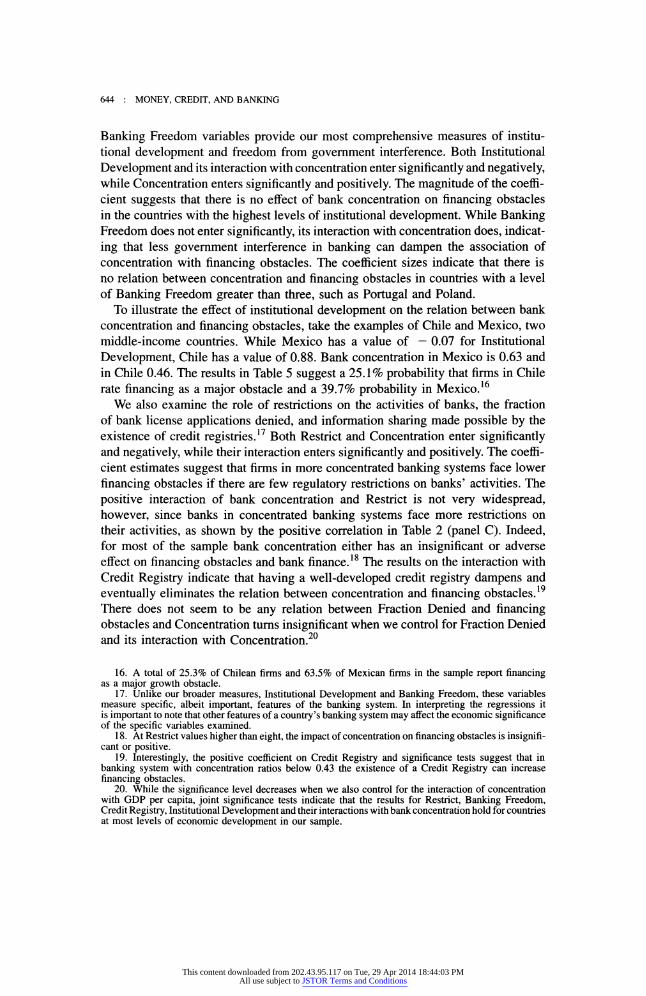
We use bank-level data from the BankScope database to calculate the concentration ratio. The BankScope database covers at least 90% of the banking sector in most countries. We use data on commercial, savings, and cooperative banks as well as nonbank credit institutions to calculate Bank Concentration as the share of the assets of the largest three banks in total banking sector assets, averaged over 1995- 99. This concentration measure has a wide variation, from 18% for the U.S. to 100% for Belize, as Figure 1 shows.
To test the robustness of our results, we use the deposit share of the five largest banks in total banking system deposits, from Barth, Caprio, and Levine (2001). Unlike the BankScope measure, this indicator is based on deposits, and on a survey of Central Banks and regulatory and supervisory authorities. While the survey measure does not suffer from problems of coverage as the BankScope measure, it might be subject to measurement error due to different definitions across countries.10 The correlation coefficient between the two concentration measures is 0.76, significant at the 1% level.
To distinguish between the effect of banking market structure and general eco- nomic development, we control for the log of real GDP per capita and interact it with Concentration to assess whether the relation between concentration and financing obstacles varies across different levels of economic development. We also control for and interact with an indicator of the institutional environment in which banks and firms operate. Institutional Development is a summary variable from Kaufmann, Kraay, and Zoido-Lobaton (1999) that averages six indicators proxying for voice and accountability, regulatory quality, political stability, rule of law, control of
corruption, and effectiveness of government. We control for the regulatory environment in which banks operate and interact
it with Concentration. Specifically, we use Restrict, which is an index of the degree
9. We find a correlation of 47%, significant at the 1% level, between the general financing obstacle and net interest margins, using data from Demirgtic-Kunt, Laeven, and Levine (2003).
10. This survey was undertaken in 1999, so that this alternative concentration measure is approximately for the same time period as our principal measure.
This content downloaded from 202.43.95.117 on Tue, 29 Apr 2014 18:44:03 PMAll use subject to JSTOR Terms and Conditions
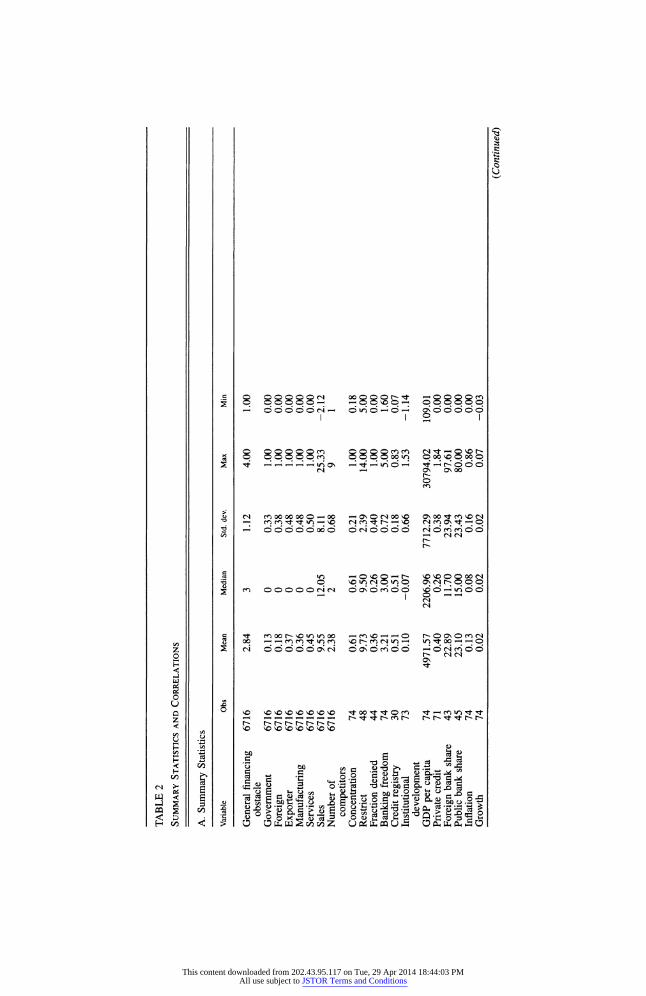
TABLE 2
SUMMARY STATISTICS AND CORRELATIONS
A. Summary Statistics
Variable Obs Mean Median Std. dev. Max Min
General financing 6716 2.84 3 1.12 4.00 1.00 obstacle
Government 6716 0.13 0 0.33 1.00 0.00 Foreign 6716 0.18 0 0.38 1.00 0.00 Exporter 6716 0.37 0 0.48 1.00 0.00 Manufacturing 6716 0.36 0 0.48 1.00 0.00 Services 6716 0.45 0 0.50 1.00 0.00 Sales 6716 9.55 12.05 8.11 25.33 -2.12 Number of 6716 2.38 2 0.68 9 1
competitors Concentration 74 0.61 0.61 0.21 1.00 0.18 Restrict 48 9.73 9.50 2.39 14.00 5.00 Fraction denied 44 0.36 0.26 0.40 1.00 0.00 Banking freedom 74 3.21 3.00 0.72 5.00 1.60 Credit registry 30 0.51 0.51 0.18 0.83 0.07 Institutional 73 0.10 -0.07 0.66 1.53 -1.14
development GDP per capita 74 4971.57 2206.96 7712.29 30794.02 109.01 Private credit 71 0.40 0.26 0.38 1.84 0.00 Foreign bank share 43 22.89 11.70 23.94 97.61 0.00 Public bank share 45 23.10 15.00 23.43 80.00 0.00 Inflation 74 0.13 0.08 0.16 0.86 0.00 Growth 74 0.02 0.02 0.02 0.07 -0.03
(Continued)
This content downloaded from 202.43.95.117 on Tue, 29 Apr 2014 18:44:03 PMAll use subject to JSTOR Terms and Conditions

TABLE 2
CONTINUED
B. Correlations Between Firm-Level Variables
General financing Number of obstacle Government Foreign Exporter Manufacturing Services Sales competitors
Government 0.05*** 1 Foreign -0.17*** -0.05*** 1 Exporter -0.06*** 0.07*** 0.23*** 1 Manufacturing 0.02* 0.05*** 0.10*** 0.32*** 1 Services -0.10*** -0.07*** -0.05*** -0.26*** -0.69*** 1 Sales -0.18*** -0.20*** 0.25*** 0.14*** 0.07*** 0.02* 1 No. of 0.09*** -0.05*** -0.14*** -0.06*** -0.10*** -0.01 -0.38*** 1
competitors Concentration 0.10*** 0.11*** -0.03** 0.01 -0.02* -0.05** -0.29*** 0.15***
C. Correlations Between Country-Level Variables
Fraction Banking Credit Institutional GDP Private Foreign Public Concentration Restrict denied freedom registry development per capita credit bank share bank share Inflation
Restrict 0.30** 1 Fraction denied 0.03 0.22 1 Banking freedom -0.39*** -0.26* -0.16 1 Credit registry -0.04*** 0.24 -0.12 0.10 1 Institutional -0.32*** -0.53*** -0.11 0.53*** 0.11 1
development GDP per capita -0.40*** -0.47*** -0.22 0.38*** 0.13 0.79*** 1 Private credit -0.43*** -0.25* 0.11 0.33*** -0.08 0.60*** 0.66*** 1 Foreign bank share 0.35** -0.11 -0.05 0.30** 0.20 0.14 -0.15 -0.24 1 Public bank share 0.12 0.32** 0.21 -0.38** -0.09 - 0.38*** - 0** -0.40*** -0.33** 1 Inflation 0.14 0.42*** -0.12 -0.10 -0.01 -0.35*** -0.29** -0.39*** -0.08 0.46*** 1 Growth 0.14 0.05 0.35 0.00 0.18 0.24** 0.09 0.03 0.14 0.10 -0.31***
NOTES: Summary statistics are presented in A and correlations in B and C. General financing obstacle is the response to the question "How problematic is financing for the operation and growth of your business?" Answers vary between 1 (no obstacle), 2 (minor obstacle), 3 (moderate obstacle), and 4 (major obstacle). Government and foreign are dummy variables that take the value one if the firm has government or foreign ownership and zero if not. Exporter is a dummy variable that indicates if the firm is an exporting firm. Manufacturing and services are industry dummies. Sales is the logarithm of sales in US$. Number of competitors is the number of competitors the firm has. Concentration is the share of the largest three banks in total banking sector assets. Restrict is an indicator of the degree to which banks' activities are restricted outside the credit and deposit business. Fraction denied is the share of bank license applications rejected. Banking freedom is a general indicator of the absence of government interference in the banking sector. Credit registry indicator is a summary variable of the amount of information and the number of institutions that have access to borrower information from credit registries in a country. Institutional development is an average of six indicators measuring voice and accountability, control of corruption, regulatory quality, political stability, rule of law, and government efficiency. GDP per capita is real GDP per capita in US$. Private credit is claims on the private sector by financial institutions as share of GDP. Foreign bank share is the share of assets in banks that are majority foreign owned. Public bank share is the share of assets in banks that are majority state owned. Inflation is the log difference of the consumer price index. Growth is the growth rate of GDP. Detailed definitions and the sources are in the data appendix, available on request. , **, and indicate significance levels of 10%, 5%, and 1%, respectively.
This content downloaded from 202.43.95.117 on Tue, 29 Apr 2014 18:44:03 PMAll use subject to JSTOR Terms and Conditions

638 : MONEY, CREDIT, AND BANKING
to which bank's activities are restricted in the underwriting of securities, insurance, real estate, and in owning shares in nonfinancial firms. This indicator ranges from 4 to 16, with higher values indicating more restrictions on banks' activities. We use Fraction Denied, the fraction of applications for bank licenses rejected as indicator of the contestability of the banking market.11 Both regulatory indicators are from Barth, Caprio, and Levine (2001). We use an indicator of the amount of information that is available to lenders from credit registries in the country. Credit Registry is the average of four variables that indicate (1) whether the credit registry offers only negative or also positive information about borrowers, (2) the amount of information available about borrowers, (3) which institutions have access to the data, and (4) whether information is available for each loan or only aggregated for each borrower. The indicator is normalized between zero and one, with higher values indicating more information being available to more institutions. Data are from Galindo and Miller (2001) and available for 30 countries.12 Finally, we use a general indicator of Banking Freedom from Heritage Foundation, which indicates the absence of government interference in the banking system and is averaged over the period 1995-99.13
We control for the ownership structure and level of financial development. We include the share of banking system's assets in banks that are 50% or more govern- ment owned (Public Bank Share) or 50% or more foreign owned (Foreign Bank Share). Both measures are from Barth, Caprio, and Levine (2001). We include a measure of financial intermediary development, Private Credit, which is the share of claims by financial institutions on the private sector in GDP.
To assess the robustness of the relation between market structure and firms' access to external financing and growth, we include other country-level variables. We include the growth rate of GDP per capita since firms in faster growing countries are expected to grow faster and face lower obstacles. We use the inflation rate to proxy for monetary instability, conjecturing that firms in more stable monetary environments face fewer obstacles.
Many of the country-level variables are highly correlated with each other, as shown in Table 2 (panel C). More concentrated banking systems have lower levels of financial, economic, and institutional development, have more foreign banks, share less information, and face more restrictions and more government interference. Many of the explanatory country-level variables are also highly correlated with each other, which underlines the importance of controlling for these country characteristics when assessing the impact of bank concentration.
11. In the case where there were no applications (and therefore no rejections), this indicator takes the value one.
12. Galindo and Miller (2001) also take into account which types of loans are reported in the registry. However, including this variable would have reduced our coverage by another six countries. However, results are similar when using this more comprehensive indicator.
13. Specifically, this indicator is based on five questions: (1) Does the government own banks? (2) Can foreign banks open branches and subsidiaries? (3) Does the government influence credit allocation? (4) Are banks free to operate without government regulations such as deposit insurance? (5) Are banks free to offer all types of financial services like buying and selling real estate, securities, and insurance policies?
This content downloaded from 202.43.95.117 on Tue, 29 Apr 2014 18:44:03 PMAll use subject to JSTOR Terms and Conditions

0 d R : cO Wc
I 0 666666666 ) C C C
FIG. 1. Concentration across countries. Concentration is given by the share of the largest three banks in total banking sector assets. Average for 1995-99 (Source: BankScope)
This content downloaded from 202.43.95.117 on Tue, 29 Apr 2014 18:44:03 PMAll use subject to JSTOR Terms and Conditions

640 : MONEY, CREDIT, AND BANKING
3. THE EMPIRICAL MODEL
To estimate the effect of bank concentration on financing obstacles, we use the following baseline regression:
Financing Obstacle,k = a + PI Governmentj,k + P2 Foreignj,k + 33 Exporterj,k + I4 No. of Competitorsj,k + f5 Manufacturingj,k+ P6 Servicesj,k + 37 Sizej,k + P8 Inflationk + p9 Growthk + p0o Concentrationk + j,k . (1)
Given that Financing Obstacle is a polychotomous dependent variable with a natural order, we use the ordered probit model to estimate Regression (1). We assume that the disturbance parameter ? has a normal distribution and use standard maximum likelihood estimation. The coefficient of interest is Plo; a positive coefficient would be evidence in favor of the structure-performance hypothesis, while a negative or insignificant coefficient evidence for theories of the information-based hypothesis. The coefficients, however, cannot be interpreted as marginal effects of a one-unit increase in the independent variable on the dependent variable, given the nonlinear structure of the model. Rather, the marginal effect is calculated as (P'x))P, where ( is the standard normal density at 3'x.
To assess whether bank concentration has a different effect on firms depending on their size, we interact concentration with dummy variables indicating whether the firm is small (5-50 employees), medium-size (51-500 employees), or large (more than 500 employees). In alternative specifications, we also control for measures of institutional environment, ownership structure of the banking system, and regula- tory variables, as well as their interaction with bank concentration.
4. RESULTS
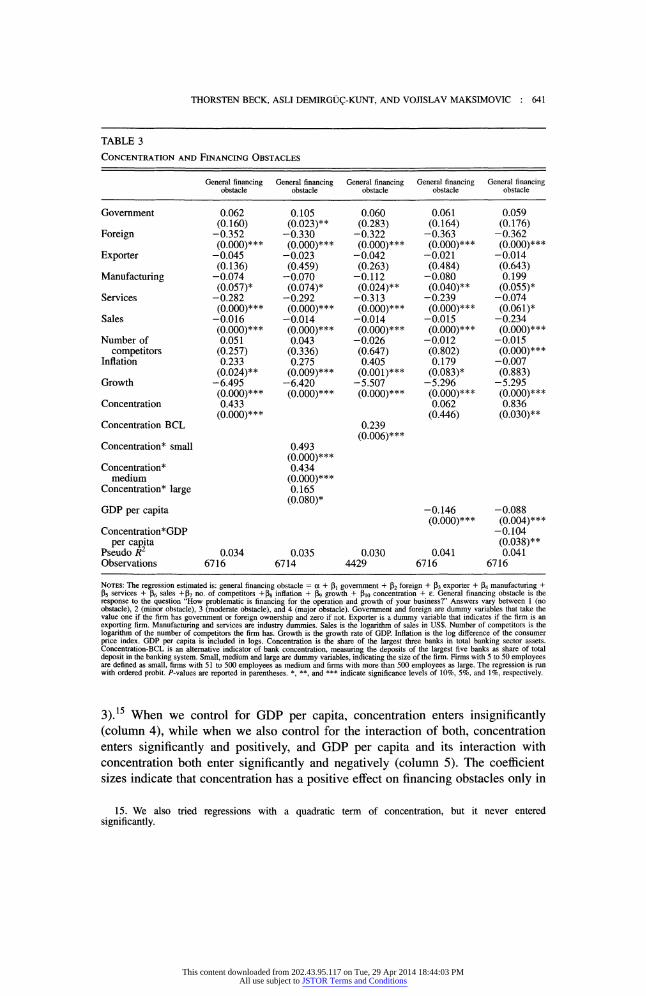
The results in Table 3 indicate that firms face higher financing obstacles in more concentrated banking systems. In column 1 of Table 3, Bank Concentration enters significantly positive, indicating that firms in countries with more concentrated banking systems report higher financing obstacles. When we interact Bank Concen- tration with dummy variables for small, medium, and large firms, the interactions for small and medium firms enter significantly at the 5% level (column 2). Further, the interaction with Small is largest, indicating that the growth-impeding effect of bank concentration is largest for small firms.14 We confirm our results with the alternative concentration measure from Barth, Caprio, and Levine (2001) (column
14. We also find that the interactions with the Small and Medium dummies in column 3 are significantly different from the Large dummy.
This content downloaded from 202.43.95.117 on Tue, 29 Apr 2014 18:44:03 PMAll use subject to JSTOR Terms and Conditions
THORSTEN BECK, ASLI DEMIRGUC-KUNT, AND VOJISLAV MAKSIMOVIC : 641
TABLE 3
CONCENTRATION AND FINANCING OBSTACLES
General financing General financing General financing General financing General financing obstacle obstacle obstacle obstacle obstacle
Government 0.062 0.105 0.060 0.061 0.059 (0.160) (0.023)** (0.283) (0.164) (0.176)
Foreign -0.352 -0.330 -0.322 -0.363 -0.362 (0.000)*** (0.000)*** (0.000)*** (0.000)*** (0.000)***
Exporter -0.045 -0.023 -0.042 -0.021 -0.014 (0.136) (0.459) (0.263) (0.484) (0.643)
Manufacturing -0.074 -0.070 -0.112 -0.080 0.199 (0.057)* (0.074)* (0.024)** (0.040)** (0.055)*
Services -0.282 -0.292 -0.313 -0.239 -0.074 (0.000)*** (0.000)*** (0.000)*** (0.000)*** (0.061)*
Sales -0.016 -0.014 -0.014 -0.015 -0.234 (0.000)*** (0.000)*** (0.000)*** (0.000)*** (0.000)***
Number of 0.051 0.043 -0.026 -0.012 -0.015 competitors (0.257) (0.336) (0.647) (0.802) (0.000)***
Inflation 0.233 0.275 0.405 0.179 -0.007 (0.024)** (0.009)*** (0.001)*** (0.083)* (0.883)
Growth -6.495 -6.420 -5.507 -5.296 -5.295 (0.000)*** (0.000)*** (0.000)*** (0.000)*** (0.000)***
Concentration 0.433 0.062 0.836 (0.000)*** (0.446) (0.030)**
Concentration BCL 0.239 (0.006)***
Concentration* small 0.493 (0.000)***
Concentration* 0.434 medium (0.000)***
Concentration* large 0.165 (0.080)*
GDP per capita -0.146 -0.088 (0.000)*** (0.004)***
Concentration*GDP -0.104 per capita (0.038)**
Pseudo R2 0.034 0.035 0.030 0.041 0.041 Observations 6716 6714 4429 6716 6716
NOTES: The regression estimated is: general financing obstacle = a + 51 government + 52 foreign + 03 exporter + ,4 manufacturing + 55 services + I6 sales +P7 no. of competitors +p8 inflation + p9 growth + plo concentration + e. General financing obstacle is the
response to the question "How problematic is financing for the operation and growth of your business?" Answers vary between 1 (no obstacle), 2 (minor obstacle), 3 (moderate obstacle), and 4 (major obstacle). Government and foreign are dummy variables that take the value one if the firm has government or foreign ownership and zero if not. Exporter is a dummy variable that indicates if the firm is an exporting firm. Manufacturing and services are industry dummies. Sales is the logarithm of sales in US$. Number of competitors is the logarithm of the number of competitors the firm has. Growth is the growth rate of GDP. Inflation is the log difference of the consumer price index. GDP per capita is included in logs. Concentration is the share of the largest three banks in total banking sector assets. Concentration-BCL is an alternative indicator of bank concentration, measuring the deposits of the largest five banks as share of total deposit in the banking system. Small, medium and large are dummy variables, indicating the size of the firm. Firms with 5 to 50 employees are defined as small, firms with 51 to 500 employees as medium and firms with more than 500 employees as large. The regression is run with ordered probit. P-values are reported in parentheses. *, **, and *** indicate significance levels of 10%, 5%, and 1%, respectively.
3).15 When we control for GDP per capita, concentration enters insignificantly (column 4), while when we also control for the interaction of both, concentration enters significantly and positively, and GDP per capita and its interaction with concentration both enter significantly and negatively (column 5). The coefficient sizes indicate that concentration has a positive effect on financing obstacles only in
15. We also tried regressions with a quadratic term of concentration, but it never entered significantly.
This content downloaded from 202.43.95.117 on Tue, 29 Apr 2014 18:44:03 PMAll use subject to JSTOR Terms and Conditions

642 : MONEY, CREDIT, AND BANKING
countries with GDP per capita below $3000, the level of Panama, a lower middle- income country. The significance tests, however, indicate that the relation between concentration and financing obstacles is only significant at GDP per capita levels below $665, the level of Moldova. Twenty-five percent of countries in our sample have a GDP per capita below this level. Finally, Table 3 results indicate that
foreign-owned firms, services firms, larger firms, and firms in countries with lower inflation face lower financing obstacles.
Controlling for GDP per capita is also important when assessing the economic significance of the relation between concentration and financing obstacles, as illus- trated in Table 4. Here we present the probability that enterprises rank financing as major obstacle to growth (Financing Obstacle = 4) at different levels of Concentra- tion, but holding the level of GDP per capita and other factors constant. Moving from the 25% percentile of Concentration (Peru) to the 75% percentile (Senegal) increases the probability that financing is reported as a major obstacle by five
percentage points, compared to the sample means of 38%. This effect is stronger for small enterprises (six percentage points) than for large enterprises (two percentage points). However, once we control for the level of GDP per capita, the effect is
significantly smaller. For Ethiopia (GDP per capita = $108), moving from the 75th to the 25th percentile of concentration would imply a four percentage points decrease in the probability that a firm rates financing as a major obstacle, while for Moldova (GDP per capita = $666), the decrease would be only two percentage points. Overall, these results are supportive of the structure-performance hypothesis in low-income countries but inconsistent with the information-based hypothesis.
The market share of the largest three banks, however, is only one dimension of the competitiveness of a banking sector. Contestability, absence of government interference, information sharing, restrictions on banks' activities, and the overall level of institutional development are other important elements of the competitive
TABLE 4
CONCENTRATION AND FINANCING OBSTACLES-QUANTIFYING THE EFFECT
Change between 25% and 75% Based on
Bank concentration at 25% (0.46) 50% (0.61) 75% (0.78) percentiles regression
Average estimated probability that enterprise will rate financing as major obstacle for operation and growth
All enterprises 0.357 0.380 0.407 0.050 Table 3, column 1 Small enterprises 0.379 0.406 0.438 0.059 Table 3, column 2 Medium enterprises 0.369 0.392 0.420 0.051 Table 3, column 2 Large enterprises 0.284 0.291 0.301 0.017 Table 3, column 2 GDP per capita = $666 0.430 0.439 0.449 0.019 Table 3, column 5 GDP per capita = $109 0.524 0.543 0.566 0.042 Table 3, column 5
NOTES: Based on the regressions of Table 3, estimated probabilities of rating financing as major obstacle to the operation and growth of the enterprises (financing obstacle = 4) are presented for the 25%, 50%, and 75% percentiles of concentration. Estimated probabilities are calculated for each enterprise setting all variables at its actual value, except for bank concentration, which is set at either the 25%, 50%, or 75% percentile of the sample. The probabilities shown are averages (1) for all firms in the sample, (2) for firms of the specific size class, or (3) for firms in a country at a specific level of GDP per capita.
This content downloaded from 202.43.95.117 on Tue, 29 Apr 2014 18:44:03 PMAll use subject to JSTOR Terms and Conditions

THORSTEN BECK, ASLI DEMIRGUOC-KUNT, AND VOJISLAV MAKSIMOVIC : 643
environment in which banks operate. In Table 5, we therefore introduce measures of the regulatory environment and interact them with concentration. We also control for GDP per capita.
More government interference in the banking system, especially restrictions on banks' activities, exacerbate the association of bank concentration with financing obstacles, while institutional development and information sharing attenuate the
relation, as shown by the results in Table 5. The Institutional Development and
TABLE 5
CONCENTRATION AND FINANCING OBSTACLES THE INTERACTION WITH THE REGULATION
OF THE BANKING SECTOR
General financing General financing General financing General financing General financing obstacle obstacle obstacle obstacle obstacle
GDP per capita 0.034 -0.127 -0.128 -0.155 -0.229 (0.110) (0.000)*** (0.000)*** (0.000)*** (0.000)***
Concentration 0.201 0.671 -2.076 0.008 1.461 (0.017)** (0.024)** (0.000)*** (0.953) (0.002)***
Institutional -0.273 development (0.000)***
Concentration -0.283 x institutional (0.008)*** development
Banking freedom 0.065 (0.273)
Concentration -0.204 x banking (0.025)** freedom
Restrict -0.094 (0.000)***
Concentration 0.217 x restrict (0.000)***
Fraction denied -0.231 (0.202)
Concentration 0.525 x fraction (0.116) denied
Credit registry 1.355 (0.000)***
Concentration -2.600 x credit (0.001)*** registry
Pseudo R2 0.048 0.042 0.041 0.036 0.060 Observations 6687 6716 4783 3926 3254
NOTES: The regression estimated is: general financing obstacle = a + 13 government + 32 foreign + 13 exporter + 34 manufacturing + P5 services + P6 sales +1P7 no. of competitors +1s8 inflation + 19 growth + p1l GDP per capita + p13 Concentration + P12 regulation + 313 concentration x regulation + e. General financing obstacle is the response to the question "How problematic is financing for the
operation and growth of your business?" Answers vary between 1 (no obstacle), 2 (minor obstacle), 3 (moderate obstacle), and 4 (major obstacle). Government and foreign are dummy variables that take the value one if the firm has government or foreign ownership and zero if not. Exporter is a dummy variable that indicates if the firm is an exporting firm. Manufacturing and services are industry dummies. Sales is the logarithm of sales in US$. Number of competitors is the logarithm of the number of competitors the firm has. Growth is the growth rate of GDP. Inflation is the log difference of the consumer price index. GDP per capita is included in logs. Concentration is the share of the largest three banks in total banking sector assets. Regulation is one of five country-level variables. Restrict is an indicator of the degree to which banks' activities are restricted outside the credit and deposit business. Fraction denied is the share of bank license applications rejected. Banking freedom is a general indicator of the absence of government interference in the banking sector. Credit registry indicator is a summary variable of the amount of information and the number of institutions that have access to borrower information from credit registries in a country. Institutional development is an average of six indicators measuring voice and accountability, control of corruption, regulatory quality, political stability, rule of law, and government efficiency. The regression is run with ordered probit. P- values are reported in parentheses. *, **, and *** indicate significance levels of 10%, 5%, and 1%, respectively.
This content downloaded from 202.43.95.117 on Tue, 29 Apr 2014 18:44:03 PMAll use subject to JSTOR Terms and Conditions
644 : MONEY, CREDIT, AND BANKING
Banking Freedom variables provide our most comprehensive measures of institu- tional development and freedom from government interference. Both Institutional Development and its interaction with concentration enter significantly and negatively, while Concentration enters significantly and positively. The magnitude of the coeffi- cient suggests that there is no effect of bank concentration on financing obstacles in the countries with the highest levels of institutional development. While Banking Freedom does not enter significantly, its interaction with concentration does, indicat- ing that less government interference in banking can dampen the association of concentration with financing obstacles. The coefficient sizes indicate that there is no relation between concentration and financing obstacles in countries with a level of Banking Freedom greater than three, such as Portugal and Poland.
To illustrate the effect of institutional development on the relation between bank concentration and financing obstacles, take the examples of Chile and Mexico, two middle-income countries. While Mexico has a value of - 0.07 for Institutional Development, Chile has a value of 0.88. Bank concentration in Mexico is 0.63 and in Chile 0.46. The results in Table 5 suggest a 25.1% probability that firms in Chile rate financing as a major obstacle and a 39.7% probability in Mexico.16
We also examine the role of restrictions on the activities of banks, the fraction of bank license applications denied, and information sharing made possible by the existence of credit registries.17 Both Restrict and Concentration enter significantly and negatively, while their interaction enters significantly and positively. The coeffi- cient estimates suggest that firms in more concentrated banking systems face lower financing obstacles if there are few regulatory restrictions on banks' activities. The positive interaction of bank concentration and Restrict is not very widespread, however, since banks in concentrated banking systems face more restrictions on their activities, as shown by the positive correlation in Table 2 (panel C). Indeed, for most of the sample bank concentration either has an insignificant or adverse effect on financing obstacles and bank finance.18 The results on the interaction with Credit Registry indicate that having a well-developed credit registry dampens and eventually eliminates the relation between concentration and financing obstacles.19 There does not seem to be any relation between Fraction Denied and financing obstacles and Concentration turns insignificant when we control for Fraction Denied and its interaction with Concentration.20
16. A total of 25.3% of Chilean firms and 63.5% of Mexican firms in the sample report financing as a major growth obstacle.
17. Unlike our broader measures, Institutional Development and Banking Freedom, these variables measure specific, albeit important, features of the banking system. In interpreting the regressions it is important to note that other features of a country's banking system may affect the economic significance of the specific variables examined.
18. At Restrict values higher than eight, the impact of concentration on financing obstacles is insignifi- cant or positive.
19. Interestingly, the positive coefficient on Credit Registry and significance tests suggest that in banking system with concentration ratios below 0.43 the existence of a Credit Registry can increase financing obstacles.
20. While the significance level decreases when we also control for the interaction of concentration with GDP per capita, joint significance tests indicate that the results for Restrict, Banking Freedom, Credit Registry, Institutional Development and their interactions with bank concentration hold for countries at most levels of economic development in our sample.
This content downloaded from 202.43.95.117 on Tue, 29 Apr 2014 18:44:03 PMAll use subject to JSTOR Terms and Conditions

THORSTEN BECK, ASLI DEMIRGU,C-KUNT, AND VOJISLAV MAKSIMOVIC : 645
The presence of foreign banks alleviates the association of concentration with financing obstacles, while public bank ownership exacerbates it, as shown by the results in Table 6. Here we control for financial development and the ownership structure of the banking system and interact these variables with Bank Concentration. The interaction of Bank Concentration with Foreign Bank Share enters significantly and negatively, suggesting that foreign bank ownership alleviates the negative impact of bank concentration on financing obstacles. Bank Concentration and the Public Bank Share both enter negatively and significantly, while the interaction of Bank Concentration with Public Bank Share enters significantly and positively. This indi- cates that government-owned banks might be helping alleviate financing obstacles in countries with low concentration ratios and that bank concentration affects financing obstacles only in banking systems with government-owned banks. There does not seem to be an interaction of bank concentration and Private Credit in their effects on financing obstacles.21
TABLE 6
CONCENTRATION AND FINANCING OBSTACLES THE INTERACTION WITH THE STRUCTURE
OF THE BANKING SECTOR
General Financing Obstacle General Financing Obstacle General Financing Obstacle
GDP per capita -0.161 -0.121 -0.123 (0.000)** (0.0) ( )*** (0.000)*** (0.000)***
Concentration 0.010 0.411 -0.315 (0.923) (0.003)*** (0.035)**
Private Credit -0.033 (0.717)
Concentration*Private Credit 0.247 (0.156)
Foreign Bank Share 0.006 (0.027)**
Concentration*Foreign -0.012 Bank Share (0.002)***
Public Bank Share -0.006 (0.002)***
Concentration* 0.015 Public Bank Share (0.000)***
Pseudo R2 0.042 0.043 0.046 Observations 6346 4405 4578
NOTES: The regression estimated in columns 1-3 is: General Financing Obstacle = a + [1 Government + 52 Foreign + [3 Exporter + P4 Manufacturing + 55 Services + P6 Sales +P,7 No. of Competitors +18 Inflation + P9 Growth + plo GDP per capita + P1 Concentration + P12 Bank + 513 Concentration x Bank + E. General Financing Obstacle is the response to the question "How problematic is financing for the operation and growth of your business?" Answers vary between 1 (no obstacle), 2 (minor obstacle), 3 (moderate obstacle), and 4 (major obstacle). Government and Foreign are dummy variables that take the value one if the firm has government or foreign ownership and zero if not. Exporter is a dummy variable that indicates if the firm is an exporting firm. Manufacturing and Services are industry dummies. Sales is the logarithm of sales in US$. Number of Competitors is the logarithm of the number of competitors the firm has. Growth is the growth rate of GDP. Inflation is the log difference of the consumer price index. GDP per capita is included in logs. Concentration is the share of the largest three banks in total banking sector assets. Bank is one of three variables. Private Credit is claims on the private sector by financial institutions as share of GDP. Foreign Bank Share is the share of assets in banks that are majority foreign owned. Public Bank Share is the share of assets in banks that are majority state-owned. The regression is run with ordered probit. P-values are reported in parentheses. *, **, and *** indicate significance levels of 10%, 5%, and 1%, respectively.
21. All results are confirmed when we also include the interaction of GDP per capita with bank concentration. We also tried an indicator of the Number of Banks in a country, deflated by GDP in US$, with data coming from Barth, Caprio, and Levine (2001). Recent research has discovered a positive correlation between small (or community) banks and access to finance, especially by SMEs (Berger, Hasan, and Klapper 2003). However, neither the number of banks nor its interaction with Concentration enters significantly; further, concentration loses its significance in this regression.
This content downloaded from 202.43.95.117 on Tue, 29 Apr 2014 18:44:03 PMAll use subject to JSTOR Terms and Conditions

646 : MONEY, CREDIT, AND BANKING
5. CONCLUSIONS
This paper assessed the importance of the competitiveness of the banking system for financing obstacles firms face. We find that bank concentration increases financing obstacles, with a stronger effect for small and medium compared to large firms. When we include GDP per capita and an interaction term with bank concentration, we find that this relation only holds for low-income countries, with the relation being insignificant for middle-income and rich countries. However, we also find that independent of the level of economic development, regulatory and institutional country characteristics as well as the ownership structure of the banking system influence the relation between financing obstacles and bank concentration. A high level of institutional development, an efficient credit registry, and the presence of foreign-owned banks dampen the relation between concentration and financing obstacles and can turn the relation insignificant. The effect of bank concentration is exacerbated, on the other hand, in countries with more restrictions on banks' activities, high government interference in the banking system, and a higher share of government-owned banks. While richer countries tend to have higher levels of institutional development, fewer restrictions on banks' activities, and less govern- ment-owned banks, our results suggest the importance of institutional and regulatory policies for the relation between banking market structure and firms' access to finance at any level of economic development.
Our results shed light on the theoretical debate on the effects of banks' market power on firms' access to credit. Our findings provide qualified evidence for theories that focus on the negative effects of bank power (structure-performance hypothesis), while they are inconsistent with theories that stress the potential positive effects of bank concentration (information-based hypothesis). However, our results also underline the importance of controlling for the economic, institutional, and regulatory environment when assessing the effect of market competitiveness. While we find a strong relation between bank concentration and higher financing obstacles in economically and institutionally less developed economies (consistent with the performance-structure hypothesis), this relation is insignificant for institutionally, financially, and economically well-developed economies.
Our findings send important messages for policy makers, especially in developing countries. While they cannot influence concentration ratios-often determined by historical factors-they can impact the ownership structure of the banking system, its regulatory framework, and the overall institutional environment.
LITERATURE CITED
Barth, James R., Gerard Caprio, Jr., and Ross Levine (2001). "The Regulation and Supervision of Banks around the World. A New Database." In Integrating Emerging Market Countries into the Global Financial System, edited by Robert E. Litan and R. Herring, pp. 183-250. Washington, DC: Brookings Institution Press.
This content downloaded from 202.43.95.117 on Tue, 29 Apr 2014 18:44:03 PMAll use subject to JSTOR Terms and Conditions

THORSTEN BECK, ASLI DEMIRGUC-KUNT, AND VOJISLAV MAKSIMOVIC : 647
Beck, Thorsten, and Ross Levine (2002). "Industry Growth and Capital Allocation: Does Having a Market- or Bank-based System Matter?" Journal of Financial Economics 64, 147-180.
Beck, Thorsten, Asli Demirgiic-Kunt, and Vojislav Maksimovic (2001a). "Financial and Legal Constraints to Firm Growth: Does Size Matter?" World Bank Policy Research Working Paper No. 2784.
Beck, Thorsten, Asli Demirgtii-Kunt, and Vojislav Maksimovic (2001b). "Financial and Legal Institutions and Firm Size." Mimeo, World Bank.
Beck, Thorsten, Ross Levine, and Norman Loayza (2000). "Finance and the Sources of Growth." Journal of Financial Economics 58, 261-300.
Berger, Allen N., Iftekhar Hasan, and Leora F. Klapper (2003). "Community Banking and Economic Performance: Some International Evidence." Mimeo, World Bank.
Black, Sandra E., and Philip E. Strahan (2002). "Entrepreneurship and Bank Credit Availabil- ity." Journal of Finance 57, 2807-2833.
Bonaccorsi di Patti, and Giovanni Dell'Ariccia (2003). "Bank Competition and Firm Cre- ation." Journal of Money, Credit, and Banking 36, 225-252.
Bonaccorsi di Patti, and Giorgi Gobbi (2001). "The Effects of Bank Consolidation and Market Entry on Small Business Lending." Banca d'Italia Temi di Discussione 404.
Cetorelli, Nicola (2001a). "Competition Among Banks: Good or Bad?" Federal Reserve Bank of Chicago Economic Perspectives, 38-48.
Cetorelli, Nicola (2001b). "Does Bank Concentration Lead to Industry Concentration?" Fed- eral Reserve Bank of Chicago Working Paper No. 2001-01.
Cetorelli, Nicola, and Michele Gambera (2001). "Banking Market Structure, Financial Depen- dence and Growth: International Evidence from Industry Data." Journal of Finance 56, 617-648.
Cetorelli, Nicola, and Pietro F. Peretto (2000). "Oligopoly Banking and Capital Accumula- tion." Federal Reserve Bank of Chicago Working Paper No. 2000-12.
Claessens, Stijn, and Luc Laeven (2003). "Financial Development, Property Rights and Growth." Journal of Finance 58, 2401-2436.
Clarke, George R.G., Robert Cull, and Maria Soledad Martinez Peria (2001). "Does Foreign Bank Penetration Reduce Access to Credit in Developing Countries? Evidence from Asking Borrowers." World Bank Policy Research Working Paper No. 2716.
Clarke, George R.G., Robert Cull, Maria Soledad Martinez Peria, and Susana M. Sanchez (2003). "Foreign Bank Entry: Experience, Implications for Developing Countries, and Agenda for Further Research." World Bank Research Observer 18, 25-60.
Demirgtii-Kunt, Asli, and Vojislav Maksimovic (1998). "Law, Finance, and Firm Growth." Journal of Finance 53, 2107-2137.
Demirgtii-Kunt, Asli, Luc Laeven, and Ross Levine (2003). "Regulations, Market Structure, Institutions, and the Cost of Financial Intermediation." Journal of Money, Credit, and Banking 36, 593-622. (this issue of JMCB)
DeYoung, Robert, Lawrence G. Goldberg, and Lawrence J. White (1999). "Youth, Adoles- cence, and Maturity of Banks: Credit Availability to Small Business in an Era of Banking Consolidation." Journal of Banking and Finance 23, 463-492.
Ding, Serdar I. (2000). "Bank Reputation, Bank Commitment, and the Effects of Competition in Credit Markets." Review of Financial Studies 13, 781-812.
Galindo, Arturo, and Margaret Miller (2001). "Can Credit Registries Reduce Credit Con- straints? Empirical Evidence on the Role of Credit Registries in Firm Investment Decisions." Inter-American Development Bank.
This content downloaded from 202.43.95.117 on Tue, 29 Apr 2014 18:44:03 PMAll use subject to JSTOR Terms and Conditions

648 : MONEY, CREDIT, AND BANKING
Guzman, Mark G. (2000). "Bank Structure, Capital Accumulation and Growth: A Simple Macroeconomic Model." Economic Theory 16, 421-455.
Hannan, Timothy H. (1991). "Bank Commercial Loan Markets and the Role of Market Structure: Evidence from Surveys of Commercial Lending." Journal of Banking and Finance 15, 133-149.
Hellman, Joel S., Geraint Jones, Daniel Kaufmann, and Mark Schankerman (2000). "Measur- ing Governance and State Capture: The Role of Bureaucrats and Firms in Shaping the Business Environment." European Bank for Reconstruction and Development Working Paper No. 51.
Jackson, John E., and Ann R. Thomas (1995). "Bank Structure and New Business Creation. Lessons from an Earlier Time." Regional Science and Urban Economics 25, 323-353.
Jappelli, Tullio, and Marco Pagano (2002). "Information Sharing in Credit Markets: Interna- tional Evidence." Journal of Banking and Finance 26, 2023-2054.
Kaufmann, Daniel, Aart Kraay, and Pablo Zoido-Lobaton (1999). "Governance Matters." World Bank Policy Research Working Paper No. 2196.
La Porta, Rafael, Florencio Lopez-de-Silanes, and Andrei Shleifer (2002). Government Own- ership of Commercial Banks. Journal of Finance 57, 265-301.
Marquez, Robert (2002). "Competition, Adverse Selection, and Information Dispersion in the Banking Industry." The Review of Financial Studies 15, 901-926.
Pagano, Marco (1993). "Financial Markets and Growth. An Overview." European Economic Review 37, 613-622.
Petersen, Mitchell A., and Raghuram Rajan (1995). "The Effect of Credit Market Competition on Lending Relationships." Quarterly Journal of Economics 110, 407-443.
Rajan, Rhaguram, and Luigi Zingales (1998). "Financial Dependence and Growth." American Economic Review 88, 559-587.
Rousseau, Peter L., and Paul Wachtel (2000). "Equity Markets and Growth: Cross-country Evidence on Timing and Outcomes, 1980-1995." Journal of Banking and Finance 24, 1933-1957.
Scott, Jonathan A., and William C. Dunkelberg (2001). "Competition and Credit Market Outcomes: A Small Firm Perspective." Mimeo, Temple University.
Wurgler, Jeffrey (2000). "Financial Markets and the Allocation of Capital." Journal of Finan- cial Economics 58, 187-214.
This content downloaded from 202.43.95.117 on Tue, 29 Apr 2014 18:44:03 PMAll use subject to JSTOR Terms and Conditions


