38% and 60% of gross monthly salary for 238 days (about ... · PDF file38% and 60% of gross...
18
38% and 60% of gross monthly salary for 238 days (about eight months). The monthly salary is limited to a R12 478 earning ceiling. In this case, it is important to understand the seriousness of this joblessness within the current global economic crisis. It could be difficult to exit this situation if there is little hope of global economic recovery in the short-run. Thus, deteriorating growth prospects in developing countries (in general) will further slow progress regarding poverty reduction. Figure 8: Growth in the number of domestic workers Source: UIF data, 2008/09 • Despite the economic downturn currently experienced worldwide, the UIF data demonstrate a constant increase in the number of domestic workers registered with the Fund, as shown in Figure 8. • In March 2009, about 7.6 million contributors (commercial 6 947 190 plus domestic 637 987) were recorded on the UIF database. A steady increase in the number of contributors was reported in both the domestic and commercial sectors. In the domestic sector, the increase might be as a result of the impact of sectoral determination in domestic workers, e.g. personal services. 23 632 000 633 000 634 000 635 000 636 000 637 000 638 000 639 000 March 2009 February 2009 January 2009 December 2008 November 2008 October 2008 September 2008 August 2008 July 2008 June 2008 May 2008 April 2008 634 277 634 583 634 903 635 321 635 709 636 205 636 619 636 873 636 946 637 330 637 618 637 987
-
Upload
trinhthuan -
Category
Documents
-
view
223 -
download
2
Transcript of 38% and 60% of gross monthly salary for 238 days (about ... · PDF file38% and 60% of gross...

38% and 60% of gross monthly salary for 238 days (about eight months). The monthly salary is
limited to a R12 478 earning ceiling. In this case, it is important to understand the seriousness of
this joblessness within the current global economic crisis. It could be difficult to exit this situation
if there is little hope of global economic recovery in the short-run. Thus, deteriorating growth
prospects in developing countries (in general) will further slow progress regarding poverty
reduction.
Figure 8: Growth in the number of domestic workers
Source: UIF data, 2008/09
• Despite the economic downturn currently experienced worldwide, the UIF data demonstrate a
constant increase in the number of domestic workers registered with the Fund, as shown in
Figure 8.
• In March 2009, about 7.6 million contributors (commercial 6 947 190 plus domestic 637 987)
were recorded on the UIF database. A steady increase in the number of contributors was
reported in both the domestic and commercial sectors. In the domestic sector, the increase
might be as a result of the impact of sectoral determination in domestic workers, e.g. personal
services.
23
632 000
633 000
634 000
635 000
636 000
637 000
638 000
639 000
March 2009
February 2009
January 2009
December 2008
November 2008
October 2008
September 2008
August 2008
July 2008
June 2008
May 2008
April 2008
634
277
634
583
634
903
635
321
635
709
636
205
636
619
636
873
636
946
637
330
637
618
637
987

2.6. Job advertisements
Figure 9: Trends in the number of job vacancies
Source: Department of Labour, Job Opportunity Index, 2008/09
• In the 2008/09 financial year, the Department of Labour processed more than 40 000 job
vacancies from the Sunday Times. The job vacancies provide a signal about changes in a
country’s labour market skills in demand
• Figure 9 shows the total number of job vacancies advertised in the media for the period April
2008 to March 2009 have been declining from quarter two to quarter four of the 2008/09
financial year. This signals a decline in the demand for labour as a result of the decrease in the
demand for a firm's product in the international market.
Figure 10: Advertised vacancies by occupational category
Source: Department of Labour, Job Opportunity Index, 2008/09
24
0
500
1 000
1 500
2 000
2 500
3 000
3 500
4 000
4 500
5 000 January - March 2009
October - December 2008
July - September 2008
April - June 2008
Elementary workersMachinery operators and drivers
Sales workersClerical and
administrative workers
Community and personal
service workers
Technicians and trade
workers
ProfessionalsManagers
Num
ber o
f vac
anci
es
2 000
4 000
6 000
8 000
10 000
12 000
14 000
January - March 2009
October - December 2008
July - September 2008
April - June 2008
Num
ber o
f vac
anci
es
10 821
12 090
9 709
7 516

• Figure 10 shows the distribution of vacancies by occupational categories. High skilled
occupations, e.g. managers, professionals and technicians received a high number of vacancies
compared to low skill occupations. An explanation is the source of the vacancies used, which
mainly cater for skilled occupations. It has also been proved that employers mostly rely on
word of mouth for low-level skilled occupations
• Of the total of 40 136 job vacancies processed in the financial year 2008/09, about 43%
vacancies were from the professional category and 33% vacancies were for managers. The rest
of the vacancies were distributed in other occupational categories.
2.7. Work-seeker registration
Work-seekers statistics are generated from the Employment Services of South Africa (ESSA). It is
administered by the Department of Labour. The system brings work-seekers and employers
together by offering a matching function for quick and easy placement. In addition, the system
offers career guidance, skills development and specialised services for all citizens in the country.
Table 15: Work-seekers registered by gender
Source: Department of Labour, ESSA (figures exclude manual collection)
• According to data extracted from ESSA,Table 15 indicates that there were 232 515
work-seekers registered with the Department of Labour in the 2008/09 financial year, with
most (35%) registering in the last quarter of the financial year, but could unfortunately not be
assigned according to gender at the time of reporting because of system enhancement
• All in all more males were registered than females.
Table 16 : Level of education of registered work-seekers
Source: Department of Labour, ESSA (figures exclude manual collection)
25
Quarters Male Female Unassigned Total
Apr-Jun 2008 20 339 15 388 0 35 727
Jul-Sep 2008 33 965 24 213 2 58 180
Oct-Dec 2008 29 027 20 727 6 683 56 437
Jan-Mar 2009 0 0 82 171 82 171
Total 83 331 60 328 88 856 232 515
Educational level Apr-Jun 2008 Jul-Sep 2008 Oct-Dec 2008 Jan-Mar 2009 Total
None 11 410 25 388 24 293 0 61 091
Grade 1-3 282 427 320 0 1 029
Grade 4-7 1 693 2 654 2 055 0 6 402
Grade 8-9 2 350 3 466 2 795 0 8 611
Grade 10-11 5 494 9 755 7 579 0 22 828
Matric 10 255 16 490 12 703 0 39 448
Unassigned 4 243 0 6 692 82 171 93 106
Total 35 727 58 180 56 437 82 171 232 515

• Table 16 shows the number of work-seekers registered by the level of education. There was a
bulk of work-seekers in possession of a matric qualification, signalling at least an opportunity
for them to find some form of an opportunity in the formal and informal economy. There were
also many work-seekers without any formal education, which cast a lot of doubt on them ever
finding employment as the country urgently needs skilled workers. Overall, the level of skills of
the registered work-seekers is very low. Levinsohn argued that 16, the increase in labour supply
(unskilled labour) coupled with a decline in labour demand would have led to wage declines
that society found unacceptable, and the result has been a substantial increase in
unemployment.
Figure 11: Work permits received and approved
Source: Department of Home Affairs, Pretoria, South Africa
• Figure 11 shows the number of different work permit applications received by the
Department of Home Affairs over the reference period. Most of the permit applications were
in the General work permit category. It is observed that more applications were approved
(10 726) than received (9 641) in the general work permit category. The reason for the high
number of applications approved as opposed to received is due to a backlog of applications,
which have been outstanding and the Department is working tirelessly to process them.
• The second highest number of applications processed were for quota permits where 3 108
applications were received and 2 837 approved. With the lifting of trade barriers, intra-company
work permits are also increasing. Exceptional skills work permit applications were also received
and most of them were approved, with only 57 declined.
26
0
2 000
4 000
6 000
8 000
10 000
12 000Refused
Approved
Received
Intra-companyExceptional skillsGeneral work permit
Quota
________________________________________
16 Levinsohn, J (2007), Two policies to alleviate unemployment in South Africa, University of Michigan and
NBER, August 2007, p.1.

Section 3:
Industrial relationsIndustrial relations
The relationship between an employer and employees is very important in a company. Industrial
action can sometimes be an indication of the strength of that relationship, especially when it affects
issues other than wages. Section 64 of the Labour Relations Act, Act No.66 of 1995 recognises
every employee’s fundamental right to strike. However, the right is subject to certain limitations.
e.g., workers in essential services are not allowed to strike. This is also in line with the letter and
spirit of the Constitution of the Republic of South Africa. Industrial action on the other hand can
be a deterrent to potential investors who may view them as an undesirable state of affairs as
constant work stoppages disrupt production and hence the possibility of profits.
Strikes are monitored by the Department of Labour through the submission of the Labour
Relation Acts (LRA) 9.2 form, which is sent to the employers affected by the strike action to
complete after the strike action has ended. The information from these forms is captured on the
strikes monitoring database.
3.1. Brief analysis of industrial actions, April 2008 to March 2009
• There were 59 industrial action incidents during the period April 2008 to March 2009
compared to 63 in the preceding financial year. These involved 110 489 employees where
403 543 workdays and 2 978 387 working hours were lost
• Most of the strike incidents were in the community, social and personal services industry, and
wages seem to be the main reason for strike incidents that were experienced in the country.
Figure 12: Percentage distribution of strike incidents by industry
Source: Department of Labour, Strike Statistics, 2008/09
• According to Figure 12, most of the strike incidents experienced during the period under
review affected the community, social and personal services industry (36%). Following is the
27
Community and social
Finance
Transport
Wholesale and retail
Construction
Manufacturing
Mining
12%
20%
2%
8%
17%
5%
36%

manufacturing industry which was affected by 20% of the strike incidence; transport storage
and communication industry having been affected by 17% of the strikes; mining and quarrying;
wholesale and retail trade (8%); financial intermediation, insurance, real estate and business
services (5%) and construction (2%)
• The agriculture and the electricity, gas and water supply industries were relatively stable as
there were no industrial action incidents affecting these industries over the same period.
Table 17:Duration of strikes and employees involved
Source: Department of Labour, Strike Statistics, 2008/09
• Table 17 depicts the duration of strikes as well as the number of employees involved
• With regards to the effects of strikes, the number of employees taking part in the strikes was
110 489 where almost half (46 787) of the workers came from the mining and quarrying
industry, followed by the community, social and personal services industry which had 22 015
employees participating. The construction industry was the least affected with 115 employees
taking part in industrial action, as shown in Table 17
• Working hours lost are calculated by multiplying the number of hours that employees are
supposed to work, which are lost as a result of strike action by the number of workers
involved. Almost 3 million work-hours were lost as a result of work stoppages, with the
transport, storage and communication industry being severely affected losing 986 662
work-hours due to prolonged strikes
• Work-days lost is a result of the number of days lost and the number of employees
participating in strikes. The community, social and personal services industry had the most
work-days lost, losing 136 640 days; followed by transport, storage and communication
(128 995 days); mining and quarrying industry (69 009 days) and the manufacturing industry
(61 807 days).
28
Industries Employees involved Work-hours lost Work-days lost
Mining 46 787 741 366 69 009
Manufacturing 18 230 481 507 61 807
Construction 115 5 175 575
Wholesale and retail trade 6 446 45 348 3 657
Transport 16 591 986 662 128 995
Finance 305 30 940 2 860
Community 22 015 687 388 136 640
Total 110 489 2 978 387 403 543

Figure 13: Reasons for strikes
Source: Department of Labour, Strike Statistics, 2008/09
• Figure 13 shows that wages continue to be the single main reason for strike incidents as 44%
of the strikes were as a result of a deadlock in wage negotiations. Following this was the strike
around socio-economic and political conditions, which relates to the strike around rising food
and fuel prices called by COSATU during the middle of the previous year. Other reasons for
strikes point directly to the relationship between the workers and their employers mentioned
earlier.
3.2. Developments in dispute resolution environment
The Commission for Conciliation, Mediation and Arbitration (CCMA) provides a platform for the
prevention and resolution of industrial disputes, including industrial action, established in terms of
the Labour Relations Act, Act No. 66 of 1995. It aims to promote justice and economic growth,
with social partners, by transforming relations in the labour market. This is achieved by delivering
high quality, low cost dispute resolution and prevention services. The following are the main forms
of dispute resolution:
• Conciliation involves a third party (usually a Commissioner) meeting with the parties involved
in a dispute to explore ways to settle the dispute by agreement
• Mediation involves a third party taking an active role in the dispute resolution process and
making recommendations for the resolution of the dispute
• Arbitration takes place when conciliation fails, and either party requesting the CCMA to
resolve the dispute by arbitration. The Commissioner then issues an arbitration award, which is
legally binding on both parties after hearing both sides of the dispute.
29
Working conditions
Secondary action
Grievances
Wages
Union recognition
Refusal to bargain
Other
Disciplinary
Socio-economic
19%
7%
5%
3%
2%
44%
10%
3%7%

Table 18: Referral of cases by province
Source: CCMA, Review of Operations, 2008/09
• In Table 18, about 140 366 cases were referred to the CCMA during the 2008/09 financial
year. This represents a 6% increase when compared with the period preceding the period under
review. Generally, the number of cases referred is consistent with the industrial activity taking
place in the country, with Gauteng, KwaZulu-Natal, Western Cape and Mpumalanga having the
most referrals
• Only Limpopo and the Northern Cape offices have seen a reduction in the number of cases
referred to the CCMA in comparison with the previous period. All the other provincial offices
have had an increase in the cases referred to CCMA particularly the head office.
Figure 14: Referral of cases by issue
Source: CCMA, Review of Operations, 2008/09
30
Region Apr 2008 –Mar 2009 Apr 2007–Mar 2008
Percentage change
between 2007/08 and
2008/09
Count % Count %
Eastern Cape 8 448 6 7 550 24
Free State 7 459 5 6 362 17
Gauteng 56 337 40 54 450 21
Head Office 2 326 2 1 312 77
KwaZulu-Natal 21 444 15 20 346 27
Limpopo 7 640 5 7 930 -4
Mpumalanga 8 642 6 7 737 12
Northern Cape 2 873 2 2 889 -1
North West 7 076 5 7 100 0
Western Cape 18 121 13% 17 192 5%
Total 140 366 100% 123 472 6%
0
20
40
60
80
1002007/08
2008/09
OtherSeverance pay
Collective bargaining
Mutual interest
Unfair labour practice
Unfair dismissal
82% 83%
7%3%
7%3% 3% 3% 2% 2% 4% 3%

• Figure 14 shows cases referred to the CCMA by issue. Unfair dismissals continued to account
for the largest percentage of issues in dispute. There was however a slight reduction in the
disputes referring to this issue at 82% in 2008/09 compared to 83% in 2007/08
• All the other issues remained the same in both financial years with the exception of other case
categories (made up of BCEA, EEA, SDA and UIA referrals), which had a slight increase
compared to the previous period.
Figure 15: Referral of cases by sector
Source: CCMA, Review of Operations, 2007/8 and 2008/9
• According to Figure 15, most of the cases referred to the CCMA were from the retail sector
(16%), which remained constant in the previous two reporting cycles. This pattern might be
attributed to the fact that the retail sector is home to most vulnerable workers (informal
economy). Following this were the business, professional services (12%), private safety and
security services and construction with 10% of the cases each, and the domestic sector with
9%. The agricultural sector had the lowest percentage of cases and the only sector with a
reduction in the cases reported compared to the previous reporting period.
31
0 2 4 6 8 10 12 14 16 18
2007/08
2008/09
Retail
Business/professional
services
Safety/security (private)
Building/construction
Domestic
Mining
Food/beverage (manufacture)
Agriculture/farming
%
3%4%4%4%4%4%
9%9%
10%9%
10%10%
12%12%
16%16%

Table 19: Conciliations conducted by province
Source: CCMA, Review of Operations, 2008/09
• Table 19 shows that there were a total of 167 641 conciliations conducted, 92% of which were
heard and closed. This reflects a high level efficiency on the part of the staff. However this is 1%
down from the previous reporting cycle where 93% conciliations were heard and closed.
Table 20: Arbitrations conducted and settled by province
Source: CCMA, Review of Operations, 2008/09
• Table 20 shows 40 229 arbitrations conducted and 36 871 settled in 2008/09 financial year.
The arbitrations settlement rate was 92% from those conducted. An increase of one
percentage point from 2007/08 financial year
• By provincial offices, most provinces surpassed the national efficiency rate of 80% of
arbitrations conducted. Head Office was below the efficiency rate of 80% and the national
32
ProvinceTotal conciliations
heard
Conciliations heard and closed
(90% of total conciliations heard)
Count % Previous year Difference
Eastern Cape 5 885 5 425 92% 90% 2%
Free State 4 999 4 680 94% 94% 0%
Gauteng 43 781 40 195 92% 93% -1%
Head Office 105 102 97% 0 97%
KwaZulu-Natal 16 216 14 849 92% 92% 0%
Limpopo 4 494 4 196 93% 93% 0%
Mpumalanga 6 056 5 581 92% 93% -1%
Northern Cape 1 939 1 866 96% 96% 0%
North West 5 210 4 803 92% 92% 0%
Western Cape 13 074 12 555 96% 96% 0%
Total 167 641 154 721 92% 93% -1%
ProvinceTotal arbitrations
conducted
Arbitrations finalised (Efficiency =
80% of arbitrations conducted
2008/09)
Arbitrations finalised (Efficiency =
80% of arbitrations conducted
2007/08)
Count Count Percentage Percentage Difference
Eastern Cape 2 987 2 673 89% 85% 4%
Free State 1 885 1 732 92% 93% -1%
Gauteng 18 122 16 713 92% 92% 0%
Head Office 34 24 71% 0 71%
KwaZulu-Natal 6 261 5 671 91% 90% 1%
Limpopo 2 120 1 860 88% 85% 3%
Mpumalanga 2 531 2 277 90% 92% -2%
Northern Cape 609 583 96% 96% 0%
North West 2 263 2 030 90% 88% 2%
Western Cape 3 417 3 308 97% 94% 3%
Total 40 229 36 871 92% 91% 1%

average rate of 92%.
Table 21: Awards rendered by participant
Source: CCMA Review of Operations 2008/09
• Table 21 shows total awards rendered to parties by region. A total of 24 370 were awarded
with 15 095 (62%) in favour of the employee party, while 9 139 (38%) were in favour of the
employer party. The remaining 136 was deemed to be non-jurisdictional.
33
Provinces Awards in favour of Other Total awards
Employee % Employer %
Eastern Cape 699 58% 501 42% 3 1 203
Free State 975 78% 282 22% 1 1 258
Gauteng 7 590 58% 5 432 42% 15 13 037
Head Office 1 25% 3 75% 0 4
KwaZulu-Natal 2 323 75% 738 24% 30 3 091
Limpopo 899 70% 386 30% 2 1 287
Mpumalanga 575 66% 290 33% 2 867
Northern Cape 206 59% 141 40% 4 351
North West 742 70% 311 29% 6 1 059
Western Cape 1 085 49% 1 055 48% 73 2 213
Total 15 095 62% 9 139 38% 136 24 370
The arbitrations settlement rate was 92% from those conducted.
Section 4:
Occupational healthOccupational health
and safetyand safety
The Occupational Health and Safety Act, Act No. 85 of 1993 aims to provide for the health and
safety of people at work and applies to all workplaces except for the mines and on sea. The Act
protects all people at work against hazards to health and safety arising out of activities carried
while at work.
Labour inspectors are mandated by the Act to inspect workplaces to determine whether they
comply with labour laws. When accidents happen inspectors investigate the incidents and report
on their findings. Incidents at the workplace can result in casualties and non-casualties, where
nobody suffers injuries. In the case of casualties, employees might become injured or lives may be
lost.
The reporting of incidents is compulsory for all employers, but there may be instances of
under-reporting especially when there are no casualties. This is due to the fact that where there
are injuries the affected people will need to claim for compensation and in the case of death the
police need to be involved, thus reporting may become necessary.
4.1. Incidents
Figure 16: Incidents reported by industry
Source: Department of Labour, Integrated Occupational Safety System, 2008/09
• Figure 16 shows the number of incidents that were reported to the inspectorate of the
Department. There were 1 561 incidents during the previous financial year, of which 1 509
resulted in casualties and 52 had no casualties reported
34
0 100 200 300 400 500 600
Non-casualtyCasualty
Agriculture
Mining and quarrying
Manufacturing
Electricity
Construction
Wholesale and retail
Transport
Financial Intermediation
Community
Private household 723
2213
402
82
71
270
99
580
2
3
6
14
1851
690

• About 38% of the casualties happened in the manufacturing industry; 18% in the construction
industry; 15% in the community, social and personal services and 7% in the electricity, gas and
water supply industry. The high number of incidents is an indication of the non-compliance by
employers with health and safety regulations in the workplace, thus putting employees at risk of
injuries.
Figure 17: Incidents reported by provincial offices
Source: Department of Labour, Integrated Occupational Safety System, 2008/09
• As indicated in Figure 17 most of the casualties occurred in the provincial offices where there
is a high concentration of manufacturing industries. Among these are Gauteng North and South,
KwaZulu-Natal, Eastern and Western Cape. The Free State provincial office recorded the least
number of incidents, which is commendable when comparing with the other provinces
mentioned above.
35
0
50
100
150
200
250
300
Non-casualtyCasualty
Gauteng North
Gauteng South
Northern Cape
MpumalangaLimpopoFree State
Eastern Cape
North West
KwaZulu-Natal
Western Cape
194
1
257
2
113
0
216
7 4 0
81
5
130
1831
0
262
13
221
6

4.1.1. Casualties
Figure 18: Casualties reported by industry
Source: Department of Labour, Integrated Occupational Safety System, 2008/09
• In Figure 18 most of the casualties reported did not result in deaths of the employees. The 51
employees who lost their lives were in the construction industry, followed by the manufacturing
(38), agriculture (30), electricity, gas and water supply (26) industries and private households
(23)
• Of the injuries sustained at work, the majority of injuries occurred in the manufacturing
industry (543), followed by construction (221) and community, social and personal services
(207).
36
0 100 200 300 400 500 600
Non-fatalFatal
Agriculture
Mining and quarrying
Manufacturing
Electricity
Construction
Wholesale and retail
Transport
Finance
Community
Private household23
4912
2079
3110
7510
6251
22168
2638
54323
3039
Of the injuries sustained at work, the majority of injuries occurred in the manufacturing industry (543),
followed by construction (221) and community, social and personal services (207).
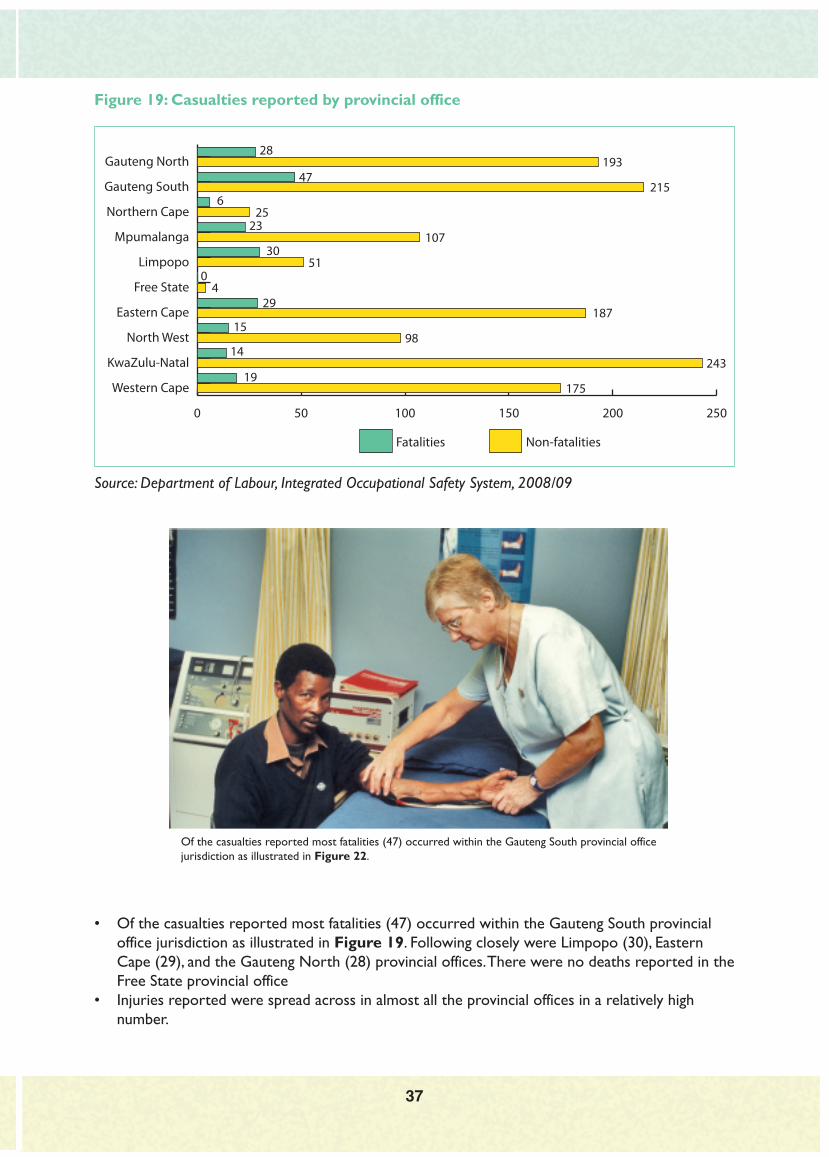
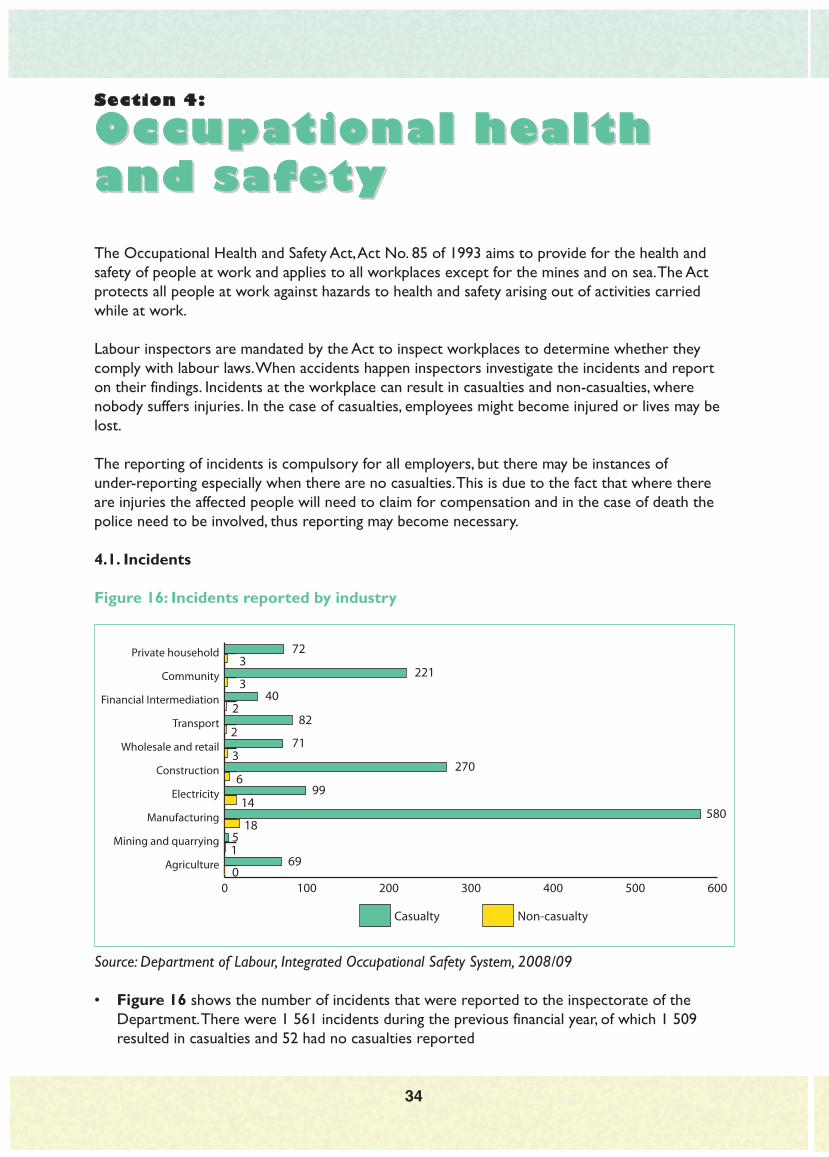
Figure 19: Casualties reported by provincial office
Source: Department of Labour, Integrated Occupational Safety System, 2008/09
• Of the casualties reported most fatalities (47) occurred within the Gauteng South provincial
office jurisdiction as illustrated in Figure 19. Following closely were Limpopo (30), Eastern
Cape (29), and the Gauteng North (28) provincial offices. There were no deaths reported in the
Free State provincial office
• Injuries reported were spread across in almost all the provincial offices in a relatively high
number.
37
0 50 100 150 200 250
Non-fatalitiesFatalities
Western Cape
KwaZulu-Natal
North West
Eastern Cape
Free State
Limpopo
Mpumalanga
Northern Cape
Gauteng South
Gauteng North28
19347
2156
2523
10730
510
429
18715
9814
24319
175
Of the casualties reported most fatalities (47) occurred within the Gauteng South provincial office
jurisdiction as illustrated in Figure 22.

38
Section 5:
ConclusionConclusion
This edition of the Annual Labour Market Bulletin is produced against the backdrop of an
economic recession, which has affected all economies globally. This recession has hit economies
world-wide very hard and its effects in the South African economy have been felt particularly in the
mining and manufacturing sectors. The general government services, personal services and
construction industries however posted some gains during this period. The gains posted by the
construction industries were as a result of the massive infrastructure investment as a result of the
FIFA world cup due to take place in the country in 2010.
Obviously the economic crisis has led to a decrease in the number of jobs created and an increase
in the number of the unemployed. The construction and the private households industries were
able to create some jobs during the course of the reporting period albeit not sustainable. This state
of affairs generally affects women although men were also victims of the crisis particularly those
sectors, which are traditionally male-dominated.
The number of industrial actions experienced has also dropped compared with the previous
period, and the CCMA has demonstrated some improvements in the resolution of some industrial
disputes as it has at times surpassed the efficiency targets it has set for itself.
With regard to the occupational health and safety of workers in workplaces, incidents still occur
especially where workers lose their lives. The continued presence of these incidents is by no means
accidental but points directly to the employers not complying with health and safety regulations at
work. The Department will always do its best in fulfilling its mandate by providing information and
inspection of the workplaces to eradicate this disturbing trend.
The continued presence of these incidents is by no means accidental but points directly to the
employers not complying with health and safety regulations at work.

5.1. Policy implications
The decrease in economic growth will mean reduced revenue and obviously reduced spending in
public programmes. The government will need to revise priorities in public spending amidst tight
fiscal control, while also mitigating the effects of the recession on particularly the poor and the
vulnerable. Retrenched workers will need re-training in new skills to enable them to re-enter the
labour market. The training in new skills should involve skills that are needed in the economy to
make them marketable. The challenge however is that the majority of the retrenched workers are
low-skilled.
Plans by the Department as announced by the Minister in his 2009 budget speech to increase the
amount and the period of payment of unemployment insurance are efforts to rescue the crisis
situation and widen the net for the unemployed. The country’s response to the global economic
crisis should also assist in reviving the economy and protecting the vulnerable sectors of the
economy based on the agreed plans by government, organised business and organised labour.
39