Introduction to the IEEE Transactions on Big Data (Jan-March 2015)
An Enhanced Visualization Method to AidBehavioral Trajectory Pattern RecognitionInfrastructure for Big Longitudinal Data
Hua Fang and Zhaoyang Zhang
Abstract—Big longitudinal data provide more reliable information for decision making and are common in all kinds of fields. Trajectory
pattern recognition is in an urgent need to discover important structures for such data. Developing better and more computationally-
efficient visualization tool is crucial to guide this technique. This paper proposes an enhanced projection pursuit (EPP) method to better
project and visualize the structures (e.g., clusters) of big high-dimensional (HD) longitudinal data on a lower-dimensional plane. Unlike
classic PP methods potentially useful for longitudinal data, EPP is built upon nonlinear mapping algorithms to compute its stress (error)
function by balancing the paired weights for between and within structure stress while preserving original structure membership in the
high-dimensional space. Specifically, EPP solves an NP hard optimization problem by integrating gradual optimization and non-linear
mapping algorithms, and automates the searching of an optimal number of iterations to display a stable structure for varying sample
sizes and dimensions. Using publicized UCI and real longitudinal clinical trial datasets as well as simulation, EPP demonstrates its
better performance in visualizing big HD longitudinal data.
Index Terms—Enhanced projection pursuit, pattern recognition, visualization, longitudinal data
Ç
1 INTRODUCTION
BUILDING up the infrastructure for big data visualiza-tion is a challenge but an urgent need [1], [2]. Big lon-
gitudinal data are generated every day from all kinds offields in industry, business, government and researchinstitutes [3], [4], [5], [6], [7], [8], [9], [10], [11], [12], [13],[14], [15]. Discovering useful information from heteroge-neous data requires trajectory pattern recognition techni-ques [16], [17], [18], [19], [20], [21], [22]. However,developing visualization tools is crucial to guide thistechnique, which can facilitate the discovery, presentationand interpretation of important structures buried in com-plex high-dimensional data. Projection Pursuit (PP) is aclassical technique to data visualization, first introducedby Friedman and Tukey in 1974 for exploratory analysisof multivariate data [23]. The basic idea of PP is to designand numerically optimize a projection index function tolocate interesting projections from high- to low-dimen-sional space. From these interesting projections, revealed
structures such as clusters could be analyzed [24], [25],[26], [27]. PP is based on the assumption that redundancyexists in the data and the major characteristics are concen-trated into clusters. For example, principle componentsanalysis is one of the typical PP methods, widely used fordimension reduction by removing uninteresting direc-tions of variations [23], [26], [28], [29], [30], [31], [32], [33],[34], [35], [36], [37], [38], [39] and now often used as aninitialization before high dimensional data mapping andclustering [26], [40], [41], [42], [43].
In the present study, our newly developed PP methodis compared to two typical PP methods: Andrews Curvesand Grand Tour, as all three methods are potentially use-ful for big longitudinal data visualization where highdimensionality (HD) and repeated measures for eachdimension are common. Section 2 introduces AndrewsCurves and Grand Tour; Section 3 discusses the EPP func-tion and algorithms; Section 4 includes the comparison ofEPP with other methods using real datasets; Section 5evaluates EPP with simulated and artificial data; Section 6concludes this study.
2 ANDREWS CURVES AND GRAND TOUR
Proposed in 1972, Andrews Curve has been widely utilizedin many disciplines such as biology, neurology, sociologyand semiconductor manufacturing. The algorithm ofAndrews Curve was designed to project high dimensionaldata onto a predefined Fourier series [44], and if any struc-tures exist, they may be visible via Andrews Curves. Briefly,for each case X ¼ x1; x2; . . . ; xdf g, which is a vector of meas-urements, we define a series ð 1ffiffi
2p ; sin ðsÞ; cos ðsÞ; sin ð2sÞ;
cos ð2sÞ; . . .Þ, then the Andrews Curve is calculated as
� H. Fang is with the Department of Computer and Information Science,Department of Mathematics, University of Massachusetts Dartmouth,285 Old Westport Rd, Dartmouth, MA 02747 and the Department ofQuantitative Health Sciences, University of Massachusetts MedicalSchool, Worcester, MA 01605. E-mail: [email protected].
� Z. Zhang is with the College of Engineering, University of MassachusettsDartmouth and Department of Quantitative Health Sciences, Universityof Massachusetts Medical School, Worcester, MA 01655.E-mail: [email protected].
Manuscript received 30 Jan. 2016; revised 26 Aug. 2016; accepted 18 Oct.2016. Date of publication 15 Jan. 2017; date of current version 7 June 2018.Recommended for acceptance by J. Chen and H. Wang.For information on obtaining reprints of this article, please send e-mail to:[email protected], and reference the Digital Object Identifier below.Digital Object Identifier no. 10.1109/TBDATA.2017.2653815
IEEE TRANSACTIONS ON BIG DATA, VOL. 5, NO. 2, APRIL-JUNE 2018 289
2332-7790� 2017 IEEE. Personal use is permitted, but republication/redistribution requires IEEE permission.See ht _tp://www.ieee.org/publications_standards/publications/rights/index.html for more information.
fxðsÞ ¼ x1ffiffiffi2
p þ x2 sin ðsÞ þ x3 cos ðsÞ þ x4 sin ð2sÞ þ . . . ; (1)
for �p < s < p. Each case may be viewed as a curvebetween �p and p, and structures may be viewed as differ-ent clusters of curves. Since 1972, several variants of theAndrews Curve have been proposed. Andrews himself alsoproposed to use different integers to generalize fxðsÞ,
fxðsÞ ¼x1 sin ðn1sÞ þ x2 cos ðn1sÞþ x3 sin ðn2sÞ þ x4 cos ðn2sÞ þ � � � : (2)
By testing n1 ¼ 2; n2 ¼ 4; n3 ¼ 8; . . ., the author con-cluded that Equation (2) is more space filling (ie., a curvewhose range contains the entire 2-dimensional unit square,or the mapping is continuous) than Equation (1) but moredifficult to interpret when used for visual inspection [44]. Athree-dimensional Andrews plot was suggested by Khattreeand Naik [45],
ffiffiffi2
pfxðsÞ ¼ x1 þ x2 sin ðsÞ þ cos ðsÞ½ �þx3 sin ðsÞ � cos ðsÞ½ � þ x4 sin ð2sÞ þ cos ð2sÞ½ � þ � � � : (3)
As every projection point is exposed to a sine functionand a cosine function, the advantage in Equation (3) is thatthe trigonometric terms do not simultaneously vanish atany given s, which establishes an interesting relationbetween the Andrews Curve and the eigenvectors of a sym-metric positive definite circular covariance matrix.
Different from Andrews Curve, Grand Tour proposed byAsimov [46] and Buja [47] in 1985 is an interactive visualiza-tion technique. The basic idea is to rotate the projected planefrom all angles and search the interesting structures [48], [49],[50], [51], [52], [53]. However, these methods were not idealin terms of intensive computation, computer storage, andprojection recovery turns out to be difficult. Motivated byAndrews Curve, Wegman and Shen [54] suggested an algo-rithm for computing an approximate two-dimensional grandtour, called pseudo grand tour which means that the tourdoes not visit all possible orientations of a projection plane.Themethod has recognized advantages, such as easy calcula-tion, time efficiency in visiting any regions with differentplane orientations, and easy recovery of projection. Briefly,assuming d is an even number without loss of generality [57],let a1ðsÞ be
ffiffiffi2
d
rsin ð�1sÞ; cos ð�1sÞ; . . . ; sin ð�d=2sÞ; cos ð�d=2sÞ
� �; (4)
and a2ðsÞ beffiffiffi2
d
rcos ð�1sÞ;� sin ð�1sÞ; . . . ; cos ð�d=2sÞ;� sin ð�d=2sÞ
� �; (5)
where �i has irrational values. a1ðsÞ and a2ðsÞ have the fol-lowing properties,
a1ðsÞk k22¼2
d
Xd=2j¼1
sin 2ð�jsÞ þ cos 2ð�jsÞ� � ¼ 1;
a2ðsÞk k22¼2
d
Xd=2j¼1
cos 2ð�jsÞ þ ð� sin Þ2ð�jsÞ� �
¼ 1;
(6)
and
a1ðsÞ; a2ðsÞh i ¼2
d
Xd=2j¼1
sin ð�jsÞ cos ð�jsÞ � cos ð�jsÞ sin ð�jsÞ� � ¼ 0;
(7)
where �h i is the inner product of two vectors a1ðsÞ and a2ðsÞ.Then, the projections of data points on the plane formed bythe two basic vectors are
fxiðsÞ ¼ X0i1; X
0i2
� �; i ¼ 1; 2; . . . ; N; (8)
in which
X0i1¼
Xdk¼1
xka1k;
X0i2¼
Xdk¼1
xka2k:
(9)
According to (6), a1ðsÞ and a2ðsÞ form an orthonormalbasis for a two dimensional plane. Because of the depen-dence between sin ð�Þ and cos ð�Þ, this two-dimensional planeis not quite space filling. However, the algorithm based on(8) is much computationally convenient. By taking the innerproduct as in (7), a a1ðsÞ; a2ðsÞ½ � plane is constructed onwhichthe high dimensional data are projected.
Different from Andrews Curve and Pseudo Grand Tour,our new enhanced projection pursuit (EPP) method wasbuilt upon Sammon Mapping, assuming not all big longitu-dinal data fit trigonometric functions or transformation.Sammon mapping has been one of the most successful non-linear multidimensional scaling methods [55], [56] proposedby Sammon in 1969 [57]. It is highly effective and robust tohyper-spherical and hyper-ellipsoidal clusters [57]. The ideais to minimize the error (called “stress”) between the distan-ces of projected points and the distances of the original datapoints by moving around projected data points on lowerdimensional space (mostly 2-dimenstional place) to best rep-resent those in high-dimensional space. Since its advent,much effort concentrated on improving the optimizationalgorithm [58], [59], [60], [61], [62] but rarely on modifyingSammon’s Stress function [61].
Our proposed EPP modified Sammon Stress Function bybalancing two weights for between and within cluster errors,respectively, in order to better segment and visualize struc-tures (e.g., clusters) on a projected two-dimensional planewhile preserving their cluster membership in high-dimen-sional space. To this end, we developed a nonlinear algorithmto compute EPP stress. Besides, our EPP was developed toautomate the searching and finding of the optimal number ofiterations to display a stable structure, for varying samplesizes and dimensions. Our goal is to aid the trajectory patternrecognition of longitudinal data. To evaluate the performanceof EPP, one big publicized data set and two real longitudinalrandom controlled trials (RCT) datasets including a largeweb-delivered trial data were used to compare EPP withAndrews Curve and Pseudo Grand Tour. Simulated big lon-gitudinal data sets based on RCT data parameters were usedto evaluate EPP performance at varying conditions.
290 IEEE TRANSACTIONS ON BIG DATA, VOL. 5, NO. 2, APRIL-JUNE 2018

3 ENHANCED PROJECTION PURSUIT
In longitudinal data analyses, repeated measures for eachdimension result in inevitable high-dimensionality. Builtupon Sammon Mapping [57], we proposed an EnhancedProjection Pursuit method where the Sammon stressbecomes a special case of EPP stress when there is onlyone cluster and the weights of within and between clusterstresses are equal. EPP is used to aid trajectory patternrecognition for such longitudinal data. The key idea ofEPP is to balance the weights of between and within clus-ter variations in order to achieve better visualization,thus aid pattern recognition for high dimensional longitu-dinal data. Table 1 summarizes the notations used hereaf-ter. First, we define our data size and high dimensionalspace.
Definition 1. Let N be the number of cases (e.g., subjects, datapoints, etc. ), Xi; 1 � i � N be a vector of d variablesx1; x2; . . . ; xdf g, each Xi be repeatedly measured with t times,
then the data has dt dimensional space and the entire data sizeis ‘ ¼ Ndt. e.g, with N cases, Xi is a dt dimensional vectorx11; x12; . . . ; x1t; x21; x22; . . . ; x2t; . . . ; xd1; xd2; . . . ; xdtf g.Then, the projection of the big longitudinal data from
high-dimensional space onto a two-dimensional plane isdefined as follows:
Definition 2. To project big HD longitudinal data onto a twodimensional plane and similar to [57], let the distance betweenany two vectors of Xi and Xj in the dt high dimensional spacebe defined by D�
ij, D�ij ¼ Xi � Xj
�� ��2, where �k k2 is the Euclid-
ean norm.
Based on Definitions 1 and 2, randomly choose an initialtwo-dimensional space for the N vectors of X0 and computeall the two dimensional distances Dij; 1 � i; j � N; i 6¼ j.The Sammon Stress [57] is calculated as:
Ssam ¼ 1Pi< j D
�ij
Xi < j
D�ij �Dij
� �2
D�ij
: (10)
Different from Equation (10), the Stress of EPP stressfunction SEPP is expressed as the weighted sum of thewithin-cluster stress SEPP w and between-cluster stressSEPP b,
SEPP ¼ aSEPP w þ bSEPP b; (11)
in which
SEPP w ¼ 1Pi < j
D�ij
Pi < j;ci¼cj
D�ij�Dwij
� �2
D�ij
SEPP b ¼ 1Pi < j
D�ij
Pi< j;ci 6¼cj
D�ij�Dbij
� �2
D�ij
;
8>>>>><>>>>>:
(12)
where 1Pi < j
D�ij
is a constant for a given big HD longitudinal
data,P
i < j;ci¼cj
ðD�ij�Dwij
Þ2D�ij
andP
i < j;ci 6¼cj
ðD�ij�Dbij
Þ2D�ij
are the
within-cluster and between-cluster stress, respectively, Dwij
is the within cluster Euclidean distance between case i and j
if they are in the same cluster, and Dbij is the between clus-
ter Euclidean distance between case i and j if they belong to
different clusters; a and b are the weights of the within-clus-
ter stress and between-cluster stress, respectively, a;b > 0
and aþ b ¼ 1. Note again that the Sammon stress is a spe-
cial case of EPP stress when there is only one cluster,
ci ¼ 1; i ¼ 1; 2; . . . ; N and the weights of within cluster and
between cluster stresses are equal, a ¼ b.EPP algorithm aims to obtain an interesting two-dimen-
sional projection of the original high dimensional data thatminimizes its stress function. The optimization problem isexpressed as
minimize aSEPP w þ bSEPP b
subject to a;b > 0;aþ b ¼ 1:(13)
Definition 3. To minimize SEPP ða;b; fxÞ where fx stands forthe projections of Dwij
and Dbij , the gradual approximationalgorithm works as: Given a fixed pair of a and b, update thevalues of fx where SEPP has the minimum value, that is, keepupdating a and b until there are no changes according to (12).
a ¼ aþ d;b ¼ b� d; if SEPP ðaþ d;b� d; fxÞ < SEPP
a ¼ a� d;b ¼ bþ d; if SEPP ða� d;bþ d; fxÞ < SEPP
a ¼ a;b ¼ b; otherwise:
8<:
(14)
The main EPP algorithm is shown in Algorithm 1(a).The embedded gradual approximation algorithm is dis-played in Algorithm 1(b) to minimize SEPP given a and b;the values of fx were retained when SEPP has the mini-mum value. Specifically, the EPP algorithm initialize X0
based on the results from PCA; update fx according toAlgorithm 1(b) based on Equation (15), calculate the EPPstress and update a and b, with a weight change step d
based on Equation (14). If the difference between two con-secutive stress values is less than the threshold ", the
TABLE 1Notations
Symbols Definitions
X a vector of measurementsXi;Xj The ith and jth casesXi
0;Xj0 The projections in a 2D space
s angle, 0 < s < p� Linearly independent over the rationala1ðsÞ; a2ðsÞ Orthonormal basis for a 2D planeN Number of casesT Sample timesd Number of dimensionalp Number of componentsDij Distance between Xi
0 and Xj0
D�ij Distance between Xi and Xj
S Stressci Cluster label of case ik The optimal number of clustersD Average distance‘ Total data sizea Weight of the within-cluster stressb Weight of the between-cluster stressSEPP Total EPP stressfx Low-dimensional projections of data‘ Size of the simulated data
FANG AND ZHANG: AN ENHANCED VISUALIZATION METHOD TO AID BEHAVIORAL TRAJECTORY PATTERN RECOGNITION... 291

algorithm stops. Repeat this process until reaching themaximum iteration number, lmax.
fxl ¼ argminfx
SEPP ðal;bl; fxÞ: (15)
Algorithm 1(a).Main EPP Algorithm
Input: longitudinal data Xi; i ¼ 1; 2; . . . ; N , cluster labelsci; 0 � i � N , and a range of stress error bound ", maxi-mum iteration number, lmax, weight change step d
Output: a, b, fx and SEPP
1: Initialize X0 by PCA2: Set initial values for SEPP 0
! 1, l ¼ 0,m ¼ 0, a0 and b0
(a0; b0 > 0;a0 þ b0 ¼ 1)3: for l ¼ 0 to lmax do4: fxl ¼ argminfx SEPP ðal;bl; fxÞ5: SEPP l
¼ SEPP ðalþ1;blþ1; fxlÞ6: while al;bl > 0;al þ bl ¼ 1 do7: if SEPP ðal þ d;bl � d; fxl Þ < SEPP ðal;bl; fxl Þ then8: alþ1 ¼ alþ1 þ d, blþ1 ¼ blþ1 � d
9: else10: if SEPP ðal � d;bl þ d; fxl Þ < SEPP ðal;bl; fxl Þ then11: alþ1 ¼ alþ1 � d, blþ1 ¼ blþ1 þ d
12: else13: break14: end if15: end if16: end while17: if SEPP l
� SEPPl�1
�� �� � " then18: break19: end if20: end for
Algorithm 1(b). Algorithm for Updating fx
Input: Projections X0, a and b, error bound ", maximum itera-tion numbermmax, SEPP
ð0Þ ! 1Output: SEPP
ðmþ1Þ and fxðmþ1Þ
1: form ¼ 0 tommax do2: fx
ðmþ1Þ ¼ fxðmÞ � t � DðmÞ
3: SEPPðmþ1Þ ¼ SEPP ða;b; fxðmþ1ÞÞ
4: if SEPPðmþ1Þ � SEPP
ðmÞ��� ��� � " then
5: break6: end if7: end for
Note that in Algorithm 1(b) when updating fx, fxðmÞ are
the projections of the data on the two-dimensional space atthe mth iteration, t is the iteration step size which is set at
0.3 or 0.4 according to [57], DðmÞ ¼ @SEPPðmÞ
@fxðmÞ
@2SEPP
ðmÞ
@ fxðmÞð Þ2
�������� and
w ¼ �2Pi < j
D�ij
is a constant. Then the first-order derivative
with respect to fx is shown in Equation (16) and the second-order derivative is expressed in Equation (17).
@SEPPðmÞ
@fxðmÞ ¼
wPN
j¼1;j6¼p
D�j�Dwj
D�jDwj
�fx
ðmÞ �Xj0ðmÞ
� �if cp ¼ cj;
wPN
j¼1;j6¼p
D�j�Dbj
D�jDbj
�fx
ðmÞ �Xj0ðmÞ
� �if cp 6¼ cj:
8>><>>:
(16)
@2SEPPðmÞ
@ fxðmÞ
� �2
¼wPN
j¼1;j6¼p1
D�jDwj
D�j �Dwj
� �� fx
ðmÞ�Xj0ðmÞð Þ2
Dwj1þ D�
j�Dwj
Dwj
� � �if cp ¼ cj;
wPN
j¼1;j6¼p1
D�jDbj
D�j �Dbj
� �� fx
ðmÞ�Xj0ðmÞð Þ2
Dbj1þ D�
j�Dbj
Dbj
� �if cp 6¼ cj:
8>>><>>>:
(17)
Unlike nonlinear mapping algorithm [57], the EPP algo-rithm further automates the searching and finds the optimalnumber of iterations to display a stable structure by learn-ing the change of SEPP in two consecutive iterations at arange of varying error bounds, sample size and the numberof dimensions.
4 EPP PERFORMANCE IN CASE STUDIES
Our EPP method was tested on 3 real datasets, including onepublicized [63] and two random controlled trial datasets [41],[64], [65], [66]. These data features are summarized in Table 2.
The Waveform data were generated by a clustering datagenerator described in [67] and published by [63], [67]. Itconsists of 5,000 cases, each with 21 attributes (‘ ¼ 105;000).There are 3 clusters of waves identified for testing algo-rithms. Fig. 1 shows the performance of the three PP meth-ods for waveform datasets. Clearly, Andrews Curve andgrand tour were unable to visualize the three classes whilethe EPP demonstrated its projection power in visualizingthe 3-cluster structure.
TDTA data were collected from a longitudinal culturally-tailored smoking cessation intervention for 109 Asian Ameri-can smokers (‘ ¼ 2;180). It contains three identified cultur-ally-adaptive response patterns [41]. This intervention usedthree components: Cognitive behavioral therapy, cultural tai-loring, and nicotine replacement therapy. The first two weremeasured by scores on Perceived Risks and Benefits, Familyand Peer Norms, and Self-efficacy scales. Each scale has fourrepeated measures, total 20 attributes, of which only Per-ceived Benefits and FamilyNormswere usedusing ourmulti-ple imputation based fuzzy clustering method discussedelsewhere [68], [69], [70]. As shown in Fig. 2, two of the threeclusters projected by Andrews Curve was completely over-lapped, while Grand Tour seems to perform as good as EPPfor this longitudinal dataset. The parameters of TDTA dataare shown in Tables 3 and 4.
QuitPrimo dataset includes 1,320 cases (‘ ¼ 23;760) withmissing values about 8.4 percent. This study aims to evalu-ate an integrated informatics solution to increase access toweb-delivered smoking cessation support. The data is col-lected via an online referral portal about three components:1) My Mail, 2) Online Community, 3) Our Advice. Each of
TABLE 2Real Data Description
Name Waveform TDTA QuitPrimo
Cases(N) 5,000 109 1,320Components(p) 21 5 3Time points(t) 1 4 6Total data size(‘) 105,000 2,180 23,760Clusters(c) 3 3 4
292 IEEE TRANSACTIONS ON BIG DATA, VOL. 5, NO. 2, APRIL-JUNE 2018

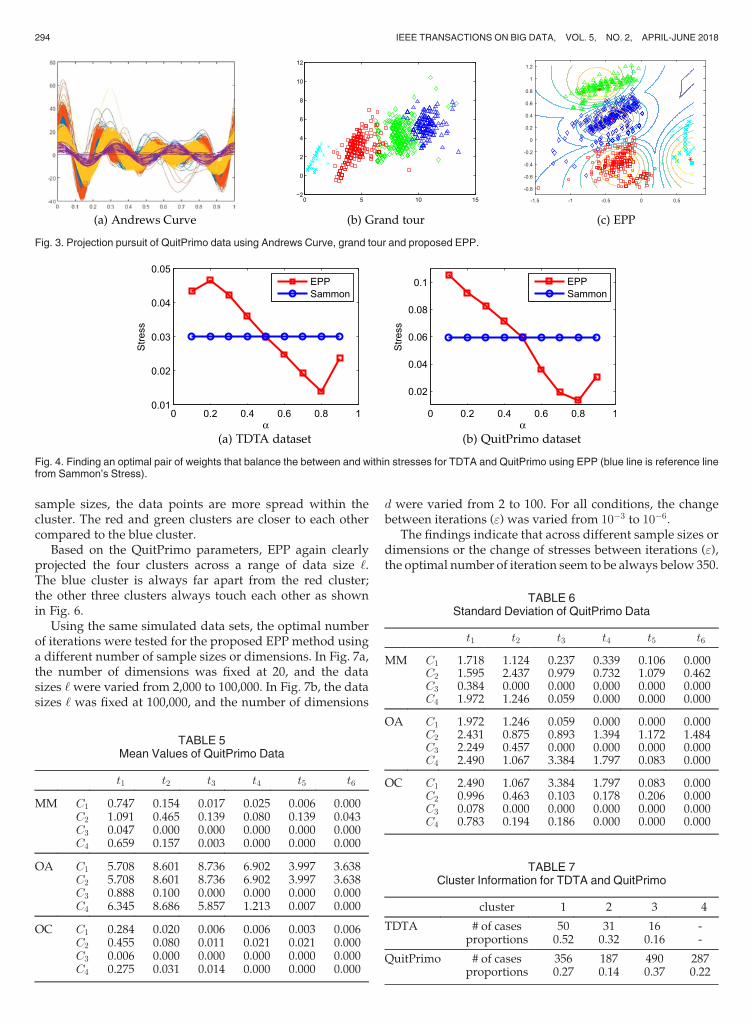
the first three component has 6 monthly values measuredduring 6 months. Fig. 3 again showcases the strength of EPPover the other two methods for this big longitudinal dataset.Projected four patterns were overlapped using AndrewsCurve while and the blue and green patterns were over-lapped to a noticeable degree using the Grand Tour. Tables 5and 6 show the mean values and standard deviations ofQuitPrimo dataset, respectively.
The optimal pairs, a and b, for included real longitudinaldatasets TDTA and QuitPrimo given fx can be detected bythe following steps. Initialize a pair of values, e.g., (0.5,0.5),and calculate the stress of the proposed EPP method byEquations (10) and (11). Increase a and decrease b, or viceversa, by a boundary parameter d, e.g., d ¼ 0:1, to obtain anew stress value. Updating a and b until the stress valuesno longer decease, we can obtain the optimal weights a andb for the within and between cluster stresses. As shown inFigs. 4a and 4b, the optimal weights of (0.8, 0.2) werefounded for TDTA and QuitPrimo data, respectively.
5 EPP PERFORMANCE USING SIMULATED
LONGITUDINAL DATA
The proposed EPP was also evaluated using simulated data.First, simulated longitudinal data were generated using
parameters from the two real datasets, TDTA andQuitPrimo.The data generation procedure is described as follows:
1) Fit the multivariate normal distribution to TDTA andthe zero-inflated Poisson mixture distribution to theQuitPrimo web trial data [68], respectively, and learnthe parameters such as cluster mean vectors andstandard deviations, the results are shown inTables 3, 4, 5, and 6;
2) Set the number of cases of each cluster according tothe proportion of each cluster (Table 7);
3) Generate data for each cluster based on the modelparameters from (1) and cluster size (2).
4) Randomize data from (3) to generate a completedataset;
5) Repeat (1-4) and generate datasets with varyingsample sizes, N is in f100; 200; 300; 500; 1;000; 5;000g,dTDTA ¼ 20; dQuitPrimo ¼ 18, and ‘TDTA ¼ f2;000; 4;000;6;000; 10;000; 20;000; 100;000g; ‘QuitPrimo ¼ f1;800; 3;600;4;800; 9;000; 18;000; 36;000g.
Fig. 5 displays the EPP projection based on the TDTAparameters using different sample sizes. From N ¼ 100 toN ¼ 5;000, the clusters are clearly projected. With smaller
Fig. 2. Projection pursuit of TDTA data using Andrews Curve, grand tour and proposed EPP.
Fig. 1. Projection pursuit of waveform data using Andrews Curve, grand tour and proposed EPP.
TABLE 4Standard Deviation of TDTA Data
t1 t2 t3 t4
Benefits C1 13.89 21.15 17.35 22.60C2 14.88 25.80 16.21 14.54C3 26.38 16.11 16.59 19.95
Family Norm C1 9.94 7.19 9.88 12.20C2 7.22 7.98 9.14 9.63C3 12.96 10.81 12.17 9.47
TABLE 3Mean Values of TDTA Data
t1 t2 t3 t4
Benefits C1 133 128 127 127C2 138 127 133 134C3 113 112 115 112
Family Norm C1 116 116 113 111C2 116 115 114 115C3 101 102 100 99
FANG AND ZHANG: AN ENHANCED VISUALIZATION METHOD TO AID BEHAVIORAL TRAJECTORY PATTERN RECOGNITION... 293
sample sizes, the data points are more spread within thecluster. The red and green clusters are closer to each othercompared to the blue cluster.
Based on the QuitPrimo parameters, EPP again clearlyprojected the four clusters across a range of data size ‘.The blue cluster is always far apart from the red cluster;the other three clusters always touch each other as shownin Fig. 6.
Using the same simulated data sets, the optimal numberof iterations were tested for the proposed EPP method usinga different number of sample sizes or dimensions. In Fig. 7a,the number of dimensions was fixed at 20, and the datasizes ‘ were varied from 2,000 to 100,000. In Fig. 7b, the datasizes ‘ was fixed at 100,000, and the number of dimensions
d were varied from 2 to 100. For all conditions, the changebetween iterations (") was varied from 10�3 to 10�6.
The findings indicate that across different sample sizes ordimensions or the change of stresses between iterations ("),the optimal number of iteration seem to be always below 350.
Fig. 3. Projection pursuit of QuitPrimo data using Andrews Curve, grand tour and proposed EPP.
TABLE 5Mean Values of QuitPrimo Data
t1 t2 t3 t4 t5 t6
MM C1 0.747 0.154 0.017 0.025 0.006 0.000C2 1.091 0.465 0.139 0.080 0.139 0.043C3 0.047 0.000 0.000 0.000 0.000 0.000C4 0.659 0.157 0.003 0.000 0.000 0.000
OA C1 5.708 8.601 8.736 6.902 3.997 3.638C2 5.708 8.601 8.736 6.902 3.997 3.638C3 0.888 0.100 0.000 0.000 0.000 0.000C4 6.345 8.686 5.857 1.213 0.007 0.000
OC C1 0.284 0.020 0.006 0.006 0.003 0.006C2 0.455 0.080 0.011 0.021 0.021 0.000C3 0.006 0.000 0.000 0.000 0.000 0.000C4 0.275 0.031 0.014 0.000 0.000 0.000
TABLE 6Standard Deviation of QuitPrimo Data
t1 t2 t3 t4 t5 t6
MM C1 1.718 1.124 0.237 0.339 0.106 0.000C2 1.595 2.437 0.979 0.732 1.079 0.462C3 0.384 0.000 0.000 0.000 0.000 0.000C4 1.972 1.246 0.059 0.000 0.000 0.000
OA C1 1.972 1.246 0.059 0.000 0.000 0.000C2 2.431 0.875 0.893 1.394 1.172 1.484C3 2.249 0.457 0.000 0.000 0.000 0.000C4 2.490 1.067 3.384 1.797 0.083 0.000
OC C1 2.490 1.067 3.384 1.797 0.083 0.000C2 0.996 0.463 0.103 0.178 0.206 0.000C3 0.078 0.000 0.000 0.000 0.000 0.000C4 0.783 0.194 0.186 0.000 0.000 0.000
Fig. 4. Finding an optimal pair of weights that balance the between and within stresses for TDTA and QuitPrimo using EPP (blue line is reference linefrom Sammon’s Stress).
TABLE 7Cluster Information for TDTA and QuitPrimo
cluster 1 2 3 4
TDTA # of cases 50 31 16 -proportions 0.52 0.32 0.16 -
QuitPrimo # of cases 356 187 490 287proportions 0.27 0.14 0.37 0.22
294 IEEE TRANSACTIONS ON BIG DATA, VOL. 5, NO. 2, APRIL-JUNE 2018

Fig. 6. EPP for simulated longitudinal data using QuitPrimo parameters and from 1,800 to 36,000.
Fig. 5. EPP for simulated longitudinal data using TDTA parameters and ‘ is from 2,000 to 100,000.
Fig. 7. The optimal number of iterations for EPP at different number of sample sizes or dimensions for simulated data.
FANG AND ZHANG: AN ENHANCED VISUALIZATION METHOD TO AID BEHAVIORAL TRAJECTORY PATTERN RECOGNITION... 295
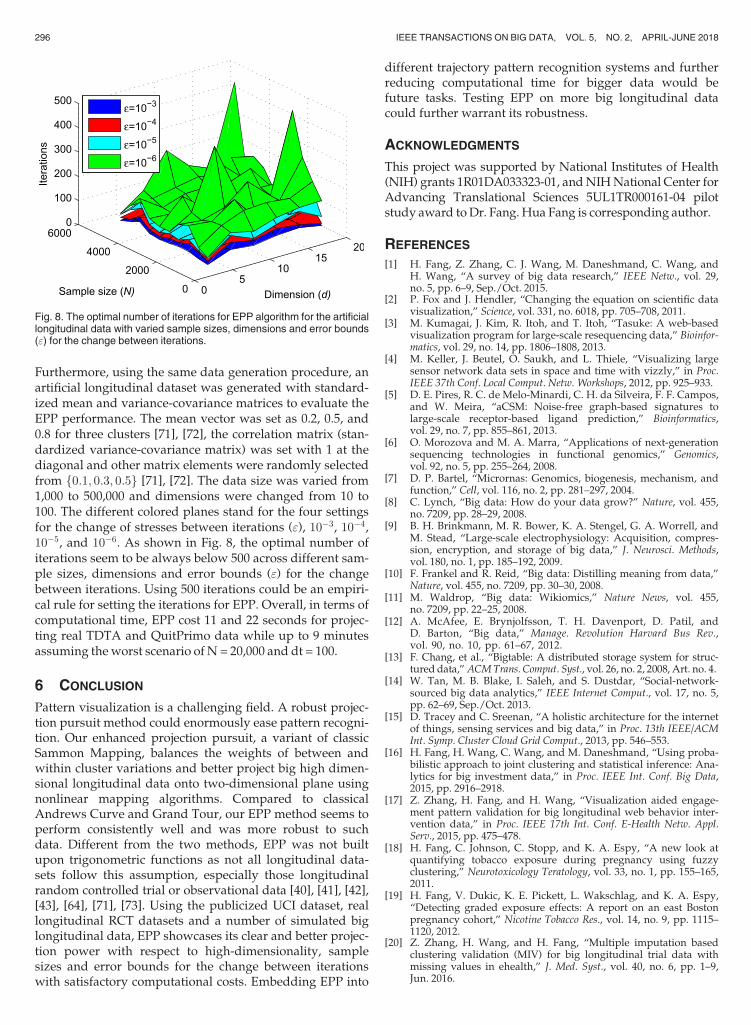
Furthermore, using the same data generation procedure, anartificial longitudinal dataset was generated with standard-ized mean and variance-covariance matrices to evaluate theEPP performance. The mean vector was set as 0.2, 0.5, and0.8 for three clusters [71], [72], the correlation matrix (stan-dardized variance-covariance matrix) was set with 1 at thediagonal and other matrix elements were randomly selectedfrom f0:1; 0:3; 0:5g [71], [72]. The data size was varied from1,000 to 500,000 and dimensions were changed from 10 to100. The different colored planes stand for the four settingsfor the change of stresses between iterations ("), 10�3, 10�4,10�5, and 10�6. As shown in Fig. 8, the optimal number ofiterations seem to be always below 500 across different sam-ple sizes, dimensions and error bounds (") for the changebetween iterations. Using 500 iterations could be an empiri-cal rule for setting the iterations for EPP. Overall, in terms ofcomputational time, EPP cost 11 and 22 seconds for projec-ting real TDTA and QuitPrimo data while up to 9 minutesassuming theworst scenario of N = 20,000 and dt = 100.
6 CONCLUSION
Pattern visualization is a challenging field. A robust projec-tion pursuit method could enormously ease pattern recogni-tion. Our enhanced projection pursuit, a variant of classicSammon Mapping, balances the weights of between andwithin cluster variations and better project big high dimen-sional longitudinal data onto two-dimensional plane usingnonlinear mapping algorithms. Compared to classicalAndrews Curve and Grand Tour, our EPP method seems toperform consistently well and was more robust to suchdata. Different from the two methods, EPP was not builtupon trigonometric functions as not all longitudinal data-sets follow this assumption, especially those longitudinalrandom controlled trial or observational data [40], [41], [42],[43], [64], [71], [73]. Using the publicized UCI dataset, reallongitudinal RCT datasets and a number of simulated biglongitudinal data, EPP showcases its clear and better projec-tion power with respect to high-dimensionality, samplesizes and error bounds for the change between iterationswith satisfactory computational costs. Embedding EPP into
different trajectory pattern recognition systems and furtherreducing computational time for bigger data would befuture tasks. Testing EPP on more big longitudinal datacould further warrant its robustness.
ACKNOWLEDGMENTS
This project was supported by National Institutes of Health(NIH) grants 1R01DA033323-01, andNIHNational Center forAdvancing Translational Sciences 5UL1TR000161-04 pilotstudy award toDr. Fang.Hua Fang is corresponding author.
REFERENCES
[1] H. Fang, Z. Zhang, C. J. Wang, M. Daneshmand, C. Wang, andH. Wang, “A survey of big data research,” IEEE Netw., vol. 29,no. 5, pp. 6–9, Sep./Oct. 2015.
[2] P. Fox and J. Hendler, “Changing the equation on scientific datavisualization,” Science, vol. 331, no. 6018, pp. 705–708, 2011.
[3] M. Kumagai, J. Kim, R. Itoh, and T. Itoh, “Tasuke: A web-basedvisualization program for large-scale resequencing data,” Bioinfor-matics, vol. 29, no. 14, pp. 1806–1808, 2013.
[4] M. Keller, J. Beutel, O. Saukh, and L. Thiele, “Visualizing largesensor network data sets in space and time with vizzly,” in Proc.IEEE 37th Conf. Local Comput. Netw. Workshops, 2012, pp. 925–933.
[5] D. E. Pires, R. C. de Melo-Minardi, C. H. da Silveira, F. F. Campos,and W. Meira, “aCSM: Noise-free graph-based signatures tolarge-scale receptor-based ligand prediction,” Bioinformatics,vol. 29, no. 7, pp. 855–861, 2013.
[6] O. Morozova and M. A. Marra, “Applications of next-generationsequencing technologies in functional genomics,” Genomics,vol. 92, no. 5, pp. 255–264, 2008.
[7] D. P. Bartel, “Micrornas: Genomics, biogenesis, mechanism, andfunction,” Cell, vol. 116, no. 2, pp. 281–297, 2004.
[8] C. Lynch, “Big data: How do your data grow?” Nature, vol. 455,no. 7209, pp. 28–29, 2008.
[9] B. H. Brinkmann, M. R. Bower, K. A. Stengel, G. A. Worrell, andM. Stead, “Large-scale electrophysiology: Acquisition, compres-sion, encryption, and storage of big data,” J. Neurosci. Methods,vol. 180, no. 1, pp. 185–192, 2009.
[10] F. Frankel and R. Reid, “Big data: Distilling meaning from data,”Nature, vol. 455, no. 7209, pp. 30–30, 2008.
[11] M. Waldrop, “Big data: Wikiomics,” Nature News, vol. 455,no. 7209, pp. 22–25, 2008.
[12] A. McAfee, E. Brynjolfsson, T. H. Davenport, D. Patil, andD. Barton, “Big data,” Manage. Revolution Harvard Bus Rev.,vol. 90, no. 10, pp. 61–67, 2012.
[13] F. Chang, et al., “Bigtable: A distributed storage system for struc-tured data,”ACMTrans. Comput. Syst., vol. 26, no. 2, 2008, Art. no. 4.
[14] W. Tan, M. B. Blake, I. Saleh, and S. Dustdar, “Social-network-sourced big data analytics,” IEEE Internet Comput., vol. 17, no. 5,pp. 62–69, Sep./Oct. 2013.
[15] D. Tracey and C. Sreenan, “A holistic architecture for the internetof things, sensing services and big data,” in Proc. 13th IEEE/ACMInt. Symp. Cluster Cloud Grid Comput., 2013, pp. 546–553.
[16] H. Fang, H. Wang, C. Wang, and M. Daneshmand, “Using proba-bilistic approach to joint clustering and statistical inference: Ana-lytics for big investment data,” in Proc. IEEE Int. Conf. Big Data,2015, pp. 2916–2918.
[17] Z. Zhang, H. Fang, and H. Wang, “Visualization aided engage-ment pattern validation for big longitudinal web behavior inter-vention data,” in Proc. IEEE 17th Int. Conf. E-Health Netw. Appl.Serv., 2015, pp. 475–478.
[18] H. Fang, C. Johnson, C. Stopp, and K. A. Espy, “A new look atquantifying tobacco exposure during pregnancy using fuzzyclustering,” Neurotoxicology Teratology, vol. 33, no. 1, pp. 155–165,2011.
[19] H. Fang, V. Dukic, K. E. Pickett, L. Wakschlag, and K. A. Espy,“Detecting graded exposure effects: A report on an east Bostonpregnancy cohort,” Nicotine Tobacco Res., vol. 14, no. 9, pp. 1115–1120, 2012.
[20] Z. Zhang, H. Wang, and H. Fang, “Multiple imputation basedclustering validation (MIV) for big longitudinal trial data withmissing values in ehealth,” J. Med. Syst., vol. 40, no. 6, pp. 1–9,Jun. 2016.
Fig. 8. The optimal number of iterations for EPP algorithm for the artificiallongitudinal data with varied sample sizes, dimensions and error bounds(") for the change between iterations.
296 IEEE TRANSACTIONS ON BIG DATA, VOL. 5, NO. 2, APRIL-JUNE 2018
[21] H. Fang, K. A. Espy, M. L. Rizzo, C. Stopp, S. A. Wiebe, andW. W.Stroup, “Pattern recognition of longitudinal trial data with non-ignorable missingness: An empirical case study,” Int. J. Inf.Technol. Decision Making, vol. 8, no. 3, pp. 491–513, 2009.
[22] K. A. Espy, H. Fang, D. Charak, N. Minich, and H. G. Taylor,“Growth mixture modeling of academic achievement in childrenof varying birth weight risk,” Neuropsychology, vol. 23, no. 4,pp. 460–474, 2009.
[23] J. Friedman and J. Tukey, “A projection pursuit algorithm forexploratory data analysis,” IEEE Trans. Comput., vol. C-23, no. 9,pp. 881–890, Sep. 1974.
[24] J. B. Kruskal, “Toward a practical method which helps uncoverthe structure of a set of multivariate observations by finding thelinear transformation which optimizes a new index of con-densation,” in Statistical Computation. New York, NY, USA:Academic Press, 1969, pp. 427–440.
[25] E. Rodriguez-Martinez, J. Y. Goulermas, T. Mu, and J. F. Ralph,“Automatic induction of projection pursuit indices,” IEEE Trans.Neural Netw., vol. 21, no. 8, pp. 1281–1295, Aug. 2010.
[26] M. C. Jones and R. Sibson, “What is projection pursuit?” J. Roy.Statist. Soc. Series A (General), vol. 150, pp. 1–37, 1987.
[27] G. Eslava and F. H. C. Marriott, “Some criteria for projectionpursuit,” Statist. Comput., vol. 4, no. 1, pp. 13–20, 1994.
[28] J. Dauxois, A. Pousse, and Y. Romain, “Asymptotic theory for theprincipal component analysis of a vector random function: Someapplications to statistical inference,” J. Multivariate Anal., vol. 12,no. 1, pp. 136–154, 1982.
[29] J. A. Rice and B. W. Silverman, “Estimating the mean and covari-ance structure nonparametrically when the data are curves,” J.Roy. Statist. Soc. Series B (Methodological), vol. 53, pp. 233–243, 1991.
[30] S. Pezzulli and B. Silverman, “Some properties of smoothed prin-cipal components analysis for functional data,” Comput. Statist.,vol. 8, pp. 1–1, 1993.
[31] B. W. Silverman, “Smoothed functional principal componentsanalysis by choice of norm,” Ann. Statist., vol. 24, no. 1, pp. 1–24,1996.
[32] G. Boente and R. Fraiman, “Kernel-based functional principalcomponents,” Statist. Probability Lett., vol. 48, no. 4, pp. 335–345,2000.
[33] J. O. Ramsay, Functional Data Analysis. Hoboken, NJ, USA: Wiley,2006.
[34] P. Hall and M. Hosseini-Nasab, “On properties of functional prin-cipal components analysis,” J. Roy. Statist. Soc. Series B (Statist.Methodology), vol. 68, no. 1, pp. 109–126, 2006.
[35] F. Yao and T. Lee, “Penalized spline models for functional princi-pal component analysis,” J. Roy. Statist. Soc. Series B (Statist. Meth-odology), vol. 68, no. 1, pp. 3–25, 2006.
[36] D. Gervini, “Free-knot spline smoothing for functional data,” J.Roy. Statist. Soc. Series B (Statist. Methodology), vol. 68, no. 4,pp. 671–687, 2006.
[37] N. Locantore, et al., “Robust principal component analysis forfunctional data,” Test, vol. 8, no. 1, pp. 1–73, 1999.
[38] R. J. Hyndman and S. Ullah, “Robust forecasting of mortality andfertility rates: A functional data approach,” Comput. Statist. DataAnal., vol. 51, no. 10, pp. 4942–4956, 2007.
[39] D. Gervini, “Robust functional estimation using the median andspherical principal components,” Biometrika, vol. 95, no. 3,pp. 587–600, 2008.
[40] H. Fang, M. L. Rizzo, H. Wang, K. A. Espy, and Z. Wang, “A newnonlinear classifier with a penalized signed fuzzy measure usingeffective genetic algorithm,” Pattern Recog., vol. 43, no. 4,pp. 1393–1401, 2010.
[41] H. Fang, S. Kim, J. DiFranza, Z. Zhang, D. Ziedonis, and J. Allison,“Pattern recognition approach to culturally-tailored behavioralinterventions for smoking cessation: Dose and timing,” Soc. Res.Nicotine Tobacco, Seattle, WA, 2014.
[42] H. Fang, K. A. Espy, M. L. Rizzo, C. Stopp, S. A. Wiebe, andW. W.Stroup, “Pattern recognition of longitudinal trial data with non-ignorable missingness: An empirical case study,” Int. J. Inf. Tech-nol. Decision Making, vol. 8, no. 03, pp. 491–513, 2009.
[43] H. Fang, J. Allison, B. Barton, Z. Zhang, G. Olendzki, and Y. Ma,“Pattern recognition approach for behavioral interventions: Anapplication to a dietary trial,” Soc. Behavioral Med. Ann. Behav.Med., vol. 47, pp. S204–S204, 2014.
[44] D. F. Andrews, “Plots of high-dimensional data,” Biometrics,vol. 28, pp. 125–136, 1972.
[45] R. Khattree and D. N. Naik, “Andrews plots for multivariate data:Some new suggestions and applications,” J. Statist. Planning Infer-ence, vol. 100, no. 2, pp. 411–425, 2002.
[46] D. Asimov, “The grand tour: A tool for viewing multidimensionaldata,” SIAM J. Sci. Statist. Comput., vol. 6, no. 1, pp. 128–143, 1985.
[47] A. Buja and D. Asimov, “Grand tour methods: An outline,” Com-put. Sci. Statist., vol. 17, pp. 63–67, 1986.
[48] A. Buja, C. Hurley, and J. Mcdonald, “A data viewer for multivari-ate data,” in Proc. 18th Symp. Interface, 1987, pp. 171–174.
[49] D. Cook, A. Buja, and J. Cabrera, “Direction and motion control inthe grand tour,” in Proc. 23rd Symp. Interface Comput. Sci. Statist.,1991, pp. 180–183.
[50] D. Cook, A. Buja, J. Cabrera, and C. Hurley, “Grand tour and pro-jection pursuit,” J. Comput. Graph. Statist., vol. 4, no. 3, pp. 155–172, 1995.
[51] D. Cook and A. Buja, “Manual controls for high-dimensional dataprojections,” J. Comput. Graph. Statist., vol. 6, no. 4, pp. 464–480, 1997.
[52] G. W. Furnas and A. Buja, “Prosection views: Dimensional infer-ence through sections and projections,” J. Comput. Graph. Statist.,vol. 3, no. 4, pp. 323–353, 1994.
[53] C. Hurley and A. Buja, “Analyzing high-dimensional data withmotion graphics,” SIAM J. Sci. Statist. Comput., vol. 11, no. 6,pp. 1193–1211, 1990.
[54] E. Wegman and J. Shen, “Three-dimensional andrews plots andthe grand tour,” Comput. Sci. Statist., vol. 25, pp. 284–288, 1993.
[55] A. Dayanik, “Feature interval learning algorithms for classi-fication,” Knowl.-Based Syst., vol. 23, no. 5, pp. 402–417, 2010.
[56] J. Hu, W. Deng, J. Guo, and W. Xu, “Learning a locality discrimi-nating projection for classification,” Knowl.-Based Syst., vol. 22,no. 8, pp. 562–568, 2009.
[57] J. W. Sammon, “A nonlinear mapping for data structure analysis,”IEEE Trans. Comput., vol. C-18, no. 5, pp. 401–409, May 1969.
[58] J. Mao and A. K. Jain, “Artificial neural networks for featureextraction and multivariate data projection,” IEEE Trans. NeuralNetw., vol. 6, no. 2, pp. 296–317, Mar. 1995.
[59] R. C. T. Lee, J. R. Slagle, and H. Blum, “A triangulationmethod for the sequential mapping of points from N-space totwo-space,” IEEE Trans. Comput., vol. C-26, no. 3, pp. 288–292,Mar. 1977.
[60] E. Pekalska, D. de Ridder, R. P. Duin, and M. A. Kraaijveld, “Anew method of generalizing sammon mapping with applicationto algorithm speed-up,” in Proc. 5th Annu. ASCI Conf., vol. 99,1999, pp. 221–228.
[61] J. B. Tenenbaum, V. De Silva, and J. C. Langford, “A global geo-metric framework for nonlinear dimensionality reduction,” Sci-ence, vol. 290, no. 5500, pp. 2319–2323, 2000.
[62] L. Yang, “Sammon’s nonlinear mapping using geodesic distances,”in Proc. 17th Int. Conf. Pattern Recog., vol. 2, 2004, pp. 303–306.
[63] L. Breiman, J. H. Friedman, R. A. Olshen, and C. J. Stone,“Classification and regression trees,” Wadsworth InternationalGroup: Belmont, California, pp. 43–49, 1984.
[64] S. S. Kim, S.-H. Kim,H. Fang, S. Kwon, D. Shelley, andD. Ziedonis,“A culturally adapted smoking cessation intervention for koreanamericans: A mediating effect of perceived family norm towardquitting,” J. ImmigrantMinority Health, vol. 17, no. 4, pp. 1120–1129,Aug. 2015, doi: 10.1007/s10903-014-0045-4.
[65] T. K. Houston, R. S. Sadasivam, D. E. Ford, J. Richman, M. N. Ray,and J. J. Allison, “The quit-primo provider-patient internet-deliv-ered smoking cessation referral intervention: A cluster-random-ized comparative effectiveness trial: Study protocol,” ImplementSci., vol. 5, 2010, Art. no. 87.
[66] T. K. Houston, et al., “Evaluating the quit-primo clinical practiceeportal to increase smoker engagement with online cessationinterventions: A national hybrid type 2 implementation study,”Implementation Sci., vol. 10, no. 1, 2015, Art. no. 154.
[67] L. Breiman, J. Friedman, C. J. Stone, and R. A. Olshen, Classifica-tion and Regression Trees. Boca Raton, FL, USA: CRC Press, 1984.
[68] Z. Zhang and H. Fang, “Multiple-versus non-or single-imputationbased fuzzy clustering for incomplete longitudinal behavioralintervention data,” in Proc. IEEE 1st Int. Conf. Connected HealthAppl. Syst. Eng. Technol., Jun. 2016, pp. 219–228.
[69] Z. Zhang, H. Fang, and H. Wang, “Multiple imputation basedclustering validation (MIV) for big longitudinal trial data withmissing values in ehealth,” J. Med. Syst., vol. 40, no. 6, pp. 1–9,Jun. 2016. [Online]. Available: http://dx.doi.org/10.1007/s10916–016-0499-0
FANG AND ZHANG: AN ENHANCED VISUALIZATION METHOD TO AID BEHAVIORAL TRAJECTORY PATTERN RECOGNITION... 297

[70] Z. Zhang, H. Fang, and H. Wang, “A new mi-based visualizationaided validation index for mining big longitudinal web trial data,”IEEE Access, vol. 4, pp. 2272–2280, 2016.
[71] H. Fang,G. P. Brooks,M. L. Rizzo, K.A. Espy, andR. S. Barcikowski,“Power of models in longitudinal study: Findings from a full-crossed simulation design,” J. Exp. Educ., vol. 77, no. 3, pp. 215–254,2009.
[72] H. Fang, “hlmdata and hlmrmpower: Traditional repeated meas-ures versus hlm for multilevel longitudinal data analysis-powerand type I error rate comparison,” in Proc. 31st Annu. SAS UsersGroup Conf., 2006.
[73] Y. Ma, B. C. Olendzki, J. Wang, G. M. Persuitte, W. Li, H. Fang,P. A. Merriam, N. M. Wedick, I. S. Ockene, A. L. Culver,K. L. Schneider, G.-F. Olendzki, J. Carmody, T. Ge, Z. Zhang,and S. L. Pagoto, “A randomized trial of single- versus multi-component dietary goals for metabolic syndrome,” in Proc.Ann. Internal Med., vol. 162, no. 4, pp. 248–257, Feb. 2015,doi: 10.7326/M14-0611.
Hua Fang is an associate professor in the Depart-ment of Computer and Information Science,Department of Mathematics, University of Massa-chusetts Dartmouth, Dartmouth, Massachusetts,Department of Quantitative Health Sciences,University of Massachusetts Medical School,Worcester, Massachusetts, Division of Biostatis-tics and Health Services Research, Department ofQuantitative Health Sciences, University of Mas-sachusetts Medical School. Her research inter-ests include computational statistics, research
design, statistical modeling, and analyses in clinical and translationalresearch. She is interested in developing novel methods and applyingemerging robust techniques to enable and improve the studies that canhave broad impact on the treatment or prevention of human disease.
Zhaoyang Zhang received the BS degree in sci-ence and the MS degree in electrical engineeringfrom Xidian University, Xian, China, in 2007 and2010, respectively. He is currently workingtoward the PhD degree in the College of Engi-neering, University of Massachusetts, Dartmouth,Massachusetts. His current research interestsinclude wireless healthcare, wireless body areanetworks, big data, and cyber-physical systems.
" For more information on this or any other computing topic,please visit our Digital Library at www.computer.org/publications/dlib.
298 IEEE TRANSACTIONS ON BIG DATA, VOL. 5, NO. 2, APRIL-JUNE 2018