361 Degree International Limited Annual Results Presentation 2011 March, 2012.
23
361 Degree International Limited Annual Results Presentation 2011 March, 2012
-
Upload
allen-copeland -
Category
Documents
-
view
222 -
download
3
Transcript of 361 Degree International Limited Annual Results Presentation 2011 March, 2012.

361 Degree International Limited
Annual Results Presentation 2011
March, 2012

The information contained in this presentation is intended solely for your personal reference. Such information is subject to change without notice, its accuracy is not guaranteed arid it may not contain all material information concerning 361 Degrees International Limited (the "Company"). The Company makes no representation regarding, and assumes no responsibility or liability for, the accuracy or completeness of, or any errors or omissions in, any information contained herein.
In addition, the information contains projections and forward-looking statements that reflect the Company's current views with respect to future events and financial performance. These views are based on current assumptions which are subject to various risks and which may change over time. No assurance can be given that future events will occur, that projections will be achieved, or that the Company's assumptions are correct. It is not the intention to provide, and you may not rely on this presentation as providing, a complete or comprehensive analysis of the Company's financial or trading position or prospects.
This presentation does not constitute an offer or invitation to purchase or subscribe for any securities or financial instruments or to provide any investment service or investment advice, and no part of it shall form the basis of or be relied upon in connection with any contract, commitment or investment decision in relation thereto.
Disclaimer

Table of Contents
361 Degrees International LimitedAnnual Results Presentation 2011
1. Operational Highlights 1
2. Financial Review 9
3. Outlook and Strategies 16
4. Q&A 17

1. Operational Highlights
1
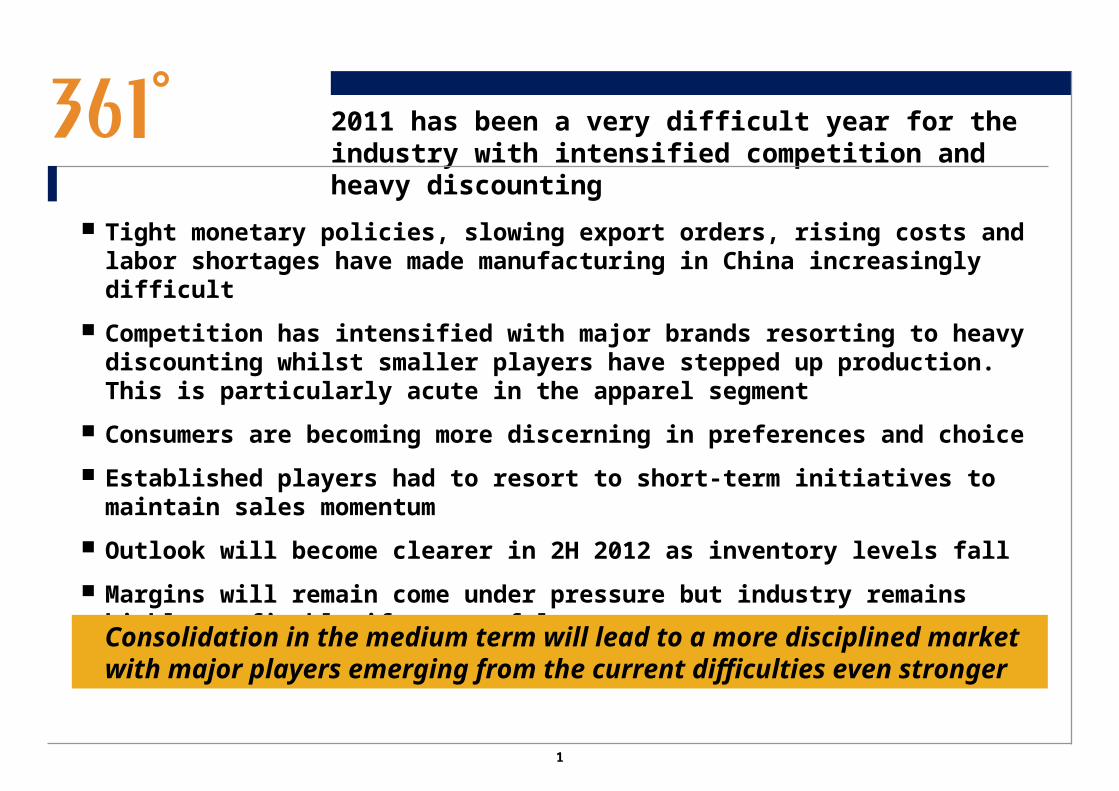
2011 has been a very difficult year for the industry with intensified competition and heavy discounting
Tight monetary policies, slowing export orders, rising costs and labor shortages have made manufacturing in China increasingly difficult
Competition has intensified with major brands resorting to heavy discounting whilst smaller players have stepped up production. This is particularly acute in the apparel segment
Consumers are becoming more discerning in preferences and choice
Established players had to resort to short-term initiatives to maintain sales momentum
Outlook will become clearer in 2H 2012 as inventory levels fall
Margins will remain come under pressure but industry remains highly profitable if successfulConsolidation in the medium term will lead to a more disciplined market with major players emerging from the current difficulties even stronger
2
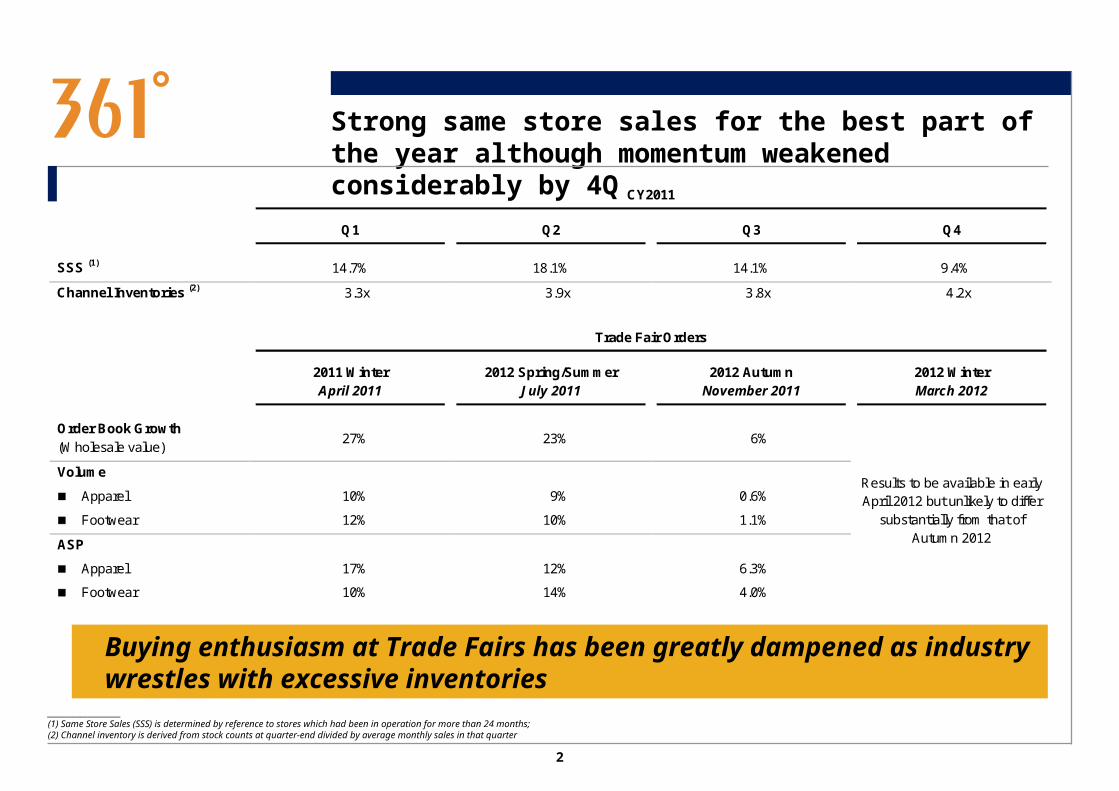
Strong same store sales for the best part of the year although momentum weakened considerably by 4Q
____________________(1) Same Store Sales (SSS) is determined by reference to stores which had been in operation for more than 24 months; (2) Channel inventory is derived from stock counts at quarter-end divided by average monthly sales in that quarter
CY2011
Q1 Q2 Q3 Q4
SSS (1) 14.7% 18.1% 14.1% 9.4%
Channel Inventories (2) 3.3x 3.9x 3.8x 4.2x
Trade Fair Orders
2011 Winter April 2011
2012 Spring/Summer July 2011
2012 Autumn November 2011
2012 Winter March 2012
Order Book Growth (Wholesale value)
27% 23% 6%
Volume
Apparel
Footwear
10%
12%
9%
10%
0.6%
1.1%
ASP
Apparel
Footwear
17%
10%
12%
14%
6.3%
4.0%
Results to be available in early April 2012 but unlikely to differ
substantially from that of Autumn 2012
Buying enthusiasm at Trade Fairs has been greatly dampened as industry wrestles with excessive inventories

3
Network has expanded modestly even as there are signs of saturation in certain provinces
____________________(1) Based on financial year to 30 June; FY2012 estimation (July to December 2011: 184)
Expansion will continue on an opportunistic and selective basis as good sites come into the market
Western Region1,505
Southern Region1,265
Eastern Region2,046
Northern Region3,049
2011 2010
No. of retail outlets 7,865 7,263
No. of retailers 3,410 3,459
Average No. of stores per retailer 2.3 2.1
Total retail space (sq.m.) 790,403 732,677
Net additions in the financial year (1)
1,735
1,506 1,423
872754
~600
0
500
1,000
1,500
2,000
FY2007 FY2008 FY2009 FY2010 FY2011 FY2012E
Tier 1 cities 8%
Tier 2 cities 20%
Tier 3 cities and smaller cities 72%
100%
No. of Stores (1)
4
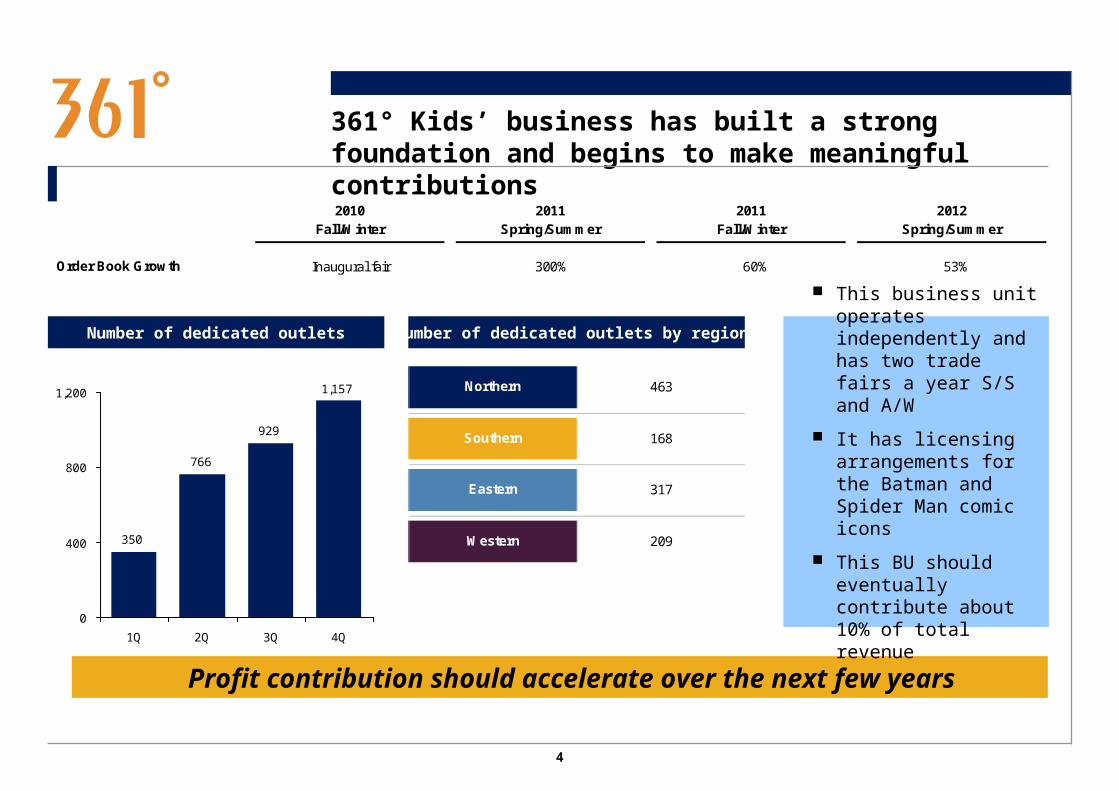
361° Kids’ business has built a strong foundation and begins to make meaningful contributions
Profit contribution should accelerate over the next few years
2010 Fall/Winter
2011 Spring/Summer
2011 Fall/Winter
2012 Spring/Summer
Order Book Growth Inaugural fair 300% 60% 53%
Number of dedicated outlets Number of dedicated outlets by region:
350
766
929
1,157
0
400
800
1,200
1Q 2Q 3Q 4Q
Northern 463
Southern 168
Eastern 317
Western 209
This business unit operates independently and has two trade fairs a year S/S and A/W
It has licensing arrangements for the Batman and Spider Man comic icons
This BU should eventually contribute about 10% of total revenue

5
ePOS now covers over 60% of the group’s outlets and has started to deliver good market intelligence
A full ERP Implementation will take time and further investment but remains a top priority
Coverage by stores: About 500 outlets are directly linked to the central servers in Xiamen, providing online and real-time data
ePOS data is now analyzed and fed into product cycle planning processes and retail store productivity and sales monitoring systems
Warehouse Management System (WMS) enables quicker delivery of finished goods through an elaborate scanning system
An I.T. Strategy Study has been conducted by IBM and its results are now studied for implementation
3,017
4,1464,529
4,95340.5%
54.0%58.0%
63.0%
1Q 2Q 3Q 4Q
ePOS connectivity % of total retail outlets
6
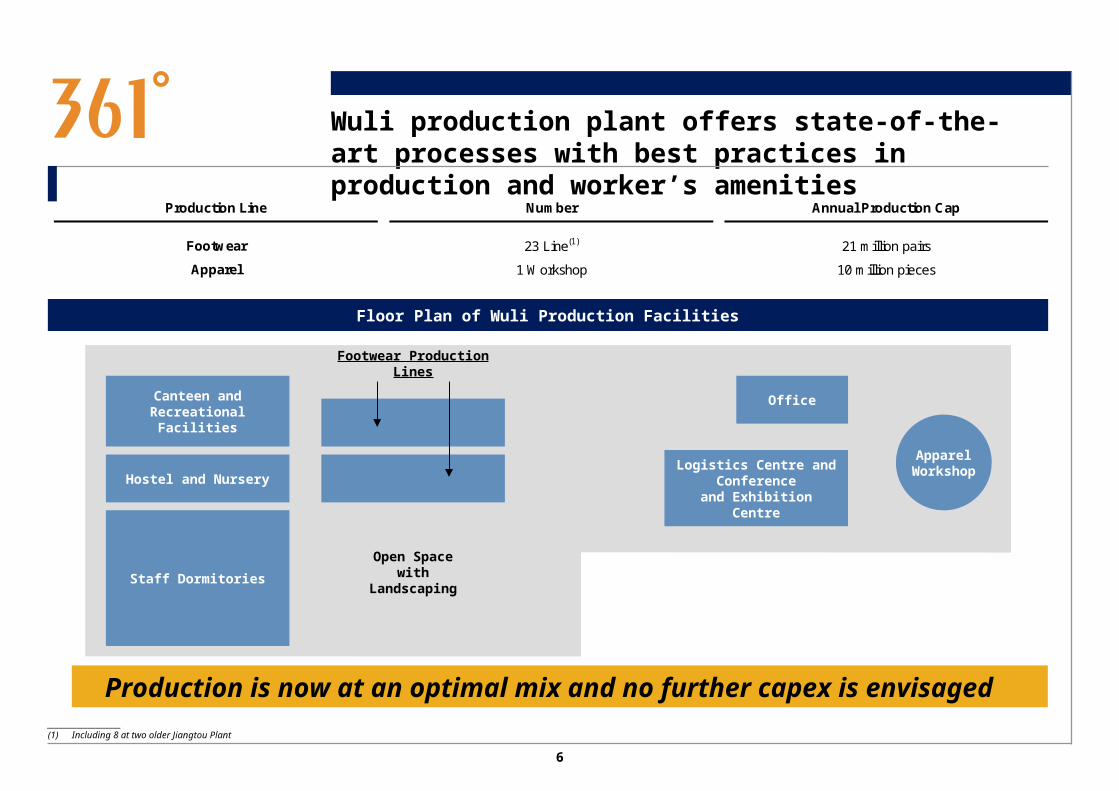
Wuli production plant offers state-of-the-art processes with best practices in production and worker’s amenities
Production is now at an optimal mix and no further capex is envisaged
Production Line Number Annual Production Cap
Footwear 23 Line(1) 21 million pairs
Apparel 1 Workshop 10 million pieces
Floor Plan of Wuli Production Facilities
Canteen and RecreationalFacilities
Hostel and Nursery
Staff Dormitories
Footwear Production Lines
Office
Logistics Centre and Conference
and Exhibition Centre
ApparelWorkshop
Open Spacewith
Landscaping
____________________(1) Including 8 at two older Jiangtou Plant

7
361° brand equity has strengthened significantly to command higher retail prices
Brand equity will become and increasingly important as the market becomesmore sophisticated although the value proposition remains core
Key Strategic Partners Major Event Sponsorships Celebrity Athlete Endorsements
361 is still focused on developing a multi-sport emphasis through key sponsorships of major international events organized in China
Celebrity sportsmen endorsements is part of a product marketing strategy with a more personal and emotive appeal
Steve Hooker
Kevin Love
Sun Yang

8
R&D spending, now at 1.5% of revenue, will continue to increase in the coming years
The Company has now established two key partnerships for research and development, in Beijing and Guangzhou, for apparel and footwear respectively. They employ over 300 staff who are engaged in identifying and testing new materials and fabrics, design and development work and tailor-made products for professional sportsmen who are sponsored by the Company
Company also collaborates with international design houses on a contract basis
There will be further product differentiation as the consumer market begins to be more demanding

2. Financial Review

9
2011 financial highlights
For the year ended 31 December
(RMB mil unless indicated otherwise)
2011 2010 Change (%)
Turnover 5,568.7 4,849.0 +14.8
Operating profit 1,385.0 1,146.8 +20.8
Net income 1,133.1 982.8 +15.3
Basic EPS (RMB cents) 54.8 47.6 +15.1
Dividend per share (HK cents)
Final 8.6 N/A N/A
Profitability ratios
Gross margin (%) 42.4 41.5 +0.9 p.p.
Operating margin (%) 24.9 23.7 +1.2 p.p.
Net margin (%) 20.4 20.1 +0.3 p.p.
Costs as a percentage of turnover
Staff costs (%) 7.4 5.4 +2.0 p.p.
Advertising and promotion (%) 10.9 10.3 +0.6 p.p.
R & D costs (%) 1.5 1.2 +0.3 p.p.
Balance Sheet Ratios
Average trade and bills receivables turnover cycle (days) 119 95 +24
Average trade and bills payables turnover cycle (days) 89 108 -19
Average inventory turnover cycle (days) Cash conversion cycle (days) 40 22 +18
Cash conversion cycle (days) 70 9 +61 2011 has been a difficult year for the industry but results are
satisfactory

10
Revenues improved by almost 15% because of a solidperformance by footwear
361 Kids3.4%
(3.3%)Accessories and others
2.1%(1.8%)
Apparel44.0%
(52.2%)
Footwear50.5%
(42.7%)
For the year ended 31 December 2011 (For the year ended 31 December 2010)
Footwear showed improvements in both volume and ASP as the expanded product range found appeal
Apparel suffered badly in an extremely competitive market with the entry of many local and international casual wear brands even as smaller sportswear brands expanded production
Kidswear continued to make solid progress as it gathers increasing appeal with national TV advertising on children's channels
For the year ended 31 December
(RMB ’000) 2011 2010 Change (%)
361° Products - Adults
Footwear 2,813,015 2,069,064 +36.0%
Apparel 2,452,216 2,532,034 -3.2%
Accessories and others 116,296 85,957 +35.3%
361° Products - Kids
187,151 161,955 +15.6%
Total 5,568,678 4,849,910 +14.8%
Higher wholesale prices will continue to be contributory but volumes areunder pressure as retail margins shrink
11
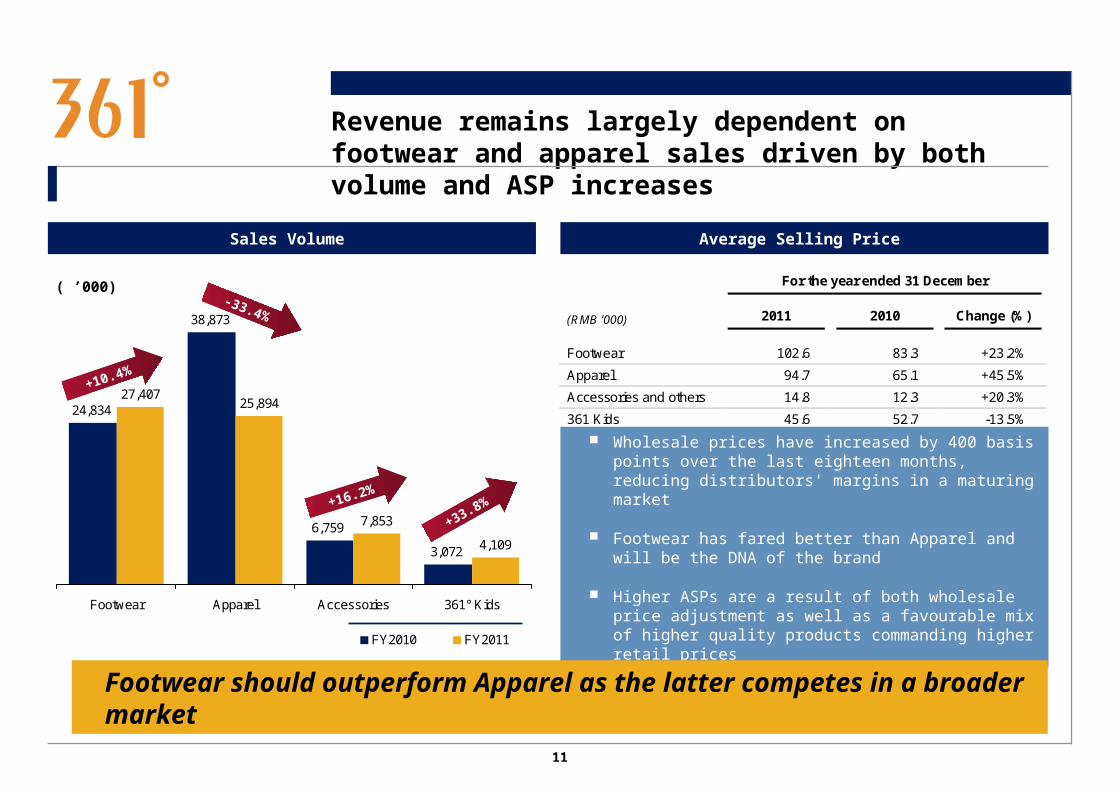
Revenue remains largely dependent on footwear and apparel sales driven by both volume and ASP increases
Sales Volume Average Selling Price
24,834
38,873
6,759
3,072
27,40725,894
7,853
4,109
Footwear Apparel Accessories 361° Kids
FY2010 FY2011
+10.4%
-33.4%
+16.2%
+33.8%
For the year ended 31 December
(RMB ’000) 2011 2010 Change (%)
Footwear 102.6 83.3 +23.2%
Apparel 94.7 65.1 +45.5%
Accessories and others 14.8 12.3 +20.3%
361 Kids 45.6 52.7 -13.5%
Wholesale prices have increased by 400 basis points over the last eighteen months, reducing distributors' margins in a maturing market
Footwear has fared better than Apparel and will be the DNA of the brand
Higher ASPs are a result of both wholesale price adjustment as well as a favourable mix of higher quality products commanding higher retail prices
Footwear should outperform Apparel as the latter competes in a broader market
( ’000)

12
Strong network presence in the western and northern regions will continue to provide solid support
For the year ended 31 December 2011 For the year ended 31 December 2010
Growth in likely to be uneven but the Group is well-positioned because of the geographical diversity of its net work
____________________(1) Eastern region includes Jiangsu, Zhejiang, Hubei, Anhui, Hunan, Shanghai and Jiangxi.(2) Southern region includes Guangdong, Fujian, Guangxi and Hainan.(3) Western region includes Sichuan, Yunnan, Guizhou, Shaanxi, Xinjiang, Gansu, Chongqing, Qinghai, Ningxia and Tibet.(4) Northern region includes Shandong, Beijing, Liaoning, Heilongjiang, Hebei, Henan, Shanxi, Jilin, Tianjin and Inner Mongolia.
For the year ended 31 Dec
(RMB ‘000) 2011 2010 Change (%)
Eastern(1) 1,284,743 1,152,477 +11.5%
Southern(2 1,253,969 1,177,693 +6.5%
Western(3) 1,007,115 810,740 +24.2%
Northern(4 2,022,851 1,708,100 +18.4%
23.1%
22.5%
18.1%
36.3% 35.2%
16.7%
24.3%
23.8%Eastern
Southern
Western
Northern

13
Margins showed slight improvement in 2011 and will probably remain relatively stable in 2012
Gross Profit and Gross Margin Operating Profit and Operating Margin
Over the medium term, gross margins will buckle under competition as consumers become more discerning and demanding
Net Profit and Net Margin ROA and ROE
2,010.52,362.8
41.5%42.4%
0
500
1,000
1,500
2,000
2,500
3,000
2010 2011
35%
40%
45%(RMB mn)
1,146.81,385.0
23.7%24.9%
0
500
1,000
1,500
2,000
2010 2011
20%
25%
30%(RMB mn)
982.81,133.1
20.1% 20.4%
0
300
600
900
1,200
1,500
1,800
2010 2011
0%
5%
10%
15%
20%
25%(RMB mn)
20.5% 20.4%
26.9% 26.3%
10.0%
15.0%
20.0%
25.0%
30.0%
35.0%
40.0%
2010 2011
ROE
ROA

14
Below the line costs have increased with the larger scale of operations
Total Expenses (% of turnover) Selling and distribution expenses increased by more than 12% primarily because of a larger spend in advertising and promotion expenses.. These have increased because of new contracts with celebrity sportsmen and additional assistance in the form of subsidies for display racking and shelves in the newly opened stores in the second half of 2011.
Administrative expenses increased by 30% due to heftier charges on depreciation arising from the completion of the Wuli Production Complex and higher R & D expenses.
13.8% 13.5%
4.7%5.4%
0%
3%
6%
9%
12%
15%
2010 2011
Selling and distribution expenses Adminstrative expenses

15
Because of a difficult 2011, the group has leveraged on itsfinancial strength to help distributors, retailers and suppliers
Average inventory turnover cycle Average trade and bills receivables turnover cycle
Accounts receivables have declined significantly in the 1Q of FY2012
Average trade and bills payables turnover cycle
22
40
0
10
20
30
40
50
2010 2011
95
119
0
30
60
90
120
150
2010 2011
108
89
0
40
80
120
2010 2011
Inventories have increased because of advanced deliveries of 2012 S/S products by some suppliers ahead of an early Chinese New Year
To help relieve cashflow pressures on the distributors and retailers, the Company has implemented various initiatives
Suppliers now prefer cash payments over bills because of liquidity problems

3. Outlook and Strategies
16
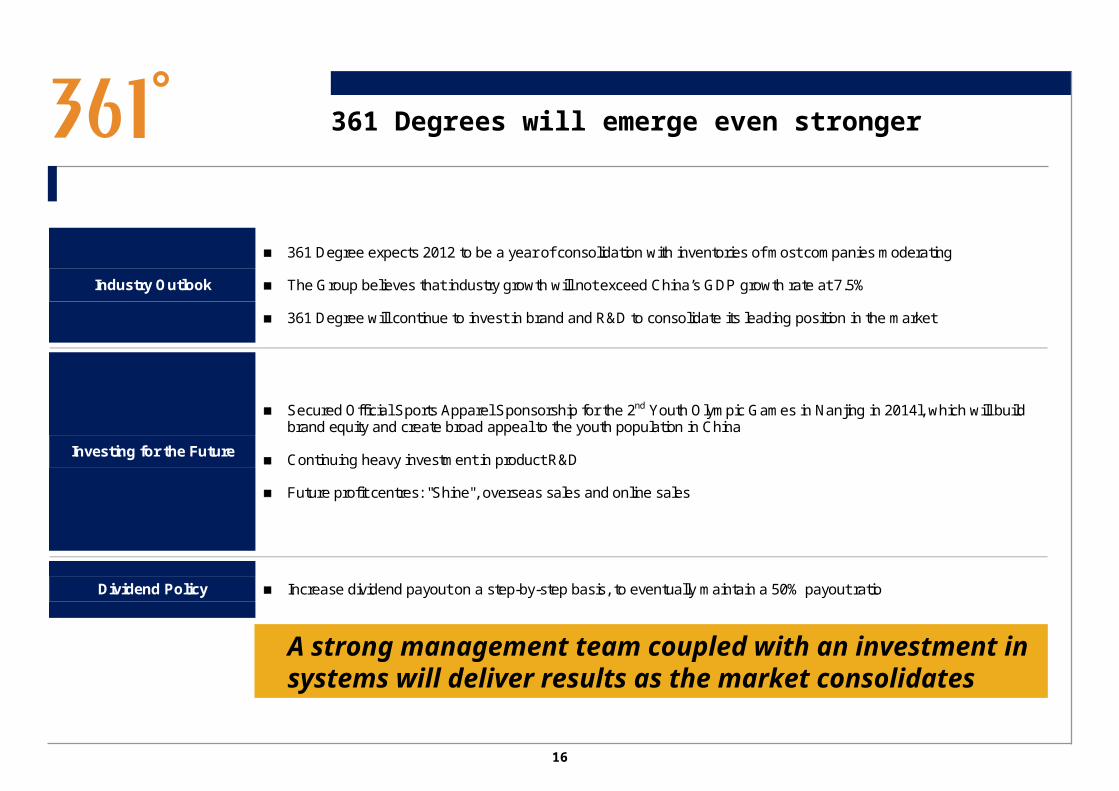
361 Degrees will emerge even stronger
A strong management team coupled with an investment insystems will deliver results as the market consolidates
Industry Outlook
361 Degree expects 2012 to be a year of consolidation with inventories of most companies moderating
The Group believes that industry growth will not exceed China’s GDP growth rate at 7.5%
361 Degree will continue to invest in brand and R&D to consolidate its leading position in the market
Investing for the Future
Secured Official Sports Apparel Sponsorship for the 2nd Youth Olympic Games in Nanjing in 2014l, which will build brand equity and create broad appeal to the youth population in China
Continuing heavy investment in product R&D
Future profit centres: "Shine", overseas sales and online sales
Dividend Policy Increase dividend payout on a step-by-step basis, to eventually maintain a 50% payout ratio

4. Q&A