$35.7 billion of Outstanding...
20
$35.7 billion of Outstanding Debt As of 12/31/2016, ($ in millions) Updated Slide #1 1 Fixed Rate $29,998.0 84.0% Synthetic Fixed Rate $2,393.4 6.7% Variable Rate $2,388.1 6.7% Bond Anticipation Notes (BANs) $948.0 2.7% Notes: 1) Fixed rate includes the $146.5 million draw dated 9/20/2016 on the Railroad Rehabilitation and Improvement Financing Program loan (RRIF Loan)/TRB Series 2015X 2) Totals exclude $145.0 million State Service Contract Bonds, $308.7 million Special Obligation Bonds, and $1.057 billion Hudson Rail Yards Trust Obligations 3) Fixed Rate TICs calculated as of issuance of Fixed Rate bonds. Floating Rate TICs calculated from inception including fees. Any Unhedged Variable Rate bonds that have been fixed to maturity are carried at the new Fixed Rate TIC. Synthetic Fixed Rate TICs include average swap rates plus current variable rate fees and estimated basis adjustments for life of swap. Synthetic Fixed Rate TICs do not include benefit of any upfront payments received by MTA. Variable Rate TICs include average remarketed rate plus current variable rate fees 4) Numbers may not total due to rounding Excluding Hudson Rail Yards Trust Obligations, year to year change in Outstanding Debt was a decrease of approximately $189 million $872 million of long-term bonds, excluding State Service Contract Bonds, was retired through normal amortization in 2016 All-In True Interest Cost (TIC) 3.61%
Transcript of $35.7 billion of Outstanding...

$35.7 billion of Outstanding DebtAs of 12/31/2016, ($ in millions)Updated Slide #1
1
Fixed Rate$29,998.0
84.0%
Synthetic Fixed Rate
$2,393.4 6.7%
Variable Rate$2,388.1
6.7%
Bond Anticipation Notes (BANs)
$948.0 2.7%
Notes:1) Fixed rate includes the $146.5 million draw dated 9/20/2016 on the Railroad Rehabilitation and Improvement Financing Program loan (RRIF
Loan)/TRB Series 2015X2) Totals exclude $145.0 million State Service Contract Bonds, $308.7 million Special Obligation Bonds, and $1.057 billion Hudson Rail Yards Trust
Obligations3) Fixed Rate TICs calculated as of issuance of Fixed Rate bonds. Floating Rate TICs calculated from inception including fees. Any Unhedged
Variable Rate bonds that have been fixed to maturity are carried at the new Fixed Rate TIC. Synthetic Fixed Rate TICs include average swap rates plus current variable rate fees and estimated basis adjustments for life of swap. Synthetic Fixed Rate TICs do not include benefit of any upfront payments received by MTA. Variable Rate TICs include average remarketed rate plus current variable rate fees
4) Numbers may not total due to rounding
Excluding Hudson Rail Yards Trust Obligations, year to year change in Outstanding Debt was a decrease of approximately $189 million
$872 million of long-term bonds, excluding State Service Contract Bonds, was retired through normal amortization in 2016
All-In True Interest Cost (TIC) 3.61%

Report to the Finance Committee2016 Year End Review
MTA Finance DepartmentOlga Chernat, Deputy Director
January 23, 2017

$35.7 billion of Outstanding DebtAs of 12/31/2016 ($ in millions)
1
Fixed Rate$29,998.0
84.0%
Synthetic Fixed Rate
$2,393.4 6.7%
Variable Rate$2,388.1
6.7%
Bond Anticipation Notes (BANs)
$948.0 2.7%
Notes:1) Fixed rate includes the $146.5 million draw dated 9/20/2016 on the Railroad Rehabilitation and Improvement Financing Program loan (RRIF
Loan)/TRB Series 2015X2) Totals exclude $145.0 million State Service Contract Bonds, $308.7 million Special Obligation Bonds, and $1.057 billion Hudson Rail Yards Trust
Obligations3) Fixed Rate TICs calculated as of issuance of Fixed Rate bonds. Floating Rate TICs calculated from inception including fees. Any Unhedged
Variable Rate bonds that have been fixed to maturity are carried at the new Fixed Rate TIC. Synthetic Fixed Rate TICs include average swap rates plus current variable rate fees and estimated basis adjustments for life of swap. Synthetic Fixed Rate TICs do not include benefit of any upfront payments received by MTA. Variable Rate TICs include average remarketed rate plus current variable rate fees
4) Numbers may not total due to rounding
$944.7 million of debt was retired through normal amortization in 2016
Net increase in debt outstanding was $1.25 billion
All-In True Interest Cost (TIC) 3.61%
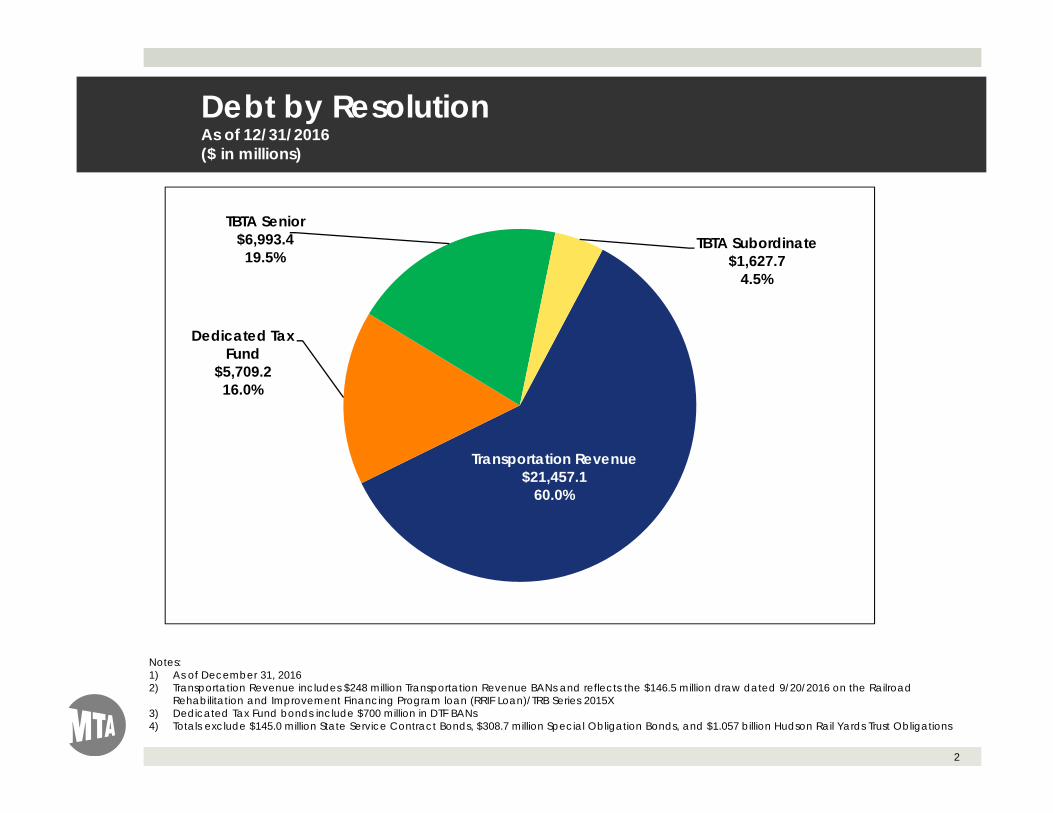
Debt by ResolutionAs of 12/31/2016 ($ in millions)
Transportation Revenue$21,457.1
60.0%
Dedicated Tax Fund
$5,709.2 16.0%
TBTA Senior$6,993.4 19.5%
TBTA Subordinate$1,627.7
4.5%
2
Notes:1) As of December 31, 20162) Transportation Revenue includes $248 million Transportation Revenue BANs and reflects the $146.5 million draw dated 9/20/2016 on the Railroad
Rehabilitation and Improvement Financing Program loan (RRIF Loan)/TRB Series 2015X3) Dedicated Tax Fund bonds include $700 million in DTF BANs4) Totals exclude $145.0 million State Service Contract Bonds, $308.7 million Special Obligation Bonds, and $1.057 billion Hudson Rail Yards Trust Obligations

-
250
500
750
1,000
1,250
1,500
1,750
2,000
2,250
2,500
2,750
3,000
$ M
illio
ns
TRB DTF TBTA Sub TBTA Sen
Debt Service on Outstanding Bonds by CreditAs of 12/31/2016
3
4
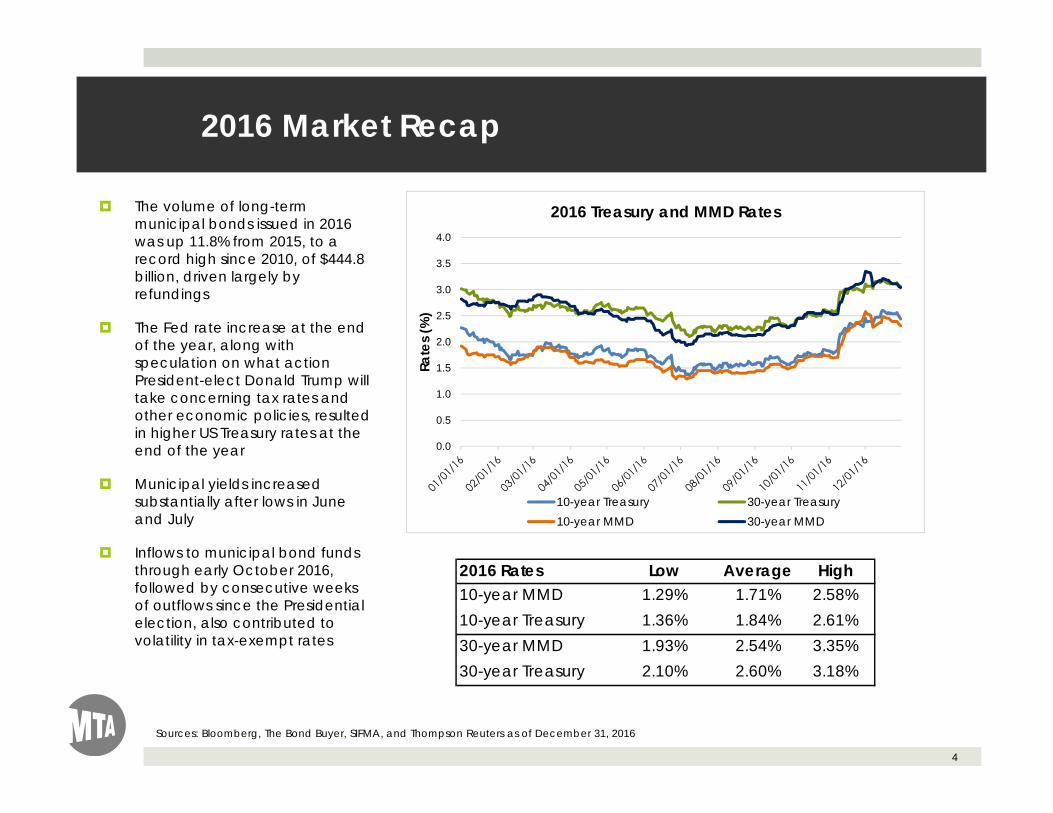
2016 Market Recap
Sources: Bloomberg, The Bond Buyer, SIFMA, and Thompson Reuters as of December 31, 2016
The volume of long-term municipal bonds issued in 2016 was up 11.8% from 2015, to a record high since 2010, of $444.8 billion, driven largely by refundings
The Fed rate increase at the end of the year, along with speculation on what action President-elect Donald Trump will take concerning tax rates and other economic policies, resulted in higher US Treasury rates at the end of the year
Municipal yields increased substantially after lows in June and July
Inflows to municipal bond funds through early October 2016, followed by consecutive weeks of outflows since the Presidential election, also contributed to volatility in tax-exempt rates
0.0
0.5
1.0
1.5
2.0
2.5
3.0
3.5
4.0
Rate
s (%
)
2016 Treasury and MMD Rates
10-year Treasury 30-year Treasury10-year MMD 30-year MMD
2016 Rates Low Average High10-year MMD 1.29% 1.71% 2.58%10-year Treasury 1.36% 1.84% 2.61%30-year MMD 1.93% 2.54% 3.35%30-year Treasury 2.10% 2.60% 3.18%

2016 Transactions Summary - $ 7.76 billion
$2.3 billion New Money borrowing $797 million fixed rate bonds
$1.4 billion bond anticipation notes (BANS)
$146 million RRIF loan withdrawal
$1.95 billion long-term fixed rate bonds to retire BANs
$2.98 billion Refunding bonds achieve Present Value savings of $560.9 million, or 16.6% of par refunded
$484.2 million Remarketing of Tendered Obligations $43.5 million remarketed as fixed rate bonds
$290.7 million remarketed as FRNs
$150.0 million remarketed as variable rate debt with bank support in weekly mode
Total bond financed capital investments of $2.43 billion
5
Note: Numbers may not total due to rounding

2016 MTA Long-Term Bond Issuances
0.0%
1.0%
2.0%
3.0%
4.0%
5.0%
1/28/2016$300,000,000
TBTA Series 2016A(1)
(Avg Life: 16.09 years;All-in TIC: 3.24%)
9/22/2016$1,057,430,000
Hudson Rail Yards Trust Obligations(Avg Life: 29.1 years;
All-in TIC: 4.28%(5)
2/25/2016$444,560,000
TRB Series 2016A-1(2)
(Avg Life: 26.06 years;All-in TIC: 4.04%)
7/28/2016$534,200,000
TRB Series 2016C-1(4)
(Avg Life: 26.54 years;All-in TIC: 3.70%)
5/26/2016$413,415,000
DTF Series 2016B-1(3)
(Avg Life: 20.96 years;All-in TIC: 3.52%)
6
20-yr “AAA” MMD index(Weekly average 2.4% in 2016)
Notes: 1) TBTA Series 2016A included $241.2 million in refunding bonds, not reflected here2) TRB Series 2016A included $338.0 million in refunding bonds, not reflected here3) DTF Series 2016B included $174.9 million in refunding bonds, not reflected here4) TRB Series 2016C included $329.7 million in refunding bonds, not reflected here5) Hudson Rail Yard Trust Obligations, all-in TIC of 4.28% assumes that no fee purchase options are exercised through maturity. If all of
the fee purchase options are exercised within 10 years, the all-in TIC would be 2.74% and the average life would be 5.4 years

2016 Remarketing Transaction Results
7
Notes: 1) During 2016, SIFMA averaged 0.421%; 1-month LIBOR averaged 0.496%; only most recent remarketing reflected for subseries2) Subseries DTF 2008B-3b was remarketed as fixed rate bonds with all-in TIC of 2.72%
Bond Series Par Amount Mode FRN Rate/TIC
FRN Reset Date/Bank Liquidity Expiration/Maturity
DTF 2002B‐1 150,000,000 Weekly NA 3/22/2021DTF 2008B‐3b 43,460,000 Fixed 2.72% 11/15/2030TBTA 2005B‐4a 108,800,000 FRN 67% of LIBOR+70bp 2/1/2021TRB 2002G‐1h 56,890,000 FRN 67% of LIBOR+82bp 2/1/2022TRB 2012A‐2 50,000,000 FRN SIFMA+58bp 6/1/2019TRB 2012G‐3 75,000,000 FRN 67% of LIBOR+70bp 2/1/2020
484,150,000

8
BAN Program initiated in 2015, continued in 2016 BAN transactions typically ranging from $500 million to $700 million in size
Sold competitively via Grant Street bidding platform
Minimum bid size of $10 million, with increments of $5 million, to facilitate wider participation
Bids awarded based on lowest TIC offered
Low cost short-term financing
$1.4 billion of BANs issued in 2016; weighted average life of 0.7 years
Provides transparency into the assets being financed with long-term bonds
Better match of assets and related debt liability When retiring BANs, MTA seeks to structure long term bonds to match useful lives of the BAN-financed
projects
Advantages of BAN Issuance Financing Strategy

2016 Competitive Bid Results – BAN Transactions
9
BAN Series Par Amount Bid Winners All-in TIC Average Life Final Maturity
TRB 2016A $340,000,000$120,000,000$100,000,000$60,000,000$25,000,000$25,000,000$20,000,000$10,000,000
Goldman SachsWells FargoJP MorganBank of America Merrill LynchRBC Capital MarketsJefferiesCitiPNC
0.61% 7.2 months 2/1/2017
DTF 2016A $200,000,000$150,000,000$100,000,000$75,000,000$50,000,000$50,000,000$30,000,000 $20,000,000$20,000,000$5,000,000
JP MorganWells FargoMorgan StanleyPNCBank of America Merrill LynchGoldman SachsRBC Capital MarketsCitiFTNJefferies
0.63% 9.6 months 6/1/2017

MTA’s inaugural issuance of green bonds was first Climate Bond Certification in the U.S.
Certified under the Climate Bond Initiative’s (CBI) Climate Bonds Standards using the Low Carbon Transport criteria
The Low Carbon Transport criteria sets out what transportation projects are applicable for certification; projects are determined eligible if they are compatible with an emission trajectory that limits global temperature rise to 2○ C
Voluntary, independent verification (Sustainalytics) to demonstrate the capital investment meets CBI standards
$11.3 billion spent on 2010-2014 capital projects and conform to the CBI’s Low Carbon Transport criteria
Two issuances to date, TRB 2016A ($782.5 million) and DTF 2016B ($588.3 million)
MTA expects to continue issuing additional certified Climate Bonds
MTA’s transportation network benefits the environment On net basis, prevents approximately 17 million metric tons of greenhouse gas emission
annually
MTA’s network outperforms single occupancy vehicles, even including indirect emissions
Green Bonds – Climate Bond Certified
10

Hudson Rail Yards Trust Obligations
11
Unique opportunity to reap benefit from Hudson Rail Yard assets and low interest rates
Monetizing 99-year ground leases on Eastern Rail Yards (ERY) and Western Rail Yards (WRY)
Fulfilled HRY contribution previously programmed into the Capital Program
Diversified financing with another highly-rated credit
With new 34th Street/Hudson Yards station for the 7 Line, example of transit-oriented development
Solid triple net Ground Leases executed in 2013 and 2014; all ground rent and fee purchase payments applied to repayment of Obligations
Pricing results – strong investor response Obligations were offered with 5% coupons providing
final yields of 1.875% in 2046, 2.375% in 2051 and 2.625% in 2056
Expanded, diverse group of institutional investors, including investors that are not typically buying other MTA credits
Energetic interest, with more than $3 billion in orders

2016 Rating Agency Stable Ratings and Outlooks
* NAF – Not applied for
12
Credit Moody’s S&P Fitch Kroll
Transportation Revenue A1Stable
AA-Stable
AStable
AA+Stable
Dedicated Tax Fund NAF* AAStable
AAStable
NAF*
TBTA – General Resolution Aa3Stable
AA-Stable
AA-Stable
AAStable
TBTA – Subordinate Resolution A1Stable
A+Stable
A+Stable
AA-Stable
Year-round, regular communications and updates Briefings and materials on MTA’s Financial Plans (Feb, July, November)
Capital Program updates
Annual Combined Continuing Disclosure Filings
Assist with information requests for annual credit reviews
Fall 2016: MTA met with Fitch to discuss their methodology regarding Transportation Revenue Bonds, continued effort to recognize TRB strength in the Fitch rating

2016 Investor and Green Market Outreach Year-round: investors may reach MTA Finance staff directly via
email and phone
February 2016: MTA Finance launched the @MTABonds Twitter page for additional investor outreach via social media; and launched revamped MTA Investor website, making information and resources readily available and more user friendly
March 2016: MTA Finance met for 1:1 institutional investor interested in green bonds
March 24, 2016: MTA Finance Director makes keynote remarks at Municipal Forum of New York Luncheon, discussing MTA’s green bonds
April 15 – 16, 2016: MTA Finance presented at the J.P. Morgan Public Finance Transportation & Utility Conference and hosted 1:1 meetings with institutional investors
September 8, 2016: MTA Finance and Senior Manager, Goldman Sachs, hosted an Investor Tour and Conference highlighting the Hudson Rail Yards Trust Obligations transaction
September 2016: MTA Finance met with international investors interested in the U.S. municipal market
September 23, 2016: MTA Finance presented at the Bank of America Merrill Lynch 2016 New York Municipal Investor Conference
October 25, 2016: MTA Finance participated on a panel in Environmental Finance 2016 Green Bonds America Conference
December 1, 2016: MTA Finance participated in Green Municipal Bonds Cost Reduction Working Group
13

2017 Financing Quarterly Calendar($ in millions)
14
Purpose Q1 Q2 Q3 Q4 Total
New Money(1) $1,000 $700 $500 $400 $2,600
BAN Takeout(2) 550 350 1,400 - 2,300
Remarketing(3) 100 250 - 510 860
Refunding(4) 903 - 150 - 1,053
Total $2,553 $1,300 $2,050 $910 $6,813
All information in the 2017 Financing Quarterly Calendar is preliminary and subject to change
Notes:1) Bond issuance for approved Capital Programs, including the 2015-2019 Capital Program; new money obligations may be issued as bonds or BANs2) Assume taxable BANs will be paid down by RRIF Loan proceeds on hand3) FRNs and VRDBs with mandatory put dates or liquidity facility expiration dates in 2017, except the Q1 reoffering of $100 million TRB 2002D-2a4) Fixed rate TRB bonds callable in 2017 and $903 million advance and current refunding, TBTA Series 2017B, in Q1

15
Appendix
1) Bond Financed Capital Investments in 20162) 2016 Debt Issuance and Remarketing Activity3) 2016 Cost of Issuance Summary

Bond Financed Capital Investments in 2016
16
MTA financed $2.43 billion in capital expenditures from bond proceeds in 2016
Capital Construction ($742.6 million)(1)
East Side Access ($317.1 million)
Second Avenue Subway ($372.2 million)
New York City Transit/SIR/MTA Bus ($793.4 million) $60 million for Line Equipment and Line Structures
$393 million for Passenger Stations
$168 million for Signals and Communications, including $47 million for Help Points
$36 million for Shops and Yards
$38 million for Depot Rehab, Reconstruction and Improvements
Commuter Railroads ($512.0 million) LIRR ($319.6 million, including Positive Train Control, Annual Track Program, and M9 Rolling Stock procurement)
MNR ($192.4 million, including Positive Train Control, Harmon Shop improvements, and program administration)
Bridges and Tunnels ($371.3 million)(2)
$116 million for Verrazano-Narrows Bridge Upper Level Suspended Span, Tolls Booths and Structural Painting
$103 million for RFK Bridge Deck Replacement, Ramps and Painting
$36 million for Queens Midtown Tunnel Wall and Ceiling repair, Ventilation and Open Road Tolling initiative
Notes:1) Includes Lower Manhattan Projects, Security and Administration2) Does not reflect expenditures on projects related to Superstorm Sandy

2016 Debt Issuance and Remarketing Activity
17
Settlement Date Credit Subseries Amount Structure Senior Manager/Special Co‐Seniors Purpose Assignment Basis1/28/2016 TBTA 2016A 300,000,000$ Fixed Citigroup/Academy/Cabrera New Money Rotation3/30/2016 TRB 2016A BANs 700,000,000 BAN Competitive BAN New Money N/A6/28/2016 DTF 2016A BANs 700,000,000 BAN Competitive BAN New Money N/A9/20/2016 TRB 2015X (RRIF Loan) 146,472,065 Fixed N/A New Money N/A9/22/2016 HRY 2016A 496,992,100 Fixed Goldman New Money Merit
2,343,464,1652/25/2016 TRB 2016A‐1 444,560,000 Fixed Ramirez/Drexel/Stern Brothers BAN Takeout Rotation5/26/2016 DTF 2016B‐1 413,415,000 Fixed BAML/Drexel/Loop/Morgan Stanley/Siebert BAN Takeout Rotation7/28/2016 TRB 2016C‐1 534,200,000 Fixed Wells Fargo/Drexel/Estrada/Rice Financial and BNY Mellon BAN Takeout Rotation9/22/2016 HRY 2016A 560,437,900 Fixed Goldman BAN Takeout Merit
1,952,612,9001/28/2016 TBTA 2016A 241,240,000 Fixed Citigroup/Academy/Cabrera Refunding Rotation2/25/2016 TRB 2016A‐2 337,960,000 Fixed Ramirez/Drexel/Stern Brothers Refunding Rotation3/10/2016 DTF 2016A 579,955,000 Fixed Wells Fargo/BAML/Goldman Refunding Merit5/26/2016 DTF 2016B‐2 174,890,000 Fixed BAML/Drexel/Loop/Morgan Stanley/Siebert Refunding Rotation6/30/2016 TRB 2016B 673,990,000 Fixed Morgan Stanley/Siebert/Academy/Stern Brothers Refunding Rotation7/28/2016 TRB 2016C‐2 329,660,000 Fixed Wells Fargo/Drexel/Estrada/Rice Financial and BNY Mellon Refunding Rotation10/26/2016 TRB 2016D 645,655,000 Fixed Jefferies Refunding Rotation
2,983,350,0003/23/2016 DTF 2002B‐1 150,000,000 Weekly VRDB MUFG Remarketing Merit5/15/2016 TRB 2012A‐2 50,000,000 FRN Competitive ‐ Bid Winner Jefferies Remarketing Competitive10/3/2016 DTF 2008B‐3b 43,460,000 Fixed Jefferies/Cabrera/Drexel Remarketing Merit11/1/2016 TBTA 2005B‐4a 108,800,000 FRN Competitive ‐ Bid Winner RBC Remarketing Competitive11/1/2016 TRB 2002G‐1h 56,890,000 FRN Competitive ‐ Bid Winner JP Morgan Remarketing Competitive11/1/2016 TRB 2012G‐3 75,000,000 FRN Competitive ‐ Bid Winner PNC Remarketing Competitive
484,150,000
7,763,577,065$ Total 2016 Transactions
Subtotal Remarketing
Subtotal Refunding
Subtotal BAN Takeout Bonds
Subtotal New Money Bonds and BANs

2016 Cost of Issuance Summary
New Money BAN Takeout Refunding Remarketing Total
NYS Bond Issuance Fee(1) $2,499,008 $11,596,856 - N/A $14,095,865
Underwriter's Discount(2) 2,857,538 8,554,127 13,360,036 738,529 25,510,230
Bond Counsel 519,599 771,126 575,437 436,483 2,302,644
Disclosure Counsel 285,098 430,984 548,082 197,685 1,461,850
Financial Advisor Fee 105,000 229,667 365,333 - 700,000
Swap Advisor Fee - - - - -
Rating Agency Fees 543,808 650,116 961,151 43,000 2,198,075
LOC Counsel - - - - -
Bond Insurance - - - - -
Accounting Fees(3) - - - - -
Trustee 34,738 25,317 31,045 10,000 101,100
Printing and Distribution 41,921 11,094 30,804 10,006 93,826
Miscellaneous(4) 213,701 185,897 43,938 - 443,536
Total(5) $7,100,412 $22,455,185 $15,915,827 $1,435,702 $46,907,126
18
Notes:1) NYS Bond issuance fee (BIC) of $8.40 per $1,000 issued is charged for new money bonds and refunding bond transactions, but not on bond anticipations notes (new money
proceeds) or remarketing transactions; BIC fees in 2016 were waived by NYS DOB on all MTA refunding transactions2) Underwriter’s Discount includes fees paid to Underwriters, Underwriter’s Counsel, and other expenses3) Accounting fees on MTA/TBTA bond issues were eliminated beginning 1/1/20164) Miscellaneous includes: Independent Engineer, Verification Agent, TM3 wire fees, and MTA Counsel fees related to Hudson Yards Securitization5) Earnings for M/WBE and SDVOB (% of total compensation, underwriters discount net of expenses) for State Fiscal Year 2016-17 will be reported to the Board in April 2017