collections.mun.cacollections.mun.ca/PDFs/theses/Kehoe_JonathanJoseph.pdf · 3.5.6 Spiny Sunstar 45...
96
Transcript of collections.mun.cacollections.mun.ca/PDFs/theses/Kehoe_JonathanJoseph.pdf · 3.5.6 Spiny Sunstar 45...


1"'1 National Libraryof Canada
Bibliotheque nationaleduCanada
Acquisitions and Acquisisitons elBibliographic Services services bibliographiques
Your file VotroreterenceISBN:Q-612-89637-4
Our fila NolrereMrefIC8ISBN:Q-612-896374
The author has granted a nonexclusive licence allowing theNational Library of Canada toreproduce, loan, distribute or sellcopies of this thesis in microform,paper or electronic formats.
The author retains ownership of thecopyright in this thesis. Neither thethesis nor substantial extracts from ilmay be printed or othelWisereproduced without the author'spermission.
In compliance with the CanadianPrivacy Act some supportingforms may have been removedfrom this dissertation.
While these forms may be includedin the document page count,their removal does not representany loss of content from thedissertation.
Canada
L'auteur a accorde une licence nonexclusive permettant a laBibliotheque nationale du Canada dereproduire, preter, distribuer auvendre des copies de cette these sousla forme de microflchelfilm, dereproduction sur papier ou sur formatelectronique.
L'auteur conserve la propriete dudroit d'auteur qui protege cette these.Ni la these ni des extraits substantielsde celle-ci ne doivent etre imprimesou aturement reproduits sans sonautorisation.
Conformement a la loi canadiennesur la protection de la vie privee,quelques formula ires secondairesont ete enleves de ce manuscrit.
Bien que ces formulairesaient inclus dans la pagination,il n'y aura aucun contenu manquant.


TOTAL MARiNE LIPID PROfILING BY SHORT COLUMN GAS
CHROMATOGRAPHY
by
Jonathan Joseph Kehoe
A project report submitted to the Scbool ofGraduale Studies in partial fulfillment
orlbe requiremeots for tbe degree of M.Sc. (Instrumental Anal)'5is)
Memorial University
May 2003
St.John's Newfoundland

ABSTRACT
Analysis of lipids is a very informative way of determining the physiological state
of a marine ecosystem. The information derived from analysis of these hydrophobic,
carbon rich compounds is very important to researchers in fields such as aquaculture and
biological research.
Thin layer chromatography with flame ionization detection (TLC-FlD) has been a
common method for identification and quantitation of tile lipid classes ofsamplcs derived
from marine sources such as sediments, plants and animals. However, TLC suffers from
some analytical problems such as low sensitivity, non-linear calibration curves, long
analysis times and use of copious amounts of hazardous solvent.
Gas chromatography (GC) is an ideal choice for lipid analysis as il allows for
automation, high sensitivity, short analysis times and low cost. Marine lipid samples often
contain high proportions of polar lipid classes such as the phospholipids (PL) and the
acetone mobile polar lipids (AMPL). While neutral lipid classes are readily analyzed by
short column GC, AMPL retain on the GC column rendering the column useless after
time. Thus GC determination of polar lipids requires enzymatic treatment and
derivatization prior to chromlltographic llnalysis.
This project optimized a short column GC method for marine lipid class profiling
by incorporating Kuksis' GC profiling strategy (1984) that used the enzyme
phospholipase C 10 hydrolyze PL to diacylglycerols, with the optimized short column GC
method for marine neutral lipids developed by Yang (1996). Combination of enzymatic

hydrolysis and short column GC makes a near complete lipid profile of marine lipid
samples possible. Hydrogenation of samples allows for compounds to be separated
according to their carbon numbers and fWlCtional groups.
in Ihis project, Ihe dephosphorylation procedure was optimized for marine
samples, which were 50 units of phospholipase C for every milligram of phospholipid
present in the sample. Comparison of percent lipid data obtained by short-column GC
with latroscan TLC·FID data showed that equally accurate and sensilive data could be
obtained. Hydrogenation of samples prior to analysis allows for excellent peak resolution
and sensilivily to individual compounds within each lipid class. Achieving this
information is not possible with TLC-F1D when performing lotal lipid profiles. The
pretreatment of samples resulted in 63.7 ± 3.7% recovery of samples, however the overall
analytical precision was t. 7% error betv.·ecn replicate samples.

ACKNOWLEDGEMENTS
Thanks to my supervisor. Dr. Christopher Parrish. for encouragement and
guidance during the completion oflhis project. I am also gralefullo Dr. Roben Helleur,
for giving me the opportunity to become involved in the Masters of Instrumental Analysis
program, as well as his positive comments during the writing or this report.
lltanks to Jeanette Wells for ber technical instnlction and expertise with lipid
analysis. Assistance and advice from Louise Copeman, Vanessa French, Catherine
Stevens, Gem Van Biesen, Rena13 Moreira, Tim Alkanani and Matthew Logan was also
very appreciated. Ed Downlon of the Ocean Sciences Centre for helping with the design
and construction of my automated extractor O-rings.
I would also like 10 acknowledge my wife, Wanda and also my family for their
continuous support and patience during the completion of this report.

TABLE OF CONTENTS
AbstractAcknowledgemcnts
,Tablc ofContcntsList of TablesList of FiguresList of AbbreviationsList of Appendices
Chapter I -Introduction1, I Lipid classes and structures1.2 Methodology for analyses of marine lipids
1.2.1Thin layer chromatography - flame ionization detection1.2.2 High perfomlance liquid chromatography1.2.3 Gas chromatography1.2.4 Comparison of chromatographic methods
1.3 Objectives
;vvviiviii
,;
Chapter 2 - Experimental II2.1 Materials II
2.1.1 Glassware and chemicals II2.1.2 Marine samples II2.1.3 Total system blanks 12
2.2 Methods 122.2.1 Extraction 122.2.2 Phospholipid digestion 122.2.3 Hydrogenation 142.2.4 Trimcmylsilylation 152.2.5 Chromatographic methods 15
2.3.5.1 Thin layer chromatography - flame ionization detection J52.3.5.2 Gas chromatography 16
Chapter 3 - Results and Discussion 183.1 Optimization of dephosphorylation procedure 183.2 Hydrogenation 213.3 Investigation of procedures by Iatroscan TLC·FID 223.4 Lipid class identification and calibration by short column GC 263.5 General comparison of short column GC and TLC-FID results 29
3.5.1 Short column analysis of capelin extract 303.5.2 Yellowtail flounder 333.5.3 Sea scallop female gonad 373.5.4 Sea scallop muscle 37

3.5.6 Spiny Sunstar 453.6 Other Applications 45
3.6.1 Determination of ethyl esters in rotifers 493.6.2 Determination of wax esters in the copepod Calanus hyperboreus 54
Chapter 4 - Conclusious4.1 Conclusions4.2 Future Work
ReferencesAppendices
585859
6164

LIST OF TABLES
Page
Table 3.1 Retention times (in minutes) of lipid classes by carbon 27number, as determined by standard calibrnrion andmathematical interpolation
Table 3.2 Percenl lipid data for eapelin extrnet detcrmined by short 31column GC and latroscan.
Table 3.3 Percent lipid data for yellowtail flounder extrnet detennined 36by short column GC and latroscan.
Table 3.4 Pen:ent lipid data for sea scallop female gonad extr3Ct 38determined by short column GC and lalroscan.
Table 3.5 Percent lipid data for scallop muscle extrnct detcnnined by 43short column GC and latroscan.
Table 3.6 Percenl lipid data for CrossasJer papposus extract 47determined by short column GC and latroscan.

Figure 1.1
Figure 2.1
Figure 3.1
Figure 3.2
Figurc3.3
Figure 3.4
Figure 3.5
Figure 3.6
Figure 3.7
Figure 3.8
Figure 3.9
LIST OF FIGURES
Various Lipid classes and their stmctures
Experimental Design
PL molecule dipalmitoyl phosphatidylcholine cleavedto DAG through enzymatic hydrolysis.
Optimization of dephosphorylation procedure.Portions (0.5 mL) of a 1.964 mglmL standard solutionof dipalmitoyl ct-phosphatidylcholinc were reactedwith increasing amounts of phospholipase C as per theprocedure outlined in Section 2.2.2.
Partial chromatograms of (A) non.hydrogenated and(B) hydrogenated copepod samples, showing the WEpeaks specificaHy.
latrosean chromatogram companson of (A) anunmodified capelin extmct with (B) a capelin extractafter dephosphorylation and hydrogenation
Capelin extract short column GC Chromatogram afterdephosphorylation, hydrogenation and TMSderivatization.
Yellowtail flounder short column GC chromatogramafter dephosphorylation, hydrogenation and TMSderivatization.
Sea Scallop female gonad short column GCchromatogram after dephosphorylation, hydrogenationand TMS derivatization.
Short column GC Chromatogram of scallop muscletissue extract after dephosphorylation, hydrogenationand TMS derivatization
Short column GC chromatogram of Crossasterpapposlls extract after dephosphorylation,hydrogenation and TMS dcrivatizalion.
viii
Page
13
19
20
23
24
32
35
40
42
46

Figure3.IOA Partial chromatogram of unenriched rotifcr elttract 51after dephosphorylation, hydrogenation and TMSderivatization.
Figure 3.10 B Panial chromatogram of Algamac-enriched rotifer 52extract after dephosphorylation, hydrogenation andTMS derivatizalion.
Figure 3.10 C Panial GC chromatogram of L galbana enriched rotifer 53extract after dephosphorylation, hydrogenation andTMS derivatization.
Figure 3.11 Iatroscan chromalOgram of Co/anus hyperboreus, 56indicating the two unknown WE peaks, WEI andWEl.
Figure 3.12 Panial GC chromalOgram of hydrogenated Co/anus 57hyperboreus after hydrogenation, and TMSdcrivatization.
FigureBI 'ewTcflono-ringdesign 75

LIST OF ABBREVIAnONS
ALe alcohol
AMPL acelOne polar mobile lipids
DAG diacylglycerols
EE clhylester
FAME fanyacidmethyleslers
FFA free fatty acids
FlO flame ionization detection
GC gas chromatography
GC.MS gas chromatogmphy with mass spectrometric detection
He hydrocarbon
KET ketone
MAG mooo3cylglycerois
ME melhyleslcr
PL phospholipid
PUFA polyunsaturated fatty acids
ST sterol
SE sicryl ester
TAG triacylglycerols
TLC-FID thin layer chromatography - flame ionization detection
TMS trimcthylsilylation
WE waxesler

LIST OF APPENDICES
Page
Appendix A A selection ofcalibration curves for lipid standards 64
Appendix B Automated solvent extraction 72
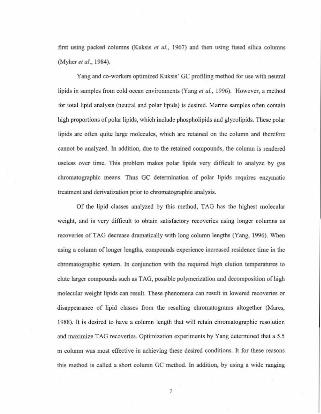
I [ TRODUCTION
Lipids are classified as carbon rich substances that can be extracted from cells and
tissues by non-polar organic solvents. Since lipids have a vcry high-energy value, lhey are
imponant fuels in marine ecosystems (Lee et ai, 1971). Marine lipid samples can be
obtained from a variety of sources including sediments, seawater, and plant and animal
tissue. Marine sediments onen contain the basic skeletal structures and fUllctional groups
of the original sources, and therefore serve as a tool to dctennine the origin of the
sediment (Venkatesan Cl aI, 1987). Lipid class data from seawater and sediments are
useful as indicators for pollution, types of organisms present in the sampling area. and
products of anabolic or catabolic processes experienced in these organisms. Marine plants
such as microalgae, seaweeds and seagrasses are the primary producers of energy in
marine ecosystems. This energy is commonly slOred as fatty acids in lriacylglycerols
(TAG) (Yang et al. 1996). Invertebrate animals such as oysters and mussels ingest these
plants and therefore serve as the link in the transfer of energy from phytOplankton to the
upper trophic levels of the marine food web. such as fish and marine mammals (Fenchel,
1988). For these animals, lipids are a very important source of metabolic energy. In
addition, many organisms are able to alter membrane fluidity in response to temperature
changes. This is achieved through changes in relative amounts of various wlsalurdtoo
fatty acids (FA) in thc membrane phospholipids (PL). The composition of marine lipids
depends greatly on changes in diet and environmental stresses.
Analysis of lipid quantities and compositions is therefore extremely importanl in
monitoring physiological conditions of a variety of marine species. For example,

quantitative evalualion of lipid profiles has specific significance in terms of biomarkers
and indices. Lipids and their derivatives have grcal polential as biomarkers because of
their diversiry of srructures synthesized by planrs. bacteria and zooplankton. These
compounds can therefore be used to monitor the pathway of carbon as it moves through
the ecosystem. In addition, lipids are potential solvents of lipophilic pollutants such as
polycyclic aromatic hydrocarbons (PAH), polychlorinated biphenyls (PCB) and p,p'.
dichlorodiphenyltrichloTQCthanc (DDT). Therefore they can provide a means of
transporting pollutants through marine ecosystems and into marine food webs (Parrish,
[988).
1.1 Lipid classes and structures
Marine lipid samples pro,'ide a unique challenge to separation science. Depending
on environmental stresses, diet and physiological condition of the organism, there can be
as many as 16 different subclasses of lipid (parrish. 1988). Lipids include many types of
compounds containing a wide variely of functional groups. Lipid classes are designated
based upon the structure and the biological and chemical nature of the compound. Figure
1.1 shows examples of severnl of the various marine lipid classes thar occur in marine
ecosystems. Lipids can be split into two different subclasses, which are the neutral and
thc polar lipids. In a lipid sample, neutral lipids can include triacylglycerols (TAG),
diacylglycerols (DAG), sterols (ST), stery[ esters (5E), wax eSlers (WE), free fatty acids
(FFA), free aliphatic alcohols (ALC) and hydrocarbons (HC). The polar lipids include
phospholipids (PL) and the glycolipids and other acetone mobile polar lipids (AMPL).

FREEF"'TTY~~_(20:~1
,I/'~
/'
i-o-!~
""'~!TRlACYlGLYCEROl.;Tnp.lmltin
STERYLESTER:CIlCIIeSW)lpalmitate
I/'~
/'
". 0
1-'-!~".,~
DIACYLGLYCEROt: ',2.Qipalmltln
WAXESTER:Hp;~~te
:X?-o~o""y_ .....
~ I,.,~
"".O.....{~
GLYCOtIPIDS: Oigalactoll~ diglyoarkle
Figure 1.1: Various lipid classes and example structures

Each class consists of a set of molecular species that have similar polarities,
however there can be scvcral important structural differences between each compound.
These differences can include units of unsaturalion and carbon chain lengths. Lipid
classes can also be grouped in other ways, such as the :lcyl lipid classes. These classes
contain the acyl group (R-C=O) that comes from the presence of a fatly acid within the
struclure. MAG, DAG, TAG and PL all contain fatty acids chains attached to a glycerol
backbone. In routine fatly acid analysis of a lipid extract, these fatty acids are cleaved
from the backbone and analyzed as fatty acid methyl eslers (Morrison and Smith, 1964)
by gas or liquid chromatography.
1.2 Methodology for analyses of marine lipids
Improvement and simplification of the melhodology for marine lipid analysis will
greatly benefit the field of marine lipid research. Advancements in analytical techniques
that lower detection limits and increase sensitivity produce data with higher levels of
precision and accuracy. Subsequently, the roUline identification and quanlitation of kcy
lipid compounds in an aquatic ecosystem can be made to be more time efficient and COSI
effective.
Marine lipid classes are a group of compounds that are very complex in nature.
Lipid classes may consist of many molecular species tbat arc similar in their physico>
chemical properties. This makes chromatographic methods the first choice for marine
lipid analysis.

1.2.1 Thin layer chromatography - name ionization detection
Since the early 1980s, thin layer chromatography with flame ionization detection
(TLC-FID) has been quite a common method of lipid analysis (Shamha, 1992). lnstead of
conventional plate TLC followed by scraping, extraction and analysis (e.g. FID
detection), Iatroscan TLC-HD has become an importantLool in marine lipid research.
The principles behind Tatroscan TLC·FID are generally the same as TLC on silica
plates. However, during a routine latroscan analysis, samples are individually spotted 011
a set of silica coated quartz rods. The tips of these rods are immersed in appropriate
solvent systems, which rise up the length of the rod. The resulting separations depend on
the polarities of the solvent system. Passing the rod along its length through the flame of
an ionization detcctor creates the chromatogram.
Typical lipid class analyses require development in a non-polar solvent mixture,
followed by partial FlO scan to quantify tbe resulting eluted compounds. The rods would
then be developed in a solvent mixture with increased polarity to elute the more polar
lipid classes, followed by FlO scan. Finally a strongly polar solvent system is used to
elute the polar lipids and scanned again. The compounds within each lipid class are eluted
together, resulting in a chromatographic peak for each class. A more detailed description
ofa typical lipid class analysis is found in Section 2.2.5.1.
The duration of a single lipid class analysis is approximately four hours,
regardless of whether one sample or twenty samples simultaneously (a typical maximum
in a rack of rods) are analyzed. latroscan procedures can be perfonned Lo separate a
specific class into their individual components, such as the phospholipids (Evans et al.,
1996). However, separation of neutr.\1 from polar lipids using a silica column is often

required to eliminate interference from the other classes, resulting in increased sample
preparation time added 10 an already lengthy procedure.
Despite having the ability to analyze both polar and non-polar lipid classes, the
latroscan suffers from several analytical problems (fvrzicka and Mares, 1990).
Insensitivity to low concentrations is a problem since the concentralions of lipid can be
quite small in many samples sucb as algae and juvenile fisb. Other problems include non
linear calibration curves. which make quantitation less accurate, as well as variability
between each rod. The latroscan also suITers in terms of environmental and health
concerns, since large amounts of hazardous solvent is discarded after each analysis.
Methanol, diethyl ether, acetone and chloroform are common solvents used in latroscan
analyses. It is these problems that make GC analysis more appealing.
].2.2 High perrormance liquid chromatograph)'
High perfonnance liquid chromatography (HPLC) is particularly useful as it
eliminates losses of temperature sensitive unsaturated lipids and for the analysis of high
molecular weight lipids such as phospholipids and conjugnled lipid classes (Shulka,
1988), HPLC utilizes solvents of varying polarities and a solid phase column 10 separate
the lipid samples. The separated solutes are passed through a detector such as an
ultraviolet absorbance detector, which provides the chromatogram output (Skoog, 1998).
1.2.3 Gas chromatography
Kuksis and co-workers were the chief developers of lipid class detenllination by
GC. Their first application of the technique involved analysis of human blood plasma,
first using packed columns (Kuksis el aJ., 1967) and then using fused silica colwnns
(Myher el aJ.. 1984).
Yang and co-workers optimized Kuksis' GC profiling method for use with neutral
lipids in samples from cold occan environments (Yang el al., 1996). However, a method
for total lipid analysis (neutral and polar lipids) is desired. Marine samples often contain
high proportions of polar lipids, which include phospholipids and glycolipids. These polar
lipids are often quite large molecules, which are retained on the column and therefore
cannot be analyzed. In addition, due to the retained compounds, the column is rendered
useless over time. This problem makes polar lipids very difficult to analyze by gas
chromatographic means. Thus GC determination of polar lipids requires enzymatic
treatment and derivalization prior 10 chromatogrnphic analysis.
Of the lipid classes analyzed by this method, TAG has the highest molecular
weight, and is very difficult to obtain satisfactory recoveries using longer columns as
~overies of TAG decrease dramatically with long column lengths (Yang, 1996). When
using a column of longer lengths, compounds experience increased residence time in the
chromatographic system. In conjunction with the required high elution temperatures 10
elute larger compounds such as TAG, possible polymerization and decomposition of high
molecular weight lipids can result. These phenomena can result in lowered recoveries or
disappearance of lipid classes from the resulting chromatograms altogether (Mares,
1988). 1\ is desired to have a column length that will retain chromatograplUc resolution
and maximize TAG recoveries. Optimization experiments by Yang detenllined that a 5.5
m column was most effective in achieving these desired conditions. It for these reasons
this method is called a short column GC method. In addition, by using 3 wide ranging

temperature program, neutral lipid compounds from Cl6 FFA to CS6 TAG are eluted
within half and hour and with reasonable separation in ternlS of carbon numbers, using a
high tempernture DB-S column (Myher et ai, 1984; Kuksis el al.)
1.2.4 Conlparisoll of chromatographic methods
TLC·FID is a commonly used method for lipid profiling since it has a high sample
capacity and offers analysis of both neutral and polar marine lipids (Volkman et al..
1989). However, in comparison to results obtained from a packed column GC thc results
of from TLC-FlD show much greater variability. TLC·FID is not easily automated and
has non·linear calibration curves. Slight variations between individual Chromarods
contribute to variability in results (Tvrzicka et al.. 1990). Data obtained by TLC-FlD lipid
profiling is limitoo to only ten subclasses after several developments in varying solvent
systems, which are often long in duration. GC or HPLC can resolve lipids into their
individual compounds (Kuksis el al.. 1975). Both GC and HPLC can be readily used in
conjunction with a mass spectrometer for even more highly detailed analysis with full
aUlomation. The limitations ofTLC-FlD require that more sensitive, precise and readily
automated methods be developed.
In comparison to GC, HPLC offers again thc elimination of loss of sensitive
unsaturated substances and higher molecular weight homologues. However, GC gives
higher sensitivity in detection, shorter analytical times and fewer difficulties in
idelltification(Mares,1988).
In conclusion, lipid profiling requires improvement over current methods. GC
offers the highest quality of analytical data for the lowest cost and highcsttime efficiency.

It is sensitive and readily automated. However. profiling again is limited to the neutral
lipid classes (Kuksis 1994, Yang el ai., 1996). This study will help to expand the classes
that can be analyzed by GC to include both neutraJ and polar species.
1.30bjecth·es
The objective of this research was to devise a complete automated GC method to
measure lipid profiles. including hydrocarbons, free fatty acids, sterols, wax esters. steryl
esters, triacylglycerols and phospholipids in marine samples. The method involves
extraction.. dephosphorylation, hydrogenation, TMS derivatizalion and analysis with
capillary GC al temperatures up to 340°C on a short, bonded nonpolar ZB-5 liquid phase
column.
Essentially, the new GC method incorporates the GC profiling strategy of Kuksis
(1984) and the optimized shon column GC method for marine neutral lipids developed by
Yang (1996). Separations are based on the carbon number of the various molecular
species within marine lipid classes, which do not nonnaJly possess overlapping molecular
weights.
The specific objectives were:
I) To optimize the conditions of high temperature non-polar gas chromatography
for a total lipid profile;
2) To analyze data from lipid standards to support total lipid profile data;

3) To optimize the amount of phospholipase C required to digest a known
amount of phospholipid in order to digest all the phospholipid presenl in a
sample;
4) To compare the GC results to those from TLC·FlD;
5) To verify usefulness by applying the procedure to various marine samples.
10

2 EXPERIMENTAL
Z.ll\'lalerials
2.1.1 Glassware and cbemicals
All conlainers that come into contact with any solvent were made of glass with
caps made with Teflon liners. All glassware was made from Pyrex. All glassware was
cleaned oftmee lipids by rinsing three times with methanol followed by three limes with
chlorofonn.
All chemicals and solvents used were eilher of analytical or chromalographic
grade. All lipid standards employed in this resean;h were prepared from
chromalognlphically pure materials (at least 99010 purity) supplied by Sigma (St. Louis,
MO,USA).
a-rings created specifically for me VELP Solvent Automated Extractor were
made using virgin Teflon.
1.1.2 Marlnesamples
Several of the samples analyzed in Ihis study were obtained in August 2000 from
Kelly's Point, in southern Labrador, Canada. From this location, lwo species of starfish,
Crossaster pappOSIiS and Ophiura sarsi as well as a species of scallop, Ch/alll)'s islalldica
lind copepods of the species Calalllls were dredged.
Yellowtail flounder were cultured in the Ocean Sciences Centre, Memorial
University of Newfoundland. Nearshore capelin samples were collected off William's
"

Harbour, Southern Labrador, Canada, August 2000. Samples of Pacu. a freshwater fish
were collected in SAo Paulo State. central Brazil.
2.1.3 Totals)'stem blanks
Blanks. which involve all procedural steps carried out without a sample. were
performed during the analysis of each marine species. Any chromatographic peaks due to
background compounds were subtracted from those in the samples.
2.2 Methods
The entire experimental design is outlined in Figure 2.1.
2.2.1 [xtnction
Samples analyzed in lhis research were already extracted prior to receiving them.
Aliquots of homogenized marine samples were extracted wilh a mixture of ehlorofonn
and methanol, following the procedure of Folch et a!' (1957). The chlorofonn layer
containing Ihe extracted total lipids was transferred to a 15 mL glass vial and was stored
under nitrogen at -20 °c prior to sample preparation procedures and analysis.
2.2.2 Phospholipid digestion
Four mL of basic Tris buffer solution (consisting of 1.060g of
Tris[hydroxymethyl]aminomethane Tns (basic) and 0.05558 of CaCI2 dissolved in
SOOmL of distilled H20, pH adjusted 10 7.3 with HC!). 1.3 mL of I% CaCh and 50 units
12

TLC-FID
Marine Samples
Extraction
Dephosphorylation(phospholipid Digestion)
Hydrogenation
Trimethylsilylation
Short ColumnGas Chromatography
Figure 2.1: Experimental design.
13
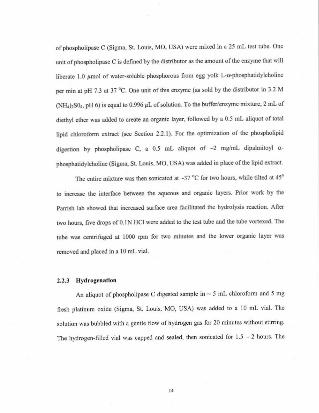
of phospholipase C (Sigma, St. Louis, MO, USA) were mixed in a 25 mL test lube. One
unit of phospholipase C is defined by Ihe distributor as the amount of the enzyme Ihal will
liberate 1.0 IImol of water-soluble phosphorous from egg yolk L.a.phosphalidyleholine
per min at pH 7.3 at 37 "C. One unit of this enzyme (as sold by the distributor in 3.2 M
(NH.)lSO~, pH 6) is equal 10 0.996 ILL of solution. To the buffer/enzyme mixtW'e, 2 mL of
diethyl ether was added to create an organic layer, followed by a 0.5 mL aliquot of total
lipid chlorofonn extract (see Seedon 2.2.1). For the optimization of the phospholipid
digestion by phospholipase C, a 0.5 mL aliquot of -2 mglmL dipalmitoyl a·
phosphatidylchoJine (Sigma, St. Louis, MO. USA) was added in place of the lipid extract.
The entire mixture was then sonicated at -37 "c for two hours, while tilted at 45"
to increase the interface between the aqueous and organic layers. Prior work by the
Parrish lab showed thai increased surface area facilitated the hydrolysis reaction. After
two hours. five drops of 0.1 N HCI were added to the lest tube and the lube vortexed. The
tube was cenlrifuged at 1000 rpm for two minutes and the lower organic layer was
removed and placed in a 10 mL vial.
2.2.3 Hydrogenation
An aliquot of phospholipase C digested sample in - 5 mL chlorofonn and 5 mg
fresh platinum oxide (Sigma, St. Louis, MO, USA) was added 10 a 10 mL vial. The
solulion was bubbled with a gentle flow of hydrogen gas for 20 minules withOll1 stirring
The hydrogen-filled vial was capped and sealed, then sonicated for l.5 - 2 hours. The
14

hydrogenated sample was then filtered with a lipid cleaned GFC glass fiber filter paper to
removcthecatalysl.
2.2.4 Trimethylsilylation
An aliquot of lipid sample was placed in a 2 mL vial and evaporated to dryness by
nitrogen. This dried lipid sample was mixed with two drops of N,O-bis(trimethylsilyl}
acetamide and two drops of N,Q-bis(trimethylsilyl}-trifluroacetamide (Sigma, St. Louis,
MO, USA), then sealed under nitrogen and heated at 70°C in an oven for 15 minutes. The
excess trimethylsilylation (TMS) reagents were evaporated ofT under nitrogen and the
TMS derivatives were dissolved in 0.5 mL of hexane prior to GC profiling.
2.2.5 Chromutl:tgntpbh:: methods
2.2.5.1 Thin layer chromatography - name ionization detectJon
Aliquots of the samples were directly separated into lipid classes on silica-gel
coated Chromarods-Slil using four diffcrent solvent systcms and measured in an
[alroscan MK V (Iatron Laboratories, Tokyo, Japan) after developmcnt with each solvent
system (Parrish, 1987) as follows.
Each sample was spotted with an appropriate volume of extract on an individual
rod, with a 20 ILL Hamilton syringe. The sanlple spots were then focused to a narrow
band using 100% acetone. After 5 minutes in a constant humidily chamber, the rods were
developed using a 99:1:0.05 hexane/diethyl ether/formic acid mixture (60 mL) for 25
minutes. The rods were dried in the constant humidity chamber for five minutes before
IS

developing the rods again in the same solution for a further 20 minutes. Repeating the
development helps to sharpen the eluted peaks. The first partial FID scan (78% of the rod
from the top) was then performed, which detects the He, SE/WE and K.ET lipid classes
that have eluted up the rod from the origin.
Upon completion of the first development and detection, the rods were developed
in a tank containing an 80:20: I hexaneJdiethyl ether/formic acid mixture (60 ml) for 40
minutes and then scanned by the flO (89"/e of the rod from the top) for the TAG, FFA,
AlC and ST lipid classes.
The final development stage involved developing the rods twice in 100-;. acetone
(60 ml) for 15 minUles to elute the AMPL (dried in between developments). After drying
in the constant humidity chamber for 5 minutes and then developing in a final solvent of a
5:4:1 methanoVchloroform/water mixture (60 ml) for 10 minutes twice (dried in between
developments) the rods were then scanned for a final time for their entire lengths for the
MiPl and Pl lipid classes.
The three resulting chromatograms from the three FLO scans were then combined
to foml one complete chromatogram of the lipid classes and the resulting data were
analyzed using the T Data Scan Chromatography Analysis prognl.m (RSS, Bemis, TN,
USA).
2.2.5.2 GIlS chromatography
Total lipid profiles were investigated using a Hewlett Pacbrd 6890 Plus GC
system equipped wilh a Hewlett Packard 7863 automated injector and a FlO. The
analytical short column was a 5.5 m Z8-5 fused silica column (0.32 mm 10 and 0.25 pm

film thickness) coated with a cross-linked 5% phenylmethyl silicone (Supelco, Bellefonte,
USA). The earrier gas (helium) was set at 10 psi of colunut head pressure, and the lotal
flow ofearrier gas and make up gas (helium) to the Fro was kept at 30mUmin. The flow
of the fuel gas (hydrogen) was adjuSted to 30 mUmin and the air flow was set 31 300
mUmin. The heater lemperature of the FID was set at 34SoC. The column oven
temperature was programmed to rise from the initial temperature: of 6ifC to I ISoC at
40"Clmin, to 22SoC at 2S°C'Jmin, to 280"C at IS°C'Jrnin. and to the final tcrnperalUre,
34O"C, at S°C/min. where it was held for 13.S8 minutes. Data acquisition, baseline
subtraction. and chromatogram re-plotting were perl'onned with the Hewlett Packard
Chemstation software.
The parameters for autoinjection, the cool on-column injection temperature
program, inilial colwnn lemperature, type of carrier gas, injection technique, length of
column and septum lypeS in the GC were based on previous work by Yang (1996).
In order 10 obtain good quantilative data from several different lipid classes, a
wide carbon number range of standard lipids including hydrocarbons, free flltty acids,
ketones, wax esters, sterols, steryl esters, DAG and TAG were used. Retention times of
peaks that appear between these standards were calculated by mathematical interpolation.
17
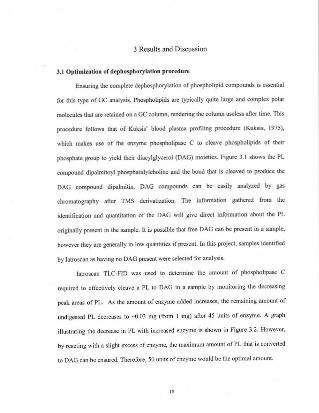
3 Results and Discussion
3.1 Optimization of dephosphorylation procedure
Ensuring the complete dephosphorylation of phospholipid compounds is essential
for this type of GC analysis. Phospholipids are typically quite large and complex polar
molecules thai are relained on a GC column, rendering the column useless after time. This
procedure follows that of Kuksis' blood plasma profiling procedure (Kuksis, 1975),
which makes use of the enzyme phospholipase C to cleave phospholipids of their
phosphate group to yield Iheir diacylglycerol (DAG) moieties. Figure 3.1 shows the PL
compound dipalmitoyl phospbatidylcholine and the bond that is cleaved to produce the
DAG compound dipalmitin. DAG compounds can be easily analyzed by gas
chromatography after TMS derivatization. The information gathered from the
identification and quantitation of the DAG will give direct infonnation about the PL
originally present in the sample. It is possible that free DAG can be preseO! in a sample,
however they are generally in low quantities if present. In this project, samples identified
by latroscan as having no DAG present were selected for analysis.
latroscan TLC·FID was used to determine the anlount of phosphollpase C
required to effectively cleave a PL to DAG in a sample by monitoring the decreasing
pcak areas of PL. As the amount of enzyme added increases, lhe remaining amount of
undigested PL decreases to -0.03 mg (from I mg) after 45 units of enzyme. A graph
illustrating the decrease in PL with increased enzyme is shown in Figure 3.2. However,
by reaeling with a slight excess of enzyme, the maximum amount of PL tbat is converted
to DAG can be ensured. Therefore, 50 units of enzyme would be tbe optimal amount.
\.

O-\O-fIO,C-~-I~
1 .O-j-O
1<>,
I<>,
.1o/J'01,
PI1osphoIipaseC
basicTrbBu:rilll'.diel:I:¥elher.1'ltocacl,.atril:aM2h031OC
O-\O-f",c-C-CH,
OAG H ~
HO r _O-j-O
1<>,
I<>,
.1
c<l'~
"'igure 3.1: PL molecule dipalmitoyl phosphatidylcholinc cleaved 10 DAG through
enzymatic hydrolysis.
19

... .
. . . .
UrlitsofPhospholipasaC
Figure 3.2: Optimization of dephosphorylation procedure. Portions (0.5 mL) of a 1.964
mg/mL standard solution of u.phosphatidylcholine dipalmitoyl were reacted with
increasing amounts of phospholipase C as per the procedure outlined in Section 2.2.2.
20

In order to hydrolyze all the PL present in a sample. some prior knowledge orhow
much PL was present in the sample is necessary. An estimate of the PL per sample can be
obtained from previous literature and TLC·FID results or experience in order for a
suitable :unoun! of enzyme to be added. If a percentage of PL in lhe wet or dry weight of
a sample is known or estimated, then successful dephosphorylation can be perfomled. GC
analysis of Ihe TMS-DAG can then be used to identify and obtain quantitative
infonnalion about each individual PL compound (by carbon number) along with the other
lipids prcsent in Ihesample.
3.2 Hydrogenation
The accumulative effects of various functional groups, unsaturation and carbon
number contribute to the chromatographic behavior of the compounds in a lipid sample.
Unsaturalion. or the presence of double bonds, plays a major factor in teons of
identification and separation of compounds by GC. Compounds such as fatty acids, which
are similar in structure are separated according to their carboll chain lengths and their
unsaturation. Short hand nomenclature for fauy acids is genernlly of the form a:bcx:
where a is the number of carbons in the chain, b is lhe number of double bonds and OK is
lhe position of the double bond closest to the tcnninal melhyl group. In tcnns of short
column GC elution order, on a 30m non-polar column, an 18:1ro7 fauy acid would elute
before an 18:2004 fatty acid. Both of these fatty acids elute before a 20:5ro) fatty acid.
In this GC project, a wide variety of compounds are being analyzed which diffcr
greatly in structure and complexity. Problems arise where compounds of differing carbon
21
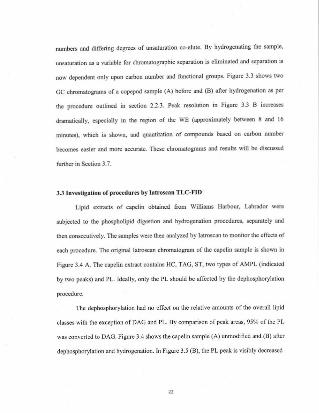
numbers and differing degrees of unsaturation co-elute. By hydrogenating the sample,
unsaturation as a variable for chromatographic separation is eliminated and separation is
now dependent only upon carbon number and functional groups. Figure 3.3 shows two
GC chromatogr<lms of a copepod sample (A) before and (B) after hydrogenation as per
the procedure outlined in section 2.2.3. Peak resolution in Figure 3.3 B increases
dramatically, especially in the region of the WE (approximately between 8 and 16
minutes), which is shown, and quantitation of compounds based on carbon number
becomes easier and more accurate. These chromatograms and results will be discussed
funher in Seclion ].7.
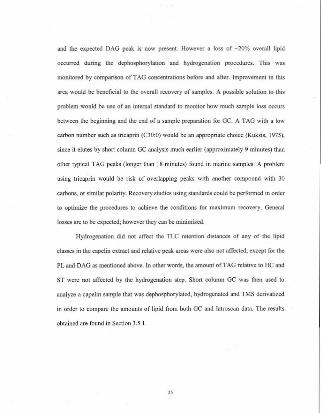
3.3 Innstigalion or procedures by latroscan TLC-FlD
Lipid extracts of capelin obtained from Williams Harbour. Labrador were
subjected 10 the phospholipid digestion and hydrogenalion procedures. separately and
then consccUlively. The samples were then analyzed by latroscan to monitor the effects of
each procedure. The original latroscan chromatogram of the capclin sample is shown in
Figure 3.4 A. The capeHn extract contains He. TAG, ST, two types of AMPL (indicated
by two peaks) and PL. Ideally, only the PL should be affected by the dephosphorylation
procedure.
The dephosphorylation had no effect on the relative amounts of the overall lipid
classes with the exception ofOAG and PL. By comparison of peak areas, 95% orthe PL
was converted to OAG. Figure 3.4 shows the capelin sample (A) unmodified and (8) after
dephosphorylation and hydrogenation. In Figure 3.5 (B). the PL peak is visibly decreased
22

A
B
.. L.. 0." '.Ill "..
Figure 3.3: Panial chromatograms orcA) non-hydrogenated and (B) hydrogenated
copepod sample, showing the WE peaks.
2J

A-, HC ST AMPL PL
"", j""i
", I1
-14 16 ",. a l< :l6 :Ill(~,
::: 'jHC TAG ST DAG PL
B
:1:1
I~ ;~~~IIC F~~f~~~~~.~· 24" "$ ..~
(~,
Figure 3.4: Comparison of (A) an unmodified capelin extract with (0) a capelin extract
aftcr dephosphorylation IIl1d hydrogenation.
and the expected DAG peak is now present. However a loss of -200/0 overall lipid
occurred during the dephosphorylation and hydrogenation procedures. This was
monitored by comparison of TAG concentrations before and after. Improvement in this
area would be beneficial to the overall rec(H'ery of samples. A possible solution 10 this
problem would be use of an internal standard 10 moniior how much sample loss occurs
between the beginning and the end of a sample preparation for Gc. A TAG wilh a low
carbon number such as tricaprin (C30:0) would be an appropriate choice (Kuksis. 1975),
since it elutes by short column GC analysis much earlier (approximately 9 minutes) than
other typical TAG peaks (longer than 18 minutes) found in marine samples. A problem
using lricaprin would be risk of overlapping peaks with another compound with 30
carbons, or similar polarity. Recovery studies using standards could be perfomled in order
to optimize the procedures to achieve the conditions for maximum recovery. General
losses are to be expected; however they can be minimized.
Hydrogenation did not affect the TLC retention distances of any of the lipid
classes in the capelin extracl and relative peak areas were also not affected. except for the
PL and DAG as mentioned above. In other words. the amounl of TAG relative to HC and
ST were not affected by the hydrogenalion Slep. Shon column GC was then used to
analyze a capelin sample that was dephosphorylated, hydrogenated and TMS derivatized
in order to compare the amounts of lipid from both GC and latroscan data. The results
obtained are found in Section 3.5.1.
"
3.4 Lipid class identification and ulibration by short column GC
Separations of lipids on a short GC column are the resuh of stroctural complexity,
carbon number as well as the functional groups of each compound. As a result,
compounds arc eluted in order of: hydrocarbons, ketones, alcohols, fatty acids
(hydrogenated species of the same carbon number will always elute in this order), wax
esters, diacylglycerols, steryl esters, and triacylglycerols. Table 3.1 shows the retention
times of the common carbon numbers of each lipid class. Retention limes of compounds
marked with an asterisk denote those compounds determined using single standards,
while alher retention times were determined using mathematical interpolation between
standards as well as through comparison with peaks from marine samples. In the case of
using marine samples 10 determine retention times, !alroscan data of the extracts made it
possible to select samples whose lipid classes would be sure to separate very well by the
short column GC mcthod. For example, a winter flounder sample contained FFA, ST, PL
and TAG, all of which elute at very differelll retention times. In the case ofdetennining
TAG retention times. using previous knowledge that the major compounds in the TAG
lipid class are odd in carbon number (three even carbon-numbered fatty acid chains and
the three-carbon glycerol backbone) as well as knowledge that C51, C55 and C57 elute at
18.18, 20.94 and 22.36 minutes respectively, the rdention times of the rest of the TAG
compounds could be predicted. Groupings of lipid classes in tenns of carbon number
become simple to predict with experience, with lhe TAG profile resembling a Gaussian
distribution at times when TAG is of high proportion in the extract as in the capelin
extract and flounder extract in Figures 3.5 and 3.6. respectively.
26

Table 3.1: R~tention limes {in minutes (! 0.01) or lipid classes by carbon number, as
delennined by standard calibration and mathematical interpolation.
Carbon Number WE OAG" SE
Carbon number He14 1.6916 2.1418 2.67"20 3.5422
2'262728
2'30
KEf ALe" FFA" ME1.86 2.072.64' 2.84' 2.91' 3.00'3.44 3.49 3.63 3.14·4.27 4.21 4.32' 4.43'
4.87 4.97" 5.07"S.58 5.67'
EE sr·
5.11'
5.746.63
6.37 7.12'7.497.79"8.06'
TAG32 7,9934 8,7135 9.0836 9.41"37 9.95"38 10.1639 10.8240 11.1141 11.85'42 12.2243 13.02 14.81'44 13.44'45 14.28 1628'46 14.6647 15,60 17.76'48 15.8849 16.81 19.25' 16.9151 18.18'~ 1~
55 20.94'57 22.36'~ ~.18
61 ~.21
n W.M~ 33.~
• _retention times detcnnincd by single standards (Sigma)... - classes that were TMS dcrivatized prior to calibration.
27

Using similar infonnation about Ihe other lipid classes can also aid in
identification of peaks. For example, SE. DAG and the previously mentioned TAG are
typically odd carbon-numbered compounds. Even carbon-numbered compounds of these
classes are possible and do exisl, but generally are of much smaller abundance. Odd
carbon numbered futly acid chains are generally less common in marine samples than
those conUlining even carbon numbered chains, especially Ihe 16. 18. 20. 22 and 24
carbon FFA chains. This is also true of KET and WE. In the cases of DAG and TAG, the
three-carbon glycerol backbone in addition to the even-carbon numbered fatty acid chains
make these classes typically odd in carbon number. Sterols in marine samplc:s are
typically highest in e27 with some samples having minor amounts of C26 and C28.
Terrestrial markers such as C28 and C29 ST as well as C30, a dinoflagellate marker can
also be observed in some marine samples (Hudson et ai, 2001). Since the C27 ST peak is
generally the largest ST peak, it becomes simple to locate it (7.1 minutes) and thcn locale
the C26, C28, C29 and C30 peaks (if present) eluting 0.3 minutcs from each other using
the short column. In cases where WE, SE and DAG are al1 prescnt in tbe sample, good
separation can be difficult at times, rcsulling in some shouldering of GC peaks. However,
WE are usually even carbon-numbered, and DAD and SE are odd carbon-numbered, so
overlap is generally not a problem.
FTD rcsponses of scveral lipid standards were calibrated using the short column
GC method. These standards consisted of the following selection of neutral lipids:
hydrocarbons, ketones, free fally acids, wax esters, sleryl esters, an alcohol,
diacylglycerols and triacylglycerols. Classes marked with a double asterisk in Table 3.1
denole lipid classes that were TMS derivatized prior to calibration. These lipids were
28

calibrated in order to be able to detennine the amounts of each lipid class quantitatively.
in a situation where many lipids of the same class appear in II sample, it is not a viable
option to have a standard for each individual lipid. Therefore, experiments were
performed to determine whether two standards differing in cartxm length from each class
would have the same response faclor. Lfthe resulting calibration equation between each of
the standards was similar, then it could be used to determine the amounts of all types of
lipids. In other words, one standard could be used to calibrate a whole class of lipids.
Calibration curves for each standard were calculated and compiled using increments of
10, 20, 40, 60. 80 and 100 og of standard injected. These calibration curves were then
used in the quantil31ion of each sample analyzed. A representative selection of the
calibration curves can be found in Appendix I.
3.5 General ~omparison ofsbort ~olumD GC and TLC·FIO results
Each sample extracl analyzed using Ihe shon column GC melhod was
dephosphorylated. hydrogenated and TMS derivatized prior to chromatography. Without
TMS derivatization (sec Section 2.2.4), chromatob'TIUllS of compounds containing a frce
OH fWlCtional group, such as FFA, ALe, ST, MAG and DAG suffer from peak lailing
due to strong interaction with lhe liquid phase of Ihe column. By perronning a TMS
derivatization, Ihese compounds become more volatile (and less polar, wh.ich results in
weaker retention time compared to an undcrivlItized compound) and improved peak
resolution is observed. latroscan lipid class anal)l5is does nol require TMS derivatization.
however derivatized standards were used in the GC calibration.
29

The quantit3tion of PL by the short column GC method involves quantifying the
DAG in the sample after dephosphorylation. 11 must be noted that the SlI"Ucture andlor
identity of the phosphate headgroup thai is removed by the procedure cannot be obtained.
However, useful information can be obtained about the carbon-rich (non-polar) DAG
backbone of the PL. There is generally one DAG produced by the dephosphorylation for
each PL molecule present in the extract. By subtracting the mass oflhc TMS group from
the DAG and then adding a phosphate headgroup to the compound, one can calculate the
amount of PL. The phosphate head group phosphatidyl choline was selected since it is the
mosl abundant animal diacytglyccrophospholipid (OurT el al., 1971). Therefore, the
percentage of PL in the sample calculated by short column GC should be the equivalent
to the percentage of PL detennim:d by the Jatroscan. Hence, percent lipid data is a useful
way to detennine whether the information obtained by the shon column GC method is
comparable to that obtained by the latroscan.
Prior to GC analysis, an latroscan was used to analyze the samples for lipid
classes. Some of these latroscan analyses wen: performed close to a year prior to the GC
analysis, and this storage time may contribUie 10 elevated levels of FFA preseDl in the
samples, due to breakdown of the acyl lipid classes.
3.5.1 Short column analysis of capelin extract
This capehn extract was the same extract used to investigate the
dephosphorylation and hydrogenation procedures in Section 3.3. CapeHn are of interest 10
researchers since they are the prey of many marine animals, including larger fish,
mammals and birds. Table 3.2 shows the percent lipid class data obtained by the shan
30

Table 3.2: Percent lipid data for capclin extract detennined by short column GC and
latroscan.
LlpldClaas Carbon Number % Lipid GC % Lipid latroscanHC 14 0.13
1. 0.121. 0.13
rHC 0.39 0.65
FA 1. 0.2320 0.1922 0.3124 0.24
r FFA 0.97 0.76
ST 27 1.1628 0.07
rST 1.23 0.93
DAG 3. 1.65(Pl) 41 2.12
43 2.5545 1.8647 2.20
rDAG (PL) 10.37 7.56
TAG 4. 0.8251 3.6152 0.4453 7.2054 1.4555 15.8556 2.3157 18.5056 1.215. 20.9560 0.9761 7.2562 0.61.3 6.4664 0.51.5 3.41
gAG 91.55 90.08
1I

·P~=====:::=:J"~--~~=======::::
figure 3.5: CapeEn extract short column GC chromatogram after dephosphorylation,
hydrogenation and TMS derivatization.
32
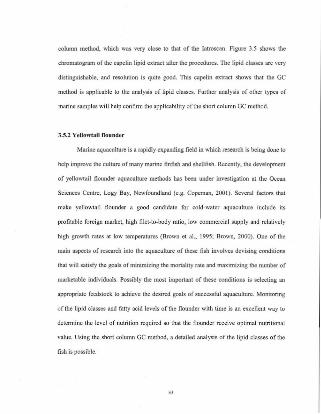
column method, which was very close 10 that of the Ialroscan. Figure 3.5 shows the
chromatogram of Ihe capelin lipid extracl after me procedures. The lipid classes are very
distinguishable. and resolution is quite good. This capeJin extract shows that the GC
method is applicable to the analysis of lipid classes. Further analys;s of other types of
marine samples will help eonfiml the applicability of the short column GC method.
3.5.2 Yellowl:1j] nounder
Marine aquacullure is a I'3pidly expanding field in which research ;s being done 10
help improve the culture of many marine finfish and shellfish. Recently. me development
of yellowtail flounder aquacuhurc methods has been under investigation al the Ocean
Sciences Centre. Logy Bay, Newfoundland (e.g. Copeman, 2001). Several factors that
make yellowtail flounder a good candidate for cold·water aquaculture include its
profitable foreign market, high filet-to-body ratio, low commercial supply and relatively
high growth rates at low temper3tures (Brown et aI., 1995; Brown, 2000). One of the
main aspects of resean:h into the aquaculture of these fish involves devising conditions
that will satisfy the goals of minimiz.ing the mortality rate and maximizing the number of
marketable individuals. Possibly the most important of these conditions is selecting an
appropriate feedslOck to achieve the desired goals of successful aquacuhurc. Monitoring
of the lipid classes and fatty acid levels of the flounder with time is an excellent way to
detcnninc the level of nutrition required so that the flounder receive optimal nutritional
value. Using the short column GC method, a detailed analysis of the lipid classes of the
fish is possible.

Data oblained from the short colwnn GC melhod were compared to data from the
latroscan to show the efficiency of lhe method. and to detennine whether the same
information could be obtained. Figure 3.6 is lhe chromatogram obtained from a 500 ltL
aliquot of the original flounder extract after depbosphorylation, hydrogenation and TMS
derivatization. The chromatogram shows the expecled peaks, including FFA, ST. DAG
(from PL) and TAG. Table 3.3 compares the tOlal amounls of lipid classes obtained from
the GC to those from the latroscan. In comparison to the latroscan method, the levels of
FF"A in the extract are much higher in the GC sample, mostly due to a large amoulII of
C24 F"F"A. This increase in the expected amount was duc to a C24 FFA intemal standard
having been added to the exlract prior to analysis. Therefore Ihis amount was subtracted
before calculating thc final amount ofC24 FF"A. As for the rest of the lipid classes, an
overall average of63.7 =3.7% reco\'ery was detennined after the procedures., which is
consistent with lhe other samples analyzed with mis method.
In comparison to the latroscan, the data acquired through the GC method is
equally effective in detennining the lipid class data of the sample; however, more
information is generated about how the compounds \\,'ithin lOOse lipid classes are divided
by carbon number. The yellowtail !lounder extracl was used 10 determine the overall
analytical precision. Three 0.5 mL aliquols of me extract were dephosphorylated.
hydrogenated and TMS dcrivatized. The amount of PL was calculated, and !he three
samples were found to be 567 ± 10 Jlg, i.e. 1.7% error between replicate samples.

~'-----=9:!!1
I I I I I I IFigure 3.6: Yellowtail flounder short column GC chromatogram after dephosphorylation.
hydrogenation and TMS derivatizalion.

T:lble 3.3: Percent lipid data for yellowtail flounder extract detemlined by shon column
GC and latrosean.
Lipid Class COirbon Number % Lipid GCFFA "
0.05
" 0.1620 0.3222 0.2224 0.39
I;FFA 1.08'
ST 27 3.5628 0.1029 0.14
rST 3.79
OAG(Pl) 36 0.3636 0.3637 0.7336 0.4339 2."40 0.5741 3.4742 0."43 5.5044 0.6745 4.5146 0.7347 1.99
rOAG (Pl) 22.63
% Lipid lattoscan
1.92
4.78
16.46
TAG 51 2.7752 0.6853 7.7554 1.6655 14.0156 2.2757 16.6058 1.6159 13.0660 1.3461 9,4762 0.5863 4.6664 0,2765 2.52
nAG 11.78 76.79
.... calculated aller subtraction of C24 FFA internal standard.
36

3.5.3 Sea scallop female gonad
Aquaculture of seas scallops is another scenario in which the monitoring of lipid
classes is il useful tool in detennining the optimal breeding rates of these animals. The
lipid levels of female scallop gonads are of importance in particular since scallop eggs
derive their nutritional reserves from lipids provided by the gonads (Pazos et ai., 1997). In
other words, hatchery success is directly related to the lipid status of the eggs when
spawned, therefore high lipid levels in the gonads are desirable. Lipids ofinlerest include
TAG for their energy storage properties and PL for their importance in cell growth (as
part of cell membranes). Therefore, analysis of scallop gonad lipids by short column GC
would be an excellent use of this method.
The results obtained by the short column GC compared to those obtained by the
latroscan (Table 3.4) were very close, with higher levels of FFA due to degradation of the
DAG and TAG. Figure 3.7 shows a chromatogram of the scallop gonad extract, which
shows that the amount of even carbon-numbered DAG in the sample was high, as they
were in the scallop muscle (Section 3.5.4) and spiny sunstar (Section 3.5.6). However, the
literature did not suggest that high levels of odd-carbon numbered fatly acid chains are
prescnt in these scallops, however it could be accounted for in the spiny sunstar (see
Section 3.5.6).
3.S.4Senscnllopmusde
Lipid class analysis of the muscle tissue of sea scallops is also important in aquaculture of
these animals. Nutritional infonnation is of importance to scallops famlcrs, as well as to
monitor the physiological well being of the animals. High levels of polyunsaturated fatty
37

Table 3.4: Percent lipid data for sea scallop female gonad extract dctetmilled by short
column GC and Introscan.
Lipid Class Carbon Number %UpidGC % lipid latro5can
HC 14 0.0816 0.1018 0.0720 0.11
rHC 0.36 0.44
MKET 16 0.3518 0.1220 0.0522 0.10
lI"KET 0.62 0.90
FF' 18 0.1318 0.5520 0.3522 0.8024 0.27
I:FFA 1.90 U5
ST 28 0.7827 0.7828 1.0429 0.41JO 0.10
r ST 3.1' 5.50
OAG(PL) 35 0.5936 0.2137 1.0938 0.2139 2.8640 1.3441 5.8342 3.2743 6.0644 0.2145 2.7046 0.2147 2.0948 0.2149 1.99
EDAG (PL) 28.87 22.31
J8

Sf 41 0.2543 0.2745 0.2241 0.64
r5E 1.37 1.30
TAG 51 2.7752 0.6853 7.7564 1.6655 14.0168 2.2757 16.6058 1.6159 13.0660 1.3461 9.4762 0.5863 4.6864 0.2765 2.52
nAG 71.78 76.79
39

, 8,
! ~
5 :
S~5 ,
~ ;
{, ~
~ ~5
,,55
{p 5 ,5 '
5~ u:: !
!0:: ~
c::f .~ !"
iHllIlIHllIlHiilllih
Figure 3.7: Sea scallop female gonad short column GC chromatogram after
dephosphorylation, hydrogenation and TMS derivatization.
40
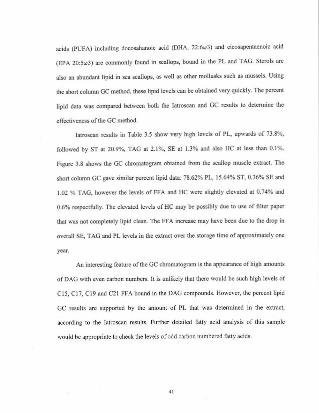
acids (PUFA) including docosahanoic acid (DHA, 22:6w3) and cicosapentacnoic acid
(EPA 20:5(3) are commonly found in scallops, bound in the PL and TAG. Sterols are
also an abundant lipid in sea scallops, as well as other mollusks such as mussels. Using
the short column GC method, these lipid levels can be obtained very quickly. The percent
lipid data was compared between bolh the latroscan and GC results to detennine the
effectiveness of the GC method.
Tatroscan resulls in Table 3.5 show very high levels of PL, upwards of 73.8%,
followed by ST at 20.~Io, TAG al 2. T%, SE at 1.3% and also He al less than 0.1 %.
Figure 3.8 shows the GC chromatogram obtained from the scallop muscle eXtnlCl. The
shon column GC gave similar percent lipid data: 78.62% PL, 15.640/. ST, 0.36% Sf and
1.02 % TAG, however the levels of FFA and He were slightly elevated at 0.74% and
0.60/. respectfully. The elevated levels of HC may be possibly due to use of filter paper
that was not completely lipid clean. The FFA increase may have been due to Ihe drop in
ovcrall SE, TAG and PL levels in the extract over the storage time of approximately one
year.
An interesting feature of thc GC chromatogram is the appearance of high amounts
of DAG with even carbon numbers. It is unlikely that there would be such high levels of
CIS, CI7, CI9 and C2l FFA bound in the DAG compounds. However, the percent lipid
GC results arc supported by the amount of PL that was detennined in the extract,
according to the latroscan results. Further detailed fatty acid analysis of this sample
would be appropriate to check thc levels of odd caroon numbered fatty acids.
41

II I I I I I I ! I I I I I I IFigure 3.8: Short column GC chromatogram of scallop muscle tissue extract after
dephosphorylation, hydrogenation and TM$ derivatizatioll.
42

Table 3.5: Percent lipid data for scallop muscle extract detemlined by short column GCand [atroscan.
LildClus Carbon Number "I. lipid GC % LJ id latroscan
HC 14 0.17
" 0.1518 0.1120 0.15
ViC 0.66 0.07
FFA 16 0.1420 0.2422 0.2224 0.15
EFFA 0.74 0.09
ST 26 1.522T 5.9126 5.7529 2.0630 0.36
EST 15.64 20.94
DAG(PL) 35 3.2536 1.4637 2.5236 3.0639 5.'"40 2.3141 15.9242 7.5443 14.7044 6.0245 5.6346 5.4147 2.6646 2.72
I:DAG (PL) 78.62 73.88
SE 45 0.2647 0,10
ESE 0,36 1.30
TAG 51 0.1852 0.1253 0.05

5455,.57585960
6'6263
[TAG
3.5.6 Spiny sun slllr Crossas((~r papposlIs
0.100.050.120.060.090.050080.050.070.001.02 2.10

The common sun star, Crossaster fXlPposus, relies on lipids as an important
reserve of energy in the form of TAG and alkyldiacylglycerols. In addition, cyclic
changes in the lipid content of these animals have been correlated with their reproductive
cycles (Sargent et al.. 1983). Therefore, lipid determination and analyses is of importance
to researchers who are interested in the biochemistry of this animal.
The percent lipid data determined by latrosean and short column GC is shown in
Table 3.6 as well as the GC chromatogram obtained by the short column GC method
(Figure 3.9). The shon column GC data agrees well with the latroscan percent lipid
results. Of particular interest in the shon column GC data is the presence of a large
percentage of even carbon-nwnbered DAG compounds in the sample, which is indicative
of large amounts of odd chained fany acid groups in the PL of these animals. This
phenomenon of odd chain fatty acids in asteroids such as these is discussed by Sargent et
af. (1983) and the references therein.
3.6 Other Applications
Once the short column GC method had been validated for use in routine analyses,
the method was used to solve real analytical problems. In some situations where latrosean
could not provide adequate information about a sample, the short column GC method was
used to authenticate questionable latroscan data. In addition, in situations where the limits
of latroscan begin to appear, the short column GC method was used to expand the
chemical infomlalion about the extracts
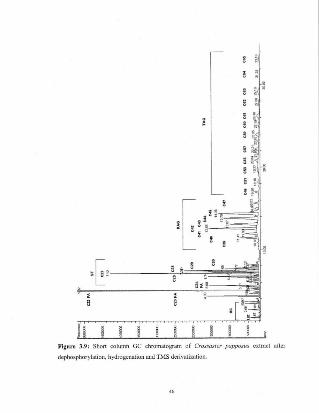
Figure 3.9: Short column GC chromatogram of Crossaster P(jpposus extracl after
dephosphorylation, hydrogenation and TMS derivatization.
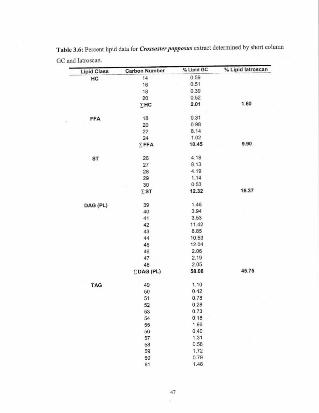
Table 3.6: Percent lipid dala for Crossaster PUpPO,\'US extract determined by shon column
GC and !atroscan.
LlpldClilSS Carbon Number %LlpldGC % L.lpld latrosean
HC 14 0.5916 0.5116 0.3920 0.52
EHC 2.01 1.0.
FFA 16 0.312. 0.9622 8.1424 1.02
rFFA 10.45 '.90
5T 26 4.1827 8.1326 4.19
29 1.14
30 0.53rST 12.32 16.37
OAG(Pl) 3. 1.4640 3.9441 3.5342 11.4243 8.8544 10.5345 12.0446 2.0647 2,1946 2.05
rDAG(PL.} 58.08 45.75
TAG 4' 1.1050 0.4251 0,7852 0,2853 0.7354 0.1855 1.9656 0.4057 1,3155 0.5859 1.7260 0.7961 1.48

62636465
nAG
3.6.1I>etcrminalion ofelhylcstcrs in rotifers
48
0.691.330.510.9014.04 16.89

long chain PUFA such as DHA and EPA are essential fatty acids in lhe early
growth, survival and lipid composition of many larval fish (Copeman el al. 2002). In the
aquacuhure of fish, live-foods lhal are commonly used as feed for larval fish include
rotifers and Artemia sp. However. both of these live-feeds are naturally low in long chain
PUFA. which again are inlponant in larval fish nutrition. Therefore, rotifers and Anemia
grown as larval fish food ingest feed that is enriched with PUFA·rich commercial
products such as Algamac in order to increase their nutritional value for consumption by
the cultured animal. Other feed enrichments include lsochrysis ga/bana (T·lso), though
not rich in PUFA, does improve the nutritional benefits of the Jive feed for the larval fish.
The lipid levels of live feed can be analyzed by [atroscan to help detennine their
nutritional value. However, latroscan analysis of rotifers by the Parrish lab has shown
difficulty in con.fi.nning the identity of a peak that elutes al the position of an ethyl ester
of PUFA. All three samples contain the same lipid classes (HC. TAG. FFA, ST. some
AMPL and PL). as well the unidentified peale which appears at 7 em. Further allernpls at
identification of the~ in Parrish lab included co-spotting with standards of fatty acid
methyl ester (ME). ketone (KET) and fatty acid ethyl ester (EE) 10 determine if the peak
will co-elute with either of these standards. The unidentified peak elutes before bolh KET
and ME however the peak only co·elutes with the EE in some samples but not in others.
The short column GC method was used to confinn the identity of the peak.
The three samples all contained C20 FFA, en FFA in high amounts and also C24
FFA in smaller amounts. These chromatograms are shown in Figure 3.10 A to C shows
the short column GC chromatograms of rotifers that are (A) uncnrichcd, (B) enriched
with Aigamac and (C) enriched with I. galbana. Ethyl esters were the peaks Ihat were

tentatively identified as C22 EE. and C24 EE. Only qualitative data was obtained, since
the EE peaks were identified by mathematical interpolation. Standards of CIS and C20
EE were used to predict the retention times of the C22 and C24 EE. The presence of these
ethyl esters may be due to the rotifer feed, which may have some of its rich PUFA in
ethyl ester form. Further lipid analysis of the rotifer feed may confirm this.
The ST region of the chromatograms (C26 to C29 5T) is interesting as well since
there seems to be an extra peak between C28 and C29 sterol in the enriched rotifers. It is
possible that this compound may be A.>\1PL, specifically a C28 or C29 monoacylglycerol.
In addition the peak found just before the C27 ST peak may be- underivatizcd C27 ST.
However, if this were the case then it would be expected that the other 8T peaks would
also show signs of underivatized sterol. Coupling the short column GC method with mass
spectrometric detection would be useful 10 detennine the true identity of these
compounds.
50

Figure 3.10 A: Partial chromatogram of unenrichcd rotifer extmct after
dephosphorylation, hydrogenation and TMS derivatization.
51
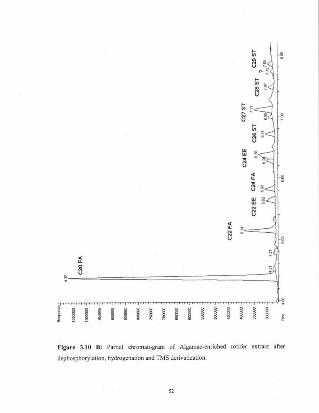
Figure 3.10 B: Partial chromatogram of Algamac-cnrlched rotifer extract aftcr
dephosphorylation, hydrogenation and TMS derlvatizalion.

Figure 3.9 C: Panial GC chromatogram of I. ga/bana cnriched rolifer eXlract aftcr
dephosphorylation, hydrogenation and TMS denvalizalion.
53

3.6.2 Delermination orwu esters in tbe copepod CQIQRUS hyperborells
Wax esters can be found in many types of marine organisms such as copepods,
decapods, euphausiids, mysids, chllelonaths, squid and several fish (Lee, Hirola, 1973).
Wax esters are an imponant energy reserve for copepods, which are the dominant prey
for many species of marine larvae in the wild. In higher latitudes, copcpods have been
found to contain greater thon 80% of their lipids as WE (Kattner & Krause, 1987). Using
Chromarods (in Iatroscan TLC-FID) for analysis or tOlal lipid profiles, it is difficult to
resolve SE peaks and WE peaks. yet there are sometimes two peaks in the WEISE region.
An example comes from the work or Stevens (personal communication) where two peaks
where detennined by latroscan, Icntatively identified as wax ester I and wax ester 2.
Funher confinnation of the identities of these peaks was necessary to detennine the true
amount of wax ester in the extract. The latroscan chromatogram in Figure 3.11 shows the
two peaks, labeled WEI and WE2. the identities of which had several possibilities. The
two peaks could have been Sf, WE or a combination of the two lipid classes. This shon
column GC method was used to identify the lipid class composition and carbon nwnber
distribution of the copepod lipid extract, as well as illustrate the importance and influence
of hydrogenation. The sample provided by Slevens consisted of extract from 48
copepods; the WE component isolated using the method ofOhman (1997). Assuming the
two peaks were WE, an Ialroscan used to detennine that the concentration of the WE lipid
class found 1.16 gfL in the eXIl"olct.
Figure 3.12 shows II GC chromatogram of the hydrogenated copepod eXlract. The
retention times of interest fall between 7 and 13.5 minutes, which is the range ror wax
estcr compounds. Peaks at 7.28, 7.99, 8.71, 9.41,10.18, lUI, 12.22 and 13.44 min arc

the even earbon numbered WE from C30 through C44 (see Table 3.1). These even
carbon-numbered wax esters are the major peaks, and there are trace amounts of odd
carbon-numbered wax esters in between each major peak. One small SE peak eluted at
14.77 minutes, which was C43 SE or quite possibly the same eompound used in the
standard, eholesteryl palmilate. These chromatographic results show that the peaks WEI
and WE2 observed in the latroscan chromatogram were 97.90/0 WE by peak area. Using
WE standards, quantitation of the peaks of interest gave a concentration of 999 mg/l of
WE and 2\.9 rngfL of SE. Based on Iatroscart results, 88.3% recovery of SE and WE
compounds after the hydrogenation procedure was indicated As mentioned in Section 3.2
and demonstrated here, hydrogenation permits a strnightforward detennination of the
lipid compounds in the sample ..vith this method. There is no confusion of compound
identity due to unsaturation, as compounds elute by caIbon number within their class.

AMPL Pl. ~21.3~
,.s~
Figure 3.11: latroscan chromatogram of Calanus hyperboreus, indicating the two
unknown WE pellks, WEI and WE2.
"

Figure 3.12: Panial GC chromatogram of hydrogenated C"/OIlUS nyperborclIs after
hydrogenation, and TMS dcrivatization.
"

4 CONCLUSIONS
4.1 Conclusions
Analysis of lipids is a very infonnative way of dClcnnining the physiological stale
of a marine ecosystem. Lipids can give insight into the nutritional value of various feeds
in aquacullurc. as well as tbe prey that an animal may ingest in tbe wild. The lipids of:m
animal give imponant details about ilS own health lIIld nutritional stale. The infannalion
derived from lipid analysis is very important to researchers in fields such as aquaculture
and biological research. Moniloring of lipid data can ensure thai the animals they are
studying are as healthy as possible.
The short column GC method is an effective method for analyzing lipid classes.
Like the latroscan, me GC method collects data about what lipid classes are present and
their quantities, however additional infonnation about the compounds within those
classes can be obtained. Combined with hydrogenation of lipids, the resulting
chromatographic separation is based primarily on functional groups, carbon number. The
shon column and a wide-ranging GC temperature program allows for such a mixture of
different compounds including high boiling point compounds to be sepamtc<! effectively.
However, polar lipid classes such as the AMPL and PL are retained on the GC column
and therefore require chemical modification before GC analysis. This project has
investigated an enzymatic hydrolysis (dephosphorylation) of the PL compounds, cleaving
them to their non-polar DAG moieties that can be readily analyzed by the short column
GC method after TMS derivatization. Improvement in overall recovery of lipid after the
dephosphorylation and hydrogenation procedures is desired in order to optimize the
58

overalt recovery of the method. Total lipid class data obtained by the short column GC
method was on the same level as that of the latroscan, as shown by the comparison of
percent marine lipid class data obtained by both methods in Section 3.5. However, the
short column GC method is also able to provide infonnation outside the limits of the
lalToscan. In Section 3.6, peaks thaI were difficult to identify and char'acterizc by
lalroscan wcrc easily identified by short column GC.
Previously, this short column GC method for marine lipid samples was restricted
to the neutral lipids. Now one of the polar lipid classes, PL, can be readily analyzed.
Phospholipids can now be added as a new lipid class to Yang's neutral lipid profiling
method (1996). More information can now be obtained about both the carbon number
patterns in marine derived samples. and the physiological and environmental condition of
various marine species.
4.2 Future work
This short column GC method allows for profiling of all lipid classes with thc
exception of AMPL. These compounds would be retained on the GC column. rendering
the column useless over time with a sufficient amount of these polar compounds injected.
AMPL includes a number of different compounds, some of which include MAG and
glycolipids. Quantitative MAG data can be detennined by this method. upon TMS
dcrivatization of the two free OH groups of the compound. However, glycolipids are
more similar to PL in tenns of their polar structurc. They contain a head grOllp, which
may he removed with an appropriate enzyme such as ,8-galaclosidase (Sigma), in similar
fashion to the dephosphorylation procedure. Development of a such method for achieving
59

this result would allow for an almost full lipid profile of samples, regardless of AMPL
concentration. Another class of compounds that need to be addressed is the pigments,
such as plant chlorophyll. Pigments also pose a similar problem as the AMPL, in that they
tend to retain on the short column. They clute along with AMPL on the latroscan, and arc
usually quantitated as such. A method of dealing with the pigments will be required to
develop a "universal" short column GC method for marine lipid profiling. A guard
column may be a temporary solution to these problems, as the harmful AMPL and
pigment fraction would remain on the guard column. Once the guard column was
rendered useless, it could be replaced and the analytical column could continue to be used
for an extended period of time. Interference and the risk of significantly shortcning the
lifetime of the short column could be eliminated.
Glyceryl ethers are also a lipid class that should be addressed in future work.
While not a lipid class that is common in all samples, the [atroscan can sometimes detC(;t
these eluting close to TAG. Similar in structure to TAG, with an ether group instcad of an
acyl group, these glyccryl cthers would be expected to elute close to TAG on the GC as
well. To accommodate the separation of these compounds, varying the tempcrature
program in the TAG region may aid in separating thcsc compounds more efficiently.
Combining this method with mass spectrometric detection would be an interesting
step in furthering the applicability of this method. Confirmation of peaks would thus be
performed, especially for peaks that elute closely. This would make the short column GC
method a very powerful tool in marine lipid research.
60

REFERENCES
Brown l.A. Status of new candidate finfish species for marine aquaculture inNewfoundland. In: Seafood in Heath and Nutrition (Ed. F. Shahidi), ScienceTechPublishing, St. John's, Canada, 2000, pp. 435-448.
Brown lA, Helm M. and Moir J. (Ed. AD. Boghen), New-candidate species foraquaculture. In: Cold-water Aquuelii/Ilre in AI/antic Canada (Ed. AD. Boghen) TheCanadian institute for research on regional development, Sackville, Canada, 1995, PP341·362.
Copeman L.A., Parrish c.c., Brown l.A, Harel M. Effects of docosahexaenoic,eicosapentaenoic, and arachidonic acids of the early growth, survival, lipid compositionand pigmentation of yellowtail flounder (Limam'a ferruginca): a live food enrichmentexperiment Aquaculture 210: 285-304 (2002).
Copeman, L.A. Lipid nutrition during early development of yellowtail flounder (Limandafcnuginea). M.Sc. thesis. Memorial University of Newfoundland, 51. John's,Newfoundland, Canada. 138 p. (2001).
Evans R., Parrish C., Brown J., Davis P. Biochemical composition of eggs from repeatand first-time spawning captive Atlantic halibut. Aquaculture 139: 139-149 (1996).
Folch, J., Lees, M., and Stanley, G.H.$. A simple method for the isolation andpurification of total lipids from animal tissues. 1. BioI. Chem. 226: 497·509 (1957).
Gurr M.I. and James A.T. Lipid Biogeochemistry: An Introduction, Cornell UniversityPress, Ithaca, New York, 1971, pp. 125-148.
Hudson E.O., Parrish C.c., Helleur RJ. Biogeochemistry of sterols in plankton, settlingparticles and recent sediments in a cold ocean ecosystem (Trinity Bay, Newfoundland).Marine Chemislry 76: 253·270 (2001).
Kattner G., and Krause M. Changes in lipids during the development of Cahmllsfinmarchicus 5.1. from copepodid Ito adult. Marine Biology 96: 511-518 (1987).
Lee R.F., Hirota 1. Wax esters in tropical zooplankton and nekton and the geographicaldistribution of wax esters in marine copepods. Limnology and Oceallography 18: 227-239(1973).
Lce R.F., Nevenzcl J.e., Paffcnhifer G.A. Importance of wax esters and other lipids in themarine food chain phytoplankton and copepods. Marine Biology 9: 99- L08 (1971).
61

Kuksis A. Ole and HPLC of neutral glycerolipids. In: Lipid Chromatographic Analysis.T. Shibamoto (cd), Marcel Dekker, New York, 1994, pr. 177-222.
Kuksis A., Myher JJ and Marai L. Lipid methooo!ogy - chromatography and beyond.Part I. GelMS and LCIMS ofglycerolpids. 1. Am. Oil Chern. Soc. 61: 1582-1589 (1984).
Kuksis A., Myher 1., Maral L., Geher K. Detennination of plasma lipid profiles byautomated gas chromatography and computerized data analysis. Joumaf ofChromatographic Science 13: 423 - 430 (1975).
Kuksis A., Marai L. and Gomall D.A. Direct gas chromatographic examination of tolallipid extracts. J. Lipidres. 8: 352-358(1967).
Mares P. High temperature capillary gas liquid chromatography of triacylglycerols andother intact lipids. Prog: Lipid Res. 27: 107·133 (1988).
Myher, J.1., Kuksis, A. Detennination of plasma total lipid profiles by capillary gas-liquidchromatography. Journal ofBiochemical an(l Biophysical Methods 10: 13-23 (1984).
Ohman M.D. On Ihe detennination of zooplankton lipid content and the occurrence ofgelatinous copepods. Jor/rnal ofPlankJOll Rese{jrch 19: 1235-1250 (1997).
Parrish, c.c. Dissolved and particulate marine lipid classes: a review. Marine Chemistry'23: 17-40(1988).
Parrish C. C. Separation of aquatic lipid classes by Chromarod this-layer chromatographywith measurement by Iatroscan flame ionization detection. Can. 1. Fish Aqu(/I. Sci. 44:722-731 (1987).
Pazos AJ., Roman G., Acosta C.P., Sanchez lL., Abad M. Lipid classes and fally acidcomposition in the female gonad of Pecten maximus in relation to reproductive cycle andenvironmental variables. Compo Biochem. Physiol. 117B: 393-402 (1997).
Sargent, J.R., FalkPetersell, I.B. and Calder, A.G. Fatly acid compositions of neutralglycerides from the ovaries of the asteroids Clenodiscus crispatus, Asterias lincki andPteraster militaris from Balsfjorden, Northern Norway. Marine Biology, 72, 257-264(1983).
Shantha N.C. Thin layer chromatography-flame ionization detector Iatroscan system.Journal ofChromatography. 624: 21-36 (1992).
Shulka V.K S. Recent advances in the HPLC of lipids. Prog. Lipid Res. 27: 5-38 (1988).
Skoog D.A., Holler F.1., Nieman T.A. Principles of InstrumenIal Analysis, 5t~ edition,Saunders College Publishing, Philadelphia, 1998, pp. 733- 739
62

Tvrzicka E. and Mares P. Some limitations or plasma lipid analysis in clinical research bythin layer chromatography with flame-ionization detection. Journal of Chrommography.
530: 424·431 (1990).
Venkatcsan M.I. and Kaplan LR. The lipid geochemistry or Antarctic marine sediments:Bransfield Strait. Marine Chemistry 21: 347-375 (1987).
Volkman J.K., Jell"Tey S.w., Nichols P.O., Rogers G.I. and Garland C.D. Fatly acid andlipid composition or 10 species or microalgae usw in mariculture. J. Exp. Mar. Bio/.Eco/. 128: 219-240 (1989).
Yang Z.. Parrish C., Helleur R.. Automated gas chromatographic method ror neutral lipidcarbon number profiles in marine samples. Journal ofChromatographic Science 34: 556
568(1996).
63
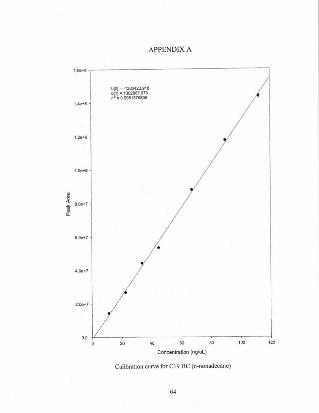
APPENDIX A
blOl-·1380423.918b!11-1J02867.0711'·.O.9961316e96
Concenlration(ngluL)
Calibration curve for Cl9 He (n+nonadecane)
64

b(OJ-.138(W23.918b(lj_1302861.0791·_O.a!l81316898
Concenlration(ngluL)
Calibmtion curve for C16 KET (3-hexadceanone)
65

Concentration (ngluL)
Calibration curve for C44 WE (behenic acid behcllyl ester)
66

b(OJ-·2359387.596b111_992307.3016"_0.9978922394
/Coocentriltion(nglul)
Calibration curve for C43 SE (choJesteryl palmitate)
67

b[OI-·I.(94302.393b[11-922833.6902,·-O.99!l5S95949
/Concentration (ngluL)
Calibration curve ofC47 $E (cholestcryl archidale)
68

Concenlralion(ng/uL)
Calibration cUlVe for C27 5T-TM5 (cholesterol)
69

b(OI-·235S387.596
~I!~=~
Concel'ltratlon(ngluL)
Calibration curve orC48 TAG (tripalmitin)
70
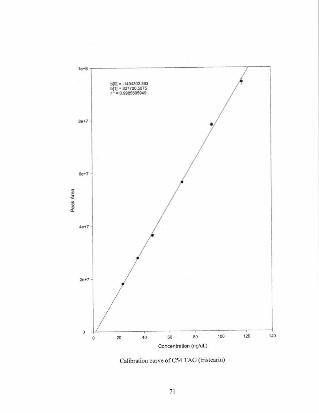
bIOl-·1494302.393b(ll·827720~7!>
r·.O.99655\l5949
/Concentration (ngluL)
Calibration eurve ofC54 TAG (tristearin)
71

APPENDIX B
A commissioning ofa VELP Scicntifica SER 148/6 Extractor Unit for marine lipid
extraction \VIIS attempted. The YELP autoextractor perfonns extractions of organic
material in II similar fashion to a Soxhlet extractor. An appropriate solvent is chosen and
placed in a glass cup and heated on a heating block. A glass condenser apparatus is
lowered onto the cup to ronn a tight seal. A sample within a cellulose·paper cone is
lowered into the boiling solvent Solvent vapour rises up the glass tube and is sent back
down over the sample by the water-cooled condenser. thus maintaining the level of
solvent in the solvent cup. After a sufficient amount of time, the sample is raised OUI of
the boiling solvent and the condensed soh'cnl pours over the sample to wash any lipid
residue into the glass cup. The condensed solvent is then collected, thus concentrating the
final extr:leted material to a volume suitable for transfer \0 a sample vial.
Several problems were observed with the YELP autoextraetor. Ideally, six
samples should be able to be extracted simultancously, all of which are heated by a single
heating block. However, uniform heating could not be maintained across the cl1lire block.
Uneven heating of six replicate samples would result in variations in the amounlS of
extract obtained from each of the six samples. The problem could not be repaired
therefore the manufacturer was contacted to replace the block. However, the most
significant problem in using the YELP autoextractor involved the O-rings used to make a
tight seal between the condensing apparatus and the glass cup containing the solvent. In
lipid extraction. a common solvent used is chlorofonn or chlorofonn mixtures with other
72

solvents (Forch et ai, 1957). The O-rings provided with the autoextractor were composed
of either butyl rubber or Viton. The insuumcnl manual recommended that Viton rings be
selected for seals when using chlorinated solvents. However, the Viton O-rings showed
significant breakdown upon contact with chlorofonn liquid and vapour. Reaction with the
chlorofonn produces unidentified contaminants thai could interfere with lipid data. These
contaminants would be seen visually as the solvent would become yellow after these 0
rings came in conlact with chlorofoml.
Several approaches 10 resolving this problem were attempted. A Teflon D-ring
identical in size and shape to the Vilon D-ring was constnlcted, however the material was
too rigid to properly fit inlO the O-ring bolders in the same fashion as the more flexible
Viton O-ring. A very thin Teflon ring was flexible enough to be fitled into the O-ring
holder however the seal was completely losl. Teflon rings of the correct Ihickness thai
were smaller in diameter would move around inside Ihe O-ring holder or fall out onto the
heater. The next approach to the problem was 10 wrap a Viton O-ring tightly in Teflon
tape, however chlorofonn vapour could still attack the Viton material.
A new Teflon O-ring was constructed (by the Ocean Sciences Cenl.re engineering
team) that filS into the O-ring holder, remains stationary during extraction and does not
fall if the cup was removed. The O-ring was made to sit on top of the glass, with a thin
sleeve that would fit snugly inside the cup. The O-ring was the correct thickness for a
good seal and the sleeve would ensure stability. Preparation for an extraction would
simply require puuing the O-ring on top of the rim of the glass cup, and then the
apparatus could be lowered onto cup to create the seal. Since the a-ring does llot move,
73

simply placing the cup in the correct position on the heating block ensures proper
placement. A diagram of the new O-ring is shown in Figure BI.
Once the heating and seal problems were solved, choosing of an appropriate
solvent or solvent mixture as well as optimization of the extraction procedure can now
commence. Time Iimit3tions did not allow for full optimization, which could be
petfonned by my successor on this project.
74

Teflon O-Ring(with sleeve)
Glass Sample Cup
Figure 81: New Teflon O-ring design
75