3.5 Chronology of the Air Rail Link Project
43
24 3.5 Chronology of the Air Rail Link Project In 2001, Transport Canada issued a request for Expression of Interest from the private sector to finance, design, build, operate, and maintain passenger rail service between Union Station and Pearson Airport. Four firms were pre-qualified and submitted business cases in 2003. Union Pearson AirLink Group (UPAG), owned by SNC Lavalin Engineers & Constructors, was awarded the contract that same year (Transport Canada, 2007). They decided to call the project the Blue22 after the estimated length in minutes of the trip (Figure 3.4). Figure 3.4: Initial Blue22 Route Plan Source: Transport Canada, 2007 In May 2004, the Government of Canada, Province of Ontario, and GO Transit entered into a funding agreement for upgrades to the GO network in the GTA. This included the GO’s Georgetown Corridor and the Union Station GO Corridor, which would be used by the Blue22 on its trip to Pearson. For the next few years planning, negotiations, and an environmental assessment were undertaken (Transport Canada, 2007). Concurrently, the Province was developing the MoveOntario 2020 plan and The
Transcript of 3.5 Chronology of the Air Rail Link Project

24
3.5 Chronology of the Air Rail Link Project
In 2001, Transport Canada issued a request for Expression of Interest from the
private sector to finance, design, build, operate, and maintain passenger rail service
between Union Station and Pearson Airport. Four firms were pre-qualified and submitted
business cases in 2003. Union Pearson AirLink Group (UPAG), owned by SNC Lavalin
Engineers & Constructors, was awarded the contract that same year (Transport Canada,
2007). They decided to call the project the Blue22 after the estimated length in minutes
of the trip (Figure 3.4).
Figure 3.4: Initial Blue22 Route Plan Source: Transport Canada, 2007
In May 2004, the Government of Canada, Province of Ontario, and GO Transit
entered into a funding agreement for upgrades to the GO network in the GTA. This
included the GO’s Georgetown Corridor and the Union Station GO Corridor, which
would be used by the Blue22 on its trip to Pearson. For the next few years planning,
negotiations, and an environmental assessment were undertaken (Transport Canada,
2007). Concurrently, the Province was developing the MoveOntario 2020 plan and The

25
Big Move respectively. Both of these plans included this connection as a way to relieve
congestion and provide more public transit options.
Negotiations with the private partner, SNC Lavalin, fell through in July 2010. In
a press release surrounding the negotiations, SNC Lavalin said,
Given the state of financial markets over the past few years, lenders in both Canada and elsewhere are reluctant to lend money for full revenue- risk projects. As a result an agreement that met our standards of risk tolerance could not be reached with interested lenders (SNC Lavalin, 2010). As a result, Metrolinx took over the construction, ownership, and operation of what was
now called the Air Rail Link (ARL). They have since completed an Electrification Study
for the Georgetown GO Transit rail corridor, with the ARL recommended as the first
phase (GO Transit, 2011a).
3.6 Air Rail Link (ARL) Current Project Description
The vision of the ARL has always been to develop a direct, rapid rail link between
two of the busiest transportation hubs in Canada. Although the governance structure has
changed, the key objectives of the project have remained the same: to provide rail service
between Union Station and Pearson Airport, reduce congestion while taking advantage of
existing rail corridors, and complement an existing public transit system (Borges, 2006).
The ARL will be accommodated through track sharing along GO Transit’s South
Rail Corridor (Georgetown) from Union Station to just past Highway-427 (Figure 3.5).
A 3.3 kilometre spur line will then connect to Pearson (Figure 3.6). In this case, the spur
line is a line constructed to connect the main line to another destination (Pearson

26
Airport). After leaving Union Station, the ARL will stop at the Bloor and Weston GO
stations before proceeding to Terminal 1 at Pearson Airport (GO Transit, 2011a). 140
two-car rail shuttles will make the trip approximately every 15 minutes for 20 hours a
day, carrying as many as 5000 passengers per day within the first five years of operation
(Mackenzie, 2010). It is hoped that the ARL will be complete and operational in time for
the 2015 Pan Am Games (GO Transit, 2011a).
Figure 3.5: Map of Air Rail Link Project Route Source: McNeil, 2010

27
Figure 3.6: Air Rail Link Spur Line Source: McNeil, 2010
28
CHAPTER 4: EVALUATION & ANALYSIS In order to determine if the ARL, as it is currently designed, is an example of a
“good” airport rail link, the plan will be evaluated using the aforementioned criteria. This
list of criteria serves to identify design characteristics that promote the use of such airport
rail links. After investigating the extent to which the ARL meets or does not meet the
criteria, Table 4.2 provides a summary of its performance. Strengths and weaknesses
identified within this evaluation will be used to inform the development of policy
recommendations that may serve to promote ridership.
4.1 Evaluation of the Air Rail Link Project
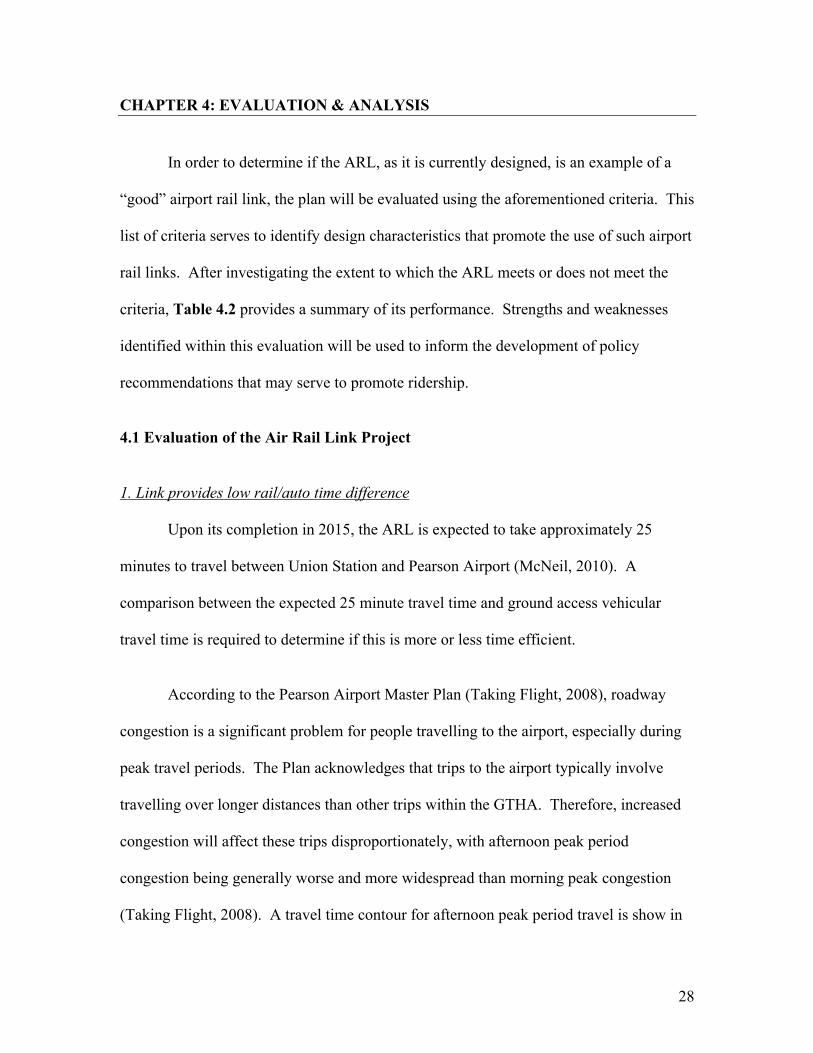
1. Link provides low rail/auto time difference Upon its completion in 2015, the ARL is expected to take approximately 25
minutes to travel between Union Station and Pearson Airport (McNeil, 2010). A
comparison between the expected 25 minute travel time and ground access vehicular
travel time is required to determine if this is more or less time efficient.
According to the Pearson Airport Master Plan (Taking Flight, 2008), roadway
congestion is a significant problem for people travelling to the airport, especially during
peak travel periods. The Plan acknowledges that trips to the airport typically involve
travelling over longer distances than other trips within the GTHA. Therefore, increased
congestion will affect these trips disproportionately, with afternoon peak period
congestion being generally worse and more widespread than morning peak congestion
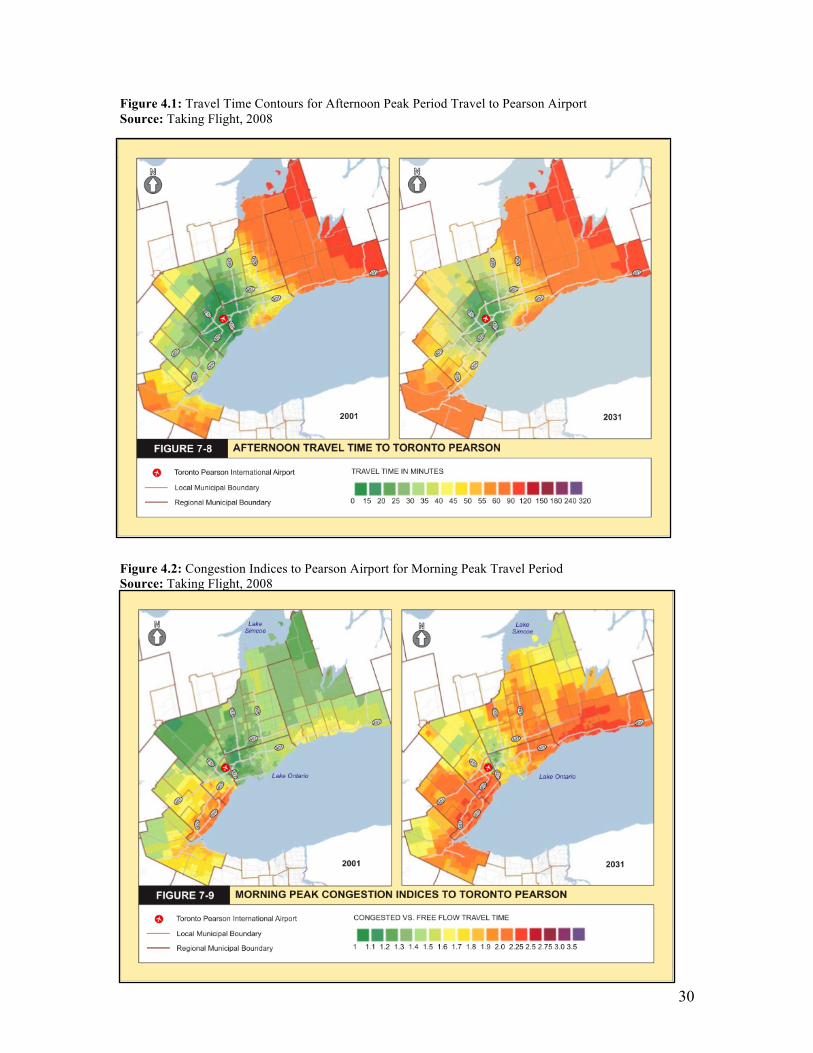
(Taking Flight, 2008). A travel time contour for afternoon peak period travel is show in

29
Figure 4.1, while Figure 4.2 shows the projected change in congestion indices for
morning peak period travel. The congestion index, shown in Figure 4.2, is the ratio of
congested travel time to free-flow travel time. Figure 4.3 shows that during morning
peak period traffic, 51% of the GTHA population is within a 30-minute drive of the
airport. Considering this criterion, the approximate 25 minute ARL travel time would
present an ideal alternative for those 51% (during morning peak travel). This percentage
however is projected to drop to 29% by 2031, meaning that more of the population will
have a longer drive to get to the airport. Given these projections, The Greater Toronto
Airports Authority recognizes the need for a greater emphasis on encouraging the use of
public transit as an alternative (Taking Flight, 2008). The ARL’s 25-minute travel time
may just be the answer.
Comparing the time efficiency of the ARL with ground access vehicles requires
thinking more than just about the ARL in isolation. On its own, the ARL clearly
produces a more consistent and time efficient alternative to driving. It is important to
note however, that unlike personal vehicles and taxis, the ARL does not represent a door-
to-door trip. This means that many passengers will likely have to utilize other modes of
transportation in order to access the ARL or get home after taking it, ultimately adding
time to their trip.
30
Figure 4.1: Travel Time Contours for Afternoon Peak Period Travel to Pearson Airport Source: Taking Flight, 2008 Figure 4.2: Congestion Indices to Pearson Airport for Morning Peak Travel Period Source: Taking Flight, 2008

31
Figure 4.3: Accessibility to Toronto Pearson During the Morning Peak Period Source: Taking Flight, 2008 2. Station is located on-airport rather than off As indicated within the project description, the ARL will have four stations,
Union, Bloor, Weston, and Pearson (Figure 3.5), with a spur line connecting to the top of
the Terminal 1 airport-parking garage. The Terminal 1 ARL station will share a platform
with the airport’s existing LINK Train, an automated people mover, representing a
seamless connection to the other Terminals (Briginshaw, 2005). This configuration
provides direct access to the airport and satisfies Schank’s (1999) observation that rail
mode share increases if there is an on-airport station.
3. Link effectively serves population and employment centres The ARL will directly connect to Toronto’s Central Business District. From
Union Station there are various connections, by way of the TTC, VIA Rail or GO Transit,
which serve the suburban and regional areas outside of the City of Toronto. TTC service

32
claims to reach a significant proportion of the population, stating that it is able to provide
service within a 5 to 7 minute walk to most areas within Toronto, excluding the GTA
(TTC, 2011). Although the ARL has the ability to reach a significant proportion of
regional population through connecting transit offerings, its accessibility for urban and
suburban Torontonians is lacking. Timing and route constraints may make these options
inconvenient for airport passengers, resulting in preference for personal vehicles.
4. Airport has a prevalence of short haul traffic and/or low-cost carriers Ranking among the world’s top 30 airports in terms of aircraft movement,
Pearson Airport is Canada’s principle airport (Taking Flight, 2008). Over 65 airlines
operate out of its three terminals. Figure 4.4 shows the distribution of domestic,
transborder, and international destinations served. Domestic flights are those within
Canada, Transborder are flights from Canada to the United States, while International
flights are those from Canada to destinations outside of the United States (Greater
Toronto Airports Authority, 2009). Table 4.1 shows the number of passengers who
traveled in these three segments in 2008 and 2009.
Although international flights account for over 50% of the total destinations
served by Pearson, the combination of transborder and domestic destinations make up the
other half. More telling however are of the number of passengers traveling to these
destinations. While international flights attracted 30% and 32% of all passengers in 2008
and 2009 respectively, the combination of domestic and transborder flights appear to be
the most popular. These attracted over 65% of all passengers in both 2008 and 2009
(Table 4.1).

33
Figure 4.4: Distribution of Flight Destinations from Pearson Source: Greater Toronto Airports Authority, 2009
Table 4.1: Number of Passengers Based on Type of Flight (in millions) Source: Greater Toronto Airports Authority, 2009 2009 % 2008 % Domestic 12.7 42 13.8 43 Transborder 8.1 26 8.8 27 International 9.6 32 9.7 30 Total 30.4 100 32.3 100 In order to evaluate this information against Schank’s (1999) criterion it must be
determined if domestic and transborder flights are indeed short-haul flights. The
definition of short-haul flights used for this investigation is taken from McIntosh et al.
(1998) and is described as flights lasting less than five hours. Figures 4.5 and 4.6
illustrate the number of destinations that fall within certain flight times. The source data
for this analysis is broken down by distance from Pearson to the destination as well as by
flight time and can be found in Appendix B. Using McIntosh et al.’s (1998) definition,
every domestic and transborder flight out of Pearson Airport can be considered short-
16.6%
29% 54.4%
Domestic
Transborder
International

34
haul. It can therefore be concluded that Pearson not only has a prevalence of short-haul
flights, but also that the majority of passengers are taking these flights.
Figure 4.5: Approximate Domestic Flight Times Source: Flight Network, 2011
Figure 4.6: Approximate Transborder Flight Times Source: Flight Network, 2011
0
1
2
3
4
5
6
7
8
9
10
0-0.9 1-1.9 2-2.9 3-3.9 4-4.9
Num
ber
of D
omes
tic D
estin
atio
ns
Approximate Flight TIme (hours)
0
2
4
6
8
10
12
14
0-0.9 1-1.9 2-2.9 3-3.9 4-4.9
Num
ber
of T
rans
bord
er D
estin
atio
ns
Approximate Flight Time (hours)

35
In addition to the prevalence of short haul flights, this criterion considers the
availability of low cost carriers as possibly contributing to the choice to use an airport rail
link. Schank (1999) attributes this to their ability to attract cost sensitive travelers, who
may be more willing to switch to public transit for their access mode. Pearson Airport
offers low-cost carriers such as WestJet, Sunwing Airlines, Air Transat, Delta, and
CanJet (Greater Toronto Airports Authority, 2011).
5. Airport is located close to downtown and other major trip generators Pearson Airport is located in Mississauga, Ontario, adjacent to the City of Toronto
(Figure 4.7). The distance between Pearson Airport and downtown Toronto is
approximately 27 kilometres, locating it a significant distance away (Greater Toronto
Airports Authority, 2009). In developing this criterion, Schank (1999) investigated the
relationship between the distances between airports and their city’s Central Business
District (CBD) and percentage of mode share. The results indicate that higher mode
share occurred most often when the airports were located less than 20 kilometres from the
CBD. This suggests that Pearson’s location may not be conducive to attracting large
numbers of passengers.
Figure 4.7: Location of Pearson Airport and Downtown Toronto Source: Google Maps, 2011

36
With respect to its distance from other major trip generators, Pearson is situated in
a less than desirable position. Figure 4.8 illustrates that the airport has significant
vehicular network accessibility by being close to Highway-401, Highway-427, and
Highway-407. This however isolates it from other major trip generators, especially those
that would promote use of public transit. Metrolinx (2008) recognizes this deficiency and
has outlined possible solutions within its Regional Transportation Plan, The Big Move.
These initiatives are illustrated in Figure 4.9 and include the ARL (Note that labels
without “hwy” are the public transit options).
Figure 4.8: Highway Access to Pearson Airport Source: Google Maps, 2011

37
Figure 4.9: Metrolinx Plans for Connections to Pearson Airport Source: Metrolinx, 2008 6. Link has high service frequency According to Eichinger and Knorr (2009), frequency is one of the most important
determinants of demand for passenger rail service and goes hand-in-hand with service
reliability. It is expected that the ARL will provide service every 15 minutes and will
operate 20 hours per day. Two European examples with high mode shares, Heathrow and
Oslo, run every 15 and 10 minutes respectively (Heathrow Express, 2011; Visit Oslo,
2011). The Canada Line in Vancouver has shifting frequencies throughout the day, but
averages a frequency of every 13 minutes (Translink, 2011). This puts the planned
frequency of the ARL on par with some of the most successful air rail links in the world.

38
7. Link is part of a modern, well-designed rail system For the purpose of this investigation, this criterion is extended to include the
entire public transit system. When conceived, the City of Toronto’s public transit system
was well designed and modern, now recognized by many as a rare example in North
America (Kennedy, 2002). However, the TTC (2003) admits that over the past fifteen
years, the system has suffered reductions in the services provided. This has been the
result of increased public and government expectations for improved transit coupled with
reductions in government subsidies (TTC, 2003). For further context, Appendix C
outlines a brief history of TTC government operating and capital subsidies.
In 2010 the TTC created the Customer Service Advisory Panel (CSAP), made up
of various community stakeholders, industry professionals, and academics. CSAP was
charged with looking into areas of the TTC’s operations where customer service
deficiency existed and could be improved (TTC, 2010b). It is clear from their report that
public opinion of the TTC and community pride and connectivity is low. There appears
to be an overall negative image of public transit in Toronto, of which the subway is a
part.
Good customer service and communication, cleanliness, and modern amenities
are all aspects of a well-designed public transit system where the TTC falls short.
According to the CSAP Report, “the condition and cleanliness of collector booths and the
stations in general, has fallen below acceptable levels” (TTC, 2010b p. 17). Similarly,
there is a lack of communication during emergencies or significant system delays,
unsmooth operation of vehicles, and a low standard of amenities on TTC property. The
39
ARL will undoubted rely significantly on the wider public transit system and these
deficiencies may hinder its success at attracting passengers.
Additionally, Pearson Airport’s catchment area extends beyond just the City of
Toronto to encompass the GTHA (Greater Toronto Airports Authority, 2009). This
makes the integration of local public transit systems throughout the GTHA important. As
aforementioned, the design of these local systems is fragmented with little regional
integration and therefore inefficient for those needing to cross regional boundaries.
Schank (1999) identified airport rail links built from scratch as favourable to those
utilizing exiting infrastructure. The ARL will use exiting track for the majority of its trip.
However, these tracks are currently being upgraded in order to facilitate the ARL. The
use of existing track rather than building new may influence perception of the modernity
of the ARL, but the upgrades serve to mitigate this.
8. Link serves other areas besides downtown As aforementioned, the ARL will make two stops as it travels down the GO
Georgetown Rail Corridor, Bloor and Weston GO Stations. Currently, these stations are
in need of upgrading, especially if they are to accept new passengers via the ARL. The
Bloor GO Station is the location of a planned mobility hub for the area while the Weston
GO Station will be moved and completely reconfigured to be a full service station (GO
Transit, 2011a). With the proposed station upgrades, these stops provide linkages for
passengers to access the ARL outside of the CBD.
40
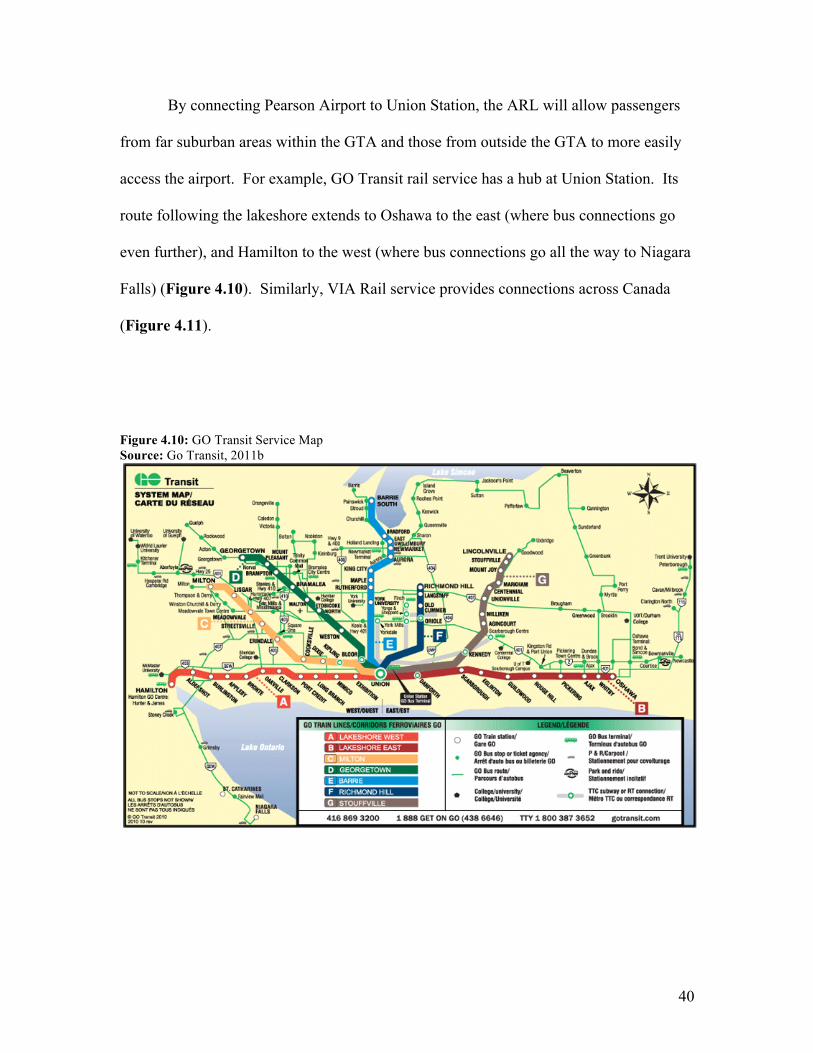
By connecting Pearson Airport to Union Station, the ARL will allow passengers
from far suburban areas within the GTA and those from outside the GTA to more easily
access the airport. For example, GO Transit rail service has a hub at Union Station. Its
route following the lakeshore extends to Oshawa to the east (where bus connections go
even further), and Hamilton to the west (where bus connections go all the way to Niagara
Falls) (Figure 4.10). Similarly, VIA Rail service provides connections across Canada
(Figure 4.11).
Figure 4.10: GO Transit Service Map Source: Go Transit, 2011b

41
Figure 4.11: VIA Rail Service Source: VIA Rail, 2011
9. Transit network works to the advantage of airport passengers By itself, the ARL works to the advantage of airport passengers. Some initiatives
included in the plan are on-board information panels displaying updates on flights and
departure gates, a welcoming area at Union Station with a waiting lounge and other
premium services, and exclusive use of the west end Platform 1 at Union Station, which
provides the best possible access from the Great Hall. Although passengers will not be
able to check in their baggage at Union Station, they will be able to collect their airline
boarding passes (Briginshaw, 2005).
Unfortunately, the same cannot be said about connecting public transit options.
The subway and bus systems in Toronto are not favorable to airport travelers. Traveling
throughout the system with large baggage, as the author has done numerous times, is
quite inconvenient. Elevators and escalators are often not working, peak flows of people
make moving a large bag difficult because of lack of room, and information on where to
store baggage or flight information is non-existent.

42
4.2 Summary of Evaluation
Table 4.2: Summary of Evaluation of the ARL Project Criteria Evaluation 1. Link provides low rail/auto time difference
2. Station located on-airport rather than off
3. Link effectively serves population and employment centres
4. Airport has a prevalence of short haul traffic and/or low-cost carriers
5. Airport is located close to downtown and other major trip generators
6. Link has high service frequency
7. Link is part of a modern, well-designed rail system
8. Link serves other areas besides downtown
9. Transit network works to the advantage of airport passengers
Legend = Meets or exceeds criteria = Somewhat meets criteria = Does not meet criteria
43
CHAPTER 5: CONCLUSIONS AND RECOMMENDATIONS From the proceeding evaluation, it is clear that the ARL will be a modern and
efficient alternative to driving to the airport and represents a “good” airport rail link.
This is illustrated by its ability to meet or exceed criteria that deal with the link itself or
airport services. However, when considered as a part of a wider public transit system,
locally and regionally, weaknesses become pronounced. For example, the ARL is not
part of a transit system that prioritizes airport passengers and it only somewhat serves
other areas besides downtown. The following five recommendations are therefore
intended to inform its context within the wider public transit system and provide
strategies that may help Metrolinx realize the goals and expected results of the plan.
1. Create direct connections, via buses and light rail transit (LRT), from Bloor and Weston GO Stations to major employment and population centres throughout the region The ARL plan was found to only somewhat meet the criterion evaluating its
capacity to effectively serve major employment and population centres within the GTHA
and other areas besides the downtown. There is however, opportunity to directly connect
the ARL stops at Bloor and Weston to major employment and population centres
throughout the region. This is especially true at the Bloor GO Station, as Metrolinx is
currently planning on converting this station into a “mobility hub” (GO Transit, 2011a).
According to the Mobility Hub Guidelines, released by Metrolinx (2011), part of the
purpose a mobility hub is to provide a centre for multimodal transportation. This would
provide the infrastructure for bus or LRT connections throughout the region.

44
The announcement of Toronto’s new transportation plan (Figure 5.1), provides
further motivation to increase these connections as it will bring an LRT line (Eglinton –
shown in blue on Figure 5.1) that much closer to the ARL. Currently, the only
connection point between the ARL and the wider regional public transit system is at
Union Station. Therefore, passengers must first get to Union Station or drive to Bloor or
Weston Stations and then board the ARL. Creating more public transit access options
that begin at population and employment hubs around the region may encourage
ridership.
Figure 5.1: Transportation Toronto Plan Source: City of Toronto, 2011

45
2. Consider and plan for future extensions of the ARL Similar to the above recommendation, planning for possible extensions of the
ARL is prudent when considering its ability to service areas outside the downtown.
Although the ARL will make two stops on its way to Pearson, the plan neglects possible
connections to the west, placing the focus on downtown Toronto. Putting in policies and
alternative plans that consider western expansion of the link may serve to save money
and time in the future, especially as employment and population centres throughout the
GTHA shift and grow.
3. Rebrand public transit in the region A key suggestion from the TTC’s CSAP Report is that the TTC should focus on
improving its image into one that the public can be proud of (TTC, 2010b). This should
be extended to involve branding the regional public transit system. This however, is
difficult with the presence of so many local service providers. Through The Big Move,
Metrolinx (2008) has begun the “regional branding” process from the top down. Now,
local service providers, such as the TTC, need to incorporate more regional thinking and
language, which includes the ARL, into their transit materials and publications.
4. Include the ARL into the PRESTO integrated fare card system By including the ARL within the PRESTO integrated fare card system, Metrolinx
can create a seamless transition from local providers to the ARL. It will allow those who
use the airport to swipe their card when they enter the public transit system and not worry
about having extra change at every regional border crossing or upon boarding the ARL.
Admittedly, these benefits are targeted to those who frequently use the airport, such as

46
business travelers. Making their trip convenient, via the PRESTO card, may influence
more to choose public transit over personal vehicles.
5. Implement shared-ride service to the ARL station stops Shared-ride programs allow two or more riders with different origins and/or
destinations to share a taxi ride (Suen et al., 1981). Potential perks for travelers include a
higher level of service than public transit, with lower fares than conventional taxis (Suen
et al., 1981). A program like this, exclusively serving the ARL station stops, provides an
alternative for those who are unable or unwilling to use public transit. Much like creating
bus and LRT connections, a shared-ride program would increase the catchment area of
the ARL.
47
CHAPTER 6: FURTHER RESEARCH
1. Impact of Airport Employees
The scope of this report was reserved to fixed and design characteristics of airport
rail links. Considering that Pearson Airport is a major employment node within the
GTHA, it would be useful next step to evaluate how the ARL serves employees and how
they would make use of the ARL. It would be in the best interest of Pearson Airport,
Metrolinx, and the City of Toronto to ensure that the ARL is connected to a wider public
transportation system that accommodates the needs of the many people who work in and
around Pearson Airport.
2. Long-Term Funding Sources
In order for Metrolinx and local service providers to realize the full benefits of the
ARL, identifying alternative long-term funding sources for local service providers is a
suggested area for further research. Although not the focus of this evaluation, alternative
funding sources would allow for service quality upgrades, infrastructure development,
and targeted amenities that could support the success of the ARL.
Leading up to the Big Move, Metrolinx (2008) identified the need for the GTHA
to recapture its former reputation as a leader in North American public transit. With a
concentrated population and 75% of the region’s public transit use the City of Toronto’s
TTC, is obviously a focus in this regard (Metrolinx, 2008). As aforementioned, the
City’s public transit system is extensive and leaps and bounds ahead of other North
American cities. However, lack of investment over the last two decades and
unpredictable systems of grants and subsidies have resulted in service quality decreases

48
and the inability to expand to meet growing regional needs. This detracts from the
modernity of the system and negatively influences ridership.
In order to move past the status quo and “state-of-good-repair” operating and
capital philosophy (TTC, 2003) and create a more integrated regional system, that
includes the ARL, alternative long-term funding is required. Involving the private sector
in public transit development and operation is not novel in Canada, with both the Canada
Line in Vancouver and York VIVA utilizing P3 models. Using private sector money on
the capital side has the potential to free up subsidy contributions for operations. This
money could be used to upgrade stations, provide increased amenities, and introduce
airport passenger focused initiatives.
Additionally, consideration should also be given to road pricing and regional cost
sharing agreements as alternatives. Like P3s, road pricing is a contentious and complex
issue. In Ontario, the topic is veiled by the poor experience related to the 407 Electronic
Toll Route. With the number of commuters in the GTHA, it is worth considering various
forms of road pricing to contribute to public transit service quality upgrades and
infrastructure development, that would also support use of the ARL. Both Washington
and Vancouver are currently using toll roads as an alternative revenue source
(Metropolitan Washington Airports Authority, 2011; Translink, 2011).
Official inter-jurisdiction operating and capital cost sharing is another area that
the TTC and Metrolinx should consider to raise funds. Washington provides a key
example of regional cost sharing at its best. An interstate compact between Washington,
Maryland, and Virginia provides for cost sharing of transit operations based on fixed

49
criteria such as ridership and geographic boundaries (Metropolitan Washington Airports
Authority, 2011). Obviously, the intricacies of such agreements or how they would apply
to the ARL is a complex question; however, it should not be discounted as a potential
strategy.

50
REFERENCES Borges, H. (2006). Air rail link: Pearson Airport to Union Station. Chartered Institute of Logistics and Transport. Retrieved from http://www.gatewaycouncil.ca/downloads2/Air_Rail_Link_-CILT.pdf on January 20, 2011. Boyd, A. and Caton, J. (2001). Securing intermodal connections: meeting the challenges of rail-aviation passenger facilities. Prepared for Facility Security: Protecting Infrastructure and Special Events, Salt Lake City, Utah. Briginshaw, D. (2005). Toronto to have a private airport rail connection. International Railway Journal, Vol 45 (4): 35-36. City of Toronto. (2011). Transportation Plan Map. Retrieved from http://www.toronto.ca/mayor_ford/pdf/torontotransitplan-map.pdf on March 31, 2011 Coogan, M. (2008). Ground access to major airports by public transportation. Transportation Research Board, Report 4. Dresner, M. (2006). Leisure versus business passengers: similarities, differences, and implications. Journal of Air Transport and Management, Vol 12: 28-32. Eichinger, A., and Knorr, A. (2009). Potential and limitations of air-rail links: a short overview. Aerlines Magazine, (30): 1-3. Eisenhardt, K. (1989). Building theories from case study research. The Academy of Management Review, Vol 14 (4): 532-550. Flight Network. (2011). Retrieved from http://www.flightnetwork.com on January 16, 2011. Gosling, G. (1997). Airport ground access and intermodal interface transportation. Journal of the Transportation Research Board, Vol 1600. GO Transit. (2011a). Georgetown South Project. Retrieved from http://www.gotransit.com/gts/project/arl.aspx on January 20, 2011. GO Transit. (2011b). Schedules and Maps. Retrieved from http://www.gotransit.com/publicroot/en/schedules/sysmap.aspx on March 24, 2011 Greater Toronto Airports Authority. (2009). Smart connections. Greater Toronto Airports Authority, Annual Report, 2009. Greater Toronto Airports Authority. (2011). Airline listing. Retrieved from http://www.gtaa.com/en/travellers/airport_information/airlines_and_destina/airline_listing/ on February 20, 2011. Harvey, G. (1986). Study of airport access mode choice. Journal of Transportation Engineering, Vol 112 (5): 525-545. Heathrow Express. (2011). Frequent high speed trains from central London to Heathrow Airport. Retrieved from http://www.heathrowexpress.com/Home on March 15, 2011. Hudson, S., and Ritchie, B. (2002). Understanding the domestic market using cluster analysis: a case study of the marketing efforts of Travel Alberta. Journal of Vacation Marketing, 8 (3): 263-276. Kennedy, C. (2002). A comparison of the sustainability of public and private transportation systems: study of the Greater Toronto Area. Transportation, Vol 29: 459-493. Levinson, H. (1992). Urban mass transit systems. In: Edwards, J (ed) Transportation Planning Handbook. Prentice Hall, New Jersey, 123-174. Mandle, P., Mansel, D., and Coogan, M. (2000). Use of public transportation by airport passengers. Transportation Research Board, 79th Annual Meeting. Mackenzie, R. (2010). Air Rail Link moves forward with diesel trains. Transit Toronto Weblog, November 16, 2010. McIntosh, I., Swanson, V., Power, K., Raeside, F., and Dempster, C. (1998). Anxiety and health problems related to air travel. Journal of Travel Medicine, 5 (4): 198: 204. McNeil, G. (2010). Air rail link service Pearson to Union. Metrolinx. Retrieved from http://www.metrolinx.com/mx/en/board/20101116/6-airraillinkupdatefinal.pdf on January 21, 2011. Metrolinx. (2008). The Big Move: Transforming Transportation in the Greater Toronto and Hamilton Area. Greater Toronto Transportation Authority. Metrolinx. (2010). Air rail link service: Pearson to Union. Presented on November 16, 2010. Retrieved from http://www.metrolinx.com/mx/en/board/20101116/6-AirRailLinkUpdateFINAL.pdf on

51
January 20, 2011. Metrolinx. (2011). Mobility Hub Guidelines for the Greater Toronto and Hamilton Area. Strategic Policy and Systems Planning Group. Metropolitan Washington Airports Authority. (2011). Dulles Corridor Metrorail Project. Retrieved from http://dullesmetro.com/ on March 24, 2011. MoveOntario 2020. (2007). Retrieved from http://news.ontario.ca/opo/en/2007/06/moveontario-2020.html on February 16, 2011. Murray, A., Davis, R., Stimson, R., and Ferreira, L. (1998). Public transportation access. Transport Research Part D: Transport and Environment, Vol 3 (5): 319-328. Pearson Today. (2009). Toronto Pearson-Union Station Rail Link Update. Retrieved from http://gtaa.com/en/news/torontopearson_today/details/50377ee3-0ff4-41ce-b9be-0027417325ba on January 10, 2011. Places to Grow. (2006). Growth Plan for the Greater Golden Horseshoe. Ministry of Public Infrastructure Renewal. Prichard, J. (2010). Moving Transit Forward in the GTHS. Presentation to the Canadian Council on Public- Private Partnerships. Retrieved from http://www.pppcouncil/pdf/Prichard_05122010.pdf on February 7, 2011. Schank, J. (1999). Airport access via rail transit: what works and what doesn’t. Department of Urban Studies and Planning, Massachusetts Institute of Technology. Sharp, A. (2004). Processing of airline passengers and their baggage at off-airport bus, water and rail terminals – successful intermodal terminals. International Air Rail Organization. SNC-Lavalin. (2010). SNC-Lavalin media statement on the Toronto Air Rail Link project. Press Release, July 30, 2010. Suen, L., Ebrahim, A., and Oksenhendler, M. (1981). Computerised dispatching for shared-ride taxi operations in Canada. Transportation Planning and Technology, Vol 7 (1): 33-48. Taking Flight: The Airport Master Plan, 2008-2030. (2008). Greater Toronto Airports Authority. Transport Canada. (2007). Air-rail link from Toronto-Lester B. Pearson International Airport to Toronto Union Station. Backgrounders, Reports, and Info Sheets. Retrieved from www.tc.gc.ca on January 20, 2011. Toronto Transit Commission. (2003). Ridership Growth Strategy. Retrieved from http://www3.ttc.ca/PDF/Transit_Planning/ridership_growth_strategy_2003.pdf on January 21, 2011 Toronto Transit Commission. (2010a). A Cavalcade of Progress, 1921-1954. Retrieved from http://www3.ttc.ca/About_the_TTC/History/index.jsp on January 21, 2011. Toronto Transit Commission. (2010b). Customer Service Advisory Panel Report. Toronto Transit Commission Customer Service Advisory Panel. Toronto Transit Commission. (2011). General Information and Maps. Retrieved from http://www3.ttc.ca/Routes/General_Information/General_Information.jsp on February 7, 2011. Translink. (2011). Transit Schedules. Retrieved from http://www.translink.ca on March 24, 2011 Van Vugt, M., Meertens, R., and Lange, P. (1995). Car versus public transportation? the role of social value orientations in real-life social dilemma. Journal of Applied Social Psychology, Vol 25 (3): 258-278. VIA Rail. (2011). Trains by Region. Retrieved from http://www.viarail.ca/en/trains on March 24, 2011. Visit Oslo. (2011). Travel to/from Oslo Airport Gardermoen. Retrieved from http://www.visitoslo.com/en/transport-airport.52094.en.html on March 14, 2011.

52
APPENDICES

53
APPENDIX A: Toronto’s Public Transit System Maps

54
Figure A1: TTC System Map – Northwest Section Source: TTC, 2011

55
Figure A2: TTC System Map – North Central Section Source: TTC, 2011

56
Figure A3: TTC System Map – Northeast Section Source: TTC, 2011
57
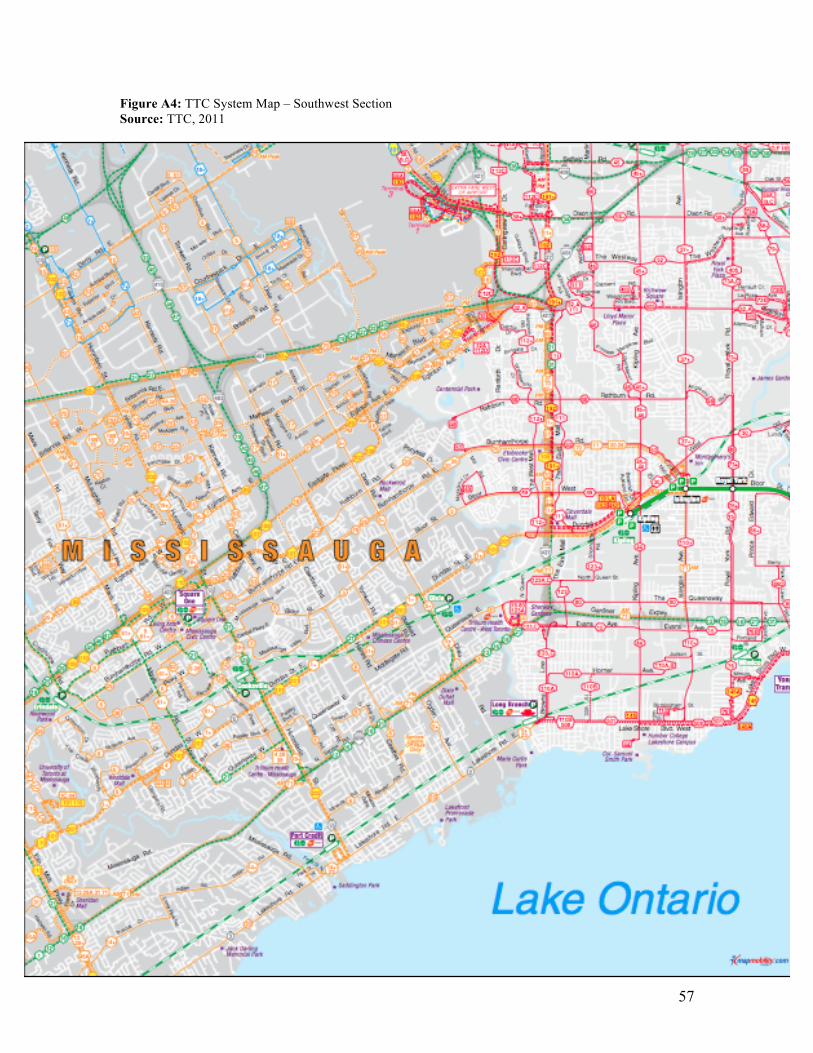
Figure A4: TTC System Map – Southwest Section Source: TTC, 2011

58
Figure A5: TTC System Map – South Central Section Source: TTC, 2011

59
Figure A6: TTC System Map – Southeast Section Source: TTC, 2011
60
APPENDIX B: Domestic and Transborder Flight Times

61
Table B1: Approximate Domestic Flight Times from Pearson Source: Flight Network, 2011 Domestic Flights Destination Distance
(km) Approximate Flight Time (hours)
Abbotsford, BC 3301 4 Calgary, AB 2710 3.5 Charlottetown, PEI 1309 2 Deer Lake, NL 1784 2.5 Edmonton, AB 2705 3.5 Fort McMurray, AB 2665 3.5 Fredericton, NB 1036 1.5 Halifax, NS 1264 1.5 Kelowna, BC 3090 4 Kingston, ON 240 .5 London, ON 168 .25 Moncton, NB 1179 1.5 Montreal, PQ 505 1.75 North Bay, ON 297 .5 Ottawa, ON 351 .5 Quebec, PQ 727 1 Regina, SK 2043 2.5 St. John, NB N/A N/A Sarnia, ON 252 .5 Saskatoon, SK 2223 3 Sault Ste. Marie, ON 504 .75 St. John’s, NL 2108 2.75 Sudbury, ON 340 .5 Sydney, NS 1532 2 Thunder Bay, ON 928 1.25 Timmins, ON 557 .75 Vancouver, BC 3358 4.25 Victoria, BC 3388 4.5 Windsor, ON 330 .5 Winnipeg, MB 1515 2

62
Figure B2: Approximate Transborder Flight Times from Pearson Source: Flight Network, 2011 Transborder Flights Destination Distance
(km) Approximately Flight Time (hours)
Albany, NY 470 .5 Allentown, PA N/A N/A Atlanta, GA 1183 1.5 Baltimore, MD 537 .75 Boston, MA 691 1 Charlotte, NC 945 1.25 Chicago O’Hare, IL 701 1 Cincinnati, OH 659 1 Cleveland, OH 305 .5 Columbus, OH 508 .75 Dallas/Fort Worth, TX
1933 2.5
Dayton, OH 589 .75 Denver, CO 2161 2.75 Detroit, MI 332 .5 Fort Myers, FL 1905 2.5 Fort Lauderdale, FL 1950 2.5 Grand Rapids, MI 514 .75 Harrisburg, PA N/A N/A Hartford, CT 586 .75 Houston, TX 2095 2.75 Indianapolis, IN 709 1 Kansas City, MO 1307 1.75 Las Vegas, NV 3140 4 Los Angeles, CA 3493 4.5 Manchester, NH 645 .75 Memphis, TN 1315 1.75 Miami, FL 1988 2.5 Milwaukee, WI 692 1 Minneapolis, MN 1113 1.5 Nashville, TN 1044 1.25 New Orleans, LA 1791 2.25 New York, NY N/A N/A Newark, NJ 538 .75 Orlando, FL 1690 2 Palm Springs, FL N/A N/A Philadelphia, PA 540 .75 Phoenix, AZ 3036 4 Pittsburg, PA 361 .5

63
Portland, ME N/A N/A Portland, OR N/A N/A Providence, RI 681 1 Raleigh, NC N/A N/A Richmond, VA N/A N/A Rochester, NY N/A N/A San Diego, CA 3483 4.5 San Francisco, CA 3644 4.75 Seattle, WA 3325 4.25 St. Louise, MO 1064 1.5 Syracuse, NY 270 .25 Tampa, FL 1768 2.25 Washington, DC N/A N/A Washington-Dulles, DC
N/A N/A
West Palm Beach, FL
N/A N/A
Westchester, NY N/A N/A

64
APPENDIX C: TTC Operating and Capital Subsidy History

65
TTC Operating and Capital Subsidy History Note: The following information was compiled from TTC Annual Reports Until the late 1960s, transit operations in Ontario, including the TTC, maintained small operating surpluses and did not receive operating subsidies from the Province or municipal governments. The TTC was initially intended to be financially self-sustaining, and prior to 1970, it was able to recover the majority of its operating and capital costs from its own revenue sources, primarily fares collected. Government cost sharing of TTC expenditures began in the 1960s, and became formalized beginning in the 1970s. Beginning in the early 1970s, there was what appears to be a philosophical shift in thinking about subways and public transit. They were viewed less as utilities that ought to be self-financing and more as important tools for achieving an array of broader policy objectives, including relieving congestion and achieving more sustainable patterns of land use development. This was reflected in the introduction of provincial cost-sharing of transit operations in 1971, an innovative arrangement in North America. The Province subsidized 50% of the TTC’s operating deficit. These subsidies however, were subject to a “ceiling.” For example, in 1976, the grant was capped at 5% growth over the previous year.
At the same time that provincial cost-sharing was introduced, the TTC introduced a number of new policies that increased the gap between fare revenue and operating expenditures such as, removing zone based fares and not introducing regular fare increases. A variety of factors contributed to a significant escalation in operating expenditures, including higher energy costs and increasing salaries. The TTC’s operating deficit increased from 3.5% of its total expenditure in 1971 to 27% in 1976. In 1977, the Province introduced a more complex grant that set out targets for the percentage of operating expenditures that transit systems needed to recover through fares in order to qualify for 50/50 cost-sharing of their operating deficits. These targets were based on population (Table C1) and if exceeded, the TTC received greater than 50/50 cost sharing. Table C1: Subsidy Proportions Based on Specific Fare Revenue Target Source: Ministry of Treasury, Economics and Intergovernmental Affairs
Population
Target (% of operating expenditures)
Subsidy (% operating deficit)
0-100,000 50.00 25.00 100,000-150,000 55.00 22.50 150,000-200,000 60.00 20.00 200,000-1,000,000 65.00 17.50 1,000,000 + 72.50 13.75

66
Over time, a number of changes to cost sharing were introduced. From 1981 to 1993, a user-fair share model was brought in. This committed the Province to 50/50 cost sharing of “eligible” operating expenses in excess of fare revenues. Additional provincial subsidies were available for specified costs. During this time, the TTC set fares at levels to recover 68% of operating costs. From 1994 to 1997, the user fair share model was changed to modified flat-line subsidies, with continued 50/50 cost sharing of the operating deficit. In 1998, the provincial government discontinued its cost-sharing of transit operating expenditures as part of the Local Service Realignment exercise (The loss of provincial transit funding was accounted for as a cost when calculating revenue-neutral net effects of LSR on individual municipalities). Arguably, the termination of provincial subsidies marked a return to the older view of transit as a utility that ought to self-finance. The introduction of the provincial gas tax transfer in 2003 marked the re-entry of the provincial government into their field of subsidizing transit operations. Under the provincial gas tax program, municipalities have the flexibility to apply a portion of their funding to operating costs. Toronto has dedicated $91M annually with the most current available cost sharing of the TTC’s operating deficit reflected in Table C2.
Table C2: Subsidy Proportions in TTC Operating Deficit Source: Toronto Transit Commission 2008 2007 2006 2005 2004 Province 49% 25% 29% 35% 28% Municipality 51% 74% 71% 65% 72%