3343 Peachtree Road NE, Suite … · 3343 Peachtree Road NE, ... which offer either a certifi...
27
3343 Peachtree Road NE, Suite 850 Atlanta, GA 30326 404.975.5000 www.acenursing.org TM
Transcript of 3343 Peachtree Road NE, Suite … · 3343 Peachtree Road NE, ... which offer either a certifi...

3343 Peachtree Road NE, Suite 850 Atlanta, GA 30326 404.975.5000
www.acenursing.org
TM
MISSIONThe Accreditation Commission for Education in Nursing (ACEN) supports the interests of nursing education, nursing practice, and the public by the functions of accreditation. Accreditation is a voluntary, self-regulatory process by which non-governmental associations recognize educational institutions or programs that have been found to meet or exceed standards and criteria for educational quality. Accreditation also assists in the further improvement of the institutions or programs as related to resources invested, processes followed, and results achieved. The monitoring of certifi cate, diploma, and degree offerings is tied closely to state examination and licensing rules and to the oversight of preparation for work in the profession.
PURPOSEThe purpose of the ACEN is to provide specialized accreditation for programs of nursing education, both postsecondary and higher degree, which offer either a certifi cate, a diploma, or a recognized professional de-gree (clinical doctorate/DNP specialist certifi cate, master’s/post-master’s certifi cate, baccalaureate, associate, diploma, and practical).
GOALS
As the leading authority in nursing accreditation, the goal of the ACEN is to strengthen the quality of nursing education through a common core of standards and criteria that:
• Establishes supportive partnerships• Advocates self-regulation• Promotes peer review• Fosters educational equity, access, opportunity, mobility, and preparation of employment• Serves as a Title IV-HEA Gatekeeper (Includes some practical nursing and all hospital programs eligible to
participate in programs administered by the U.S. Department of Education or other federal agencies.)
ABOUT THE ACEN
ursing (ACEN) supports the interests of nursing education, di i A di i i l lf l
ACEN 2016 REPORT TO CONSTITUENTS-i-
TM
ABOUT THE ACEN ....................................................................................................................................................... Mission ............................................................................................................................................................. Purpose ................................................................................................................................................................ Goals .....................................................................................................................................................................TABLE OF CONTENTS ................................................................................................................................................ACCREDITATION PROCESS AND OUTCOMES .................................................................................................. Overview............................................................................................................................................................... Accreditation Decisions .................................................................................................................................. Continuing Accreditation with Conditions ................................................................................... Continuing Accreditation with Warning and Warning for Good Cause ................................. Denial of Initial or Continuing Accreditation ............................................................................... Follow-Up Reports ........................................................................................................................................... Areas Needing Development .......................................................................................................................... Site Visit Evaluation ........................................................................................................................................... Summary .............................................................................................................................................................PRESENTATION AND ANALYSIS OF THE ACEN ANNUAL REPORTS 2015-2016 ACADEMIC YEAR ...................................................................................................................................... Annual Report Purpose and Use ............................................................................................................... Return Rate ........................................................................................................................................................ SECTION I. Substantive Change .................................................................................................................... SECTION II. Program Outcomes .................................................................................................................. Licensure Examination Pass Rates ................................................................................................... Certifi cation Examination Pass Rates ............................................................................................. Completion Rates ................................................................................................................................ Job Placement Rates ........................................................................................................................... SECTION III. Program Operations ................................................................................................................ Student Enrollment .............................................................................................................................. Graduates .............................................................................................................................................. Program Complaints ........................................................................................................................... Alternate Methods of Program Delivery ....................................................................................... Preceptors ............................................................................................................................................. Standardized Testing ............................................................................................................................ Laboratory Personnel ......................................................................................................................... Simulation .............................................................................................................................................. Partnerships .......................................................................................................................................... Conclusion ..........................................................................................................................................................
TABLE OF CONTENTS
2016 REPORT TO CONSTITUENTS
Accreditation Commission for Education in Nursing3343 Peachtree Road NE, Suite 850 | Atlanta, GA 30326 | P. (404) 975-5000 | F. (404) 975-5020 | www.acenursing.org
ii
iii1134569101111
121213131414151516171718182020212223
2423
i
ACEN 2016 REPORT TO CONSTITUENTS-ii-
TM
ACEN
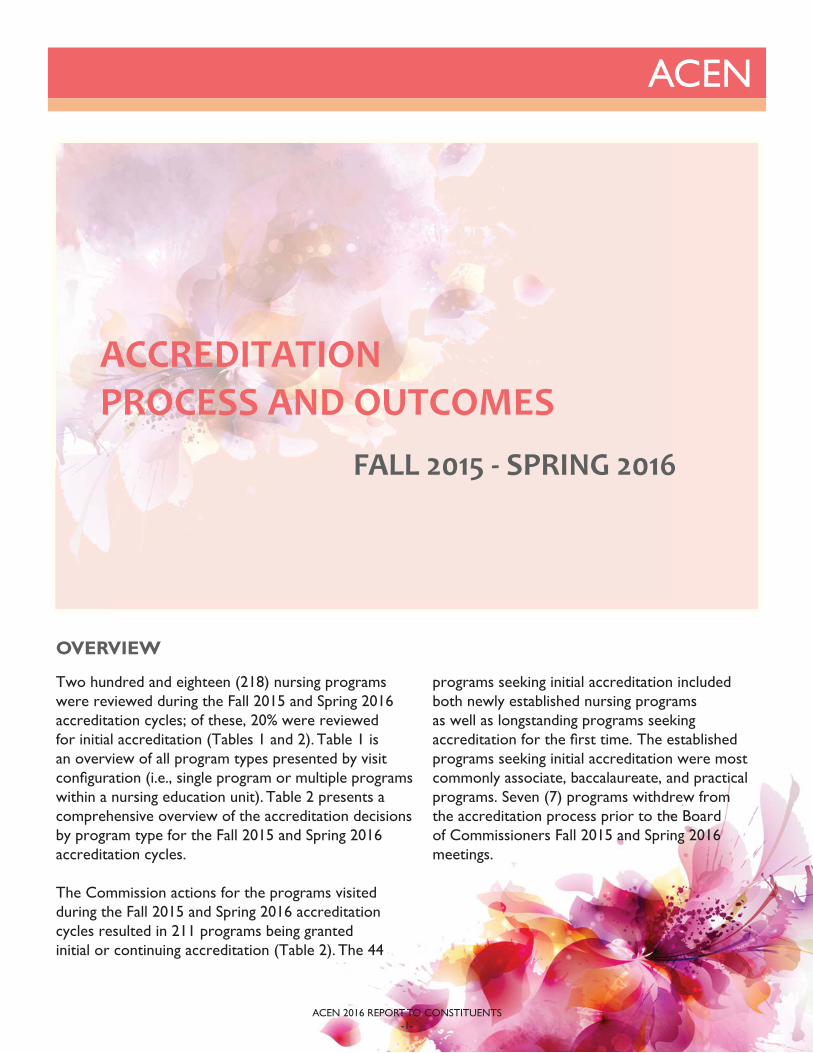
Two hundred and eighteen (218) nursing programs were reviewed during the Fall 2015 and Spring 2016 accreditation cycles; of these, 20% were reviewed for initial accreditation (Tables 1 and 2). Table 1 is an overview of all program types presented by visit confi guration (i.e., single program or multiple programs within a nursing education unit). Table 2 presents a comprehensive overview of the accreditation decisions by program type for the Fall 2015 and Spring 2016 accreditation cycles.
The Commission actions for the programs visited during the Fall 2015 and Spring 2016 accreditation cycles resulted in 211 programs being granted initial or continuing accreditation (Table 2). The 44
OVERVIEW
ACCREDITATIONPROCESS AND OUTCOMES
programs seeking initial accreditation included both newly established nursing programs as well as longstanding programs seeking accreditation for the fi rst time. The established programs seeking initial accreditation were most commonly associate, baccalaureate, and practical programs. Seven (7) programs withdrew from the accreditation process prior to the Board of Commissioners Fall 2015 and Spring 2016 meetings.
ACEN 2016 REPORT TO CONSTITUENTS-1-
FALL 2015 - SPRING 2016
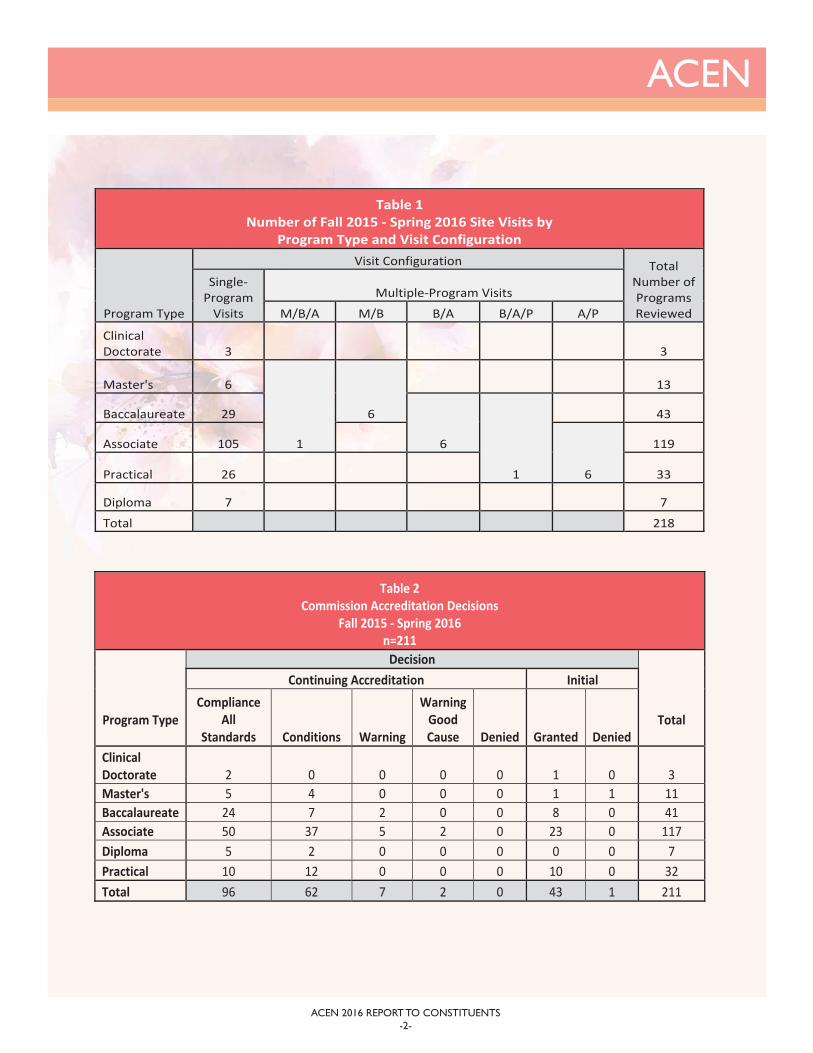
Table 2 Commission Accreditation Decisions
Fall 2015 - Spring 2016 n=211
Program Type
Decision
Total
Continuing Accreditation Initial Compliance
All Standards Conditions Warning
Warning Good Cause Denied Granted Denied
Clinical Doctorate 2 0 0 0 0 1 0 3 Master's 5 4 0 0 0 1 1 11 Baccalaureate 24 7 2 0 0 8 0 41 Associate 50 37 5 2 0 23 0 117 Diploma 5 2 0 0 0 0 0 7 Practical 10 12 0 0 0 10 0 32 Total 96 62 7 2 0 43 1 211
ACEN
Table 1 Number of Fall 2015 - Spring 2016 Site Visits by
Program Type and Visit Configuration
Program Type
Visit Configuration Total Number of Programs Reviewed
Single- Program
Visits
Multiple-Program Visits
M/B/A M/B B/A B/A/P A/P
Clinical Doctorate 3 3
Master's 6
1
6
13
Baccalaureate 29
6
1
43
Associate 105
6
119
Practical 26 33
Diploma 7 7
Total 218
ACEN 2016 REPORT TO CONSTITUENTS-2-
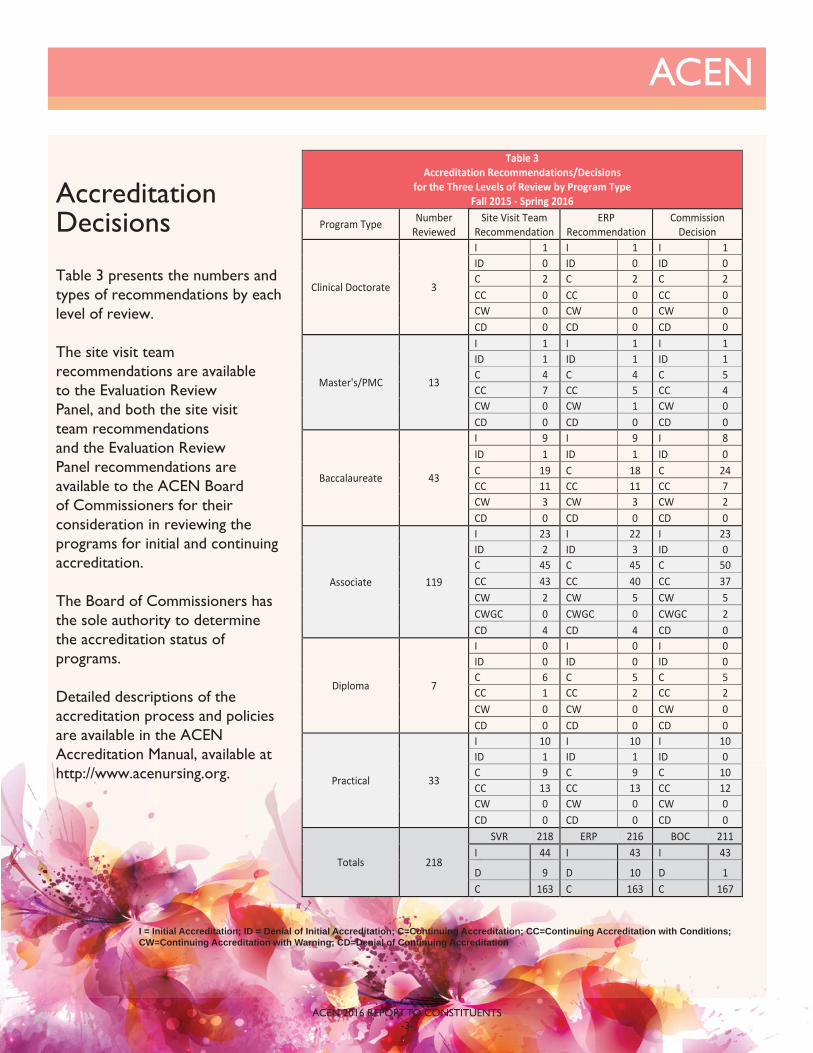
Table 3 presents the numbers and types of recommendations by each level of review.
The site visit team recommendations are available to the Evaluation Review Panel, and both the site visit team recommendations and the Evaluation Review Panel recommendations are available to the ACEN Board of Commissioners for their consideration in reviewing the programs for initial and continuing accreditation.
The Board of Commissioners has the sole authority to determine the accreditation status of programs.
Detailed descriptions of the accreditation process and policies are available in the ACEN Accreditation Manual, available at http://www.acenursing.org.
Table 3 Accreditation Recommendations/Decisions
for the Three Levels of Review by Program Type Fall 2015 - Spring 2016
Program Type Number Reviewed
Site Visit Team Recommendation
ERP Recommendation
Commission Decision
Clinical Doctorate 3
I 1 I 1 I 1 ID 0 ID 0 ID 0 C 2 C 2 C 2 CC 0 CC 0 CC 0 CW 0 CW 0 CW 0 CD 0 CD 0 CD 0
Master's/PMC 13
I 1 I 1 I 1 ID 1 ID 1 ID 1 C 4 C 4 C 5 CC 7 CC 5 CC 4 CW 0 CW 1 CW 0 CD 0 CD 0 CD 0
Baccalaureate 43
I 9 I 9 I 8 ID 1 ID 1 ID 0 C 19 C 18 C 24 CC 11 CC 11 CC 7 CW 3 CW 3 CW 2 CD 0 CD 0 CD 0
Associate 119
I 23 I 22 I 23 ID 2 ID 3 ID 0 C 45 C 45 C 50 CC 43 CC 40 CC 37 CW 2 CW 5 CW 5 CWGC 0 CWGC 0 CWGC 2 CD 4 CD 4 CD 0
Diploma 7
I 0 I 0 I 0 ID 0 ID 0 ID 0 C 6 C 5 C 5 CC 1 CC 2 CC 2 CW 0 CW 0 CW 0 CD 0 CD 0 CD 0
Practical 33
I 10 I 10 I 10 ID 1 ID 1 ID 0 C 9 C 9 C 10 CC 13 CC 13 CC 12 CW 0 CW 0 CW 0 CD 0 CD 0 CD 0
Totals 218
SVR 218 ERP 216 BOC 211 I 44 I 43 I 43
D 9 D 10 D 1 C 163 C 163 C 167
I = Initial Accreditation; ID = Denial of Initial Accreditation; C=Continuing Accreditation; CC=Continuing Accreditation with Conditions; CW=Continuing Accreditation with Warning; CD=Denial of Continuing Accreditation
ACEN
ACEN 2016 REPORT TO CONSTITUENTS-3-
AccreditationDecisions

ACEN
Continuing Accreditation with Conditions
Table 4 Accreditation Decision: Continuing Accreditation with Conditions
Standards with which Programs were Found in Non-Compliance by Aggregate and Program Type Fall 2015 - Spring 2016
Total Number of Programs with Conditions (n=62)
Standard
Aggregate Non-
Compliance with
Standards
Program Type Clinical
Doctorate Master's/PMC Baccalaureate Associate Diploma Practical
n=0 n=4 n=7 n=37 n=2 n=12 Standard 1
Mission and Administrative
Capacity 1 0 0 0 0 0 1 Standard 2 Faculty and
Staff 9 0 2 1 5 0 1
Standard 3 Students 2 0 1 1 0 0 0
Standard 4 Curriculum 13 0 0 1 9 0 3
Standard 5 Resources 0 0 0 0 0 0 0
Standard 6 Outcomes 56 0 3 7 34 2 10
Continuing accreditation with conditions is granted when a program is found to be in non-compliance with one (1) or two (2) Accreditation Standards. Table 4 presents data related to the Accreditation Standards with which programs were found to be in non-compliance for all program types seeking continuing accreditation. Sixty-two (62) programs seeking continuing accreditation were granted continuing accreditation with conditions during the Fall 2015 and Spring 2016 cycles. As a result of the Board of Commissioners granting continuing accreditation with conditions, these programs are required to submit a Follow-Up Report within the timeframe specifi ed by ACEN policy.
ACEN 2016 REPORT TO CONSTITUENTS-4-

ACEN
Continuing Accreditation with Warning and Warning for Good Cause
Table 5 Accreditation Decision: Continuing Accreditation with Warning
Standards with which Programs were Found in Non-Compliance by Aggregate and Program Type Fall 2015- Spring 2016
Total Number of Programs with Warning (n=5)
Standard
Aggregate Non-
Compliance with
Standards
Program Type
Clinical Doctorate Master's/PMC Baccalaureate Associate Diploma Practical
n=0 n=0 n=2 n=3 n=0 n=0 Standard 1
Mission and Administrative
Capacity 0 0 0 0 0 0 0 Standard 2 Faculty
and Staff 5 0 0 2 3 0 0 Standard 3 Students 0 0 0 0 0 0 0
Standard 4 Curriculum 6 0 0 2 4 0 0 Standard 5 Resources 1 0 0 0 1 0 0 Standard 6 Outcomes 6 0 0 2 4 0 0
A determination of non-compliance with three (3) or more Accreditation Standards results in the program being granted continuing accreditation with warning. Five (5) programs seeking continuing accreditation were granted continuing accreditation with warning during the Fall 2015 and Spring 2016 cycles. The next review will include a Follow-Up Report, Follow-Up Visit, Evaluation Review Panel review, and Commission Decision within the timeframe specifi ed by ACEN policy. Table 5 presents data related to the Accreditation Standards with which programs were found to be in non-compliance for all program types seeking continuing accreditation and which the Commission granted continuing accreditation with warning.
ACEN 2016 REPORT TO CONSTITUENTS-5-
Continuing Accreditation with warning for good cause is granted for programs on conditions or warning that reached the end of the maximum monitoring period. A nursing program’s accreditation can be extended for good cause if the program meets all three (3) principles for good cause per Policy #4. For programs seeking continuing accreditation during the Fall 2015 and Spring 2016 cycles, 12 programs were granted continuing accreditation with warning for good cause. The next review will include a Follow-Up Report, Follow-Up Visit, Evaluation Review Panel review, and Commission Decision within the timeframe determined by ACEN policy.

ACEN
Denial of Initial or Continuing Accreditation
Table 6
Accreditation Decision: Continuing Accreditation with Warning for Good Cause
Standards with which Programs were Found in Non-Compliance by Aggregate and Program Type
Fall 2015 - Spring 2016
Total Number of Programs with Warning for Good Cause (n=12)
Standard
Aggregate Non-
Compliance with
Standards
Program Type
Clinical Doctorate Master's/PMC Baccalaureate Associate Diploma Practical
n=0 n=0 n=1 n=10 n=0 n=1
Standard 1 Mission and Administrative Capacity 0 0 0 0 0 0 0
Standard 2 Faculty and Staff 5 0 0 2 3 0 0
Standard 3 Students 0 0 0 0 0 0 0
Standard 4 Curriculum 2 0 0 0 2 0 0
Standard 5 Resources 0 0 0 0 0 0 0
Standard 6 Outcomes 11 0 0 0 10 0 1
ACEN 2016 REPORT TO CONSTITUENTS-6-
Initial accreditation is denied when the Board of Commissioners determines that a program is in non-compliance with one (1) or more Accreditation Standard. During the Fall 2015 and Spring 2016 accreditation cycles, a total of 44 programs were seeking initial accreditation. One (1) program seeking initial accreditation was denied in the fall of 2015, and zero (0) programs seeking initial accreditation were denied in spring of 2016.
Continuing accreditation can be denied when the Board of Commissioners determines that a nursing program on conditions or warning is in continued non-compliance with any Accreditation Standard, and must be denied when the Board of Commissioners determines a nursing program at the end of its second year of warning for good cause is found to be in continued non-compliance with any Accreditation Standard. A total of 167 programs were seeking continuing accreditation. Zero (0) programs seeking continuing accreditation were denied in the fall of 2015 or spring of 2016.
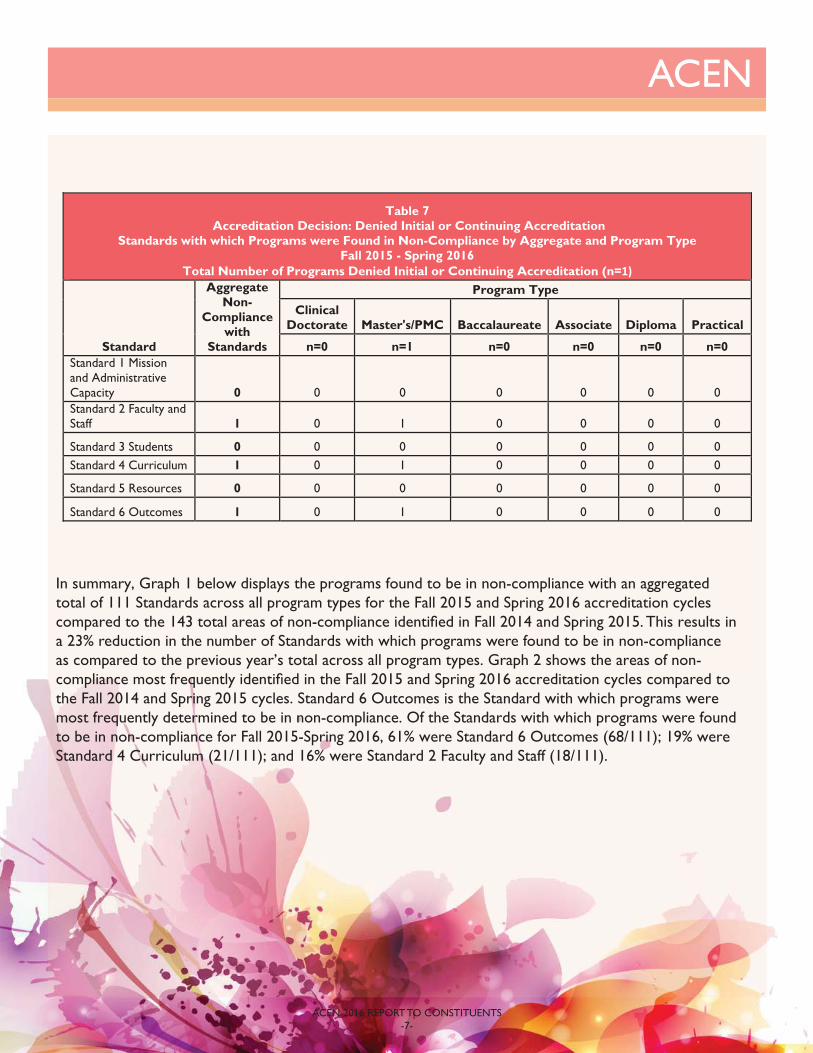
Table 7 presents data related to the Accreditation Standards with which programs were found to be in non-compliance when the Commission denied initial or continuing accreditation.
ACEN
Table 7 Accreditation Decision: Denied Initial or Continuing Accreditation
Standards with which Programs were Found in Non-Compliance by Aggregate and Program Type Fall 2015 - Spring 2016
Total Number of Programs Denied Initial or Continuing Accreditation (n=1)
Standard
Aggregate Non-
Compliance with
Standards
Program Type
Clinical Doctorate Master's/PMC Baccalaureate Associate Diploma Practical
n=0 n=1 n=0 n=0 n=0 n=0 Standard 1 Mission and Administrative Capacity 0 0 0 0 0 0 0 Standard 2 Faculty and Staff 1 0 1 0 0 0 0
Standard 3 Students 0 0 0 0 0 0 0 Standard 4 Curriculum 1 0 1 0 0 0 0
Standard 5 Resources 0 0 0 0 0 0 0
Standard 6 Outcomes 1 0 1 0 0 0 0
In summary, Graph 1 below displays the programs found to be in non-compliance with an aggregated total of 111 Standards across all program types for the Fall 2015 and Spring 2016 accreditation cycles compared to the 143 total areas of non-compliance identifi ed in Fall 2014 and Spring 2015. This results in a 23% reduction in the number of Standards with which programs were found to be in non-compliance as compared to the previous year’s total across all program types. Graph 2 shows the areas of non-compliance most frequently identifi ed in the Fall 2015 and Spring 2016 accreditation cycles compared to the Fall 2014 and Spring 2015 cycles. Standard 6 Outcomes is the Standard with which programs were most frequently determined to be in non-compliance. Of the Standards with which programs were found to be in non-compliance for Fall 2015-Spring 2016, 61% were Standard 6 Outcomes (68/111); 19% were Standard 4 Curriculum (21/111); and 16% were Standard 2 Faculty and Staff (18/111).
ACEN 2016 REPORT TO CONSTITUENTS-7-

ACEN
020406080100120140160
Standard 1 Standard 2 Standard 3 Standard 4 Standard 5 Standard 6 Overall
Graph 1Standards with Which Programs Were Found in
Non-Compliance Between 2014-2015 and 2015-2016
2014-2015 2015-2016
ACEN 2016 REPORT TO CONSTITUENTS-8-
01020304050607080
Standard 2 Standard 4 Standard 6
Graph 2Standards with Which Programs Were Most Frequently
Found in Non-Compliance Between 2014-2015 and 2015-2016
2014-2015 2015-2016

ACEN
Follow-Up Reports
Table 8 Review of Submitted Follow-Up Reports
Fall 2015 - Spring 2016
Program Type Aggregate Reviewed
N=79
Fall 2015 (n=40) Spring 2016 (n=34)
Reviewed Continuing
Accreditation Affirmed
Continuing Accreditation
Denied Reviewed
Continuing Accreditation
Affirmed
Continuing Accreditation
Denied Clinical
Doctorate 0 0 0 0 0 0 0
Master’s 8 6 6 0 2 2 0 Baccalaureate 13 9 9 0 4 4 0
Associate 44 24 24 0 20 20 0 Diploma 4 2 2 0 2 2 0 Practical 10 4 4 0 6 6 0
Programs granted continuing accreditation with conditions are required to submit Follow-Up Reports to demonstrate compliance with the specifi c Standard(s) with which they were found to be in non-compliance at the time of reaccreditation. Follow-Up Reports are reviewed by the Evaluation Review Panel, and a recommendation to accept or to not accept the Follow-Up Report is made based on the program’s demonstration of compliance with the Standard(s) at the time that the Follow-Up Report is submitted.
The ACEN Board of Commissioners reviews the Follow-Up Report and determines whether the program is in compliance with the Standard(s) and affi rms or denies continuing accreditation of the program. A decision to deny continuing accreditation results in removal of the program from the listing of ACEN-accredited nursing programs. Table 8 provides an overview of Follow-Up Reports reviewed during the Fall 2015 and Spring 2016 accreditation cycles. Of the 79 Follow-Up Reports reviewed, 100% resulted in continuing accreditation affi rmed (0% denied continuing accreditation).
ACEN 2016 REPORT TO CONSTITUENTS-9-

ACEN
Areas Needing Development
Each program evaluated for continuing and initial accreditation receives an accreditation decision letter from the Board of Commissioners within 30 days of the decision being rendered. The comprehensive evaluation process may result in a decision that includes areas needing development for the ACEN Standards. Areas needing development are not areas of non-compliance. An Area Needing Development is an area that has been identifi ed within a standard during the review process that is used to provide guidance to the program faculty members in their efforts to improve the quality if their nursing program. Table 9 presents the aggregated frequency of identifi ed areas needing development by Standard and by program type. Standard 6 Outcomes has the highest number of areas needing development across all program types, followed by Standard 4 Curriculum and Standard 3 Students.
ACEN 2016 REPORT TO CONSTITUENTS-10-
Table 9 Standards with Identified Areas Needing Development by Program Type
Aggregated by Frequency Fall 2015 - Spring 2016
Standards Aggregate N:1398
Program Type
Clinical Doctorate
n=3
Master's
n=11
Baccalaureate
n=38
Associate
n=112
Diploma
n=7
Practical
n=33
Standard 1 Mission and Administrative Capacity 92 0 12 16 46 2 16
Standard 2 Faculty and Staff 127 1 13 30 75 0 8
Standard 3 Students 165 1 9 28 99 4 24
Standard 4 Curriculum 224 5 15 41 125 4 34
Standard 5 Resources 42 0 2 7 24 0 9
Standard 6 Outcomes 748 4 35 168 415 23 103
Total Areas Needing Development
1398 11 86 290 784 33 194
Note: Programs may have multiple areas needing development for one or more Standards
ACEN
Site Visit Evaluation Summary
The site visit team is composed of peers from nursing education and clinical practice who represent commitment to excellence in nursing education and to the goals and processes of quality improvement. The site visit provides an opportunity for the peer evaluators to verify, clarify, and amplify the compliance of the nursing program based on its self-review as presented in the program’s Self-Study Report. The Self-Study Report is a critical element in the accreditation process. All peer evaluators are asked to evaluate the completeness of the program’s Self-Study Report. The evaluation of the Self-Study Reports by the peer evaluators has been very positive.
In addition, the ACEN asks all site visit team members and nursing programs to evaluate the effectiveness of the review processes implemented by the peer evaluators. The team chair and nursing program evaluate the overall preparation, professionalism, collegiality, and assistance of the team members. Overall, evaluation of the team members has been very positive. The team members and nursing program evaluate the team chair’s conduct during the visit and overall preparation, professionalism, and collegiality. Overall, evaluation of the chair has been very positive.
ACEN 2016 REPORT TO CONSTITUENTS-11-
The ACEN accreditation process is a vital component in ensuring that nursing programs demonstrate the highest degree of effectiveness in the delivery of quality nursing education. Further, the results of the implementation of the accreditation process demonstrate that the ACEN Standards and Criteria continue to provide a framework for the assessment of program quality in a thorough and effective manner.
The ACEN Annual Report is used by the ACEN and our many constituents to monitor components essential to the educational quality of nursing programs. Additionally, the Report facilitates the communication of trended, aggregated
data to accredited programs and other interested individuals and groups concerning all nursing program types.
This presentation addresses data generated from the 2015-2016 academic year (July 1, 2015-June 30, 2016) with the exception of enrollment information, which is based on data available on a single day, October 15, 2016. To facilitate the presentation, information in this Report to Constituents is presented in sections. Section I. Substantive Change addresses substantive changes within programs. Section II. Program Outcomes tracks achievement through licensure and certifi cation examination results; rates of program completion; and rates of employment of program graduates. Section III. Program Operations includes data related to student enrollment in the nursing programs; number of graduates; program complaints; the use of alternate methods of program delivery; the use of preceptors; the use of standardized tests; the use of practice laboratory personnel; the use of simulation; and program involvement with partnerships.
Presentation and Analysis of the ACEN Annual Reports
ACEN 2016 REPORT TO CONSTITUENTS-12-
2015 - 2016 Academic Year
Annual Report Purpose and Use
Return Rate
Substantive Change
The return rate for the 2015-2016 Annual Report was 100% by nursing education units. Submission of an annual report by the nursing education unit administrator is a requirement for maintaining ACEN accreditation. The submission of reports is monitored closely, and regular communication occurs between the ACEN and nursing education units that have not yet submitted their annual report by the time that the data are calculated. A 100% return rate is expected.
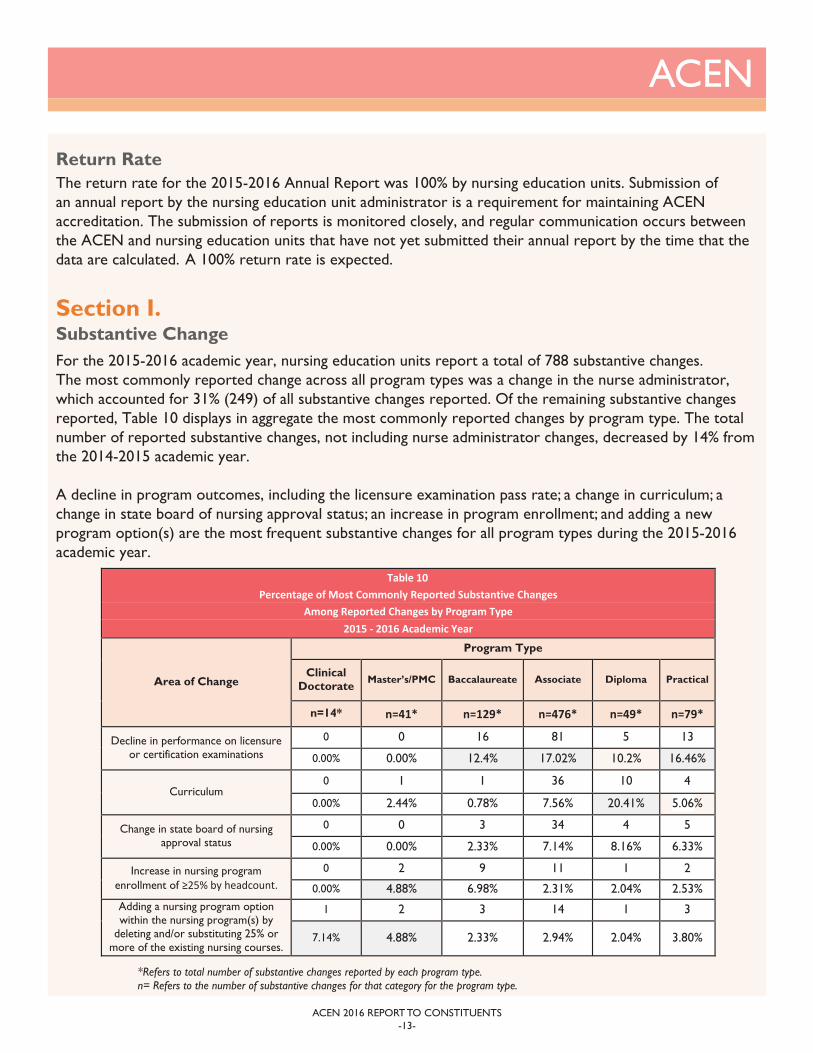
For the 2015-2016 academic year, nursing education units report a total of 788 substantive changes. The most commonly reported change across all program types was a change in the nurse administrator, which accounted for 31% (249) of all substantive changes reported. Of the remaining substantive changes reported, Table 10 displays in aggregate the most commonly reported changes by program type. The total number of reported substantive changes, not including nurse administrator changes, decreased by 14% from the 2014-2015 academic year.
A decline in program outcomes, including the licensure examination pass rate; a change in curriculum; a change in state board of nursing approval status; an increase in program enrollment; and adding a new program option(s) are the most frequent substantive changes for all program types during the 2015-2016 academic year.
Section I.
Table 10 Percentage of Most Commonly Reported Substantive Changes
Among Reported Changes by Program Type 2015 - 2016 Academic Year
Area of Change
Program Type
Clinical Doctorate Master’s/PMC Baccalaureate Associate Diploma Practical
n=14* n=41* n=129* n=476* n=49* n=79*
Decline in performance on licensure or certification examinations
0 0 16 81 5 13
0.00% 0.00% 12.4% 17.02% 10.2% 16.46%
Curriculum 0 1 1 36 10 4
0.00% 2.44% 0.78% 7.56% 20.41% 5.06%
Change in state board of nursing approval status
0 0 3 34 4 5
0.00% 0.00% 2.33% 7.14% 8.16% 6.33%
Increase in nursing program enrollment of 25% by headcount.
0 2 9 11 1 2
0.00% 4.88% 6.98% 2.31% 2.04% 2.53% Adding a nursing program option within the nursing program(s) by
deleting and/or substituting 25% or more of the existing nursing courses.
1 2 3 14 1 3
7.14% 4.88% 2.33% 2.94% 2.04% 3.80%
*Refers to total number of substantive changes reported by each program type.n= Refers to the number of substantive changes for that category for the program type.
ACEN
ACEN 2016 REPORT TO CONSTITUENTS-13-

Program OutcomesSection II.
Licensure Examination Pass RatesA review of the data reported by the nursing programs demonstrates that the mean NCLEX-RN and NCLEX-PN pass rates for graduates of ACEN-accredited programs exceed the National Council of State Boards of Nursing (NCSBN) published national mean for all program types. The ACEN-accredited programs were to report NCLEX pass rates between July 1, 2015, and June 30, 2016, and the NCSBN reports NCLEX pass rates for a calendar year. Table 11 presents NCLEX-RN and NCLEX-PN pass rates as posted by the NCSBN for fi rst-time, U.S.-educated candidates for years 2012-2016. It should also be noted that the NCSBN revised the passing standard for the NCLEX-RN examination effective April 1, 2013, which accounts for the decline in the nationwide pass rate.
Table 12 presents data on NCLEX-RN and NCLEX-PN mean pass rates as reported by ACEN-accredited programs since July 1, 2011. A review of the ACEN-accredited program data for NCLEX-RN for academic years 2011-2012 demonstrates that the performance of graduates from ACEN-accredited baccalaureate programs was below the national mean in 2011-2012 and 2014-2015 but increased to above the national mean in 2012-2013, 2013-2014, and 2015-2016. The NCLEX-RN and NCLEX-PN performance by ACEN-accredited diploma, associate, and practical graduates has consistently remained above the national mean.
ACEN
ACEN 2016 REPORT TO CONSTITUENTS-14-
Table 11 NCSBN Reported NCLEX Pass Rates
for First-Time, U.S.-Educated Candidates
Program Type 2012
National Average
2013 National Average
2014 National Average
2015 National Average
2016 National Average
Baccalaureate 91.66% 85.18% 84.93% 87.49% 87.80% Associate 89.32% 81.43% 79.26% 82.00% 81.68% Diploma 91.18% 83.42% 83.28% 85.77% 85.93% Practical 84.23% 84.63% 82.16% 81.89% 83.97%
Table 12 NCLEX Mean Pass Rate Percentages for First-Time Examination Takers
Reported by ACEN-Accredited Programs by Program Type 2011-2016
Program Year
2011-2012 2012-2013 2013-2014 2014-2015 2015-2016 Baccalaureate 88.69% 86.65% 85.57% 86.45% 87.81%
Associate 90.79% 87.86% 84.99% 85.87% 87.46%
Diploma 93.11% 90.23% 86.81% 87.20% 89.87%
Practical 91.29% 92.72% 93.02% 91.31% 90.95%

ACEN-accredited programs report pass rates for the certifi cation examinations taken by graduates of master’s programs, post-master’s certifi cates (PMC), and clinical doctorate programs. As a variety of certifying agencies offer certifi cation examinations for various nursing specialties, a comparison with any reference group is not recommended. Table 13 presents certifi cation examination performance as reported by master’s/PMC programs between 2011 and 2016. In 2016, the ACEN began collecting data on pass rates for specifi c certifi cation exams. Table 14 presents the data for the certifi cation types as reported by ACEN-accredited programs.
Certifi cation Examination Pass Rates
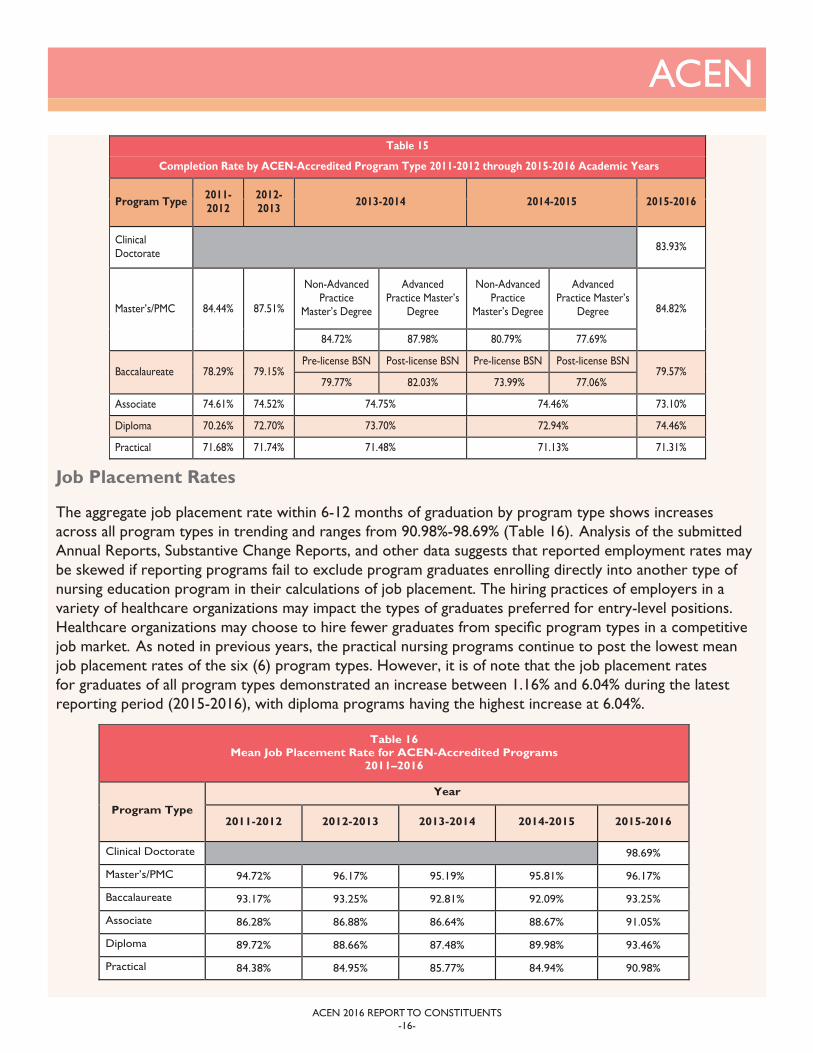
Based on the ACEN defi nition, the completion rate across all program types is the percentage of students who graduate within a defi ned period of time. The defi ned period of time is described as no more than 150% of the stated nursing program length, beginning with enrollment on the fi rst day of the fi rst nursing course, which can vary based upon a nursing program option. The program completion data range from 71.31-84.82%. For the most recent reporting period (2015-2016), programs did not report the percentage of students who completed advanced practice options and non-advanced practice options such as nurse educator, nurse administrator, and nursing informatics options. In addition, baccalaureate programs did not identify those students who completed pre-license BSN options and those students who completed an RN-to-BSN option. These data will be reported on future reports. Completion rate data continue to suggest that once registered in the fi rst required nursing course, students have a high probability of completing the program (Table 15).
Completion Rates
ACEN
ACEN 2016 REPORT TO CONSTITUENTS-15-
Table 13
Certification Examination Mean Pass Rate Percentages for First-Time Examination Takers
Reported by ACEN-Accredited Programs by Program Type
2011-2016
Program
Year
2011-2012 2012-2013 2013-2014 2014-2015 2015-2016
Master’s/PMC 93.45% 91.95% 93.46% 90.52% 89.97%
Clinical Doctorates 100%
Table 14
Certification Examination Mean Pass Rate Percentages for First-Time Examination Takers
Reported by ACEN-Accredited Programs by Certification Type
2015-2016
Program Certification Exam Type
CNM CNP CNS CRNA N-AP
Master’s/PMC 89.97% 90.15% 89.28% 90.30% 92.71%
Clinical Doctorates 100%
ACEN
ACEN 2016 REPORT TO CONSTITUENTS-16-
Table 15
Completion Rate by ACEN-Accredited Program Type 2011-2012 through 2015-2016 Academic Years
Program Type 2011-2012
2012-2013 2013-2014 2014-2015 2015-2016
Clinical Doctorate 83.93%
Master’s/PMC 84.44% 87.51%
Non-Advanced Practice
Master’s Degree
Advanced Practice Master’s
Degree
Non-Advanced Practice
Master’s Degree
Advanced Practice Master’s
Degree 84.82%
84.72% 87.98% 80.79% 77.69%
Baccalaureate 78.29% 79.15% Pre-license BSN Post-license BSN Pre-license BSN Post-license BSN
79.57% 79.77% 82.03% 73.99% 77.06%
Associate 74.61% 74.52% 74.75% 74.46% 73.10%
Diploma 70.26% 72.70% 73.70% 72.94% 74.46%
Practical 71.68% 71.74% 71.48% 71.13% 71.31%
The aggregate job placement rate within 6-12 months of graduation by program type shows increases across all program types in trending and ranges from 90.98%-98.69% (Table 16). Analysis of the submitted Annual Reports, Substantive Change Reports, and other data suggests that reported employment rates may be skewed if reporting programs fail to exclude program graduates enrolling directly into another type of nursing education program in their calculations of job placement. The hiring practices of employers in a variety of healthcare organizations may impact the types of graduates preferred for entry-level positions. Healthcare organizations may choose to hire fewer graduates from specifi c program types in a competitive job market. As noted in previous years, the practical nursing programs continue to post the lowest mean job placement rates of the six (6) program types. However, it is of note that the job placement rates for graduates of all program types demonstrated an increase between 1.16% and 6.04% during the latest reporting period (2015-2016), with diploma programs having the highest increase at 6.04%.
Job Placement Rates
Table 16 Mean Job Placement Rate for ACEN-Accredited Programs
2011–2016
Program Type
Year
2011-2012 2012-2013 2013-2014 2014-2015 2015-2016
Clinical Doctorate 98.69%
Master’s/PMC 94.72% 96.17% 95.19% 95.81% 96.17%
Baccalaureate 93.17% 93.25% 92.81% 92.09% 93.25%
Associate 86.28% 86.88% 86.64% 88.67% 91.05%
Diploma 89.72% 88.66% 87.48% 89.98% 93.46%
Practical 84.38% 84.95% 85.77% 84.94% 90.98%
ACEN
Table 17
Student Enrollment (Full- and Part-time): October 2014 through October 2016 For ACEN-Accredited Programs
Program Type Year Total % Full Time % Part Time
Clinical Doctorate 2016 946 45% 55%
Master’s
2014 13,249 35% 65%
2015 12,819 42% 58%
2016 10,757 34% 66%
Baccalaureate
2014 57,120 59% 41%
2015 54,036 61% 39%
2016 48,374 63% 37%
Associate
2014 151,479 58% 42%
2015 147,226 58% 42%
2016 149,928 57% 43%
Diploma
2014 7,007 72% 28%
2015 6,537 81% 19%
2016 7,054 65% 35%
Practical
2014 8,234 78% 22%
2015 8,238 82% 18%
2016 8,196 75% 25%
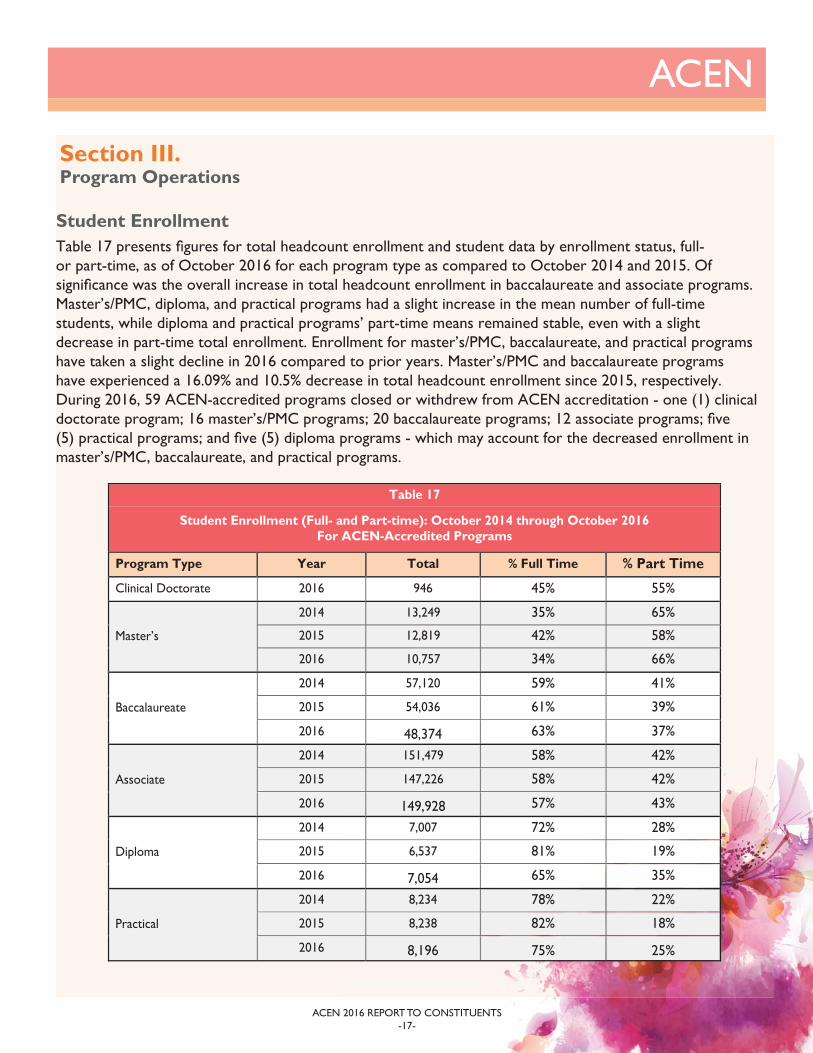
Table 17 presents fi gures for total headcount enrollment and student data by enrollment status, full- or part-time, as of October 2016 for each program type as compared to October 2014 and 2015. Of signifi cance was the overall increase in total headcount enrollment in baccalaureate and associate programs. Master’s/PMC, diploma, and practical programs had a slight increase in the mean number of full-time students, while diploma and practical programs’ part-time means remained stable, even with a slight decrease in part-time total enrollment. Enrollment for master’s/PMC, baccalaureate, and practical programs have taken a slight decline in 2016 compared to prior years. Master’s/PMC and baccalaureate programs have experienced a 16.09% and 10.5% decrease in total headcount enrollment since 2015, respectively. During 2016, 59 ACEN-accredited programs closed or withdrew from ACEN accreditation - one (1) clinical doctorate program; 16 master’s/PMC programs; 20 baccalaureate programs; 12 associate programs; fi ve (5) practical programs; and fi ve (5) diploma programs - which may account for the decreased enrollment in master’s/PMC, baccalaureate, and practical programs.
Student Enrollment
Program OperationsSection III.
ACEN 2016 REPORT TO CONSTITUENTS-17-
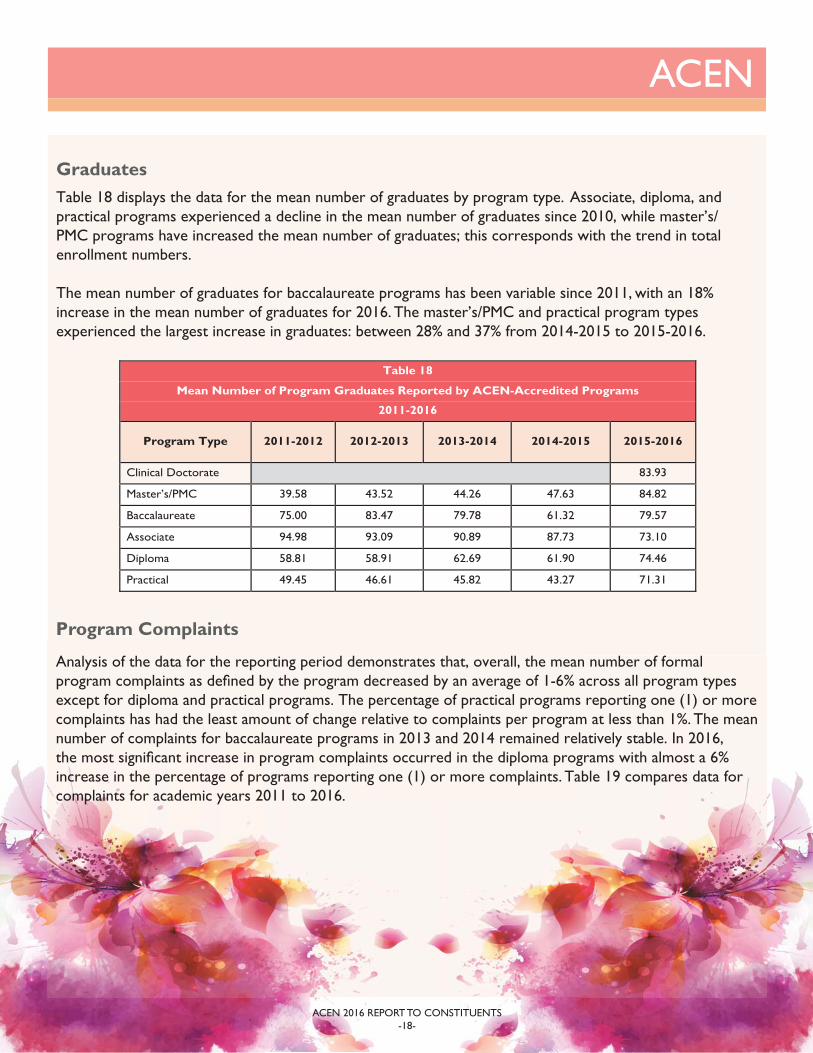
Table 18
Mean Number of Program Graduates Reported by ACEN-Accredited Programs
2011-2016
Program Type 2011-2012 2012-2013 2013-2014 2014-2015 2015-2016
Clinical Doctorate 83.93
Master’s/PMC 39.58 43.52 44.26 47.63 84.82
Baccalaureate 75.00 83.47 79.78 61.32 79.57
Associate 94.98 93.09 90.89 87.73 73.10
Diploma 58.81 58.91 62.69 61.90 74.46
Practical 49.45 46.61 45.82 43.27 71.31
Analysis of the data for the reporting period demonstrates that, overall, the mean number of formal program complaints as defi ned by the program decreased by an average of 1-6% across all program types except for diploma and practical programs. The percentage of practical programs reporting one (1) or more complaints has had the least amount of change relative to complaints per program at less than 1%. The mean number of complaints for baccalaureate programs in 2013 and 2014 remained relatively stable. In 2016, the most signifi cant increase in program complaints occurred in the diploma programs with almost a 6% increase in the percentage of programs reporting one (1) or more complaints. Table 19 compares data for complaints for academic years 2011 to 2016.
Program Complaints
ACEN
ACEN 2016 REPORT TO CONSTITUENTS-18-
Table 18 displays the data for the mean number of graduates by program type. Associate, diploma, and practical programs experienced a decline in the mean number of graduates since 2010, while master’s/PMC programs have increased the mean number of graduates; this corresponds with the trend in total enrollment numbers.
The mean number of graduates for baccalaureate programs has been variable since 2011, with an 18% increase in the mean number of graduates for 2016. The master’s/PMC and practical program types experienced the largest increase in graduates: between 28% and 37% from 2014-2015 to 2015-2016.
Graduates

ACEN
ACEN 2016 REPORT TO CONSTITUENTS-19-
Table 19 Program Complaints Reported by ACEN-Accredited Programs: 2011-2012 to 2015-2016
Program Type Mean Range % of programs reporting one or more complaints
Clinical Doctorate 2015-2016 0.14 0-2 7.14%
Master’s/PMC 2011-2012 0.25 0-3 15.22%
2012-2013 0.21 0-2 15.73%
2013-2014 0.29 0-8 17.44%
2014-2015 N/A N/A 25.00%
2015-2016 0.36 0-4 19.23%
Baccalaureate 2011-2012 1.01 0-53 24.54%
2012-2013 0.81 0-43 19.52%
2013-2014 0.80 0-8 21.50%
2014-2015 N/A N/A 29.86%
2015-2016 1.34 0-54 30.19%
Associate 2011-2012 1.08 0-8 37.59%
2012-2013 1.02 0-50 38.14%
2013-2014 1.41 0-98 38.91%
2014-2015 N/A N/A 44.08%
2015-2016 1.47 0-64 42.31%
Diploma 2011-2012 0.40 0-4 23.40%
2012-2013 0.38 0-4 23.40%
2013-2014 0.60 0-6 33.33%
2014-2015 N/A N/A 35.71%
2015-2016 0.68 0-4 42.50%
Practical
2011-2012 0.31 0-4 21.69%
2012-2013 0.34 0-5 20.25%
2013-2014 0.37 0-4 23.97%
2014-2015 N/A N/A 23.40%
2015-2016 0.70 0-16 26.06%
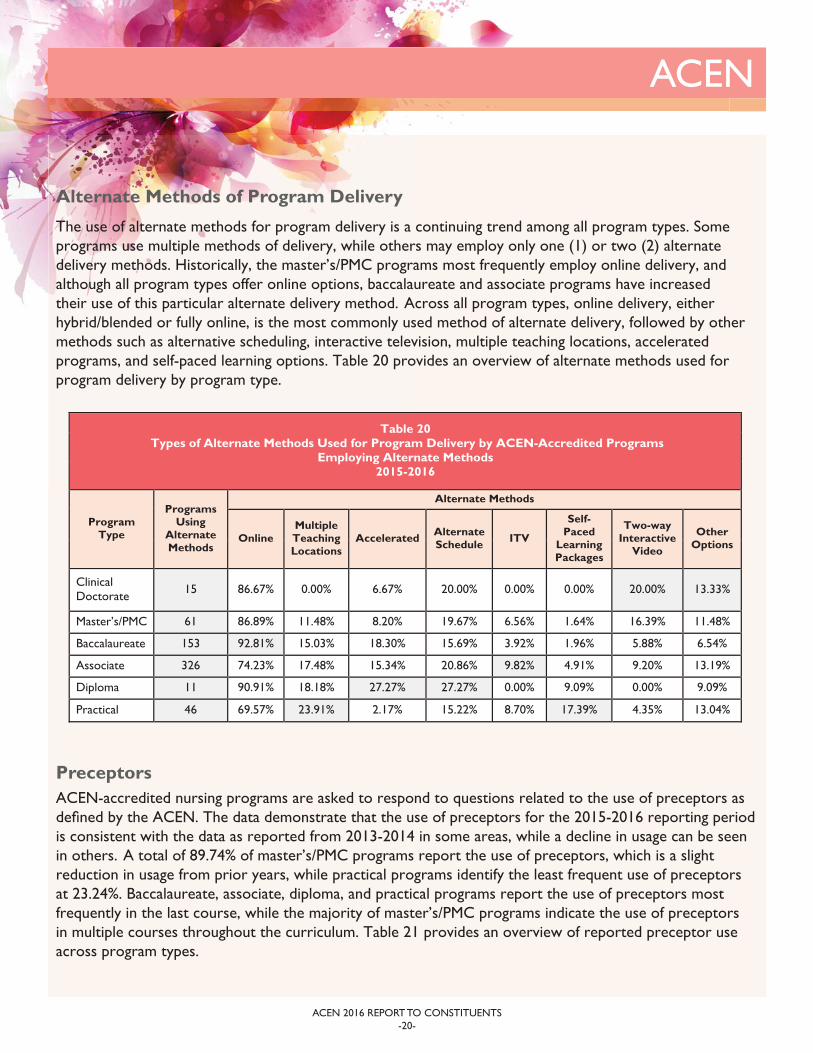
ACEN-accredited nursing programs are asked to respond to questions related to the use of preceptors as defi ned by the ACEN. The data demonstrate that the use of preceptors for the 2015-2016 reporting period is consistent with the data as reported from 2013-2014 in some areas, while a decline in usage can be seen in others. A total of 89.74% of master’s/PMC programs report the use of preceptors, which is a slight reduction in usage from prior years, while practical programs identify the least frequent use of preceptors at 23.24%. Baccalaureate, associate, diploma, and practical programs report the use of preceptors most frequently in the last course, while the majority of master’s/PMC programs indicate the use of preceptors in multiple courses throughout the curriculum. Table 21 provides an overview of reported preceptor use across program types.
Preceptors
Table 20 Types of Alternate Methods Used for Program Delivery by ACEN-Accredited Programs
Employing Alternate Methods 2015-2016
Program Type
Programs Using
Alternate Methods
Alternate Methods
Online Multiple Teaching Locations
Accelerated Alternate Schedule ITV
Self-Paced
Learning Packages
Two-way Interactive
Video
Other Options
Clinical Doctorate 15 86.67% 0.00% 6.67% 20.00% 0.00% 0.00% 20.00% 13.33%
Master’s/PMC 61 86.89% 11.48% 8.20% 19.67% 6.56% 1.64% 16.39% 11.48%
Baccalaureate 153 92.81% 15.03% 18.30% 15.69% 3.92% 1.96% 5.88% 6.54%
Associate 326 74.23% 17.48% 15.34% 20.86% 9.82% 4.91% 9.20% 13.19%
Diploma 11 90.91% 18.18% 27.27% 27.27% 0.00% 9.09% 0.00% 9.09%
Practical 46 69.57% 23.91% 2.17% 15.22% 8.70% 17.39% 4.35% 13.04%
ACEN
ACEN 2016 REPORT TO CONSTITUENTS-20-
The use of alternate methods for program delivery is a continuing trend among all program types. Some programs use multiple methods of delivery, while others may employ only one (1) or two (2) alternate delivery methods. Historically, the master’s/PMC programs most frequently employ online delivery, and although all program types offer online options, baccalaureate and associate programs have increased their use of this particular alternate delivery method. Across all program types, online delivery, either hybrid/blended or fully online, is the most commonly used method of alternate delivery, followed by other methods such as alternative scheduling, interactive television, multiple teaching locations, accelerated programs, and self-paced learning options. Table 20 provides an overview of alternate methods used for program delivery by program type.
Alternate Methods of Program Delivery
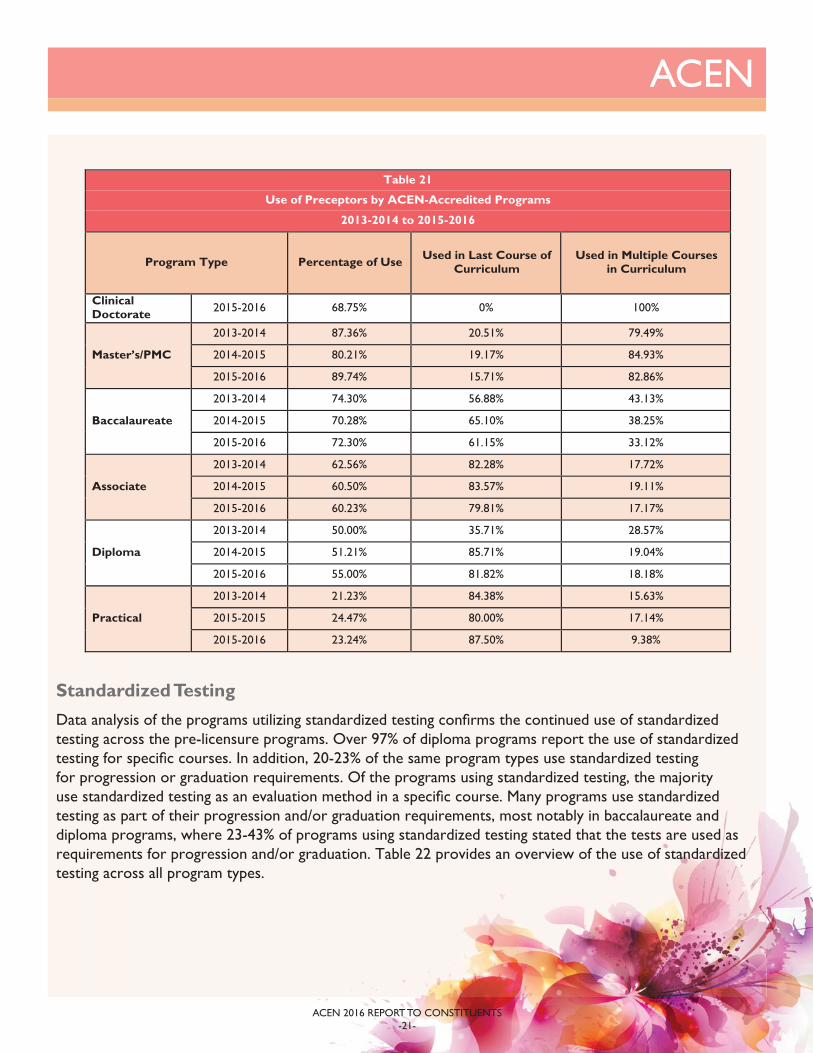
Table 21
Use of Preceptors by ACEN-Accredited Programs
2013-2014 to 2015-2016
Program Type Percentage of Use Used in Last Course of Curriculum
Used in Multiple Courses in Curriculum
Clinical Doctorate 2015-2016 68.75% 0% 100%
Master’s/PMC
2013-2014 87.36% 20.51% 79.49%
2014-2015 80.21% 19.17% 84.93%
2015-2016 89.74% 15.71% 82.86%
Baccalaureate
2013-2014 74.30% 56.88% 43.13%
2014-2015 70.28% 65.10% 38.25%
2015-2016 72.30% 61.15% 33.12%
Associate
2013-2014 62.56% 82.28% 17.72%
2014-2015 60.50% 83.57% 19.11%
2015-2016 60.23% 79.81% 17.17%
Diploma
2013-2014 50.00% 35.71% 28.57%
2014-2015 51.21% 85.71% 19.04%
2015-2016 55.00% 81.82% 18.18%
Practical
2013-2014 21.23% 84.38% 15.63%
2015-2015 24.47% 80.00% 17.14%
2015-2016 23.24% 87.50% 9.38%
ACEN
ACEN 2016 REPORT TO CONSTITUENTS-21-
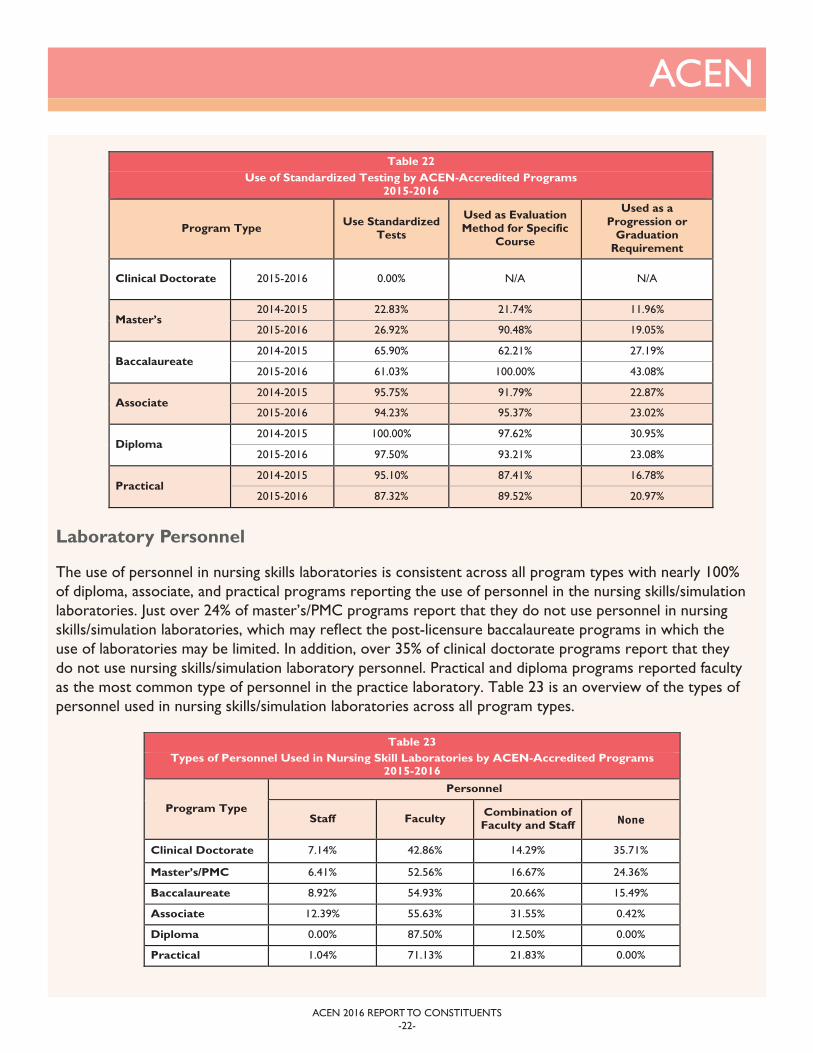
Data analysis of the programs utilizing standardized testing confi rms the continued use of standardized testing across the pre-licensure programs. Over 97% of diploma programs report the use of standardized testing for specifi c courses. In addition, 20-23% of the same program types use standardized testing for progression or graduation requirements. Of the programs using standardized testing, the majority use standardized testing as an evaluation method in a specifi c course. Many programs use standardized testing as part of their progression and/or graduation requirements, most notably in baccalaureate and diploma programs, where 23-43% of programs using standardized testing stated that the tests are used as requirements for progression and/or graduation. Table 22 provides an overview of the use of standardized testing across all program types.
Standardized Testing
ACEN
ACEN 2016 REPORT TO CONSTITUENTS-22-
The use of personnel in nursing skills laboratories is consistent across all program types with nearly 100% of diploma, associate, and practical programs reporting the use of personnel in the nursing skills/simulation laboratories. Just over 24% of master’s/PMC programs report that they do not use personnel in nursing skills/simulation laboratories, which may refl ect the post-licensure baccalaureate programs in which the use of laboratories may be limited. In addition, over 35% of clinical doctorate programs report that they do not use nursing skills/simulation laboratory personnel. Practical and diploma programs reported faculty as the most common type of personnel in the practice laboratory. Table 23 is an overview of the types of personnel used in nursing skills/simulation laboratories across all program types.
Laboratory Personnel
Table 22 Use of Standardized Testing by ACEN-Accredited Programs
2015-2016
Program Type Use Standardized Tests
Used as Evaluation Method for Specific
Course
Used as a Progression or
Graduation Requirement
Clinical Doctorate 2015-2016 0.00% N/A N/A
Master’s 2014-2015 22.83% 21.74% 11.96%
2015-2016 26.92% 90.48% 19.05%
Baccalaureate 2014-2015 65.90% 62.21% 27.19%
2015-2016 61.03% 100.00% 43.08%
Associate 2014-2015 95.75% 91.79% 22.87%
2015-2016 94.23% 95.37% 23.02%
Diploma 2014-2015 100.00% 97.62% 30.95%
2015-2016 97.50% 93.21% 23.08%
Practical 2014-2015 95.10% 87.41% 16.78%
2015-2016 87.32% 89.52% 20.97%
Table 23 Types of Personnel Used in Nursing Skill Laboratories by ACEN-Accredited Programs
2015-2016
Program Type
Personnel
Staff Faculty Combination of Faculty and Staff None
Clinical Doctorate 7.14% 42.86% 14.29% 35.71%
Master’s/PMC 6.41% 52.56% 16.67% 24.36%
Baccalaureate 8.92% 54.93% 20.66% 15.49%
Associate 12.39% 55.63% 31.55% 0.42%
Diploma 0.00% 87.50% 12.50% 0.00%
Practical 1.04% 71.13% 21.83% 0.00%

Simulation continues to be a major teaching modality that is used across program types, particularly in the pre-licensure programs, with the greatest percentage of use in the areas of skills check-off and clinical learning experiences amongst all program types. Programs identifi ed that simulation is used most often as part of a class or for the evaluation of required nursing skills. Table 24 presents an overview of how simulation is incorporated into the curriculum.
Simulation
All program types reported existing partnerships with agents/agencies outside of the governing organization. Partnerships, as defi ned by the ACEN, are agreements (formal relationships) between a nursing education unit/governing organization and an outside agent/agency to accomplish specifi c objectives and goals over a period of time. Partnerships are not clinical facility agreements for student learning experiences. All program types reported an increase in partnerships from 2013-2016, with the exception of master’s/PMC-level and associate-level programs. Table 25 presents an overview of the 2013-2016 partnership data.
Partnerships
Table 24 Use of Simulation by ACEN-Accredited Programs
2015-2016
Program Type Types of Activities by Programs Where Simulation is Used
Use of Simulation Lecture Skills
Check-Off Clinical Out-of-Class Assignment Other
Clinical Doctorate 7.14% 1.0% 2.00% 5.00% 0 0
Master’s/PMC 51.28% 10.50% 18.66% 18.66% 12.46% 9.00% Baccalaureate 69.48% 10.11% 30.08% 18.68% 9.73% 9.18% Associate 98.31% 7.73% 30.94% 15.96% 10.44% 15.73% Diploma 97.50% 9.92% 25.01% 20.46% 11.64% 14.50% Practical 92.96% 9.03% 32.01% 15.78% 11.24% 11.40%
ACEN
ACEN 2016 REPORT TO CONSTITUENTS-23-
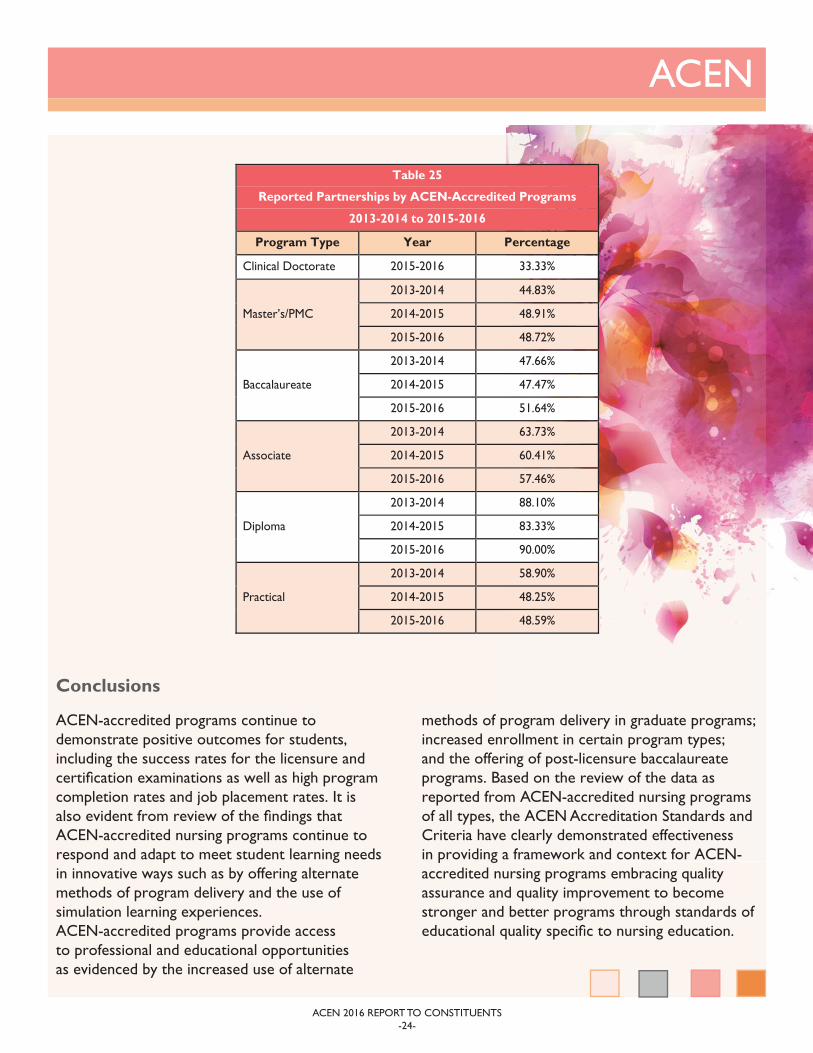
Table 25
Reported Partnerships by ACEN-Accredited Programs
2013-2014 to 2015-2016
Program Type Year Percentage
Clinical Doctorate 2015-2016 33.33%
Master’s/PMC
2013-2014 44.83%
2014-2015 48.91%
2015-2016 48.72%
Baccalaureate
2013-2014 47.66%
2014-2015 47.47%
2015-2016 51.64%
Associate
2013-2014 63.73%
2014-2015 60.41%
2015-2016 57.46%
Diploma
2013-2014 88.10%
2014-2015 83.33%
2015-2016 90.00%
Practical
2013-2014 58.90%
2014-2015 48.25%
2015-2016 48.59%
ACEN-accredited programs continue to demonstrate positive outcomes for students, including the success rates for the licensure and certifi cation examinations as well as high program completion rates and job placement rates. It is also evident from review of the fi ndings that ACEN-accredited nursing programs continue to respond and adapt to meet student learning needs in innovative ways such as by offering alternate methods of program delivery and the use of simulation learning experiences. ACEN-accredited programs provide access to professional and educational opportunities as evidenced by the increased use of alternate
methods of program delivery in graduate programs; increased enrollment in certain program types; and the offering of post-licensure baccalaureate programs. Based on the review of the data as reported from ACEN-accredited nursing programs of all types, the ACEN Accreditation Standards and Criteria have clearly demonstrated effectiveness in providing a framework and context for ACEN-accredited nursing programs embracing quality assurance and quality improvement to become stronger and better programs through standards of educational quality specifi c to nursing education.
Conclusions
ACEN
ACEN 2016 REPORT TO CONSTITUENTS-24-