329 Kandavel
16
Optimization of AB 2 - type alloy composition with superior hydrogen storage properties for stationary applications Kandavel Manickam, David Grant and Gavin Walker Energy and Sustainability Research Division Faculty of Engineering The University of Nottingham ICAER 2013, IIT Bombay
-
Upload
4th-international-conference-on-advances-in-energy-research-icaer-2013 -
Category
Technology
-
view
780 -
download
4
description
Transcript of 329 Kandavel
Optimization of AB2 - type alloy composition with superior
hydrogen storage properties for stationary applications
Kandavel Manickam, David Grant and Gavin Walker
Energy and Sustainability Research Division
Faculty of Engineering
The University of Nottingham
ICAER 2013, IIT Bombay
Outline
1. Introduction
2. Results of AB2 type alloys
• Materials preparation and characterization
• P-C-I measurements
• Thermodynamics
• Hydrogenation kinetics
• HP-DSC studies of alloys
3. Summary of results and conclusions
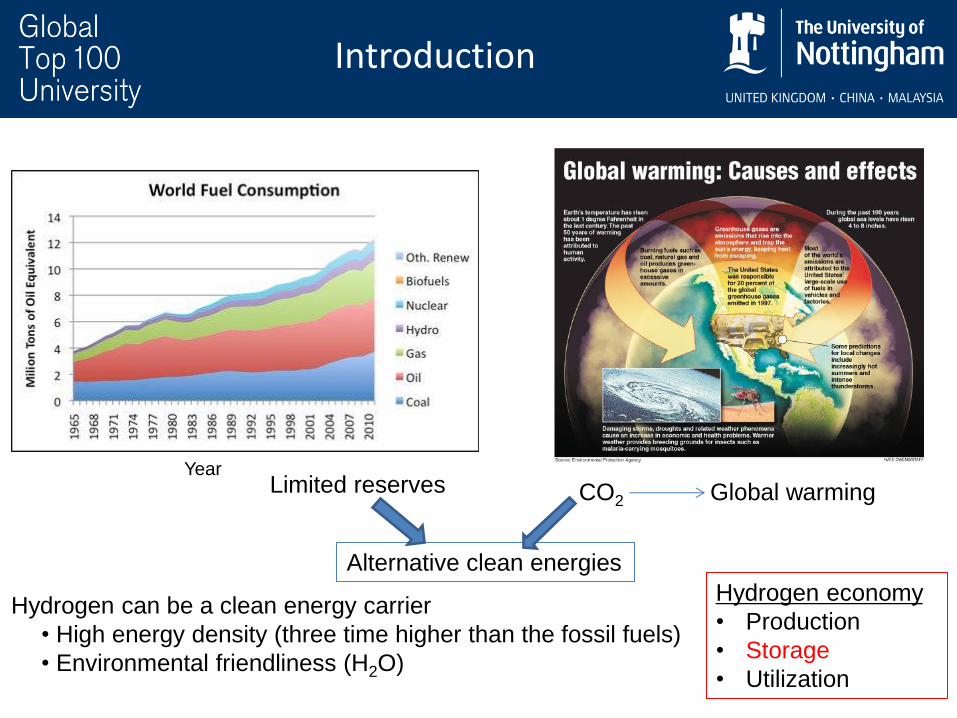
Year Limited reserves CO2 Global warming
Alternative clean energies
Hydrogen can be a clean energy carrier
• High energy density (three time higher than the fossil fuels)
• Environmental friendliness (H2O)
Introduction
Hydrogen economy
• Production
• Storage
• Utilization
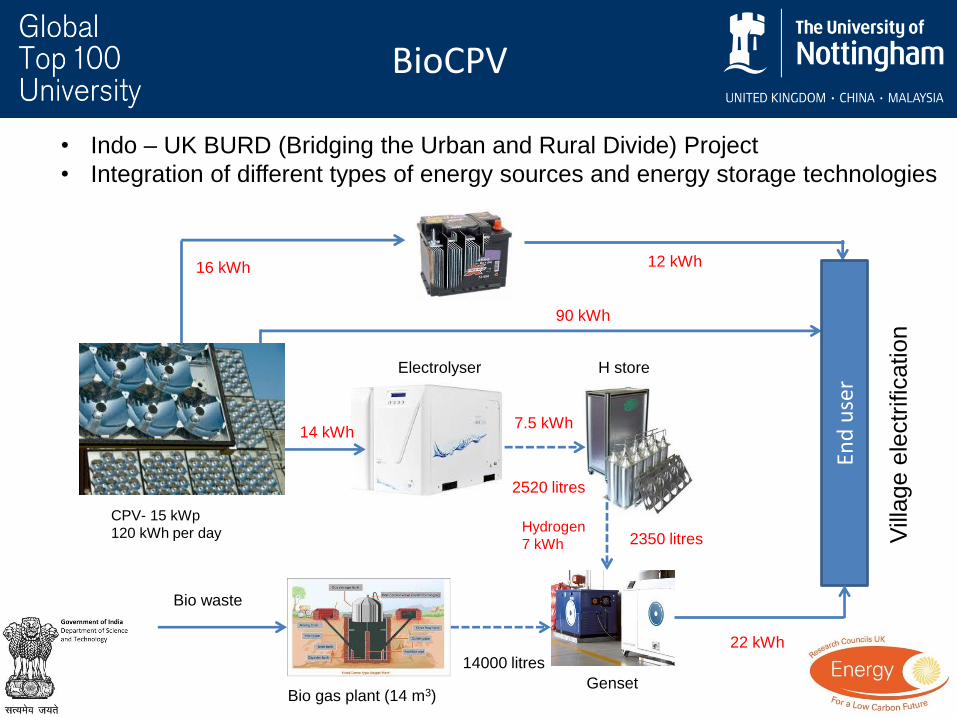
CPV- 15 kWp
120 kWh per day
End
use
r
Electrolyser H store
Bio gas plant (14 m3) Genset
14 kWh 7.5 kWh
Hydrogen
7 kWh
16 kWh
90 kWh
12 kWh
22 kWh
Bio waste
2520 litres
14000 litres
2350 litres
BioCPV
• Indo – UK BURD (Bridging the Urban and Rural Divide) Project
• Integration of different types of energy sources and energy storage technologies
Vill
age e
lectr
ific
ation
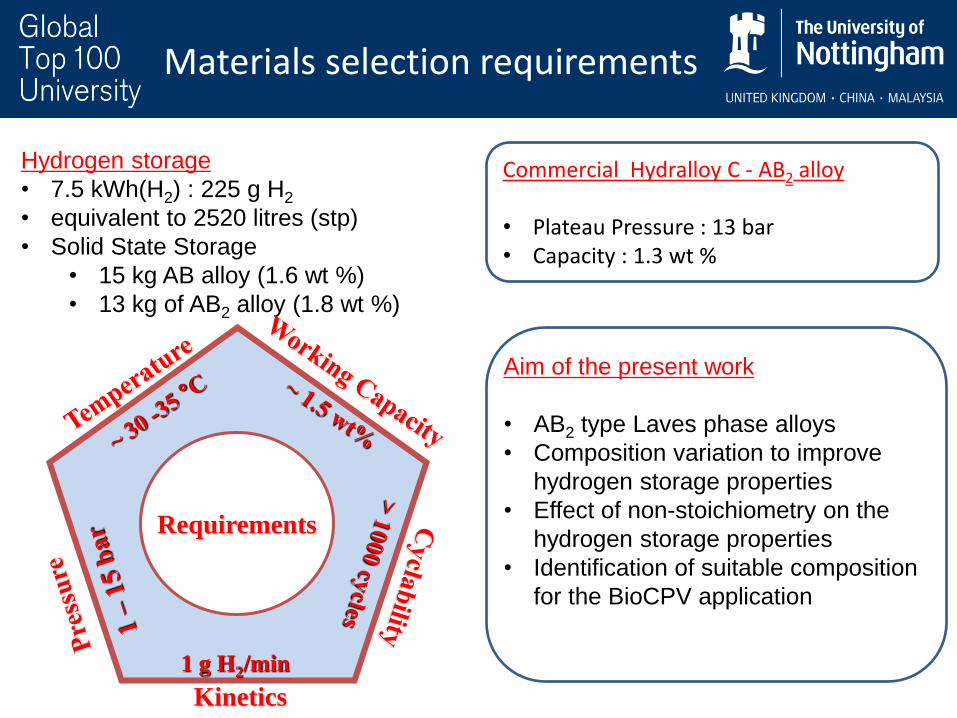
Materials selection requirements
Hydrogen storage
• 7.5 kWh(H2) : 225 g H2
• equivalent to 2520 litres (stp)
• Solid State Storage
• 15 kg AB alloy (1.6 wt %)
• 13 kg of AB2 alloy (1.8 wt %)
Requirements
Kinetics
1 g H2/min
Commercial Hydralloy C - AB2 alloy • Plateau Pressure : 13 bar • Capacity : 1.3 wt %
Aim of the present work
• AB2 type Laves phase alloys
• Composition variation to improve
hydrogen storage properties
• Effect of non-stoichiometry on the
hydrogen storage properties
• Identification of suitable composition
for the BioCPV application
30 40 50 60 70
30 40 50 60 70
x = 0
Inte
nsity (
arb
. u
nits)
2
x = 0.1
(112)
(004)
(200)
(201)
(103)
(110)
(202)
(104)
(213)
(302)
(205)
x = 0.05
x = 0.075
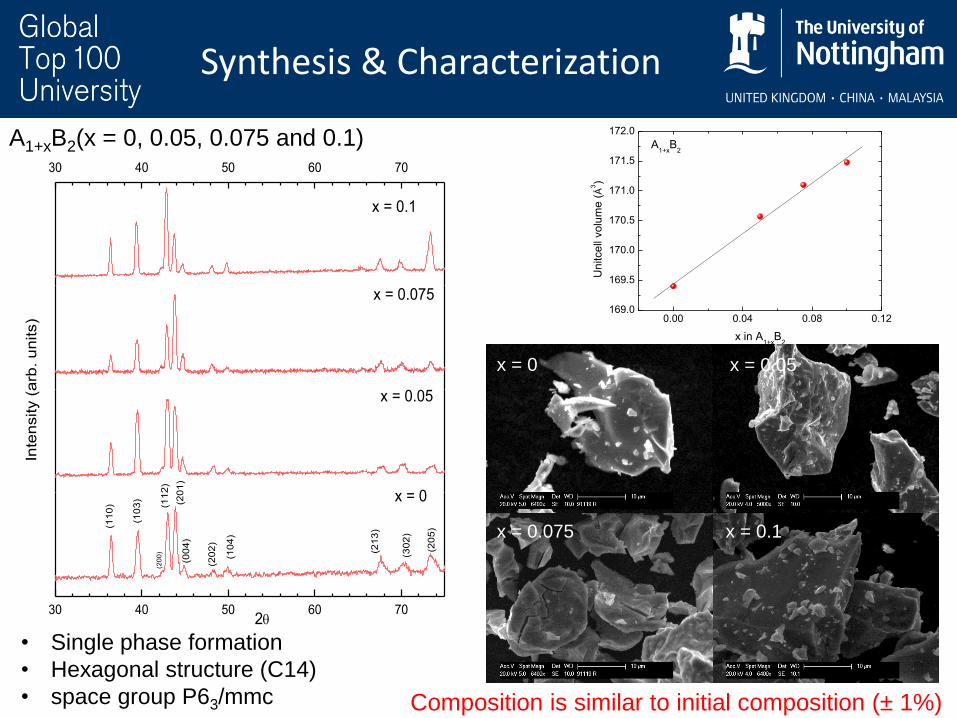
• Single phase formation
• Hexagonal structure (C14)
• space group P63/mmc
0.00 0.04 0.08 0.12169.0
169.5
170.0
170.5
171.0
171.5
172.0
A1+x
B2
Un
itce
ll vo
lum
e (Å
3)
x in A1+x
B2
A1+xB2(x = 0, 0.05, 0.075 and 0.1)
Synthesis & Characterization
Composition is similar to initial composition (± 1%)
x = 0 x = 0.05
x = 0.075 x = 0.1
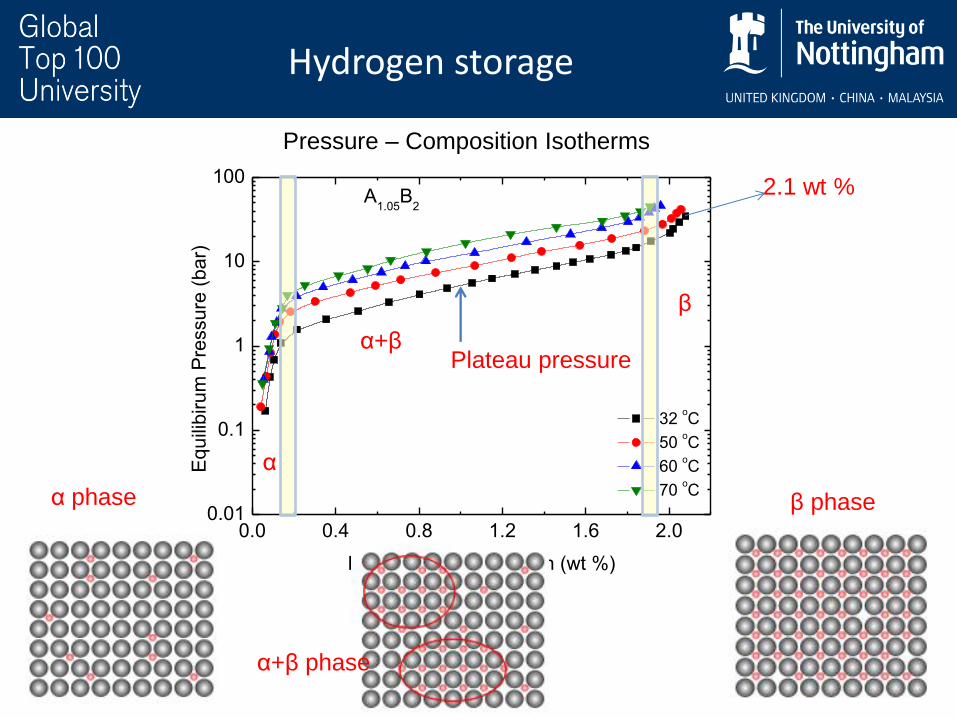
Hydrogen storage
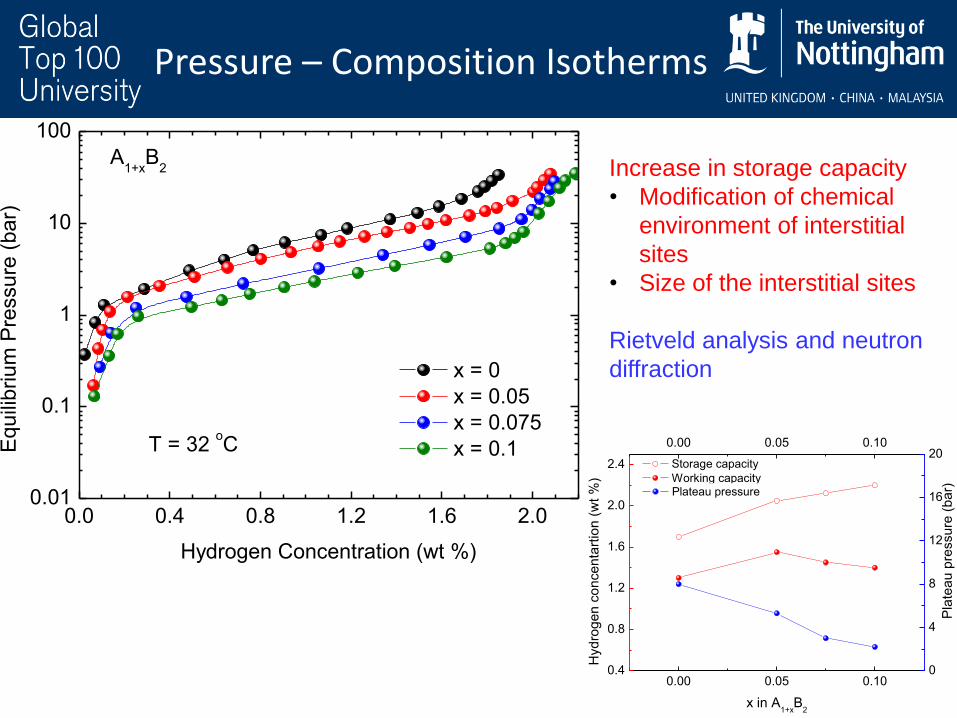
Pressure – Composition Isotherms
0.0 0.4 0.8 1.2 1.6 2.00.01
0.1
1
10
100
Equili
birum
Pre
ssure
(bar)
Hydrogen concentration (wt %)
32 oC
50 oC
60 oC
70 oC
A1.05
B2
Plateau pressure
α
α phase
α+β
α+β phase
β
β phase
2.1 wt %
0.0 0.4 0.8 1.2 1.6 2.00.01
0.1
1
10
100
0.0 0.4 0.8 1.2 1.6 2.00.01
0.1
1
10
100
32 oC
50 oC
60 oC
70 oC
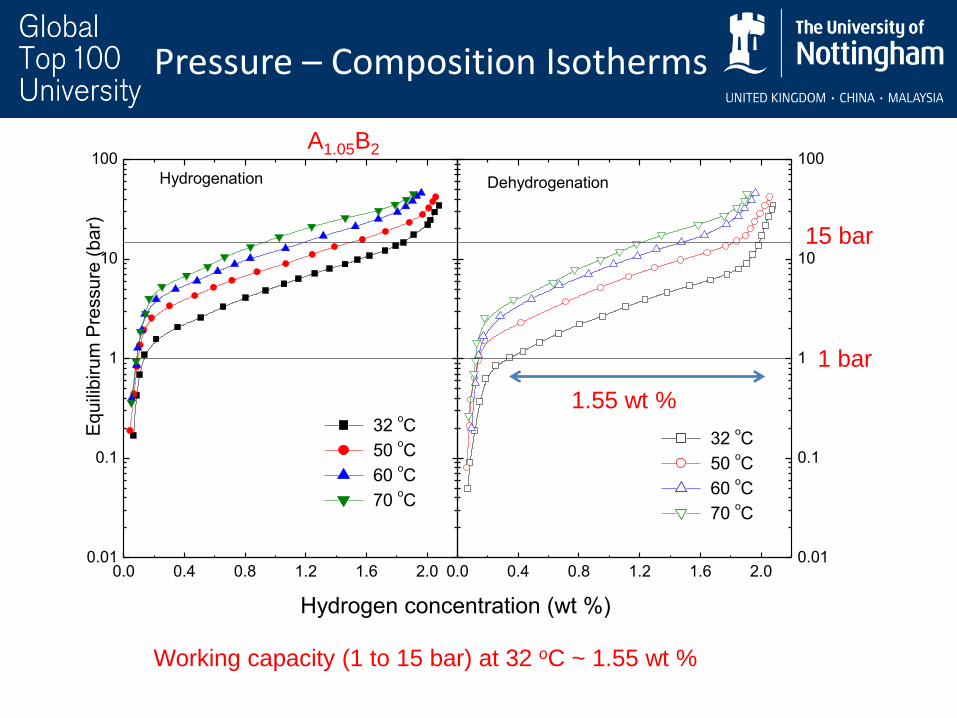
Dehydrogenation
Eq
uili
biru
m P
ressu
re (
ba
r)
Hydrogen concentration (wt %)
32 oC
50 oC
60 oC
70 oC
Hydrogenation
Pressure – Composition Isotherms
1 bar
15 bar
1.55 wt %
Working capacity (1 to 15 bar) at 32 oC ~ 1.55 wt %
A1.05B2
0.0 0.4 0.8 1.2 1.6 2.00.01
0.1
1
10
100
Eq
uili
briu
m P
ressu
re (
ba
r)
Hydrogen Concentration (wt %)
x = 0
x = 0.05
x = 0.075
x = 0.1
A1+x
B2
T = 32 oC
Pressure – Composition Isotherms
0.00 0.05 0.100.4
0.8
1.2
1.6
2.0
2.4
Pla
tea
u p
ressu
re (
ba
r)
Hyd
rog
en
co
nce
nta
rtio
n (
wt
%)
x in A1+x
B2
Storage capacity
Working capacity
0.00 0.05 0.10
0
4
8
12
16
20
Plateau pressure
Increase in storage capacity
• Modification of chemical
environment of interstitial
sites
• Size of the interstitial sites
Rietveld analysis and neutron
diffraction
0.0028 0.0030 0.0032 0.0034
0.8
1.6
2.4
0.0028 0.0030 0.0032 0.00340.0
0.8
1.6
2.4
x = 0.05
x = 0.075
x = 0.1
1/T (1/K)
Hydrogenation
ln P
H2
ln P
H2
x = 0.05
x = 0.075
x = 0.1
Dehydrogenation
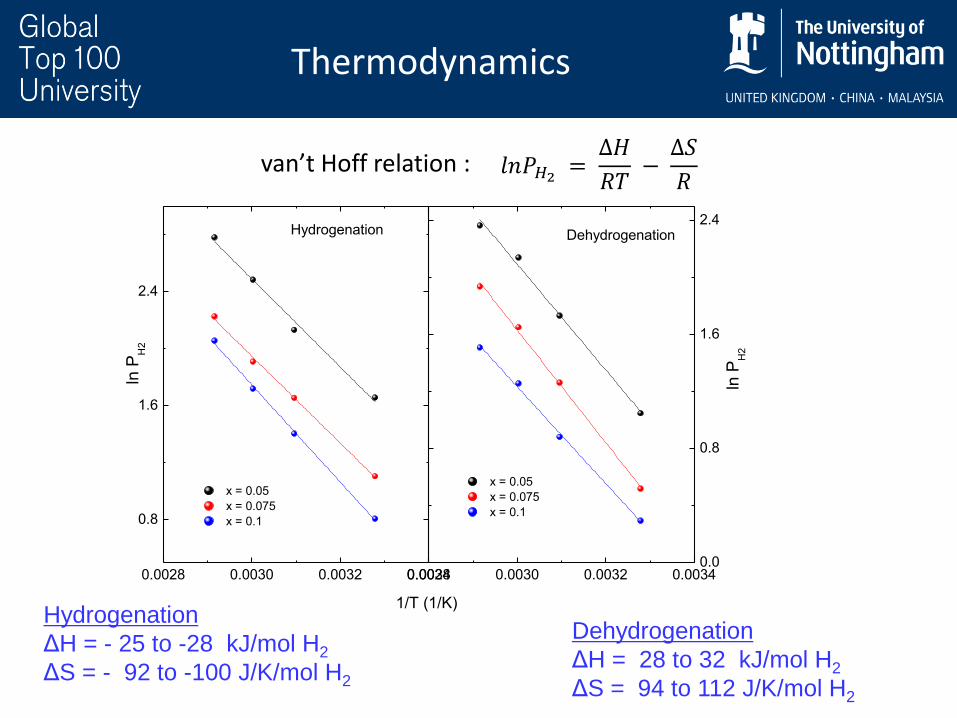
van’t Hoff relation : 𝑙𝑛𝑃𝐻2 =
∆𝐻
𝑅𝑇 −
∆𝑆
𝑅
Thermodynamics
Hydrogenation
ΔH = - 25 to -28 kJ/mol H2
ΔS = - 92 to -100 J/K/mol H2
Dehydrogenation
ΔH = 28 to 32 kJ/mol H2
ΔS = 94 to 112 J/K/mol H2
0 20 40 60 80 100
1.0
1.5
2.0
32 oC
50 oC
60 oC
70 oC
Hydro
gen C
oncentr
ation (
wt
%)
Time (min)
A1.05
B2
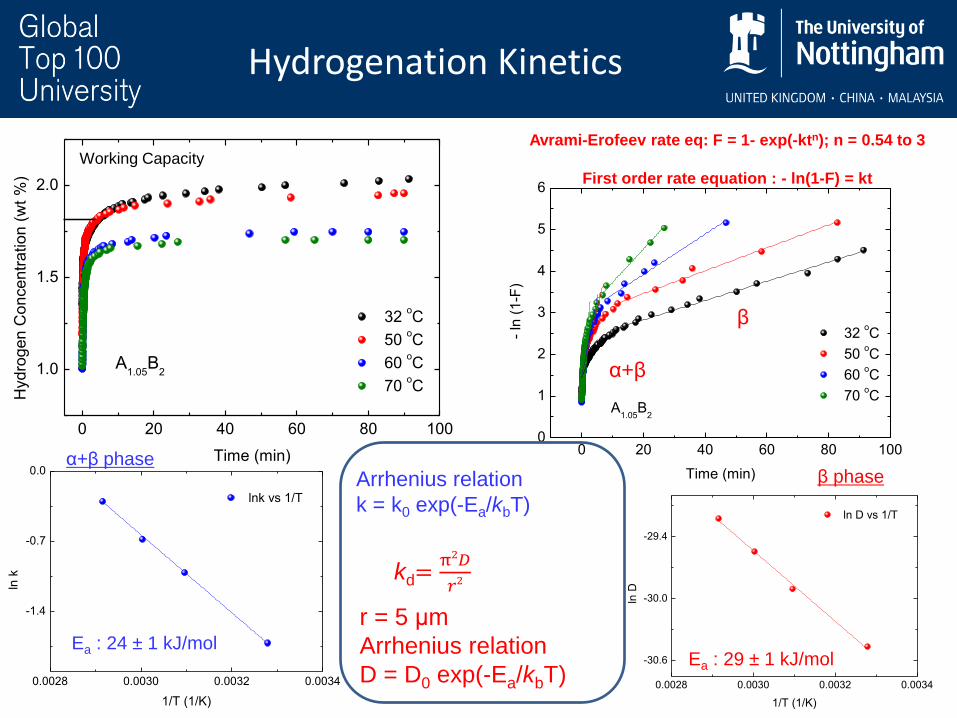
Hydrogenation Kinetics
0 20 40 60 80 1000
1
2
3
4
5
6
32 oC
50 oC
60 oC
70 oC
- ln
(1
-F)
Time (min)
A1.05
B2
Avrami-Erofeev rate eq: F = 1- exp(-ktn); n = 0.54 to 3
First order rate equation : - ln(1-F) = kt
α+β
β
0.0028 0.0030 0.0032 0.0034
-1.4
-0.7
0.0
lnk vs 1/T
ln k
1/T (1/K)
α+β phase Arrhenius relation
k = k0 exp(-Ea/kbT)
Ea : 24 ± 1 kJ/mol
0.0028 0.0030 0.0032 0.0034
-30.6
-30.0
-29.4
ln D vs 1/T
ln D
1/T (1/K)
β phase
kd=π2𝐷
𝑟2
r = 5 μm
Arrhenius relation
D = D0 exp(-Ea/kbT)
Ea : 29 ± 1 kJ/mol
Working Capacity
50 100 150 200 250
-0.1
0.0
0.1
0.2
DS
C H
ea
t flo
w (
mW
/mg
)
Temperature (oC)
20 bar
16 bar
12 bar
8 bar
A1.05
B2
Dehydrogenation
Hydrogenation
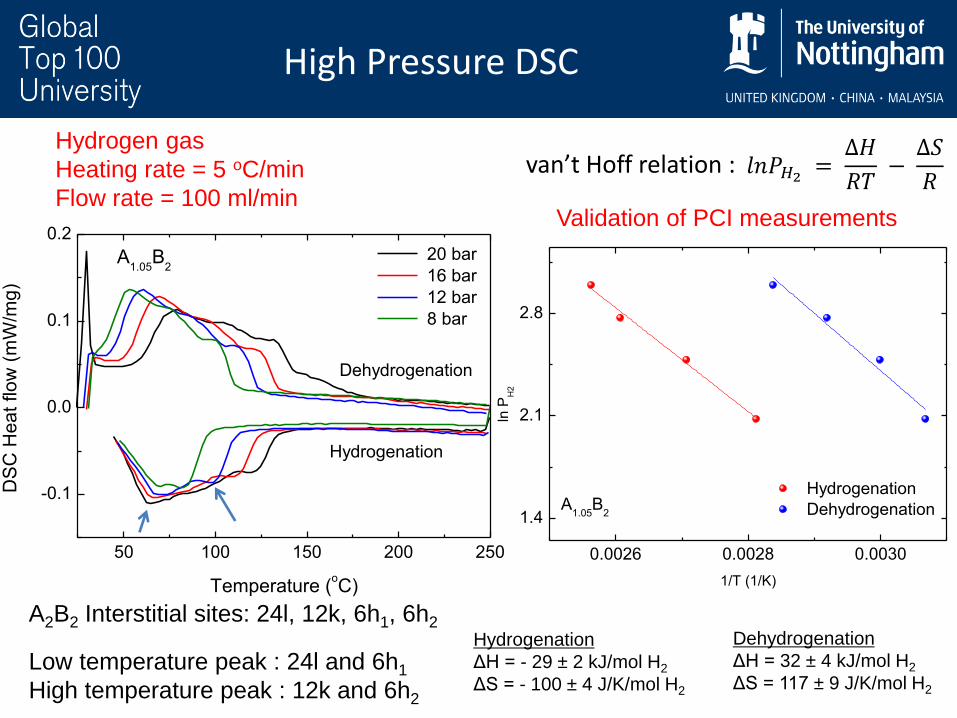
Hydrogen gas
Heating rate = 5 oC/min
Flow rate = 100 ml/min
High Pressure DSC
A2B2 Interstitial sites: 24l, 12k, 6h1, 6h2
Low temperature peak : 24l and 6h1
High temperature peak : 12k and 6h2
Hydrogenation
ΔH = - 29 ± 2 kJ/mol H2
ΔS = - 100 ± 4 J/K/mol H2
Dehydrogenation
ΔH = 32 ± 4 kJ/mol H2
ΔS = 117 ± 9 J/K/mol H2
0.0026 0.0028 0.0030
1.4
2.1
2.8
A1.05
B2
Hydrogenation
Dehydrogenationln
PH
2
1/T (1/K)
𝑙𝑛𝑃𝐻2 =
∆𝐻
𝑅𝑇 −
∆𝑆
𝑅 van’t Hoff relation :
Validation of PCI measurements
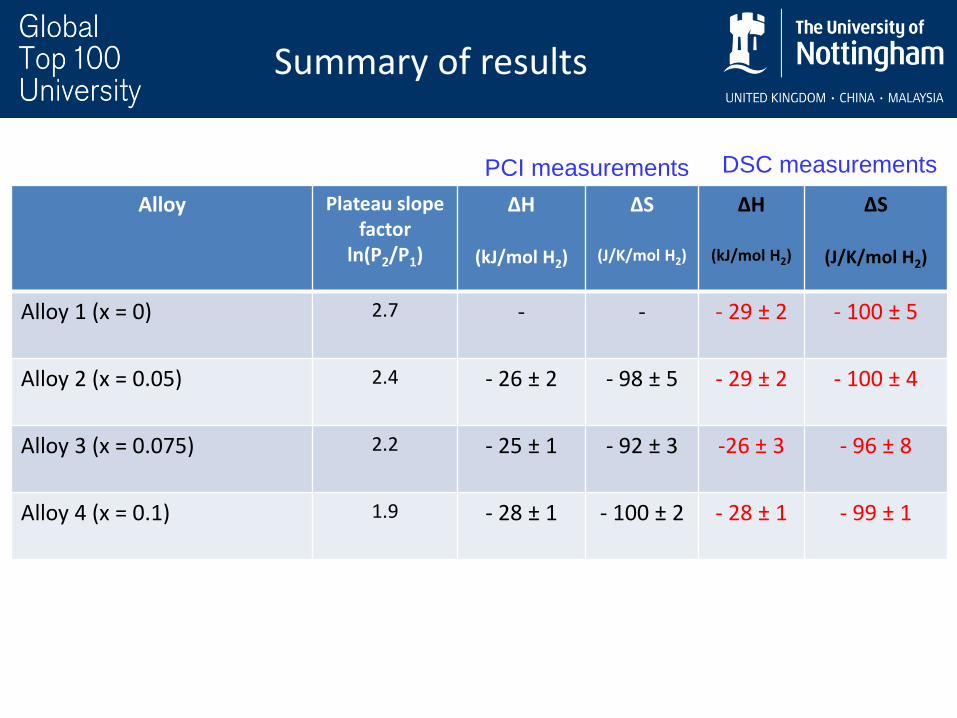
Alloy Plateau slope factor
ln(P2/P1)
ΔH
(kJ/mol H2)
ΔS
(J/K/mol H2)
ΔH
(kJ/mol H2)
ΔS
(J/K/mol H2)
Alloy 1 (x = 0) 2.7 - - - 29 ± 2
- 100 ± 5
Alloy 2 (x = 0.05) 2.4 - 26 ± 2 - 98 ± 5 - 29 ± 2 - 100 ± 4
Alloy 3 (x = 0.075)
2.2 - 25 ± 1 - 92 ± 3 -26 ± 3 - 96 ± 8
Alloy 4 (x = 0.1)
1.9 - 28 ± 1 - 100 ± 2 - 28 ± 1 - 99 ± 1
PCI measurements DSC measurements
Summary of results
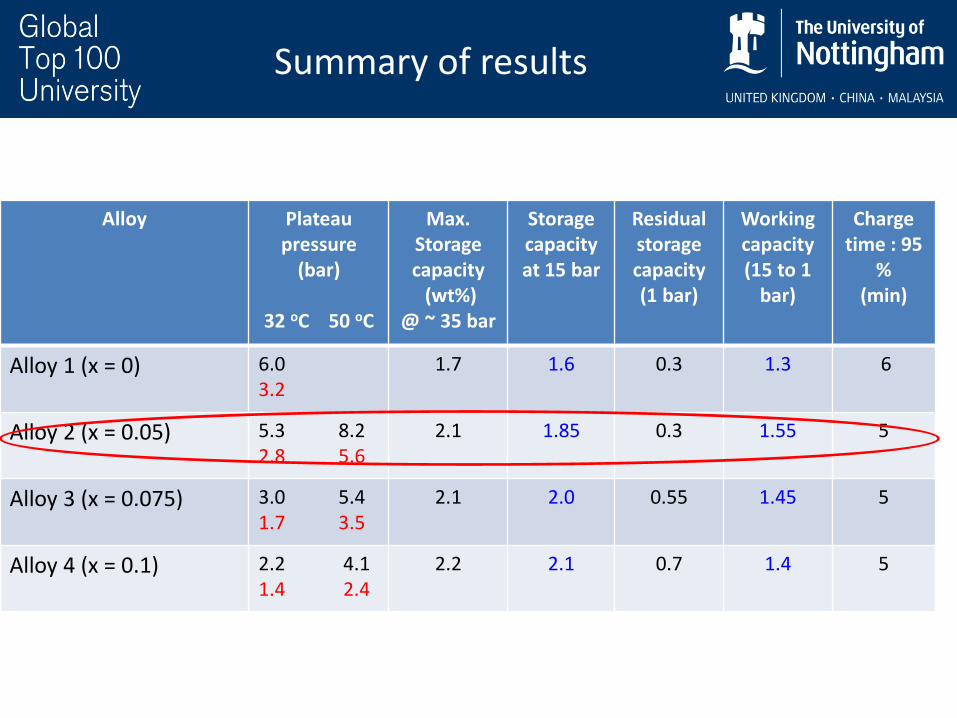
Alloy Plateau pressure
(bar)
32 oC 50 oC
Max. Storage capacity (wt%)
@ ~ 35 bar
Storage capacity at 15 bar
Residual storage capacity (1 bar)
Working capacity (15 to 1
bar)
Charge time : 95
% (min)
Alloy 1 (x = 0) 6.0 3.2
1.7 1.6 0.3 1.3 6
Alloy 2 (x = 0.05) 5.3 8.2 2.8 5.6
2.1 1.85 0.3 1.55 5
Alloy 3 (x = 0.075) 3.0 5.4 1.7 3.5
2.1 2.0 0.55 1.45 5
Alloy 4 (x = 0.1) 2.2 4.1 1.4 2.4
2.2 2.1 0.7 1.4 5
Summary of results
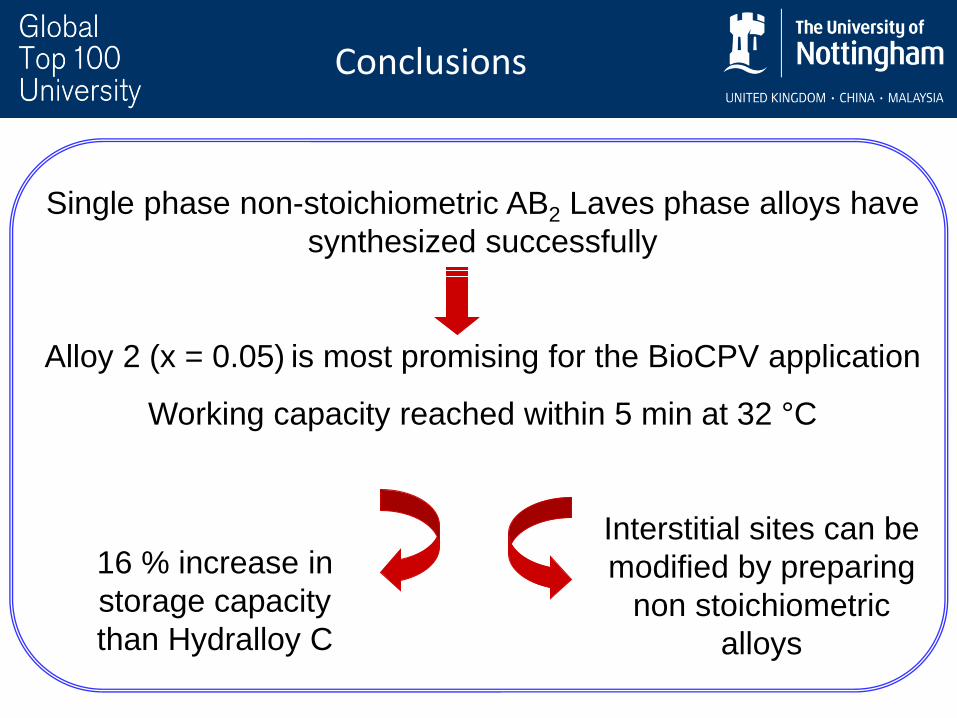
Conclusions
Single phase non-stoichiometric AB2 Laves phase alloys have
synthesized successfully
Alloy 2 (x = 0.05) is most promising for the BioCPV application
Working capacity reached within 5 min at 32 °C
16 % increase in
storage capacity
than Hydralloy C
Interstitial sites can be
modified by preparing
non stoichiometric
alloys
Thank you
Acknowledgement
- Research group members