
3.2 - Air Quality/Greenhouse Gas Emissions
38
City of Fremont – Warm Springs/South Fremont Community Plan Draft EIR Air Quality/Greenhouse Gas Emissions FirstCarbon Solutions 3.2-1 H:\Client (PN-JN)\4259\42590001\EIR\4 - Draft EIR\42590001 Sec03-02 Air Quailty.doc 3.2 - Air Quality/Greenhouse Gas Emissions 3.2.1 - Introduction This section addresses the potential impacts to regional and local air quality associated with implementation of the project. Air quality and greenhouse gas impacts were evaluated for plan-level impacts from short-term construction and long-term operational emissions of the project. FirstCarbon Solutions performed air quality and greenhouse gas analyses for the proposed project, which includes qualitative assessment of plan compliance, and greenhouse gas emissions modeling. The analysis files, including modeling outputs, are provided in Appendix B. 3.2.2 - Environmental Setting Air Basin The proposed project is located in Alameda County within the San Francisco Bay Area Air Basin (Air Basin), which is approximately 5,600 square miles in area and consists of nine counties that surround the San Francisco Bay, including all of Alameda County, Contra Costa County, Marin County, San Francisco County, San Mateo County, Santa Clara County, and Napa County, the southwestern portion of Solano County and the southern portion of Sonoma County. Its terrain and geographical location determine the distinctive climate of the Air Basin, as the Basin is a coastal plain with connecting valleys and low hills. The local agency with jurisdiction over air quality in the Basin is the Bay Area Air Quality Management District (BAAQMD). Air Pollutants For reasons described below in the Regulatory Framework section, the criteria pollutants of greatest concern for the project area are ozone, PM 10 , and PM 2.5 . PM is particulate matter in the air that includes a mixture of solids and liquid droplets. Some particles are emitted directly; others are formed in the atmosphere when other pollutants react. PM is so small that they can get into the lungs, potentially causing serious health problems. PM 10 is 10 microns in diameter, smaller than the width of a human hair. PM 2.5 is 2.5 microns in diameter and consists of “fine” particles. These fine particles are so small they can be detected only with an electron microscope. Sources of fine particles include all types of combustion, including motor vehicles, power plants, residential wood burning, forest fires, agricultural burning, and some industrial processes. Carbon monoxide is of less concern in the Air Basin because it is classified as an attainment area. Table 3.2-1 summarizes the most relevant effects from exposure, the properties, and the sources of the pollutants. Also shown are national and California ambient air quality standards. Toxic Air Contaminants In addition to the criteria pollutants, discussed below, toxic air contaminants (TACs), also known as hazardous air pollutants (HAPs), are another group of pollutants of concern. A TAC is defined as an air pollutant that may cause or contribute to an increase in mortality or serious illness, or that may pose a hazard to human health. TACs are usually present in minute quantities in the ambient air; however, their high toxicity or health risk may pose a threat to public health even at low concentrations. In general, for those TACs that may cause cancer, there is no concentration that
Transcript of 3.2 - Air Quality/Greenhouse Gas Emissions

City of Fremont – Warm Springs/South Fremont Community Plan Draft EIR Air Quality/Greenhouse Gas Emissions
FirstCarbon Solutions 3.2-1 H:\Client (PN-JN)\4259\42590001\EIR\4 - Draft EIR\42590001 Sec03-02 Air Quailty.doc
3.2 - Air Quality/Greenhouse Gas Emissions
3.2.1 - Introduction This section addresses the potential impacts to regional and local air quality associated with implementation of the project. Air quality and greenhouse gas impacts were evaluated for plan-level impacts from short-term construction and long-term operational emissions of the project. FirstCarbon Solutions performed air quality and greenhouse gas analyses for the proposed project, which includes qualitative assessment of plan compliance, and greenhouse gas emissions modeling. The analysis files, including modeling outputs, are provided in Appendix B.
3.2.2 - Environmental Setting
Air Basin
The proposed project is located in Alameda County within the San Francisco Bay Area Air Basin (Air Basin), which is approximately 5,600 square miles in area and consists of nine counties that surround the San Francisco Bay, including all of Alameda County, Contra Costa County, Marin County, San Francisco County, San Mateo County, Santa Clara County, and Napa County, the southwestern portion of Solano County and the southern portion of Sonoma County. Its terrain and geographical location determine the distinctive climate of the Air Basin, as the Basin is a coastal plain with connecting valleys and low hills. The local agency with jurisdiction over air quality in the Basin is the Bay Area Air Quality Management District (BAAQMD).
Air Pollutants
For reasons described below in the Regulatory Framework section, the criteria pollutants of greatest concern for the project area are ozone, PM10, and PM2.5. PM is particulate matter in the air that includes a mixture of solids and liquid droplets. Some particles are emitted directly; others are formed in the atmosphere when other pollutants react. PM is so small that they can get into the lungs, potentially causing serious health problems. PM10 is 10 microns in diameter, smaller than the width of a human hair. PM2.5 is 2.5 microns in diameter and consists of “fine” particles. These fine particles are so small they can be detected only with an electron microscope. Sources of fine particles include all types of combustion, including motor vehicles, power plants, residential wood burning, forest fires, agricultural burning, and some industrial processes.
Carbon monoxide is of less concern in the Air Basin because it is classified as an attainment area. Table 3.2-1 summarizes the most relevant effects from exposure, the properties, and the sources of the pollutants. Also shown are national and California ambient air quality standards.
Toxic Air Contaminants In addition to the criteria pollutants, discussed below, toxic air contaminants (TACs), also known as hazardous air pollutants (HAPs), are another group of pollutants of concern. A TAC is defined as an air pollutant that may cause or contribute to an increase in mortality or serious illness, or that may pose a hazard to human health. TACs are usually present in minute quantities in the ambient air; however, their high toxicity or health risk may pose a threat to public health even at low concentrations. In general, for those TACs that may cause cancer, there is no concentration that

City of Fremont – Warm Springs/South Fremont Community Plan Air Quality/Greenhouse Gas Emissions Draft EIR
3.2-2 FirstCarbon Solutions H:\Client (PN-JN)\4259\42590001\EIR\4 - Draft EIR\42590001 Sec03-02 Air Quailty.doc
does not present some risk. In other words, there is no threshold level below which adverse health impacts are not expected to occur. This contrasts with the criteria pollutants for which acceptable levels of exposure can be determined and for which the state and federal governments have set ambient air quality standards.
According to the California Almanac of Emissions and Air Quality, the majority of the estimated health risk from TACs for the State of California can be attributed to relatively few compounds, the most important of which is diesel particulate matter (DPM) from diesel-fueled engines.
Diesel Particulate Matter The California Air Resources Board (ARB) identified PM emissions from diesel-fueled engines as a TAC in August 1998 under California’s TAC program. The State of California, after a 10-year research program, determined in 1998 that DPM from diesel-fueled engines is a human carcinogen and that chronic (long-term) inhalation exposure to DPM poses a chronic (long-term) health risk. The California Office of Environmental Health Hazard Assessment (OEHHA) recommends using a 70-year exposure duration for determining residential cancer risks. DPM is emitted from both mobile and stationary sources. According to ARB’s 2009 Almanac, on-road diesel-fueled vehicles contribute approximately 38 percent of the statewide total inventory, with an additional 60 percent attributed to other mobile sources such as construction and mining equipment, agricultural equipment, and transport refrigeration units. The remaining DPM inventory was generated by stationary point sources and aggregated stationary sources.
Asbestos Asbestos is listed as a TAC by ARB and as a HAP by the U. S. Environmental Protection Agency (EPA). Naturally occurring asbestos areas are identified by the type of rock found in the area. Asbestos-containing rocks found in California are ultramafic rocks, including serpentine rocks. Crushing or breaking these rocks, through construction or other means, can release asbestos from fibers into the air. Asbestos emissions can result from the sale or use of asbestos-containing materials, road surfacing with such materials, grading activities, and surface mining. The risk of disease is dependent upon the intensity and duration of exposure. When inhaled, asbestos fibers may remain in the lungs and, with time, may be linked to such diseases as asbestosis, lung cancer, and mesothelioma.
According to the California Division of Mines and Geology, naturally occurring asbestos has been found in scattered locations within the Alameda County; however, the nearest known location of naturally occurring asbestos is farther than one mile from the plan area. Based on the age of buildings within the plan area, asbestos-containing material may be present. The disturbance of these structures for future development could release hazardous materials during construction activities, which could pose a risk to human health and the environment.

City of Fremont – Warm Springs/South Fremont Community Plan Draft EIR Air Quality/Greenhouse Gas Emissions
FirstCarbon Solutions 3.2-3 H:\Client (PN-JN)\4259\42590001\EIR\4 - Draft EIR\42590001 Sec03-02 Air Quailty.doc
Table 3.2-1: Description of Air Pollutants
Air Pollutant Averaging
Time California Standard
Federal Standarda
Most Relevant Effects from Pollutant Exposure Properties Sources
1 Hour 0.09 ppm — Ozone
8 Hour 0.070 ppm
0.075 ppm
Irritate respiratory system; reduce lung function; breathing pattern changes; reduction of breathing capacity; inflame and damage cells that line the lungs; make lungs more susceptible to infection; aggravate asthma; aggravate other chronic lung diseases; cause permanent lung damage; some immunological changes; increased mortality risk; vegetation and property damage.
Ozone is a photochemical pollutant as it is not emitted directly into the atmosphere, but is formed by a complex series of chemical reactions between volatile organic compounds (VOC), nitrous oxides (NOX), and sunlight. Ozone is a regional pollutant that is generated over a large area and is transported and spread by the wind.
Ozone is a secondary pollutant; thus, it is not emitted directly into the lower level of the atmosphere. The primary sources of ozone precursors (VOC and NOX) are mobile sources (on-road and off-road vehicle exhaust).
1 Hour 20 ppm 35 ppm Carbon monoxide (CO) 8 Hour 9.0 ppm 9 ppm
Ranges depending on exposure: slight headaches; nausea; aggravation of angina pectoris (chest pain) and other aspects of coronary heart disease; decreased exercise tolerance in persons with peripheral vascular disease and lung disease; impairment of central nervous system functions; possible increased risk to fetuses; death.
CO is a colorless, odorless, toxic gas. CO is somewhat soluble in water; therefore, rainfall and fog can suppress CO conditions. CO enters the body through the lungs, dissolves in the blood, replaces oxygen as an attachment to hemoglobin, and reduces available oxygen in the blood.
CO is produced by incomplete combustion of carbon-containing fuels (e.g., gasoline, diesel fuel, and biomass). Sources include motor vehicle exhaust, industrial processes (metals processing and chemical manufacturing), residential wood burning, and natural sources.
1 Hour 0.18 ppm 0.100 ppm Nitrogen dioxideb (NO2) Annual 0.030
ppm 0.053 ppm
Potential to aggravate chronic respiratory disease and respiratory symptoms in sensitive groups; risk to public health implied by pulmonary and extra-pulmonary biochemical and cellular changes and pulmonary structural changes; contributions to atmospheric discoloration’ increased visits to hospital for respiratory illnesses.
During combustion of fossil fuels, oxygen reacts with nitrogen to produce nitrogen oxides—NOX (NO, NO2, NO3, N2O, N2O3, N2O4, and N2O5). NOX is a precursor to ozone, PM10, and PM2.5 formation. NOX can react with compounds to form nitric acid and related small particles and result in PM related health effects.
NOX is produced in motor vehicle internal combustion engines and fossil fuel-fired electric utility and industrial boilers. Nitrogen dioxide forms quickly from NOX emissions. NO2 concentrations near major roads can be 30 to 100 percent higher than those at monitoring stations.

City of Fremont – Warm Springs/South Fremont Community Plan Draft EIR Air Quality/Greenhouse Gas Emissions
FirstCarbon Solutions 3.2-4 H:\Client (PN-JN)\4259\42590001\EIR\4 - Draft EIR\42590001 Sec03-02 Air Quailty.doc
Table 3.2-1 (cont.): Description of Air Pollutants
Air Pollutant Averaging
Time California Standard
Federal Standarda
Most Relevant Effects from Pollutant Exposure Properties Sources
1 Hour 0.25 ppm 0.075 ppm
3 Hour — 0.5 ppm
24 Hour 0.04 ppm 0.14 (for
certain areas)
Sulfur dioxidec
(SO2)
Annual — 0.030 ppm (for
certain areas)
Bronchoconstriction accompanied by symptoms which may include wheezing, shortness of breath and chest tightness, during exercise or physical activity in persons with asthma. Some population-based studies indicate that the mortality and morbidity effects associated with fine particles show a similar association with ambient sulfur dioxide levels. It is not clear whether the two pollutants act synergistically or one pollutant alone is the predominant factor.
Sulfur dioxide is a colorless, pungent gas. At levels greater than 0.5 ppm, the gas has a strong odor, similar to rotten eggs. Sulfur oxides (SOX) include sulfur dioxide and sulfur trioxide. Sulfuric acid is formed from sulfur dioxide, which can lead to acid deposition and can harm natural resources and materials. Although sulfur dioxide concentrations have been reduced to levels well below state and federal standards, further reductions are desirable because sulfur dioxide is a precursor to sulfate and PM10.
Human caused sources include fossil-fuel combustion, mineral ore processing, and chemical manufacturing. Volcanic emissions are a natural source of sulfur dioxide. The gas can also be produced in the air by dimethylsulfide and hydrogen sulfide. Sulfur dioxide is removed from the air by dissolution in water, chemical reactions, and transfer to soils and ice caps. The sulfur dioxide levels in the State are well below the maximum standards.
24 hour 50 µg/m3 150 µg/m3 Particulate matter (PM10) Mean 20 µg/m3 —
24 Hour — 35 µg/m3 Particulate matter (PM2.5) Annual 12 µg/m3 12.0
µg/m3
Visibility reducing particles
8 Hour See note belowd
- Short-term exposure (hours/days): irritation of the eyes, nose, throat; coughing; phlegm; chest tightness; shortness of breath; aggravate existing lung disease, causing asthma attacks and acute bronchitis; those with heart disease can suffer heart attacks and arrhythmias.
- Long-term exposure: reduced lung function; chronic bronchitis; changes in lung morphology; death.
Suspended particulate matter is a mixture of small particles that consist of dry solid fragments, droplets of water, or solid cores with liquid coatings. The particles vary in shape, size, and composition. PM10 refers to particulate matter that is between 2.5 and 10 microns in diameter, (one micron is one-millionth of a meter). PM2.5 refers to particulate matter that is 2.5 microns or less in diameter, about one-thirtieth the size of the average human hair.
Stationary sources include fuel or wood combustion for electrical utilities, residential space heating, and industrial processes; construction and demolition; metals, minerals, and petrochemicals; wood products processing; mills and elevators used in agriculture; erosion from tilled lands; waste disposal, and recycling. Mobile or transportation related sources are from vehicle exhaust and road dust. Secondary particles form from reactions in the atmosphere.

City of Fremont – Warm Springs/South Fremont Community Plan Draft EIR Air Quality/Greenhouse Gas Emissions
FirstCarbon Solutions 3.2-5 H:\Client (PN-JN)\4259\42590001\EIR\4 - Draft EIR\42590001 Sec03-02 Air Quailty.doc
Table 3.2-1 (cont.): Description of Air Pollutants
Air Pollutant Averaging
Time California Standard
Federal Standarda
Most Relevant Effects from Pollutant Exposure Properties Sources
Sulfates 24 Hour 25 µg/m3 — (a) Decrease in ventilatory function; (b) aggravation of asthmatic symptoms; (c) aggravation of cardio-pulmonary disease; (d) vegetation damage; (e) degradation of visibility; (f) property damage.
The sulfate ion is a polyatomic anion with the empirical formula SO42−. Sulfates occur in combination with metal and/or hydrogen ions. Many sulfates are soluble in water.
Sulfates are particulates formed through the photochemical oxidation of sulfur dioxide. In California, the main source of sulfur compounds is combustion of gasoline and diesel fuel.
30-day 1.5 µg/m3 —
Quarter — 1.5 µg/m3
Leade
Rolling 3-month
average
— 0.15 µg/m3
Lead accumulates in bones, soft tissue, and blood and can affect the kidneys, liver, and nervous system. It can cause impairment of blood formation and nerve conduction, behavior disorders, mental retardation, neurological impairment, learning deficiencies, and low IQs.
Lead is a solid heavy metal that can exist in air pollution as an aerosol particle component. Leaded gasoline was used in motor vehicles until around 1970. Lead concentrations have not exceeded state or federal standards at any monitoring station since 1982.
Lead ore crushing, lead-ore smelting, and battery manufacturing are currently the largest sources of lead in the atmosphere in the United States. Other sources include dust from soils contaminated with lead-based paint, solid waste disposal, and crustal physical weathering.
Vinyl chloride e
24 Hour 0.01 ppm — Short-term exposure to high levels of vinyl chloride in the air causes central nervous system effects, such as dizziness, drowsiness, and headaches. Epidemiological studies of occupationally exposed workers have linked vinyl chloride exposure to development of a rare cancer, liver angiosarcoma, and have suggested a relationship between exposure and lung and brain cancers.
Vinyl chloride, or chloroethene, is a chlorinated hydrocarbon and a colorless gas with a mild, sweet odor. In 1990, ARB identified vinyl chloride as a toxic air contaminant and estimated a cancer unit risk factor.
Most vinyl chloride is used to make polyvinyl chloride plastic and vinyl products, including pipes, wire and cable coatings, and packaging materials. It can be formed when plastics containing these substances are left to decompose in solid waste landfills. Vinyl chloride has been detected near landfills, sewage plants, and hazardous waste sites.

City of Fremont – Warm Springs/South Fremont Community Plan Draft EIR Air Quality/Greenhouse Gas Emissions
FirstCarbon Solutions 3.2-6 H:\Client (PN-JN)\4259\42590001\EIR\4 - Draft EIR\42590001 Sec03-02 Air Quailty.doc
Table 3.2-1 (cont.): Description of Air Pollutants
Air Pollutant Averaging
Time California Standard
Federal Standarda
Most Relevant Effects from Pollutant Exposure Properties Sources
Hydrogen sulfide
1 Hour 0.03 ppm — High levels of hydrogen sulfide can cause immediate respiratory arrest. It can irritate the eyes and respiratory tract and cause headache, nausea, vomiting, and cough. Long exposure can cause pulmonary edema.
Hydrogen sulfide (H2S) is a flammable, colorless, poisonous gas that smells like rotten eggs.
Manure, storage tanks, ponds, anaerobic lagoons, and land application sites are the primary sources of hydrogen sulfide. Anthropogenic sources include the combustion of sulfur containing fuels (oil and coal).
Volatile organic compounds (VOC)
There are no State or federal standards for VOCs because they are not classified as criteria pollutants.
Although health-based standards have not been established for VOCs, health effects can occur from exposures to high concentrations because of interference with oxygen uptake. In general, concentrations of VOCs are suspected to cause eye, nose, and throat irritation; headaches; loss of coordination; nausea; and damage to the liver, the kidneys, and the central nervous system. Many VOCs have been classified as toxic air contaminants.
Reactive organic gases (ROGs), or VOCs, are defined as any compound of carbon—excluding carbon monoxide, carbon dioxide, carbonic acid, metallic carbides or carbonates, and ammonium carbonate—that participates in atmospheric photochemical reactions. Although there are slight differences in the definition of ROGs and VOCs, the two terms are often used interchangeably.
Indoor sources of VOCs include paints, solvents, aerosol sprays, cleansers, tobacco smoke, etc. Outdoor sources of VOCs are from combustion and fuel evaporation. A reduction in VOC emissions reduces certain chemical reactions that contribute to the formulation of ozone. VOCs are transformed into organic aerosols in the atmosphere, which contribute to higher PM10 and lower visibility.
Benzene There are no ambient air quality standards for benzene.
Short-term (acute) exposure of high doses from inhalation of benzene may cause dizziness, drowsiness, headaches, eye irritation, skin irritation, and respiratory tract irritation, and at higher levels, loss of consciousness can occur. Long-term (chronic) occupational exposure of high doses has caused blood disorders, leukemia, and lymphatic cancer.
Benzene is a VOC. It is a clear or colorless light-yellow, volatile, highly flammable liquid with a gasoline-like odor. The EPA has classified benzene as a “Group A” carcinogen.
Benzene is emitted into the air from fuel evaporation, motor vehicle exhaust, tobacco smoke, and from burning oil and coal. Benzene is used as a solvent for paints, inks, oils, waxes, plastic, and rubber. Benzene occurs naturally in gasoline at one to two percent by volume. The primary route of human exposure is through inhalation.

City of Fremont – Warm Springs/South Fremont Community Plan Draft EIR Air Quality/Greenhouse Gas Emissions
FirstCarbon Solutions 3.2-7 H:\Client (PN-JN)\4259\42590001\EIR\4 - Draft EIR\42590001 Sec03-02 Air Quailty.doc
Table 3.2-1 (cont.): Description of Air Pollutants
Air Pollutant Averaging
Time California Standard
Federal Standarda
Most Relevant Effects from Pollutant Exposure Properties Sources
Diesel particulate matter (DPM)
There are no ambient air quality standards for DPM.
Some short-term (acute) effects of DPM exposure include eye, nose, throat, and lung irritation, coughs, headaches, light-headedness, and nausea. Studies have linked elevated particle levels in the air to increased hospital admissions, emergency room visits, asthma attacks, and premature deaths among those suffering from respiratory problems. Human studies on the carcinogenicity of DPM demonstrate an increased risk of lung cancer, although the increased risk cannot be clearly attributed to diesel exhaust exposure.
Diesel PM is a source of PM2.5—diesel particles are typically 2.5 microns and smaller. Diesel exhaust is a complex mixture of thousands of particles and gases that is produced when an engine burns diesel fuel. Organic compounds account for 80 percent of the total particulate matter mass, which consists of compounds such as hydrocarbons and their derivatives, and polycyclic aromatic hydrocarbons and their derivatives. Fifteen polycyclic aromatic hydrocarbons are confirmed carcinogens, a number of which are found in diesel exhaust.
Diesel exhaust is a major source of ambient particulate matter pollution in urban environments. Typically, the main source of DPM is from combustion of diesel fuel in diesel-powered engines. Such engines are in on-road vehicles such as diesel trucks, off-road construction vehicles, diesel electrical generators, and various pieces of stationary construction equipment.
Notes: ppm = parts per million (concentration) µg/m3 = micrograms per cubic meter Annual = Annual Arithmetic Mean 30-day = 30-day average Quarter = Calendar quarter a Federal standard refers to the primary national ambient air quality standard, or the levels of air quality necessary, with an adequate margin of safety to protect the public health. All
standards listed are primary standards except for 3-Hour SO2, which is a secondary standard. A secondary standard is the level of air quality necessary to protect the public welfare from any known or anticipated adverse effects of a pollutant.
b To attain the 1-hour nitrogen dioxide national standard, the 3-year average of the annual 98th percentile of the 1-hour daily maximum concentrations at each site must not exceed 100 parts per billion (0.100 ppm).
c On June 2, 2010, a new 1-hour SO2 standard was established and the existing 24-hour and annual primary standards were revoked. To attain the 1-hour national standard, the 3-year average of the annual 99th percentile of the 1-hour daily maximum concentrations at each site must not exceed 75 ppb. The 1971 SO2 national standards (24-hour and annual) remain in effect until one year after an area is designated for the 2010 standard, except that in areas designated nonattainment for the 1971 standards, the 1971 standards remain in effect until implementation plans to attain or maintain the 2010 standards are approved.
d Visibility reducing particles: In 1989, ARB converted both the general statewide 10-mile visibility standard and the Lake Tahoe 30-mile visibility standard to instrumental equivalents, which are “extinction of 0.23 per kilometer” and “extinction of 0.07 per kilometer” for the statewide and Lake Tahoe Air Basin standards, respectively.
e ARB has identified lead and vinyl chloride as “toxic air contaminants” with no threshold level of exposure for adverse health effects determined. These actions allow for the implementation of control measures at levels below the ambient concentrations specified for these pollutants.
Source of effects, properties, and sources: South Coast Air Quality Management District 2007a; California Environmental Protection Agency 2002; California Air Resources Board 2009; United States Environmental Protection Agency 2003, 2009a, 2009b, 2010, 2011a, and 2012; National Toxicology Program 2011a and 2011b. Source of standards: California Air Resources Board 2013c.

City of Fremont – Warm Springs/South Fremont Community Plan Air Quality/Greenhouse Gas Emissions Draft EIR
3.2-8 FirstCarbon Solutions H:\Client (PN-JN)\4259\42590001\EIR\4 - Draft EIR\42590001 Sec03-02 Air Quailty.doc
Local Air Quality
Meteorology acts on the emissions released into the atmosphere to produce pollutant concentrations. These airborne pollutant concentrations are measured throughout California at air quality monitoring sites. ARB operates a statewide network of monitors. Data from this network are supplemented with data collected by local air districts, other public agencies, and private contractors.
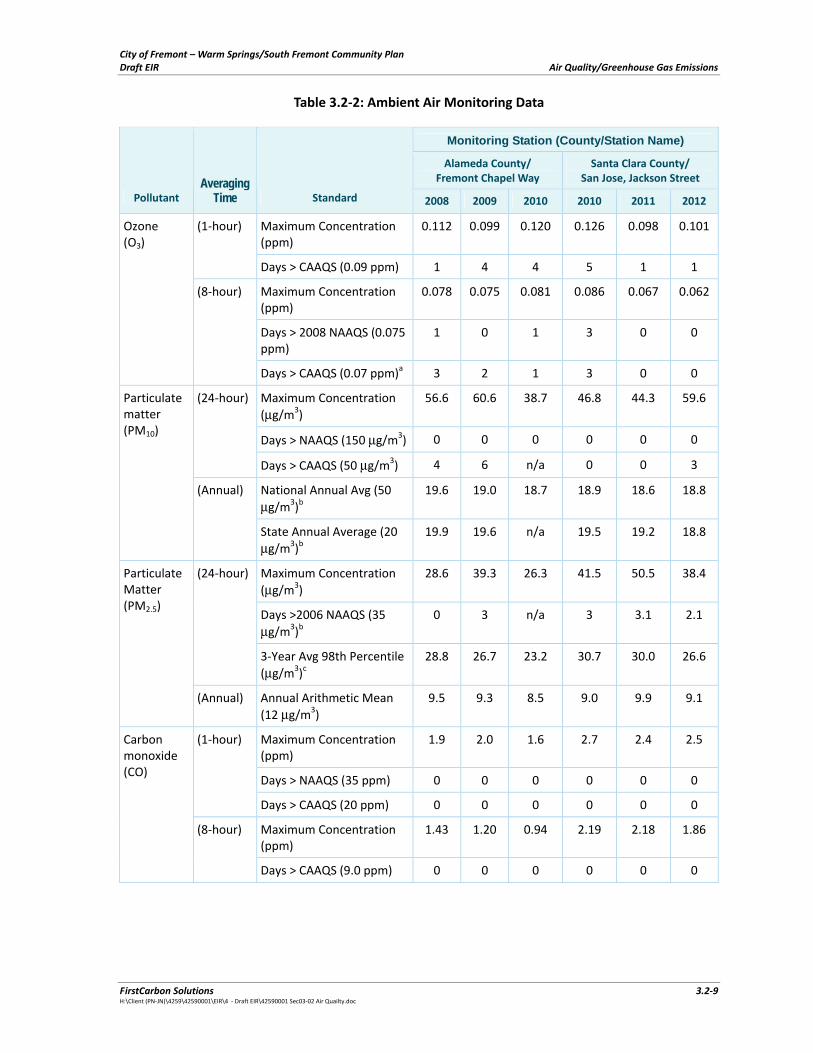
The air quality monitoring station closest to Fremont is the Fremont, Chapel Way Station, which is located approximately 2.5 miles north of the northern project boundary. The Chapel Way Station has been closed since 2011, but the complete monitored data for criteria pollutants is available from the station up to 2010. The nearest active ambient air quality monitoring station to the south of the project site is the San Jose, Jackson Street Station, which is located less than 10 miles south of the project boundary.
Table 3.2-2 summarizes the recorded ambient air data at the representative monitoring stations for years 2008 through 2012. As Table 3.2-2 shows, the recorded data show exceedances of the California standards for ozone (O3) (1-hour, and 8-hour), PM10 (24-hour and annual), and federal standards for 8-hour O3 and PM2.5 (24-hour and annual), on one or more occasions from 2008 through 2012. No exceedances of either the state or national standards were recorded for nitrogen dioxide (NO2), carbon monoxide (CO), and other criteria pollutants.
Local Sources of Air Pollution Exhaust gas from motor vehicles that travel along the nearby roadways constitute a major source of ambient air pollutants within the plan area. Nearby sources of air pollution include two interstate highways, I-880 and I-680, immediately adjacent to the western boundary and eastern boundary of the plan area, respectively; Mission Boulevard (State Route 262 [SR-262]), adjacent to the southern project boundary; and Auto Mall Parkway, approximately 1,000 feet north of the northernmost portion of project boundary. In addition, portions of the Union Pacific Railroad track and planned future BART track, as well as segments of Old Warm Springs Boulevard, pass through the Community Plan area. There are also several stationary sources located within and near the project site. There are stationary sources of air pollution within the Community Plan area that are also within 1,000 feet of the plan boundary. These include several existing and planned industrial and manufacturing facilities and the Union Pacific Railyard, located within the northwest portion of the plan area.
City of Fremont – Warm Springs/South Fremont Community Plan Draft EIR Air Quality/Greenhouse Gas Emissions
FirstCarbon Solutions 3.2-9 H:\Client (PN-JN)\4259\42590001\EIR\4 - Draft EIR\42590001 Sec03-02 Air Quailty.doc
Table 3.2-2: Ambient Air Monitoring Data
Monitoring Station (County/Station Name)
Alameda County/ Fremont Chapel Way
Santa Clara County/ San Jose, Jackson Street
Pollutant Averaging
Time Standard 2008 2009 2010 2010 2011 2012
Maximum Concentration (ppm)
0.112 0.099 0.120 0.126 0.098 0.101 (1-hour)
Days > CAAQS (0.09 ppm) 1 4 4 5 1 1
Maximum Concentration (ppm)
0.078 0.075 0.081 0.086 0.067 0.062
Days > 2008 NAAQS (0.075 ppm)
1 0 1 3 0 0
Ozone (O3)
(8-hour)
Days > CAAQS (0.07 ppm)a 3 2 1 3 0 0
Maximum Concentration (μg/m3)
56.6 60.6 38.7 46.8 44.3 59.6
Days > NAAQS (150 μg/m3) 0 0 0 0 0 0
(24-hour)
Days > CAAQS (50 μg/m3) 4 6 n/a 0 0 3
National Annual Avg (50 μg/m3)b
19.6 19.0 18.7 18.9 18.6 18.8
Particulate matter (PM10)
(Annual)
State Annual Average (20 μg/m3)b
19.9 19.6 n/a 19.5 19.2 18.8
Maximum Concentration (μg/m3)
28.6 39.3 26.3 41.5 50.5 38.4
Days >2006 NAAQS (35 μg/m3)b
0 3 n/a 3 3.1 2.1
(24-hour)
3-Year Avg 98th Percentile (μg/m3)c
28.8 26.7 23.2 30.7 30.0 26.6
Particulate Matter (PM2.5)
(Annual) Annual Arithmetic Mean (12 μg/m3)
9.5 9.3 8.5 9.0 9.9 9.1
Maximum Concentration (ppm)
1.9 2.0 1.6 2.7 2.4 2.5
Days > NAAQS (35 ppm) 0 0 0 0 0 0
(1-hour)
Days > CAAQS (20 ppm) 0 0 0 0 0 0
Maximum Concentration (ppm)
1.43 1.20 0.94 2.19 2.18 1.86
Carbon monoxide (CO)
(8-hour)
Days > CAAQS (9.0 ppm) 0 0 0 0 0 0

City of Fremont – Warm Springs/South Fremont Community Plan Air Quality/Greenhouse Gas Emissions Draft EIR
3.2-10 FirstCarbon Solutions H:\Client (PN-JN)\4259\42590001\EIR\4 - Draft EIR\42590001 Sec03-02 Air Quailty.doc
Table 3.2-2 (cont.): Ambient Air Monitoring Data
Monitoring Station (County/Station Name)
Alameda County/ Fremont Chapel Way
Santa Clara County/ San Jose, Jackson Street
Pollutant Averaging
Time Standard 2008 2009 2010 2010 2011 2012
Maximum Concentration (ppb)
62 51 55 64 61 67 (1-hour)
Days > NAAQS (100 ppb)d 0 0 0 0 0 0
Nitrogen dioxide (NO2)
(Annual) Annual Average (30 ppb) 14 13 n/a 14 14 13
Notes: Exceedances shown in bold; NAAQS – national ambient air quality standard; CAAQS – California ambient air quality standard; > – concentration above; ppm – parts per million; ppb – parts per billion; μg/m3 – micrograms per cubic meter; Avg. – average; n/a – not available a The 8-hour national ozone standard is attained when the fourth highest concentration in a year, averaged over three
years, is equal to or less than the national standard of 0.075 ppm (effective May 27, 2008). b In 2006, EPA revoked NAAQS for annual PM10, and tightened the 24-hour PM2.5 standard from the previous level of 65
μg/m3. The updated area designation for new PM2.5 standard value became effective in October 2009. c Attainment condition for 24-hour PM2.5 is that the 3-year average of the 98th percentile of 24-hour concentrations at
each monitor in an area must not exceed the standard (35 μg/m3) d State NO2 standard was amended on February 22, 2007, to lower the 1-hour standard to 0.18 ppm (180 ppb) and
establish a new annual standard of 0.030 ppm (30 ppb). The latest national NO2 standard was issued in units of part per billion (ppb), while California standards are in units of par per million (ppm). The monitored NO2 data from ARB site, are reported in ppb, therefore the values in the table are also provided in ppb.
Source: ARB, 2013—http://www.arb.ca.gov/adam/; EPA, 2013—http://www.epa.gov/airdata/.
Sensitive Receptors
Some population groups such as children, the elderly, and persons with pre-existing respiratory or cardiovascular illness are more sensitive to air pollution than others. BAAQMD defines sensitive receptor as residential areas, hospitals and long-term health care facilities, rehabilitation centers, convalescent centers and retirement homes, elementary schools, daycare centers, playgrounds, athletic facilities and parks. Residential areas are considered sensitive to air pollution because residents, including children and the elderly, tend to be at home for extended periods of time, resulting in sustained exposure to pollutants. The project would construct sensitive receptors (residences) within the plan area. The nearest existing sensitive receptors include:
Residential uses • Single-family homes, located east of I-680, which serves as the eastern boundary of the
Community Plan area.
• Medium-density apartments, located south of the southern boundary of the plan area (Mission Boulevard [SR 262]).

City of Fremont – Warm Springs/South Fremont Community Plan Draft EIR Air Quality/Greenhouse Gas Emissions
FirstCarbon Solutions 3.2-11 H:\Client (PN-JN)\4259\42590001\EIR\4 - Draft EIR\42590001 Sec03-02 Air Quailty.doc
Schools/Daycare The nearest elementary schools and childcare facilities, and their approximate distance from project site include:
• Kindango preschool – 0.1 mile southeast • James Leitch Elementary – 0.45 mile southeast • Fred Weibel Elementary – 0.4 mile east • Kindango preschool – 0.2 mile north • Warm Springs Elementary – 0.5 mile south
Parks and Recreation Areas The nearest parks include:
• Arroyo Agua Caliente Park – 0.3 mile east (east of the northern portion of project site) • Warm Springs Park – 0.6 mile southeast • Booster Park – one mile southeast
Attainment Status
Air basins where federal or state ambient air quality standards are exceeded are referred to as “nonattainment” areas. If standards are met, the area is designated as an “attainment” area. If there is inadequate or inconclusive data to make a definitive attainment designation, they are considered “unclassified.” National nonattainment areas are considered severe, serious, or moderate as a function of deviation from standards.
As shown in Table 3.2-3, the Air Basin is in nonattainment for the national and state 8-hour ozone standards, state 1-hour ozone standard, state 24-hour and annual PM10 standards, and state annual PM2.5 standard. This means that the area experiences poor air quality at times.
Table 3.2-3: Air Basin Attainment Status
Pollutant Averaging Time State Status National Status
1-hour Nonattainment Not Applicable1 Ozone
8-hour Nonattainment Nonattainment2
Carbon monoxide 1-hour and 8-hour Attainment Attainment3
1-hour Attainment Unclassified4 Nitrogen dioxide
Annual No state classification Attainment
24-hour Attainment Attainment
1-hour Attainment Attainment
Sulfur dioxide5
Annual No state standard Attainment

City of Fremont – Warm Springs/South Fremont Community Plan Air Quality/Greenhouse Gas Emissions Draft EIR
3.2-12 FirstCarbon Solutions H:\Client (PN-JN)\4259\42590001\EIR\4 - Draft EIR\42590001 Sec03-02 Air Quailty.doc
Table 3.2-3 (cont.): Air Basin Attainment Status
Pollutant Averaging Time State Status National Status
24-hour Nonattainment Unclassified PM10
Annual Nonattainment No federal standard6
24-hour No state standard Nonattainment7 PM2.5
Annual Nonattainment Attainment
Notes: 1 The national 1-hour ozone standard was revoked by EPA on June 15, 2005. 2 Final designations effective July 20, 2012. 3 In April 1998, the Bay Area was redesignated to attainment for the national 8-hour carbon monoxide standard. 4 To attain this standard, the 3-year average of the 98th percentile of the daily maximum 1-hour average at each
monitor within an area must not exceed 0.100ppm (effective January 22, 2010). 5 On June 2, 2010, the EPA established a new 1-hour SO2 standard, effective August 23, 2010, which is based on the 3-
year average of the annual 99th percentile of 1-hour daily maximum concentrations. The existing 0.030-ppm annual and 0.14-ppm 24-hour SO2 National Ambient Air Quality Standards however must continue to be used until one year following EPA initial designations of the new 1-hour SO2 National Ambient Air Quality Standards. EPA was expected to designate areas by June 2012; however, in a February 2013 letter to ARB, EPA indicated that it had extended the deadline to June 2013.
6 EPA revoked the annual PM10 standard on September 21, 2006. 7 EPA lowered the 24-hour PM2.5 standard from 65 µg/m3 to 35 µg/m3 in 2006. Bay Area levels were just over the
national 24-hour PM2.5 standard of 35 µg/m3 based on data for the three-year cycle 2006-2008. This triggered the requirement for the Bay Area to prepare a SIP submittal to demonstrate how the region would attain the standard. However, data for both the 2008-2010 and the 2009-2011 cycles showed that Bay Area PM levels currently meet the standard. On October 29, 2012, EPA issued a proposed rule-making to determine that the Bay Area now attains the 24-hour PM2.5 national standard. Written comments on the proposed rule-making are due to EPA by November 28, 2012. When the proposed rule-making is finalized, key SIP requirements to demonstrate how a region will achieve the standard will be suspended as long as monitoring data continues to show that the Bay Area attains the standard. The Bay Area will continue to be designated as “nonattainment” for the national 24-hour PM2.5 standard until the Air District elects to submit a “redesignation request” and a “maintenance plan” to EPA, and EPA approves the proposed redesignation.
Source: California Air Resources Board, 2013.
Climate Change
Gases that trap heat in the atmosphere are referred to as greenhouse gases (GHGs). The effect is analogous to the way a greenhouse retains heat. Common GHGs include water vapor, carbon dioxide, methane, nitrous oxides, chlorofluorocarbons, hydrofluorocarbons, perfluorocarbons, sulfur hexafluoride, ozone, and aerosols. Natural processes and human activities emit GHGs. The presence of GHGs in the atmosphere affects the earth’s temperature. Without the natural heat trapping effect of GHGs, the earth’s surface would be about 34 degrees Celsius (°C) cooler (about 61 degrees Fahrenheit (°F) cooler). However, it is believed that emissions from human activities have elevated the concentration of these gases in the atmosphere beyond the level of naturally occurring concentrations.
Increased GHGs results in an increased greenhouse effect and could result in changes to the climate. The United Nations Intergovernmental Panel on Climate Change constructed several emission trajectories of GHGs needed to stabilize global temperatures and climate change impacts. The Intergovernmental Panel on Climate Change predicted that global mean temperature change from

City of Fremont – Warm Springs/South Fremont Community Plan Draft EIR Air Quality/Greenhouse Gas Emissions
FirstCarbon Solutions 3.2-13 H:\Client (PN-JN)\4259\42590001\EIR\4 - Draft EIR\42590001 Sec03-02 Air Quailty.doc
1990 to 2100, given six scenarios, could range from 1.1°C to 6.4°C (2.0°F to 11.5°F). Regardless of analytical methodology, global average temperatures and sea levels are expected to rise under all scenarios.
Climate change is driven by forcings and feedbacks. Radiative forcing is the difference between the incoming energy and outgoing energy in the climate system. Positive forcing tends to warm the surface while negative forcing tends to cool it. Radiative forcing values are typically expressed in watts per square meter. A feedback is a climate process that can strengthen or weaken a forcing. For example, when ice or snow melts, it reveals darker land underneath which absorbs more radiation and causes more warming. The global warming potential is the potential of a gas or aerosol to trap heat in the atmosphere. The global warming potential of a gas is essentially a measurement of the radiative forcing of a GHG compared with the reference gas, carbon dioxide.
Individual GHG compounds have varying global warming potential and atmospheric lifetimes. Carbon dioxide, the reference gas for global warming potential, has a global warming potential of one. The calculation of the carbon dioxide equivalent is a consistent methodology for comparing GHG emissions since it normalizes various GHG emissions to a consistent metric. Methane’s warming potential of 21 indicates that methane has a 21 times greater warming affect than carbon dioxide on a molecule per molecule basis. A carbon dioxide equivalent is the mass emissions of an individual GHG multiplied by its global warming potential.
GHGs as defined by Assembly Bill (AB) 32 include the gases shown in Table 3.2-4.
Table 3.2-4: Description of Major Greenhouse Gases
Greenhouse Gas Description and Physical Properties Sources
Nitrous oxide Nitrous oxide (laughing gas) is a colorless GHG. It has a lifetime of 114 years. Its global warming potential is 310.
Microbial processes in soil and water, fuel combustion, and industrial processes.
Methane Methane is a flammable gas and is the main component of natural gas. It has a lifetime of 12 years. Its global warming potential is 21.
Methane is extracted from geological deposits (natural gas fields). Other sources are landfills, fermentation of manure, and decay of organic matter.
Carbon dioxide Carbon dioxide (CO2) is an odorless, colorless, natural GHG. Carbon dioxide’s global warming potential is 1. The concentration in 2005 was 379 parts per million (ppm), which is an increase of about 1.4 ppm per year since 1960.
Natural sources include decomposition of dead organic matter; respiration of bacteria, plants, animals, and fungus; evaporation from oceans; and volcanic outgassing. Anthropogenic sources are from burning coal, oil, natural gas, and wood.

City of Fremont – Warm Springs/South Fremont Community Plan Air Quality/Greenhouse Gas Emissions Draft EIR
3.2-14 FirstCarbon Solutions H:\Client (PN-JN)\4259\42590001\EIR\4 - Draft EIR\42590001 Sec03-02 Air Quailty.doc
Table 3.2-4 (cont.): Description of Major GHGs
Greenhouse Gas Description and Physical Properties Sources
Chlorofluorocarbons These are gases formed synthetically by replacing all hydrogen atoms in methane or ethane with chlorine and/or fluorine atoms. They are nontoxic, nonflammable, insoluble, and chemically unreactive in the troposphere (the level of air at the earth’s surface). Global warming potentials range from 3,800 to 8,100.
Chlorofluorocarbons were synthesized in 1928 for use as refrigerants, aerosol propellants, and cleaning solvents. They destroy stratospheric ozone. The Montreal Protocol on Substances that Deplete the Ozone Layer prohibited their production in 1987.
Hydrofluorocarbons Hydrofluorocarbons are a group of GHGs containing carbon, chlorine, and at least one hydrogen atom. Global warming potentials range from 140 to 11,700.
Hydrofluorocarbons are synthetic manmade chemicals used as a substitute for chlorofluorocarbons in applications such as automobile air conditioners and refrigerants.
Perfluorocarbons Perfluorocarbons have stable molecular structures and only break down by ultraviolet rays about 60 kilometers above Earth’s surface. Because of this, they have long lifetimes, between 10,000 and 50,000 years. Global warming potentials range from 6,500 to 9,200.
Two main sources of perfluorocarbons are primary aluminum production and semiconductor manufacturing.
Sulfur hexafluoride Sulfur hexafluoride is an inorganic, odorless, colorless, and nontoxic, nonflammable gas. It has a lifetime of 3,200 years. It has a high global warming potential, 23,900.
This gas is manmade and used for insulation in electric power transmission equipment, in the magnesium industry, in semiconductor manufacturing, and as a tracer gas.
Sources: Compiled from a variety of sources, primarily Intergovernmental Panel on Climate Change 2007a and 2007b.
Greenhouse Gas Emissions Inventory and Trends Emissions of GHGs worldwide were approximately 49,000 million metric tons of carbon dioxide equivalents (MMTCO2e) in 2004, and GHG emissions in the U.S. were 7,074.4 MMTCO2e.
California is the second largest contributor of GHGs in the U.S. and the sixteenth largest in the world. In 2004, California produced 500 MMTCO2e of GHG emissions, including emissions from imported electricity and excluding combustion of international fuels and carbon sinks or storage, which is approximately seven percent of U.S. emissions. According to ARB’s recent GHG inventory for the State, the single largest source of GHGs in California is on-road transportation, contributing approximately 38 percent of the State’s total GHGs emissions in 2010 and 2011. Electricity generation (both in and out of state) is the second largest source, contributing 25 percent of the State’s GHG emissions. The inventory for California’s GHG emissions between 2000 and 2008, by even years, is presented in Table 3.2-5.

City of Fremont – Warm Springs/South Fremont Community Plan Draft EIR Air Quality/Greenhouse Gas Emissions
FirstCarbon Solutions 3.2-15 H:\Client (PN-JN)\4259\42590001\EIR\4 - Draft EIR\42590001 Sec03-02 Air Quailty.doc
Table 3.2-5: California Greenhouse Gas Inventory 2000-2011
Emissions MMTCO2e
Main Sector 1 2000 2002 2004 2006 2008 2010 2011
Agriculture 29.04 32.39 32.57 33.95 33.88 31.68 32.24
Commercial 13.99 14.18 14.15 14.56 15.56 15.75 15.62
Electricity Generation2 104.86 108.65 115.20 104.54 120.15 90.09 86.57
High GWP3 7.11 7.25 8.53 9.86 11.48 14.15 15.17
Industrial 95.81 94.42 95.73 91.88 89.27 91.00 93.24
Recycling and Waste4 6.14 6.20 6.33 6.51 6.69 6.94 7.00
Residential 29.65 28.88 29.45 28.54 29.03 29.38 29.85
Transportation – On-road 162.97 169.72 171.83 172.56 162.30 157.57 155.11
Transportation – Non-road5 13.32 14.14 15.38 16.78 14.86 13.04 13.31
Total 462.90 475.82 489.18 479.18 483.22 449.59 448.11
Notes: 1 Excludes military sector, aviation and international marine bunker fuel; 2 Includes In-state electricity generation and imported electricity; 3 Includes substitutes for ozone depleting solvents, SF6 losses from electricity grids and semiconductor
manufacturing; 4 Consists of emissions from landfills and composting process; 5 Includes equipment used in construction, mining, oil drilling, industrial and airport ground operations.
Source: California Air Resources Board, 2013.
In addition to the state-level GHG emission inventory that was prepared by ARB, BAAQMD prepared a GHG emissions inventory for the Air Basin, as well as for each county or portion of county therein. In 2007, the San Francisco Air Basin produced 96 MMTCO2e of GHG emissions. Of that amount, Alameda County produced 16 MMTCO2e. The emission inventory included direct and indirect GHG emissions due to human activities. The inventory estimates direct and indirect emissions for the base year of 2007 from major GHGs, which include carbon dioxide, methane, nitrous oxides, hydrofluorocarbons, perfluorocarbons, and sulfur hexafluoride.
The activity data reflects current industrial activity, motor vehicle travel, and economic and population growth. Most of the methodologies for calculating emissions remain the same as the prior year 2002 inventory prepared by BAAQMD, with some exceptions. The Air Basin and Alameda County GHG inventories for 2007 are presented in Table 3.2-6.

City of Fremont – Warm Springs/South Fremont Community Plan Air Quality/Greenhouse Gas Emissions Draft EIR
3.2-16 FirstCarbon Solutions H:\Client (PN-JN)\4259\42590001\EIR\4 - Draft EIR\42590001 Sec03-02 Air Quailty.doc
Table 3.2-6: Air Basin and Alameda County Greenhouse Gas Inventories
San Francisco Bay Area Air Basin Alameda County
Main Sector* GHG Emissions
MMTCO2e Percent of
Annual Inventory GHG Emissions
MMTCO2e Percent of
Annual Inventory
Agriculture/Farming 1.11 1.2% 0.11 0.7%
Industrial/Commercial 34.86 36.4% 3.29 21.0%
Electricity/Co-Generation* 15.20 15.9% 2.00 12.8%
Off-Road Equipment 2.92 3.1% 0.57 3.6%
Residential Fuel Usage 6.82 7.1% 1.34 8.6%
Transportation 34.87 36.4% 8.35 53.3%
Total 95.78 100.0% 15.66 100.0%
Note: * Includes emissions from imported electricity Source: Bay Air Quality Management District, 2010.
The inventory found that the majority of GHG emissions in the Bay Area were generated by the transportation sector and industrial and commercial sector, with each contributing approximately 36 percent of the total emissions inventory. In 2007, Alameda County emitted 15.66 million MTCO2e, which is 16 percent of the GHG emissions in the Air Basin.
The City of Fremont completed a GHG inventory for the year 2005, as well as projected emissions for 2020, as contained within the City of Fremont Climate Action Plan adopted November 2012. In 2005, the City of Fremont produced 1.7 MMTCO2e of GHG emissions. The City’s 2005 GHG inventory is provided in Table 3.2-7. The table shows the majority of GHGs within the City of Fremont are generated by the transportation sector, followed by energy use for commercial and industrial uses.
Table 3.2-7: Fremont GHG Inventory by Sector, 2005
Community Sector* Emissions MTCO2e Percent of Inventory
Energy Use: Residential 240,000 14.4%
Energy Use: Commercial & Industrial 360,000 21.6%
Transportation 1,005,300 60.4%
Waste 58,000 3.5%
Total 1,663,300 100.0%
Source: City of Fremont, 2008; City of Fremont, 2012.

City of Fremont – Warm Springs/South Fremont Community Plan Draft EIR Air Quality/Greenhouse Gas Emissions
FirstCarbon Solutions 3.2-17 H:\Client (PN-JN)\4259\42590001\EIR\4 - Draft EIR\42590001 Sec03-02 Air Quailty.doc
3.2.3 - Regulatory Framework Air pollutants are regulated at the national, state, and air basin level; each agency has a different level of regulatory responsibility. The EPA regulates at the national level. ARB regulates at the state level and BAAQMD regulates at the Air Basin level.
Federal and State
The EPA handles global, international, national, and interstate air pollution issues and policies. The EPA sets national vehicle and stationary source emission standards, oversees approval of all State Implementation Plans, provides research and guidance for air pollution programs, and sets National Ambient Air Quality Standards, also known as federal standards or national standards. There are national standards for six common air pollutants, called criteria air pollutants, which were identified from provisions of the Clean Air Act of 1970. The criteria pollutants are:
• Ozone • Particulate matter (PM10 and PM2.5) • Nitrogen dioxide • Carbon monoxide (CO) • Lead • Sulfur dioxide
The national standards were set to protect public health, including that of sensitive individuals; thus, the standards continue to change as more medical research is available regarding the health effects of the criteria pollutants. Primary national standards are the levels of air quality necessary, with an adequate margin of safety, to protect public health, as discussed in Ambient Air Quality Standards summary prepared by ARB.
A State Implementation Plan is a document prepared by each state describing existing air quality conditions and measures that will be followed to attain and maintain national standards. The State Implementation Plan for the State of California is administered by ARB, which has overall responsibility for statewide air quality maintenance and air pollution prevention. ARB also administers California Ambient Air Quality Standards for the 10 air pollutants designated in the California Clean Air Act. The 10 state air pollutants are the six national standards listed above as well as the following: visibility-reducing particulates, hydrogen sulfide, sulfates, and vinyl chloride.
The national and state ambient air quality standards, the most relevant effects, the properties, and sources of the pollutants were previously summarized in Table 3.2-1.
California Greenhouse Gas Regulation The State has enacted several key pieces of regulation, some of which are discussed as follows.
AB 32. In 2006, the California State Legislature enacted AB 32, the California Global Warming Solutions Act of 2006. AB 32 focuses on reducing GHG emissions in California. GHGs as defined under AB 32 include carbon dioxide, methane, nitrous oxide, hydrofluorocarbons, perfluorocarbons, and sulfur hexafluoride. AB 32 requires that GHGs emitted in California be reduced to 1990 levels by

City of Fremont – Warm Springs/South Fremont Community Plan Air Quality/Greenhouse Gas Emissions Draft EIR
3.2-18 FirstCarbon Solutions H:\Client (PN-JN)\4259\42590001\EIR\4 - Draft EIR\42590001 Sec03-02 Air Quailty.doc
the year 2020. ARB is the state agency charged with monitoring and regulating sources of GHG emissions that cause global warming in order to reduce them. AB 32 states the following:
Global warming poses a serious threat to the economic well-being, public health, natural resources, and the environment of California. The potential adverse impacts of global warming include the exacerbation of air quality problems, a reduction in the quality and supply of water to the state from the Sierra snowpack, a rise in sea levels resulting in the displacement of thousands of coastal businesses and residences, damage to marine ecosystems and the natural environment, and an increase in the incidences of infectious diseases, asthma, and other human health-related problems.
ARB approved the 1990 GHG emissions level of 427 million metric tons of carbon dioxide equivalent (MMTCO2e) on December 6, 2007. Therefore, emissions generated in California in 2020 are required to be equal to or less than 427 MMTCO2e. Emissions in 2020 in a “business as usual” scenario are estimated to be 596 MMTCO2e.
ARB approved the Climate Change Scoping Plan in December 2008. The Scoping Plan contains a set of measures designed to reduce the State’s emissions to 1990 levels by the year 2020. The Scoping Plan identifies recommended measures for multiple GHG emission sectors and the associated emission reductions needed to achieve the year 2020 emissions target—each sector has a different emission reduction target. Most of the measures target the transportation and electricity sectors.
Bay Area Air Quality Management District
BAAQMD regulates air quality in the Air Basin, which consists of the entirety of Alameda, Contra Costa, Marin, Napa, San Francisco, San Mateo, and Santa Clara counties; the western portion of Solano County; and the southern portion of Sonoma County. BAAQMD is responsible for controlling and permitting industrial pollution sources (such as power plants, refineries, and manufacturing operations) and widespread, areawide sources (such as bakeries, dry cleaners, service stations, and commercial paint applicators), and for adopting local air quality plans (AQPs) and rules.
BAAQMD updated their CEQA Air Quality Guidelines (Guidelines) in June 2010 to include new thresholds of significance (2010 Thresholds). BAAQMD’s Guidelines were further updated in May 2011. The 2010 Thresholds included new thresholds of significance for plan-level GHGs, and risks and hazards.
On March 5, 2012, the Alameda County Superior Court issued a judgment finding that BAAQMD had failed to comply with CEQA when it adopted the 2010 Thresholds. The Court did not determine whether the 2010 Thresholds were valid on the merits, but found that the adoption of the 2010 Thresholds was a project under CEQA. The Court issued a writ of mandate ordering BAAQMD to set aside the 2010 Thresholds and cease dissemination of them until they had complied with CEQA. BAAQMD appealed the Alameda County Superior Court’s decision and the case went to the Court of Appeal, First Appellate District. The Court of Appeals has ruled that BAAQMD’s adoption of new or

City of Fremont – Warm Springs/South Fremont Community Plan Draft EIR Air Quality/Greenhouse Gas Emissions
FirstCarbon Solutions 3.2-19 H:\Client (PN-JN)\4259\42590001\EIR\4 - Draft EIR\42590001 Sec03-02 Air Quailty.doc
revised thresholds of significance are not a ‘project’ under CEQA and, therefore, are not required to comply with CEQA requirements.
After the Alameda County Superior Court’s Decision, BAAQMD stopped recommending the 2010 Thresholds be used as a generally applicable measure of a project’s significant air quality impacts. BAAQMD released a new version of their Guidelines in May 2012 in which the 2010 Thresholds were removed. BAAQMD, however, recommends that lead agencies determine appropriate air quality thresholds of significance based on substantial evidence in the record.
Air Quality Plans The latest AQP in the Basin is the 2010 Clean Air Plan, which provides the following:
• Review progress in improving Bay Area air quality to date.
• Establish a control strategy including “all feasible measures” to achieve state ozone standards by the earliest practicable date and reduce transport of ozone precursors to neighboring air basins.
• Address ozone, particulate matter, air toxics, and GHG emissions in a single integrated plan. AQPs are required to address transportation control measures requirements of the federal Clean Air Act and California Clean Air Act. Transportation control measures are defined as “any strategy to reduce vehicle trips, vehicle use, vehicle miles traveled (VMT), vehicle idling, or traffic congestion for the purpose of reducing motor vehicle emissions.” The Bay Area has extensive experience with developing and implementing transportation control measures. The first regional plan prepared pursuant to the California Clean Air Act, the 1991 Clean Air Plan, included 23 transportation control measures to meet state planning requirements (state transportation control measures). Plan updates in 1994 and 1997 included revisions to the transportation control measures.
Metropolitan Transportation Commission and Association of Bay Area Governments
In July 2013, the Metropolitan Transportation Commission (MTC) and Association of Bay Area Governments (ABAG) jointly approved Plan Bay Area, which includes the region’s Sustainable Communities Strategy and the 2040 Regional Transportation Plan, and the associated Final EIR. Two of the ten “targets” of Plan Bay Area address the requirements of Senate Bill 375, “The California Sustainable Communities and Climate Protection Act of 2008” (Steinberg).
The first two targets are required by Senate Bill 375, and address the respective goals of climate protection and adequate housing:
• Reduce per-capita carbon dioxide emissions from cars and light-duty trucks by seven percent by 2020 and by 15 percent by 2035.
• House 100 percent of the region’s projected 25-year growth by income level (very-low, low, moderate, above-moderate), without displacing current low-income residents.

City of Fremont – Warm Springs/South Fremont Community Plan Air Quality/Greenhouse Gas Emissions Draft EIR
3.2-20 FirstCarbon Solutions H:\Client (PN-JN)\4259\42590001\EIR\4 - Draft EIR\42590001 Sec03-02 Air Quailty.doc
The plan area is identified in Plan Bay Area and associated support documents as a Priority Development Area (PDA). PDAs are existing neighborhoods nominated by local jurisdictions as appropriate places to concentrate future growth that will support the day-to-day needs of residents and workers in a pedestrian-friendly environment served by transit.
A total of four lawsuits have been filed against Plan Bay Area. All four lawsuits were filed with the Alameda County Superior Court and include three suits filed in August 2013 and one suit filed in October 2013. The August lawsuits were filed by (1) Bay Area Citizens, (2) Communities for a Better Environment and the Sierra Club, and (3) the Building Industry Association of the Bay Area. The October lawsuit was filed by the Post-Sustainability Institute. In the Post-Sustainability Institute lawsuit, the plaintiff claims Plan Bay Area violates private property rights as well as CEQA requirements.
Local
City of Fremont General Plan The City of Fremont General Plan establishes the following goals and policies that are relevant to air quality and GHG emissions:
• Safety Policy 10-3.6 to evaluate impact of sea level rise on proposed development in areas of the City subject to flooding.
• Land Use Policies 2-1.7 through 2-1.11 promoting Transit Oriented Development (TOD).
• Land Use Policy 2-3.8 promoting higher intensities near transit.
• Community Character Policy 4-4.1 promoting complete streets concepts.
• Public Facilities policies regarding increasing waste diversion and recycling and moving towards zero waste.
• Conservation policies regarding green buildings standards, promoting building retrofits, and supporting innovative financing mechanisms for energy conservation.
• Mobility policies promoting public solar plug-in hybrid fueling stations, improved public transit, and promoting walking and cycling as alternatives to driving.
• Conservation policies regarding use of water-efficient landscaping and other water conservation measures.
• Conservation policies to promote use of reclaimed water.
• Parks and Recreation policies related to use of artificial turf where feasible.
• Public Facilities policies to reduce water usage in City facilities.
• Community Character policies to expand the urban forest.
• Mobility and Land Use policies promoting connectivity between neighborhoods.

City of Fremont – Warm Springs/South Fremont Community Plan Draft EIR Air Quality/Greenhouse Gas Emissions
FirstCarbon Solutions 3.2-21 H:\Client (PN-JN)\4259\42590001\EIR\4 - Draft EIR\42590001 Sec03-02 Air Quailty.doc
Climate Action Plan In 2008, the City of Fremont prepared a 2005 baseline emissions inventory of GHGs for the City, as well as adopted an emission reduction goal of 25 percent by 2020 from the 2005 baseline. The City’s emissions goal is calculated to be 1.2 MMTCO2e for citywide emissions. This amount is approximately 730,000 MTCO2e less than the City’s projected 2020 emissions.
The 2005 baseline was then updated and included in the City’s Climate Action Plan, adopted in November 2012. The Climate Action Plan contains a mitigation strategy targeting land use and mobility, energy consumption, solid waste, water, and municipal services and operations. The Climate Action Plan also contains a chapter dedicated to adapting to the effects of climate change. As provided in the Climate Action Plan, the document does not adhere to BAAQMD’s Guidelines for a “qualified” climate action plan. Rather, the Climate Action Plan includes implementation actions for guiding the community and the City organization in efforts to reduce GHG emissions. The Climate Action Plan is intended to be updated and refined every five years as best practices evolve and quantitative approaches to the preparation of GHG inventories and modeling of emission reduction actions become more sophisticated.
3.2.4 - Methodology The purpose of BAAQMD’s Guidelines is to assist lead agencies in evaluating air quality impacts of projects and plans proposed in the Basin. The Guidelines contain guidance on how to determine the significance of a project’s emissions of GHGs. This analysis follows the guidance in the Guidelines where appropriate. Based on substantial evidence in the record, BAAQMD’s 2010 Thresholds for plan-level impacts were utilized for this document. To the degree applicable, the 2011 Guidelines (which contain the 2010 Thresholds) were used in the impact analysis.
3.2.5 - Thresholds of Significance
CEQA
Air Quality According to Appendix G, Environmental Checklist, of the CEQA Guidelines, air quality impacts resulting from the implementation of the proposed project would be considered significant if the project would:
a) Conflict with or obstruct implementation of the applicable air quality plan,
b) Violate any air quality standard or contribute substantially to an existing or projected air quality violation,
c) Result in a cumulatively considerable net increase of any criteria pollutant for which the project region is non-attainment under an applicable federal or state ambient air quality standard (including releasing emissions, which exceed quantitative thresholds for ozone precursors),
d) Expose sensitive receptors to substantial pollutant concentrations, or
e) Create objectionable odors affecting a substantial number of people.

City of Fremont – Warm Springs/South Fremont Community Plan Air Quality/Greenhouse Gas Emissions Draft EIR
3.2-22 FirstCarbon Solutions H:\Client (PN-JN)\4259\42590001\EIR\4 - Draft EIR\42590001 Sec03-02 Air Quailty.doc
Greenhouse Gas Emissions According to Appendix G, Environmental Checklist, of the CEQA Guidelines, impacts from GHG emissions would be considered significant if the project would:
a) Generate GHG emissions, either directly or indirectly, that may have a significant impact on the environment, or
b) Conflict with any applicable plan, policy or regulation of an agency adopted for the purpose of reducing the emissions of GHGs.
3.2.6 - Project Impacts and Mitigation Measures This section discusses potential impacts associated with the development of the project and provides mitigation measures where appropriate.
Air Quality Plan Consistency
Impact AIR-1: Implementation of the Community Plan may conflict with or obstruct implementation of the applicable air quality plan.
Impact Analysis BAAQMD’s CEQA Air Quality Guidelines (Guidelines) indicate that the threshold of significance for operational-related criteria air pollutant and precursor impacts for long-range plans (general plans, redevelopment plans, specific plans, area plans, community plans, transportation plans, congestion management plans, etc.) is consistency with the most recently adopted AQP. All of the following criteria must be satisfied for a proposed plan to be consistent with the AQP, and to result in a less than significant impact.
Proposed plans must show over the planning period of the plan that:
• The plan supports the primary goals of the AQP. • The plan incorporates current AQP control measures as appropriate to the plan area. • The projected vehicle miles traveled or vehicle trips increase is less than or equal to projected
population increase. AQP Primary Goals As discussed in Impact AIR-2, buildout of the Community Plan is estimated to generate potentially significant impact from construction-emitted fugitive dust as well as criteria pollutants from construction equipment and vehicle exhaust. Implementation of Mitigation Measure AIR-2a would reduce the potential fugitive dust impact to less than significant. Implementation of Mitigation Measure AIR-2b would reduce the potential construction-exhaust impact to less than significant. As such, construction of the Community Plan would not hinder regional efforts to attain air quality standards.
The Community Plan would increase density in an existing urban area while promoting multiple transportation modes and support TOD in a transportation corridor that has transit service capacity

City of Fremont – Warm Springs/South Fremont Community Plan Draft EIR Air Quality/Greenhouse Gas Emissions
FirstCarbon Solutions 3.2-23 H:\Client (PN-JN)\4259\42590001\EIR\4 - Draft EIR\42590001 Sec03-02 Air Quailty.doc
through the Bay Area Rapid Transit (BART), Alameda County Transit (AC Transit), and Valley Transit Authority (VTA).
The Community Plan would provide new bicycle facilities (bike routes and bike lanes) and bicycle amenities and would not contain design aspects that would cause an increased potential for bicycle/vehicle conflicts. Additionally, the Community Plan would not conflict with existing or planned bicycle facilities. The Community Plan would provide enhanced pedestrian facilities and amenities to improve pedestrian access, circulation, and comfort. In addition, many other pedestrian safety amenities are proposed to avoid pedestrian/vehicle conflicts as part of the Community Plan.
Finally, the Community Plan would increase the diversity of land uses within an existing urban area, increasing both the jobs creation within the plan area and housing availability. The plan area currently contains one or two existing rural residential units. The Community Plan would allow construction of up to 4,000 residential units, while increasing employment by as many as 20,000 new jobs. Although the project is estimated to increase trips out of the plan area by 52,000 daily vehicle trips, the Community Plan would reduce regional VMT through jobs and housing intensification in an existing urban environment while supporting alternative modes of transportation.
The Community Plan design would nest residential uses within commercial and commercial/industrial sectors, thereby providing a buffer between the residential uses and industrial/general manufacturing uses. As described in Impact AIR-4, the project has the potential to expose future residents to substantial quantities of TACs. This impact would be reduced to less than significant with implementation of the City’s General Plan Implementation Policies 7-7.1.b, 7-7.3.a, 7-7.3.b, and 7-7.3.c, and Mitigation Measure AIR-4.
In summary, the project would further the primary goals of the AQP after incorporation of Mitigation Measures AIR-2a, AIR-2b, and AIR-4. Therefore, the project would be less than significant with mitigation for this criterion.
Control Measures The second step to ensure that the project would not conflict with or obstruct the AQP requires the project to be consistent with appropriate AQP control measures. BAAQMD Guidelines state that the most recently adopted AQP should provide the methodology for determining the appropriate control measures that should be included in specific types of long-range plans.
The City’s 2011 General Plan establishes a number of goals and policies that are consistent with the strategies and control measures identified in the 2010 Clean Air Plan (AQP). These include goals and policies that call for promoting TOD, higher intensities near transit, complete streets, reducing of waste, green buildings standards and energy conservation, water-efficiency and water conservation, use of reclaimed water, and expansion of the urban forest. The project would be consistent with the applicable measures of the City’s 2011 General Plan and, as such, would not conflict with the applicable provisions of the 2010 Clean Air Plan. Therefore, the project would be less than significant for this criterion.

City of Fremont – Warm Springs/South Fremont Community Plan Air Quality/Greenhouse Gas Emissions Draft EIR
3.2-24 FirstCarbon Solutions H:\Client (PN-JN)\4259\42590001\EIR\4 - Draft EIR\42590001 Sec03-02 Air Quailty.doc
Vehicle Miles Traveled and Population Increase The third step to ensure that the project would not conflict with or obstruct the AQP is to show that the projected VMT or vehicle trips increase for the project is less than or equal to the projected population increase. BAAQMD Guidelines state that population estimates should be derived from the most recent issue of the Association of Bay Area Governments’ Projections publication.
The U.S. Census indicated that the population of Fremont was 203,413 in 2000 and 214,089 in 2010. The Metropolitan Transportation Commission’s (MTC) Plan Bay Area Final Forecasting of Jobs, Population and Housing (July 2013) indicates a 33 percent growth in jobs in Fremont between 2010 and 2040, and a 24 percent increase in total housing units in the same timeframe. The MTC also estimates that countywide, Alameda County will see a 36 percent growth in employment, a 25 percent increase in housing units, and a 32 percent increase in population.
As stated in the Regulatory Framework of this section, the plan area is identified in Plan Bay Area and associated support documents as a PDA. Specifically, the area ‘South Fremont/Warm Springs’ is identified as a suburban center. As identified in the Final Forecasting of Jobs, Population and Housing, the South Fremont/Warm Springs PDA is indicated as having a 125 percent increase in jobs between 2010 and 2040, and a 128 percent increase in housing units in the same timeframe.
As shown in Table 3.2-8, based on the projected increase in jobs for the plan area, the percent growth is estimated to be 133 percent between 2013 and 2035, and the compound annual growth rate is estimated to be 3.93 percent in the same timeframe. It is not mathematically possible to calculate a percent increase above an existing amount of zero1. When the “existing” amount approaches zero, the percent increase approaches infinity. Therefore, because the plan area currently has no housing, the percent increase in population is not definable because it is non-calculable. However, the inclusion of 4,000 residential units, which would accommodate an estimated 12,200 residents, would bring the jobs-to-housing ratio of the plan area closer to a balance. Without the project, the area contains only jobs and no housing. With the project, the area would have a jobs-to-housing ratio of 8.75 to 1, which is considered “jobs-rich.”
Table 3.2-8: Jobs-to-Housing Comparison
Year Jobs Dwelling Units Population
2013 15,000 0 0
2035 35,000 4,000 12,200
Difference 20,000 4,000 12,200
Percent Growth 133 — —
Annual Growth Rate 3.93 — —
Source: City of Fremont, 2013.
1 Although there are one or two existing rural residential dwelling units with the plan area, these are legal, non-conforming uses
because they pre-date annexation to the City of Fremont and the property is designated for industrial land use activities by the City of Fremont (refer to Table 2-3 in Section 2, Project Description). As such, it is appropriate to exclude them from this analysis.

City of Fremont – Warm Springs/South Fremont Community Plan Draft EIR Air Quality/Greenhouse Gas Emissions
FirstCarbon Solutions 3.2-25 H:\Client (PN-JN)\4259\42590001\EIR\4 - Draft EIR\42590001 Sec03-02 Air Quailty.doc
Although the Transportation Impact Analysis (Appendix G) prepared for the Community Plan includes data for existing intersection volumes and level of service, it does not include trip generation or land use data sufficient to estimate VMT from existing facilities in the plan area. Therefore, the Community Plan’s potential VMT increase was analyzed under two scenarios:
• Baseline Scenario that considered the land use development proposed by the project with no trip reductions from internal capture or alternative mode use. For the purposes of GHG emissions analysis contained within Impact AIR-6, this scenario utilizes Year 2005 emission factors.
• With Reductions Scenario that considered the land use development proposed by the project that incorporates the trip reductions due to project location and design as detailed in the project’s Transportation Impact Analysis. For the purposes of GHG emissions analysis contained within Impact AIR-6, this scenario utilizes Year 2035 emission factors.
Table 3.2-9 shows the estimated VMT for the project under the two scenarios. As shown in Table 3.2-9, the project would reduce VMT per resident by 30.4 percent from the Baseline Scenario, while the VMT per service population (residents and employees) would be reduced by 59.9 percent from the Baseline Scenario. This reduction is attributable to the project design and location, which includes an intensification of an existing urban area with multiple transit options. Therefore, the project would be less than significant for this criterion.
Table 3.2-9: Vehicle Miles Traveled Comparison
Scenario Population Jobs
Daily Vehicle Miles Traveled (VMT) per
Resident
Daily Vehicle Miles Traveled (VMT) per Service Population Total Annual VMT
2005 Baseline 12,200 15,000 41.05 18.41 182.79 million miles
2035 Project 12,200 35,000 28.58 7.39 127.25 million miles
Percent Difference — — -30.4 -59.9 -30.4
Source: City of Fremont, 2013.
Conclusion The project would be consistent with the primary goals of the AQP after incorporation of Mitigation Measures AIR-2a, AIR-2b, and AIR-4. The project would incorporate the applicable AQP control measures through consistency with the City’s 2011 General Plan. Finally, the project would not result in a significant increase in VMT relative to population increase, but instead would result in an improved jobs-to-housing ratio and reduced VMT per service population. Therefore, the project would be consistent with the criteria set forth by BAAQMD for determining consistency with the AQP. As such, adoption of the project would not conflict with implementation of the AQP. Impacts would be less than significant with mitigation.

City of Fremont – Warm Springs/South Fremont Community Plan Air Quality/Greenhouse Gas Emissions Draft EIR
3.2-26 FirstCarbon Solutions H:\Client (PN-JN)\4259\42590001\EIR\4 - Draft EIR\42590001 Sec03-02 Air Quailty.doc
Level of Significance Before Mitigation Potentially significant impact.
Mitigation Measures Implement Mitigation Measure AIR-2a, AIR-2b, and AIR-4.
Level of Significance After Mitigation Less than significant impact.
Air Quality Violations
Impact AIR-2: Implementation of the Community Plan may violate air quality standards or contribute substantially to an existing or projected air quality violation.
Impact Analysis Development and land use activities contemplated by the project would include construction and operational air emissions of criteria pollutants. This impact analysis assesses short-term construction air emissions and long-term operational emissions.
Construction Emissions Construction activities associated with development activities contemplated by the project would include grading, demolition, building construction, and paving. Generally, the most substantial air pollutant emissions would be dust generated from site grading. If uncontrolled, these emissions could lead to both health and nuisance impacts. Construction activities would also temporarily create emissions of equipment exhaust and other air contaminants.
BAAQMD does not recommend a numerical threshold for fugitive, dust-related particulate matter emissions. Instead, BAAQMD bases the determination of significance for fugitive dust on a consideration of the control measures to be implemented. If all appropriate emissions control measures recommended by BAAQMD are implemented for a project, then fugitive dust emissions during construction are not considered significant. Therefore, without application of best management practices, this impact is potentially significant. Incorporation of Mitigation Measure AIR-2a would reduce this impact to less than significant. Note, Mitigation Measure AIR-2a is identical to the dust-control portion of Mitigation Measure AIR-3 from the City of Fremont’s General Plan Draft EIR. Therefore, application of Mitigation Measure AIR-2 within this document constitutes enhanced enforcement of the requirement.
Off-road construction equipment is a large source of oxides of nitrogen (NOx) and diesel particulate matter in the Bay Area. NOx is an ozone precursor pollutant that contributes to regional ozone formation. Diesel particulate matter contributes to elevated PM10 and PM2.5 concentrations and is a TAC. The project does not have thresholds for plan-level construction-generated reactive organic gases (ROG), NOx, PM10 exhaust, and PM2.5 exhaust. However, BAAQMD’s 2010 Thresholds do have numerical thresholds for project-level ROG, NOx, PM10 exhaust, and PM2.5 exhaust, and new development projects would use BAAQMD’s CEQA Guidelines as the basis for assessing impacts. This document sets forth guidance for evaluating and mitigating construction-related ROG, NOx, PM10 exhaust, and PM2.5 emissions for project-level analysis. Preliminary project-level screening for

City of Fremont – Warm Springs/South Fremont Community Plan Draft EIR Air Quality/Greenhouse Gas Emissions
FirstCarbon Solutions 3.2-27 H:\Client (PN-JN)\4259\42590001\EIR\4 - Draft EIR\42590001 Sec03-02 Air Quailty.doc
construction-related criteria pollutants involves meeting criteria for screening size, implementing all basic construction mitigation measures, and exclusion of the following construction related activities:
• Demolition activities inconsistent with BAAQMD Regulation 11, Rule 2: Asbestos Demolition, Renovation and Manufacturing
• Simultaneous occurrence of more than two construction phases (e.g., paving and building construction would occur simultaneously)
• Simultaneous construction of more than one land use type
• Extensive site preparation
• Extensive material transport (e.g. greater than 10,000 cubic yards of soil import or export) Mitigation Measure AIR-2b is proposed requiring implementation of emissions control measures for off-road construction equipment. The implementation of this mitigation measure would reduce this impact to a level of less than significant.
Operational Emissions BAAQMD CEQA Guidelines indicate that the threshold for operational-related criteria air pollutant and precursor impacts for plans is consistency with the most recently adopted AQP. This is demonstrated by showing that the plan incorporates current AQP control measures, and the rate of increase in VMT within the plan area is equal to or lower than the rate of increase in population projected for the proposed plan.
The analysis of AQP consistency provided in Impact AIR-1 demonstrates compliance with the first criteria. The project consists of an intensification of an existing urban area, promoting alternates modes of transportation (transit, bicycles, pedestrians), TOD, pedestrian-oriented development, and transportation demand management that result in lower VMT.
Therefore, the population increase accommodated by the project would occur in development that produces lower VMT per capita than development allowed under a suburban or “greenfield” scenario. The project would meet BAAQMD significance criteria and would not substantially contribute to an existing violation of the ozone and particulate standards. Impacts would be less than significant.
Level of Significance Before Mitigation Potentially significant impact.
Mitigation Measures MM AIR-2a To reduce fugitive dust (PM10) emissions from construction activity, the following
measures shall be implemented:
• Water all active construction areas at least twice daily and more often during windy periods. Active areas adjacent to residences should be kept damp at all times.

City of Fremont – Warm Springs/South Fremont Community Plan Air Quality/Greenhouse Gas Emissions Draft EIR
3.2-28 FirstCarbon Solutions H:\Client (PN-JN)\4259\42590001\EIR\4 - Draft EIR\42590001 Sec03-02 Air Quailty.doc
• Cover all hauling trucks or maintain at least two feet of freeboard. • Pave, apply water at least twice daily, or apply (non-toxic) soil stabilizers on all
unpaved access roads, parking areas, and staging areas. • Sweep daily (with water sweepers) all paved access roads, parking areas, and
staging areas and sweep streets daily (with water sweepers) if visible soil material is deposited onto the adjacent roads.
• Hydroseed or apply (non-toxic) soil stabilizers to inactive construction areas (i.e., previously graded areas that are inactive for 10 days or more).
• Enclose, cover, water twice daily, or apply (non-toxic) soil binders to exposed stockpiles.
• Limit traffic speeds on any unpaved roads to 15 mph. • Replant vegetation in disturbed areas as quickly as possible. • Suspend construction activities that cause visible dust plumes to extend beyond
the construction site. • Post a publicly visible sign(s) with the telephone number and person to contact at
the Lead Agency regarding dust complaints. This person shall respond and take corrective action within 48 hours. The Air District’s phone number shall also be visible to ensure compliance with applicable regulations.
MM AIR-2b To reduce exhaust emissions from off-road construction equipment, the following measures shall be implemented:
• The developer or contractor shall provide a plan for approval by the City or BAAQMD demonstrating that heavy-duty off-road vehicles to be used in the construction project, including owned, leased, and/or subcontractor vehicles, shall meet or exceed United States Environmental Protection Agency Tier 3 off-road emissions standards when more than five pieces of off-road diesel equipment with a horsepower greater than 70 per piece of equipment would operate on one day. The plan shall include quantification of air pollutant emissions demonstrating that the project would not exceed the BAAQMD’s thresholds of significance for project construction.
• Clear signage at all construction sites will be posted indicating that diesel equipment standing idle for more than five minutes shall be turned off. This would include trucks waiting to deliver or receive soil, aggregate, or other bulk materials. Rotating drum concrete trucks could keep their engines running continuously as long as they were onsite or adjacent to the construction site.
• The contractor shall install temporary electrical service whenever possible to avoid the need for independently powered equipment (e.g., compressors).
• Properly tune and maintain equipment for low emissions. Level of Significance After Mitigation Less than significant impact.

City of Fremont – Warm Springs/South Fremont Community Plan Draft EIR Air Quality/Greenhouse Gas Emissions
FirstCarbon Solutions 3.2-29 H:\Client (PN-JN)\4259\42590001\EIR\4 - Draft EIR\42590001 Sec03-02 Air Quailty.doc
Cumulative Criteria Pollutants
Impact AIR-3: Implementation of the project would not result in a cumulatively considerable net increase of any criteria pollutant for which the project region is nonattainment under an applicable federal or state ambient air quality standard (including releasing emissions, which exceed quantitative thresholds for ozone precursors).
Impact Analysis According to the checklist in the CEQA Guidelines, a project would create a significant impact if it would “result in a cumulatively considerable net increase of any criteria pollutant for which the project region is nonattainment under an applicable national or state ambient air quality standard (including releasing emissions which exceed quantitative thresholds for ozone precursors).”
Section 15130(b) of the CEQA Guidelines states, in relevant part, the following:
The following elements are necessary to an adequate discussion of significant cumulative impacts: 1) Either: (A) A list of past, present, and probable future projects producing related or cumulative impacts, including, if necessary, those projects outside the control of the agency, or (B) A summary of projections contained in an adopted general plan or related planning document, or in a prior environmental document which has been adopted or certified, which described or evaluated regional or area wide conditions contributing to the cumulative impact.
In accordance with CEQA Guidelines 15130(b), this analysis of cumulative impacts incorporates a summary of projections.
The geographic scope for cumulative criteria pollution from air quality impacts is the Air Basin, because that is the area in which the air pollutants generated by the sources within the Air Basin circulate and are often trapped. BAAQMD is required to prepare and maintain a Clean Air Plan and a State Implementation Plan to document the strategies and measures to be undertaken to reach attainment of ambient air quality standards. While BAAQMD does not have direct authority over land use decisions, it recognized that changes in land use and circulation planning are necessary to maintain clean air. BAAQMD evaluated the entire Air Basin when it developed the Clean Air Plan.
According to the analysis contained in Impact AIR-1, the project is consistent with the Clean Air Plan.
The Air Basin is in nonattainment for ozone, PM10, and PM2.5, which means that the background levels of those pollutants are at times higher than the ambient air quality standards. The air quality standards were set to protect public health, including the health of sensitive individuals such as the elderly, children, and the sick. Therefore, when the concentration of those pollutants exceeds the standard, it is likely that some sensitive individuals in the population would experience health effects that were described in Table 3.2-1. However, the health effects are a factor of the dose-response curve. Concentration of the pollutant in the air (dose), the length of time exposed, and the response of the individual are factors involved in the severity and nature of health impacts. If a significant health impact results from project emissions, it does not mean that 100 percent of the population would experience health effects.

City of Fremont – Warm Springs/South Fremont Community Plan Air Quality/Greenhouse Gas Emissions Draft EIR
3.2-30 FirstCarbon Solutions H:\Client (PN-JN)\4259\42590001\EIR\4 - Draft EIR\42590001 Sec03-02 Air Quailty.doc
The project would be consistent with the 2010 Clean Air Plan, as its VMT and population growth assumptions would be reduced from a suburban or ‘greenfield’ development scenario. Furthermore, the project would bring the jobs-to-housing ratio within the plan area closer to balance. Finally, the project would be consistent with the air pollution reduction and control strategies outlined in the 2010 Clean Air Plan. Impacts would be less than significant.
Level of Significance Before Mitigation Less than significant impact.
Mitigation Measures No mitigation is necessary.
Level of Significance After Mitigation Less than significant impact.
Sensitive Receptors
Impact AIR-4: Implementation of the Community Plan may expose sensitive receptors to substantial pollutant concentrations.
Impact Analysis Sensitive receptors are land uses that house sensitive populations (children, the elderly, and the infirm) for sustain periods. Examples of land uses include residential areas, schools, hospitals, convalescent facilities, and day care centers. TACs are the air pollutants of most concern as it relates to sensitive receptors, as they have the greatest potential to pose a carcinogenic and non-carcinogenic (such as asthma and bronchitis) hazard to human health. Based on the types of land use activities present in the project area, DPM is the TACs most likely to occur locally. DPM is emitted by vehicles with diesel engines (trucks, heavy equipment, etc.). BAAQMD’s guidance indicates that lead agencies should consider the extent to which a new TAC source would increase risk levels, hazard index, or PM2.5 concentrations at nearby receptors. Specifically, the 2010 Thresholds recommend:
1. An overlay zone around existing and planned sources of TACs. 2. Overlay zones of at least 500 feet from all freeways and high volume roadways.
For project-level analysis, BAAQMD provides three tools for use in screening potential sources of TACs. These tools are:
• Surface Street Screening Tables. BAAQMD pre-calculated potential cancer risk and PM2.5 concentration increases for each county within their jurisdiction. The look-up tables are used for roadways that meet BAAQMD’s “major roadway” criteria of 10,000 vehicles or 1,000 trucks per day. Risks are assessed by roadway volume, roadway direction, and distance to sensitive receptor.
• Freeway Screening Analysis Tool. BAAQMD prepared a Google Earth file that contains pre-estimated cancer risk, hazard index, and PM2.5concentration increases for highways within the

City of Fremont – Warm Springs/South Fremont Community Plan Draft EIR Air Quality/Greenhouse Gas Emissions
FirstCarbon Solutions 3.2-31 H:\Client (PN-JN)\4259\42590001\EIR\4 - Draft EIR\42590001 Sec03-02 Air Quailty.doc
Bay Area. Risks are provided by roadway link and are estimated based on elevation and distance to the sensitive receptor.
• Stationary Source Risk and Hazard Screening Tool. BAAQMD prepared a Google Earth file that contains the locations of all stationary sources within the Bay Area that have BAAQMD permits. For each emissions source, BAAQMD provides conservative cancer risk and PM2.5concentration increase values.
BAAQMD recommends the use of these three tools in a screening process for project-level analysis to identify whether further environmental review of potential TAC or PM2.5concentration risk for a project is warranted. Specifically, emissions sources within 1,000 feet of a proposed project boundary should be evaluated.
For project-level analysis, BAAQMD specifies both individual and cumulative-level thresholds of significance for risks and hazards. The City specifies a cancer risk threshold of significance of 100-in-a-million for infill development, which is the same as BAAQMD’s cumulative-level threshold. Use of the cumulative-level threshold for assessing impacts for new receptor projects (such as residential uses) is appropriate because the analysis would account for all potential sources of TACs and PM2.5 in proximity to said proposed development. Use of both the project-level and cumulative-level threshold for assessing impacts from land uses that are considered potential sources of health risk, such as stationary sources, industrial sources, or roadway projects, is appropriate because that methodology would identify said project’s individual contribution to risk as well as cumulative contribution to risk. All development within the plan area would be infill development.
As stated within the Environmental Setting, nearby sources of air pollution include two interstate highways, I-880 and I-680, immediately adjacent to the western boundary and eastern boundary of the project, respectively; Mission Boulevard (State Route 262 [SR-262]), adjacent to the southern project boundary; and Auto Mall Parkway, approximately 1,000 feet north of the northernmost portion of project boundary. In addition, the Union Pacific Railroad Warm Springs Subdivision and BART alignment, as well as segments of Old Warm Springs Boulevard, pass through the Community Plan area. There are also several stationary sources located within and near the plan area. There are stationary sources of air pollution within the Community Plan boundaries and also within 1,000 feet of the plan area. These include several existing and planned industrial and manufacturing facilities and the Union Pacific Railyard, located within the northwest portion of the plan area.
Residential land uses would be allowed within Mix C and Mix D (Planning Areas 3, 4 and 9), as illustrated in Exhibit 2-3. As shown in Exhibit 2-3, residential units would not be located immediately adjacent to general manufacturing land uses. Residential land uses in Planning Area 9 may be located within 500 feet of I-680. In addition, residential land uses in Planning Areas 3, 4, or 9 may be located within 1,000 feet of stationary sources and high-volume roadways.
A Health Risk Study was prepared for a residential development proposed within Planning Area 9. This study assessed risk for sensitive receptors throughout Planning Area 9 and is representative of health risks for residential land uses within the plan area. The Health Risk Study estimated potential health risks to receptors from multiple sources, including existing stationary sources, rail activity,

City of Fremont – Warm Springs/South Fremont Community Plan Air Quality/Greenhouse Gas Emissions Draft EIR
3.2-32 FirstCarbon Solutions H:\Client (PN-JN)\4259\42590001\EIR\4 - Draft EIR\42590001 Sec03-02 Air Quailty.doc
surface roads, and I-680. As demonstrated in the Health Risk Study, the cumulative risk to receptors exceeded BAAQMD’s cumulative threshold for cancer risk, cumulative PM2.5 ambient concentration increase, and cumulative non-cancer hazards. As shown in the study, application of mitigation would reduce the impact to less than significant. However, it is not clear if the study incorporated BAAQMD’s recommended Age Sensitivity Factor for children. BAAQMD specifies a different, more sensitive breathing rate and age sensitive factors for children, reflecting children’s increased susceptibility to carcinogens as compared to adults. Therefore, the project may expose future residents to unacceptable levels of TACs.
As shown in the City of Fremont’s General Plan EIR, implementation of a Mitigation Measure AIR-2, which contains the text of Implementation Measures 7.7-3.A, 7.7-3.B, and 7.7-3.C, would reduce potential exposure of sensitive receptors to unhealthy levels of TACs and PM2.5 to less than significant. Mitigation Measure AIR-4 is proposed to further reduce potential impacts to less than significant.
Level of Significance Before Mitigation Potentially significant impact.
Mitigation Measures MM AIR-4 Prior to issuance of building permits for any sensitive receptor use (e.g., residential
areas, elementary school, daycare centers, etc.) that would be developed pursuant to the Community Plan, the applicant shall prepare and submit plans to the City of Fremont that demonstrates the use of air filtration with a minimum efficiency reporting value (MERV) of 13 or greater. The approved plan shall be incorporated into the development.
Level of Significance After Mitigation Less than significant impact.
Odors
Impact AIR-5: Implementation of the Community Plan would not create objectionable odors affecting a substantial number of people.
Impact Analysis BAAQMD CEQA Air Quality Guidelines (Guidelines) state that for plans to have a less than significant impact, the location of odors should be identified, and policies included to minimize the impacts of existing or planned sources of odors must be identified.
BAAQMD established screening levels for project-level evaluation for sensitive receptors proposed to be located near different types of utilities, industrial uses , or other facilities known to generate odor. The lead agency should employ this guidance when evaluating whether a proposed plan includes adequate distances between odor sources and sensitive receptors.
BAAQMD has project-level odor screening distances in its Guidelines. These screening distances include distances for repair and paint shops, wastewater treatment plants, sanitary landfills, and other typical sources of odor. The plan area is not within the screening distance of a wastewater

City of Fremont – Warm Springs/South Fremont Community Plan Draft EIR Air Quality/Greenhouse Gas Emissions
FirstCarbon Solutions 3.2-33 H:\Client (PN-JN)\4259\42590001\EIR\4 - Draft EIR\42590001 Sec03-02 Air Quailty.doc
treatment plant or dairy. However, the plan area contains a variety of industrial land uses. For projects within the screening distances, BAAQMD has the following project-level threshold:
An odor source with five or more confirmed complaints per year averaged over three years is considered to have a significant impact on receptors within the screening distance shown in Table 3-3 [of the BAAQMD’s guidance].
However, the BAAQMD does not recommend application of the project-level threshold for a plan-level analysis.
Typical sources of odor identified by BAAQMD include: wastewater treatment plants, wastewater pumping facilities, sanitary landfills, transfer stations, composting facilities, petroleum refineries, asphalt batch plants, chemical manufacturing, fiberglass manufacturing, painting/coating operations, rendering plants, coffee roasters, food processing facilities, confined animal facility/feedlot/dairy, green waste and recycling operations, and metal smelting plants.
The Community Plan would increase the land use intensity within the plan boundary. A review of land uses within the plan area indicates existing sources of odor, such as auto body shops (which having painting/coating operations), are present. Residential land uses are proposed within BAAQMD’s screening distance of potential sources of odor. Therefore, this is a potentially significant impact. BAAQMD was contacted to determine an odor complaint history for the plan area. As identified by BAAQMD, the records system does not allow for a buffer or radius analysis. Therefore, the odor complaint history for the entirety of the City of Fremont was generated for the three-year period prior to the issuance of the project’s NOP. A review of the complaint history shows only one confirmed complaint within the three-year period. The complaint was received by BAAQMD on October 4, 2010, for a plastic solvents odor at the Alameda County Library, which is more than three miles north of the plan area.
Therefore, based on the odor complaint history for the City of Fremont, and the land use components of the Community Plan, future development and land use activities contemplated by the project would not create objectionable odors affecting a substantial number of people or result in significant impacts. Impacts would be less than significant.
Level of Significance Before Mitigation Less than significant impact.
Mitigation Measures No mitigation is necessary.
Level of Significance After Mitigation Less than significant impact.

City of Fremont – Warm Springs/South Fremont Community Plan Air Quality/Greenhouse Gas Emissions Draft EIR
3.2-34 FirstCarbon Solutions H:\Client (PN-JN)\4259\42590001\EIR\4 - Draft EIR\42590001 Sec03-02 Air Quailty.doc
Greenhouse Gas Emissions
Impact AIR-6: Implementation of the Community Plan would generate direct and indirect GHG emissions; however, these emissions would not result in a significant impact on the environment.
Impact Analysis BAAQMD provides multiple options in its 2010 Thresholds for plan-level GHG generation from project operation. Prior to the 2010 Air Guidance document, BAAQMD did not have an adopted threshold of significance for GHG emissions. BAAQMD does not currently provide a construction-related GHG threshold. The thresholds suggested in BAAQMD’s 2010 Guidance document for plan-level operational GHG generation are:
• Compliance with a qualified GHG Reduction strategy, or • 6.6 metric tons of CO2 equivalent per service population (employees plus residents).
The applicable plan, as discussed in the Regulatory Setting, is the City of Fremont’s Climate Action Plan. However, as disclosed in the Climate Action Plan, the City’s Climate Action Plan is not considered a qualified greenhouse gas reduction strategy by BAAQMD. Therefore, compliance with the City’s Climate Action Plan will not be applied as the threshold for the project’s generation of GHGs. The efficiency metric of 6.6 MTCO2e will be utilized.
Emissions Inventory This analysis is restricted to GHGs identified by AB 32, which include carbon dioxide, methane, nitrous oxide, hydrofluorocarbons, perfluorocarbons, and sulfur hexafluoride. The project would generate a variety of GHGs during construction and operation, including several defined by AB 32 such as carbon dioxide, methane, and nitrous oxide.
Certain GHGs defined by AB 32 would not be emitted by the project. Perfluorocarbons and sulfur hexafluoride are typically used in industrial applications, none of which would be used by the project. Therefore, it is not anticipated that the project would emit perfluorocarbons or sulfur hexafluoride.
Construction Emissions
The project would emit GHGs from upstream emission sources and direct sources (combustion of fuels from worker vehicles and construction equipment).
An upstream emission source (also known as life cycle emissions) refers to emissions that were generated during the manufacturing of products to be used for construction of the project. Upstream emission sources for the project include but are not limited to the following: emissions from the manufacturing of cement, emissions from the manufacturing of steel, and/or emissions from the transportation of building materials to the seller (because CalEEMod only estimates the transportation of building materials locally). The upstream emissions were not estimated because they are not within the control of the project and to do so would be speculative at this time. Pursuant to CEQA Guidelines Sections 15144 and 15145, upstream/life cycle emissions are speculative and no further discussion is necessary.

City of Fremont – Warm Springs/South Fremont Community Plan Draft EIR Air Quality/Greenhouse Gas Emissions
FirstCarbon Solutions 3.2-35 H:\Client (PN-JN)\4259\42590001\EIR\4 - Draft EIR\42590001 Sec03-02 Air Quailty.doc
The emissions of carbon dioxide from project construction equipment and worker vehicles are were not estimated for implementation of the project, as the development timeline and construction components are unknown, and would be speculative at this time. Furthermore, BAAQMD does not have a recommended assessment methodology or threshold for plan-level, construction-generated GHGs.
Operational Emissions The project’s operational emissions were estimated using CalEEMod using the trip generation estimates provided in the Transportation Impact Analysis prepared by Fehr and Peers. Trip reductions attributable to internal capture and alternative transit use were utilized by reducing the per-land use trip generation accordingly. The year of analysis is 2035, consistent with the anticipated buildout of the project. In addition, water efficiency measures were incorporated in compliance with City of Fremont General Plan policies. However, for the purposes of a conservative analysis, the project’s GHG emissions were estimated without water efficiency measures and are provided in Table 3.2-10. The CalEEMod output is provided in Appendix B.
Table 3.2-10: Operational CO2 Generation (Year 2035)
Emission Source MTCO2e
Area (Landscaping Equipment, Natural Gas, etc.) 225.35
Energy 69,344.13
Mobile (Vehicles) 49,844.49
Waste 6638.23
Water 8,514.27
Total Emissions 134,566.46
Service Population 32,200
Emissions per service population 4.18
BAAQMD Threshold 6.6
Does the project exceed threshold? No
Note: MTCO2e = metric tons of carbon dioxide equivalent. Source: CalEEMod output (Appendix A).
The project’s service population is 32,200 (12,200 residents plus 20,000 jobs). As shown in Table 3.2-10, the project would not exceed BAAQMD’s plan-level efficiency metric of 6.6 MTCO2e per service population. Therefore, impacts would be less than significant.
Level of Significance Before Mitigation Less than significant impact.
Mitigation Measures No mitigation is necessary.

City of Fremont – Warm Springs/South Fremont Community Plan Air Quality/Greenhouse Gas Emissions Draft EIR
3.2-36 FirstCarbon Solutions H:\Client (PN-JN)\4259\42590001\EIR\4 - Draft EIR\42590001 Sec03-02 Air Quailty.doc
Level of Significance After Mitigation Less than significant impact.
Greenhouse Gas Reduction Plan Consistency
Impact AIR-7: Implementation of the project would not conflict with any applicable plan, policy or regulation of an agency adopted to reduce the emissions of GHGs.
Impact Analysis To address this potential impact, project consistency with the City of Fremont Climate Action Plan, and ARB’s Scoping Plan are addressed.
City of Fremont Climate Action Plan The City of Fremont adopted its Climate Action Plan in November 2012. The Climate Action Plan identifies policies that will achieve the state-recommended GHG reduction target of 25 percent below baseline 2005 levels by the year 2020. The Climate Action Plan provides goals and associated measures, where each goal is tied to a specific reduction of GHG emissions as well as energy use, transportation, and waste reductions. The project would be consistent with these actions and with General Plan policies. As detailed above, the City’s Climate Action Plan is not considered a qualified reduction strategy under BAAQMD guidance.
Climate Change Adaptation Sea Level Rise
The Pacific Institute, with support from the California Energy Commission, California Department of Transportation, and the Ocean Protection Council, prepared impact maps showing the potential extent of coastal flooding and erosion under one scenario that involved a sea level rise of 1.4 meters (55 inches). This scenario represents the medium to high GHG emissions scenarios, but does not reflect the worst-case that could occur. The scenario estimates that the 1.4-meter sea-level rise would occur by 2100.
The project is located east of I-880. A review of current sea level rise maps in California indicates that the plan area would not be threatened by sea level rise; land east of I-880 in the plan area would not be inundated, but land west of I-880 would be susceptible to inundation.
Scoping Plan As discussed in the Regulatory Section, ARB adopted the Climate Change Scoping Plan (Scoping Plan), which outlines actions recommended to obtain emission reduction goals contained in AB 32. The Scoping Plan states, “The 2020 goal was established to be an aggressive, but achievable, mid-term target, and the 2050 GHG emissions reduction goal represents the level scientists believe is necessary to reach levels that will stabilize climate” (ARB 2008, page 4). The year 2020 goal of AB 32 corresponds with the mid-term target established by Executive Order S-3-05, which aims to reduce California’s fair-share contribution of GHGs in 2050 to levels that will stabilize the climate. The Scoping Plan identifies recommended measures for multiple GHG emission sectors and the associated emission reductions needed to achieve the year 2020 emissions target—each sector has a different emission reduction target. Most of the measures target the transportation and electricity sectors. Therefore, the majority of measures are not directly applicable or implementable at the

City of Fremont – Warm Springs/South Fremont Community Plan Draft EIR Air Quality/Greenhouse Gas Emissions
FirstCarbon Solutions 3.2-37 H:\Client (PN-JN)\4259\42590001\EIR\4 - Draft EIR\42590001 Sec03-02 Air Quailty.doc
project level. However, the project would increase energy efficiency, conserve water, and reduce waste pursuant to design features.
As provided by BAAQMD:
BAAQMD’s approach to developing a Threshold of Significance for GHG emissions is to identify the emissions level for which a project would not be expected to substantially conflict with existing California legislation adopted to reduce statewide GHG emissions needed to move us towards climate stabilization. If a project would generate GHG emissions above the threshold level, it would be considered to contribute substantially to a cumulative impact, and would be considered significant.
Therefore, if a project is less than BAAQMD’s threshold of significance for GHGs, it stands to reason that the project would not substantially conflict with existing California legislation adopted to reduce statewide GHG emissions. As shown in Impact AIR-6, the project would not exceed BAAQMD’s threshold of significance for GHG emissions and would result in a less than significant impact. Therefore, the project would not substantially conflict with the emission reduction requirements of AB 32. ARB’s Scoping Plan was adopted to implement the emission reduction requirements of AB 32. Therefore, the project would not conflict with the Scoping Plan.
Level of Significance Before Mitigation Less than significant impact.
Mitigation Measures No mitigation is necessary.
Level of Significance After Mitigation Less than significant impact.


![Greenhouse Gas Emissions and Emissions Trading in North … · 2020. 2. 23. · 2002] Stephenson-Greenhouse Gas Emissions, Kyoto and U.S. Response 45 greenhouse gas molecules. This](https://static.fdocuments.in/doc/165x107/60facf56e286b02f9b10de99/greenhouse-gas-emissions-and-emissions-trading-in-north-2020-2-23-2002-stephenson-greenhouse.jpg)


