3189CatAR VSA 0407 - Morningstar, Inc.
89
TOMORROW’S WORLD TODAY’S WORK 2005 ANNUAL REPORT CATERPILLAR 2005 ANNUAL REPORT
Transcript of 3189CatAR VSA 0407 - Morningstar, Inc.

TOMORROW’S
WORLD
TODAY’SWORK
2005 ANNUAL REPORTWWW.CAT.COM PEORIA, IL 61629 309.675.1000 YECX0018
CATERPILLAR 2005 ANNUAL REPORT

Letter to Stakeholders 1
This is a great time to be part of Team Caterpillar — and the
future promises to be even more rewarding. With our current
outlook, projected sales and revenues should be close to $40
billion in 2006. That means we will have nearly doubled the
size of our company in just three years, thanks to customers
worldwide who have placed their trust and confidence in our
products and services — and thanks to a global team of
employees, dealers and suppliers who are working hand-in-
hand to address the strong surge in customer demand. We’re
in the midst of the most aggressive new product introduction
campaign in our history and rapidly growing our service
businesses. We’re making great gains in employee safety,
engagement and diversity. And we’re laser-focused on reach-
ing the 2010 targets in our new enterprise strategy.
I feel incredibly good about our accomplishments, but
even better about the fact that we’re not stopping here.
At a time when business is going well, when we’re hitting on
all cylinders in the marketplace and growing around the
world, our people are thinking about how we can improve and
are putting substantive plans in place to get even better. As
I said in this letter last year, I can’t think of another company
in any industry that is better positioned to win in the global
economy. Our vision is to be recognized as a great employer,
an outstanding investment and an admired global leader
committed to making progress possible around the world.
I believe we’re well on our way.
ANOTHER RECORD YEAR
In 2005, we again achieved record financial results. Our sales
and revenues were up 20 percent, reaching $36.34 billion.
Our earnings of $2.85 billion were up 40 percent and reached
$4.04 per share, our second consecutive year of record profits.
And prospects for continued strong results are promising.
We enter 2006 with one of the largest order backlogs in
our history, particularly for large machines, engines and
turbines — indicating continued market strength in the year
ahead. And there are strong economic winds at our back.
We’re three years into a period of explosive growth in all the
major market segments we serve — global mining, global
energy and infrastructure development in particular —
and the future looks very strong in each.
OUR WORK IS PRODUCING RESULTS
TO OUR STAKEHOLDERS
Letter to Stakeholders 1
Financial Highlights 5
Caterpillar at a Glance 6
SECTION ONE
OUR WORK IS DRIVEN BY OUR VALUESWe Are Meeting Higher Standards 9
We Are Finding a Better Way 10
We Are Working as One 12
We Are Digging Deeper 14
SECTION TWO
OUR WORK IS NOT FINISHEDWe Are Speaking a Different Language 17
We Are Providing the Fuel for Growth 18
We Are Advancing Progress 20
We Are Rising to the Challenge 22
We Are Doing More than Building 24
We Are Lending a Hand 26
We Are Looking to the Future 28
SECTION THREE
2005 FINANCIAL REVIEWManagement’s Review 31
Financial Information 35
Board of Directors and Officers 38
Company Information 40

(1) The per share data reflects the 2005 2-for-1 stock split.
01
$2
6.1
25
$2
2.8
60
$4
1.5
10
$4
8.7
55
$5
7.7
70
02 03 04 05
CLOSING STOCK PRICE(December 31)
01
$0
.69
5
$0
.70
0
$0
.72
0
$0
.80
0 $0
.95
5
02 03 04 05
DIVIDENDS DECLARED (dollars)
01
$1
.16
$1
.15
$1
.56
$2
.88
$4
.04
02 03 04 05
PROFIT PER SHARE (diluted)
2 CATERPILLAR 2005 Annual Report Letter to Stakeholders 3
Our 22 autonomous profit center business units, sup-
ported by eight service center units, are all driving for solid
leadership positions in their respective markets and the prod-
uct line. This organizational structure encourages the entre-
preneurial zeal that will ensure our continued success in the
global marketplace. And based on our leadership team’s and
employees’ enthusiastic response to the roll-out of our new
strategy, we are confident in our ability to deliver on these goals
if the projected market environment materializes.
CATERPILLAR VALUES
At the foundation of our strategy is Our Values in Action, the
update to our Worldwide Code of Conduct, first published in
1974. Our updated Code is now clearly defined by the values
and behaviors that have made us successful for 80 years — and
will drive our success in the future. We are justifiably proud
of our strong ethical standards, but we know we can do more
to build a values-based culture, particularly as we expand
worldwide. In 2005, we added more than 8,000 employees,
and as we continue to grow to meet demand, we must stay
focused on hiring the best people and integrating them into
our culture. By living our values, we are building one global
Team Caterpillar — where we serve customers, develop people
and leaders, focus on employee satisfaction and create an
enriching environment for all who work here. In fact, during
my 33 years with Caterpillar, I’ve never been prouder of this
organization than I am today. Thanks to a strong focus on
integrity, excellence, teamwork and commitment, we accom-
plished great things in 2005 — many of which you can read
about in this report.
One key to that is our ongoing effort to encode 6 Sigma
disciplines into our daily work. Today more than 3,600 black
belts are leading teams and nearly 36,000 employees are
contributing to 6 Sigma projects worldwide. These teams are
generating significant improvements in our key focus areas of
employee safety, product quality and product availability.
They also have played a major role in our ability to ramp up
production dramatically within our existing facilities — and to
help many suppliers break through capacity bottlenecks at
the same time.
Solid growth also continues in each of our major service
businesses. Cat Financial is an integral part of our business
model, contributing $364 million in profit in 2005. With a
portfolio of $24 billion in receivables, it maintains a solid
investment grade credit rating. Cat Financial enables many
customers to acquire our products, and we’ve demonstrated
that it has solid earnings stability — instrumental in our ability
to maintain attractive profitability throughout the business
cycle. The insurance arm of our financial products division pro-
vides cost-effective extended warranty coverage to customers
and is also growing rapidly. In addition, Cat Logistics recorded
double-digit growth in 2005 and announced new contracts
to propel future growth, including Cat Logistics’ largest deal
ever — a service parts distribution agreement with General
Motors Europe.
INCREASING OUR PRESENCE IN GROWING MARKETS
Overall, business remains strong not only in the established
markets of North America, Europe and Japan but in the emerging
markets as well. We have teams on the ground establishing
our proven global business model in China, India and Russia.
In China, we continue to make great strides, quickly expand-
ing our dealer network, product line and logistics capabilities
and offering Cat Financial services in-country. Achieving our
vision means being a cost-effective competitor in every major
currency zone, and doing so requires a solid manufacturing
and supply base in those areas of the world. Yet, even as we
grow worldwide, we will continue to maintain a strong U.S.
manufacturing presence with significant exports.
A NEW STRATEGIC VISION
Significantly better execution is a key focus of our new enter-
prise strategy, developed and introduced to all employees in
2005. The first in a series of five-year strategic plans leading
to our Vision 2020, the new strategy includes specific goals
in the areas of people, product and process performance
and profitable growth. While not a dramatic shift in direction,
it does set aggressive targets — particularly in the areas of
employee safety, product quality and customer order-to-
delivery capability — and it puts a strong focus on rapid
alignment and execution across all 30 of our business units.
Caterpillar’s record profits and strong cash flow enabled us to reinvest in the
business, improve funding of employee benefit plans and reward our stock-
holders. We focused on growing the business by reinvesting $1.20 billion in
capital expenditures (excluding equipment leased to others). For our
employees, we improved the already well-funded status of our pension
plans by contributing $912 million. For our stockholders, we increased the
dividend 22 percent, our eleventh increase in the last twelve years, and
repurchased nearly 34 million shares. Finally, we improved our financial
strength as our stockholders’ equity increased $965 million. These actions
significantly enhanced stockholder value.
RETURNING VALUE TO OUR STOCKHOLDERS STOCKHOLDER INFORMATION (1)CASH FLOW HIGHLIGHTS
2005 2004 2003
(dollars in millions)
Stock repurchased $ 1,684 $ 539 $ 405
Capital expenditures (1) $ 1,201 $ 926 $ 682
Pension contributions $ 912 $ 677 $ 720
Dividends paid $ 618 $ 534 $ 491
(1) Excluding equipment leased to others.

Years Ended December 31 2005 2004 (1) 2003 (1) 2002 (1) 2001 (1)
(dollars in millions, except per share data)
Sales and revenues $ 36,339 $ 30,306 $ 22,807 $ 20,185 $ 20,510
Profit $ 2,854 $ 2,035 $ 1,099 $ 798 $ 805
Profit per common share $ 4.21 $ 2.97 $ 1.59 $ 1.16 $ 1.17
Profit per common share — diluted $ 4.04 $ 2.88 $ 1.56 $ 1.15 $ 1.16
Dividends declared per common share $ 0.955 $ 0.800 $ 0.720 $ 0.700 $ 0.695
Capital expenditures — excluding equipment
leased to others $ 1,201 $ 926 $ 682 $ 728 $ 1,100
Research and development expenses $ 1,084 $ 928 $ 669 $ 656 $ 696
Year-end employment 85,116 76,920 69,169 68,990 72,004
Return on average stockholders’ equity 35.9 % 30.0 % 19.0 % 14.4 % 14.4 %
Closing stock price (December 31) $ 57.77 $ 48.76 $ 41.51 $ 22.86 $ 26.13
(1) The per share data reflects the 2005 2-for-1 stock split.
4 CATERPILLAR 2005 Annual Report Letter to Stakeholders 5
off to a strong start with a good line of sight to delivering
these goals. Hitting these targets will continue to position
Caterpillar as an outstanding investment opportunity.
That’s not to say we don’t have challenges. We do. First
is safety. The health and well-being of our employees come
above all else. None of our other goals matter if people are
injured in the process of achieving them. We’ve made good
progress the past few years, and the metrics in our new
strategy will push us to improve even faster as we move
toward our ultimate goal of zero injuries. Maintaining product
quality standards also is critical. Quality is one of the reasons
customers choose our equipment — it’s the hallmark of
our reputation — but our quality levels have hit a plateau in
recent years. To remain the market leader, we must make
breakthrough improvements in product quality now. The same
is true for product availability. We must improve our order-to-
delivery processes so we can get our products to customers
when they need them and faster than any competitor, all at
lower costs and with less inventory tied up in our supply chain.
None of these challenges has an easy solution. But
our team is committed to addressing them, and we’ve set
aggressive goals and timelines for success. And those of
you who know Caterpillar know this: When we say we’ll do
something, we do it. We’ve proven that time and time again
during our 80-year history. That’s why I am so excited about
our company’s future. We have embarked on the “good to
great” journey. We are committed to taking what is a very
good company today and making it better, because we know
what all our stakeholders expect — and deserve — is an even
better Caterpillar tomorrow.
Jim Owens, Chairman and CEO
Caterpillar Inc.
OUR COMMITMENT TO SUSTAINABLE PROGRESS
Just as we are looking to encode 6 Sigma into Caterpillar’s
DNA, we also are focused on raising the profile of sustainable
development within our company. Enabling development is at
the heart of our business, and doing so in an increasingly
sustainable manner holds great benefits for our company,
our customers and our world. We’re proud of the progress
made to date — including five straight years on the Dow Jones
Sustainability World Index — and we are issuing our first-ever
sustainability report in conjunction with this annual report.
Our goal is not just to report on what we’ve accomplished,
but also to set definitive goals for what we’re working to
achieve by 2010.
One element of sustainable development for Caterpillar
is helping communities rebuild after natural disasters. During
2005 we were challenged to respond to a number of tragedies
around the world, including the tsunami in Asia, a horrific
hurricane season along the U.S. Gulf Coast and earthquakes
in South Asia. Cat® equipment, dealers and employees pro-
vided as much relief of human suffering as possible and today
are helping people in the affected areas rebuild their lives.
Our quick, compassionate response made me proud to be part
of the Caterpillar team.
GLOBAL LEADERSHIP
Overall, our product line remains the global leader, number
one or two in virtually every market we serve, and we are
committed to delivering the best quality to our customers.
Our brands are strong and recognized worldwide as the
highest in customer value. Our global manufacturing footprint
is well established, with a highly integrated supply chain. Our
distribution, sales, rental and product support capabilities
are stronger than any competitor, delivering a terrific value
proposition to our demanding customer base. Our service
businesses are growing at a record pace. Further, our invest-
ments in product technology are growing, and our employees
are the best and most experienced in the business.
MORE RECORD YEARS AHEAD
With all this, we feel good about our growth potential. In 2010,
we’re targeting $50 billion in sales and revenues with 15 to
20 percent interim annual growth in earnings per share. We’re
(left to right) Stu Levenick, Group President; Doug Oberhelman, Group President; Jim Owens, Chairman and CEO; Gerry Shaheen, Group President; Gérard Vittecoq, Group President; Steve Wunning, Group President
FINANCIAL HIGHLIGHTSEXECUTIVE OFFICE

20° 40° 60° 0°
40°
150°
100° 140°
40°
150°
0° 40° 60° 100° 0°
40°
40°
150°
140° Equator
150°
20°
$3
,22
2
$4
,18
4
$4
,88
7
03 04 05
$7
,31
0 $1
0,3
37
$1
2,8
22
03 04 05
TOTAL SALES(dollars in millions)
Cat Dealer Employees44,364
Machinery Engines
Cat Dealers59Cat Employees43,933
$2
,35
6
$2
,99
4
$3
,63
8
03 04 05
$3
,59
6
$4
,51
1
$5
,22
2
03 04 05
TOTAL SALES(dollars in millions)
Cat Dealer Employees26,517
Machinery Engines
Cat Dealers50Cat Employees23,137
TOTAL SALES(dollars in millions)
Cat Dealer Employees14,666
Machinery03 04 05
Engines03 04 05
Cat Dealers33
$7
93
$8
62
$1
,04
2
$9
28
$1
,51
0
$1
,98
2
Cat Employees11,688
TOTAL SALES(dollars in millions)
Cat Dealer Employees19,890
$9
99
$1
,45
2
$1
,50
8
03 04 05Machinery
$1
,84
4
$2
,48
6
$2
,90
5
03 04 05Engines
Cat Dealers40Cat Employees6,358
6 CATERPILLAR 2005 Annual Report
$4.41
NORTH AMERICA2005 TOTAL SALES (in billions)
LATIN AMERICA2005 TOTAL SALES (in billions)
$8.86
CATERPILLAR MACHINE & ENGINE FACILITYCity: Gosselies Country: Belgium
ASIA PACIFIC
CATERPILLAR MACHINE FACILITYCity: Xuzhou Country: China
EUROPE, AFRICA, THE MIDDLE EAST AND THE COMMONWEALTH OF INDEPENDENT STATES (EAME)
CATERPILLAR MACHINE FACILITYCity: Piracicaba Country: Brazil
$3.02
CATERPILLAR ENGINE FACILITYCity: Mossville, IllinoisCountry: United States
NORTH AMERICALATIN AMERICAOur products, services and technologies fall into three prin-cipal lines of business:
MACHINERY
Caterpillar® machines do the world’s work. From earthmov-ing, mining and construction projects to forestry, waste, paving and any number of other applications, we have the right equipment — large and small — to help our custom-ers get the job done right. We also lead the industry in the distribution of equipment and parts and offer that exper-tise to others through Caterpillar Logistics Services, Inc., one of the world’s largest integrated logistics organiza-tions with more than 60 third-party clients.
ENGINES
Caterpillar reciprocating engines and engine systems pro-vide power to the world. Our engines power our own con-struction and mining machines — plus trucks, ships and boats — and much more. Electrical power systems supply both primary and standby power for a wide variety of uses. Solar® industrial gas turbines power the production, pro-cessing and transporting of crude oil and natural gas and provide electrical power to many industries.
FINANCIAL PRODUCTS
We help customers around the globe purchase Cat and related equipment (new and used) through Caterpillar Financial Services Corporation and its subsidiaries. Customers can protect their Cat equipment by using various types of insur-ance offered by Caterpillar Insurance Holdings, Inc.
CATERPILLAR BRANDS
CATERPILLAR AT A GLANCE
ASIA / PACIFIC2005 TOTAL SALES (in billions)
EAME2005 TOTAL SALES (in billions)
Manufacturing Facilities
Office and Other Facilities
Dealer Main Stores
LEGEND
$17.71
Caterpillar at a Glance 7
ASIA / PACIFICEAMENORTH AMERICA LATIN AMERICA

The development of the updated Code of Conduct,
Our Values in Action, was a team effort, involving
Caterpillar employees from across the globe and
our many business units. While reflecting the
diversity of our employee base, the Code provides
a unifying force and a tangible expression of our
single, global Caterpillar culture.
Integrity. Excellence. Teamwork. Commit-
ment. These values are at the center of our Code
and provide Caterpillar employees with a guide to
making sound, ethical decisions every business
day that serve the interests of all Caterpillar
stakeholders. At Caterpillar, we strive to move
beyond mere compliance with the laws and regu-
lations that govern our business. The Code is proof
of our commitment to build a business in which
our employees can take pride, a company others
respect and admire, and a world made better by
our activities.
AT RIGHT: Some of the members of the Caterpillar
Worldwide Code of Conduct Team, from left to right:
Paul Gaeto, Julia Kindred, Brian Gareau, Deborah
Butler, Kate Parker, Julie Lagacy, Michael Worth
ONE TEAM CATERPILLAR, FOUR VALUES
PERFORMANCE STARTS WITH INTEGRITY
“Caterpillar’s work brings together thousands of people from around the globe, each with different backgrounds and experiences.
What keeps our company grounded is a culture based on basic but far-reaching values. In 2005, we updated our Worldwide Code of
Conduct to bring those values to the surface and explain to employees what they mean to Caterpillar’s business.
“Integrity is the first of these values, because it is the foundation of all we do. It means that we’re honest in our words and actions.
It means that when we promise something to a colleague or a customer, we do our utmost to deliver. It means we are respectful, open
and honest in all interactions. It means that we won’t ‘look the other way’ or have anything to do with unethical business practices —
no matter where on the globe we operate. Certainly, building trust is the best way to enhance our reputation and to strengthen our
relationships with those who rely on us. But more importantly, it is the right thing to do.”
MARK DAMSCHRODER, DIRECTOR OF CATERPILLAR’S OFFICE OF BUSINESS PRACTICES: PEORIA, ILLINOIS
WE ARE MEETING HIGHER STANDARDS
A single set of core values unites Caterpillar across six continents, multiple business units, diverse customer industries and 85,000+ employees. These values — integrity, excellence, teamwork and commit-ment — are a direct outgrowth of the work we do together building, financing, maintaining, remanufacturing and supporting the world’s leading construction and mining equipment, engines and turbines.
OUR WORKIS DRIVEN BY OUR VALUES
OUR WORK: SECTION ONE
Our Work is Driven by Our Values 9

10 CATERPILLAR 2005 Annual Report Our Work is Driven by Our Values 11
WE ARE FINDINGA BETTER WAY
MAKING EXCELLENCE AN EVERYDAY EXPERIENCE
Perhaps no other organization has embraced 6 Sigma as fully as Caterpillar. Our use of 6 Sigma is literally transforming our business.
Since its introduction at Caterpillar in 2001, 6 Sigma has rapidly become integral to sustaining our competitive advantage. 6 Sigma
has dramatically enabled the revenue and profit gains Caterpillar has experienced in the last few years — and in 2005 alone 6 Sigma
projects generated more than half a billion dollars in benefits directly related to supply chain issues. More than 42 percent of our
workforce has been involved with at least one of the nearly 35,000 6 Sigma projects deployed since 2001. Thanks to the leadership of
people like 6 Sigma Master Black Belt Pierre Tricnaux of Gosselies, Belgium, who coordinated the first “mixed” 6 Sigma training involving
both Cat employees and suppliers in Europe, our work with key suppliers and dealers continues to strengthen our value chain. Almost
350 Cat suppliers worldwide now have more than six hundred 6 Sigma black belt project leaders — and almost 160 Caterpillar dealers,
approximately 90 percent, have deployed 6 Sigma in their businesses.
One of Caterpillar’s largest suppliers in Europe
and the rest of the world is the Fontana Group, a
multinational manufacturer of high-strength fas-
teners and other hardware. Based in Veduggio,
Italy, Fontana first became a Caterpillar supplier
in 1963. Over the years, Fontana has become more
than just a supplier to Caterpillar — it has served
as a strong business partner. Today, Fontana is a
major supplier and partner for Caterpillar facilities
in Belgium, France and North America. Fontana
has received several awards from Caterpillar,
including our annual quality improvement award
for the parts it provides to our Mossville, Illinois,
facility. Fontana has embraced 6 Sigma after being
exposed to its benefits through its association
with Caterpillar. Among the 6 Sigma projects
Fontana has launched are a joint working group
with Caterpillar to determine and coordinate com-
mon technical and engineering activities, a con-
solidation of existing parts and a new product
design effort dedicated to reducing the proliferation
of parts and components.
EXTENDING THE POWER OF 6 SIGMA
PIERRE TRICNAUX, 6 SIGMA MASTER BLACK BELT — GLOBAL PURCHASING: GOSSELIES, BELGIUM
CAT SUPPLIER FONTANA’S FACTORY FLOOR

12 CATERPILLAR 2005 Annual Report Our Work is Driven by Our Values 13
WE ARE WORKINGAS ONE
DARPA CHALLENGE ENTRANT H1GHLANDER
TEAMWORK TAKES THE PRIZE
For the first time, robotic vehicles completed a 132-mile off-road race through the Mojave Desert — with no humans at the helm.
Caterpillar research, engineering and sponsorship propelled three vehicles, which demonstrated for the Defense Advanced Research
Projects Agency (DARPA) the real-life applications of self-guided robotic technology.
Caterpillar collaborated closely with Carnegie Mellon University to design and provide technology for two vehicles, which finished
second and third in the race. Cat engineer Josh Struble even moved to Pittsburgh to lead the “Red Team” of electronics engineers,
which used Cat hardware platforms, wrote new software and developed new power systems. Working with international leaders and
graduate students in the robotics field ties in directly with ongoing work at Caterpillar’s Tech Center in Mossville, Illinois, since much
of the new technology will apply to future Cat machine research.
Caterpillar also sponsored the fifth-place vehicle fielded by Oshkosh Truck, a company that sources Cat engines for the military.
The DARPA victories demonstrate the power of Caterpillar’s partnerships with research institutions and other companies.
The sun was just rising over the Mojave Desert on
the morning of October 8, 2005, as 23 vehicles
set out to conquer a 132-mile course through the
desert’s untamed terrain. It couldn’t have been
further from your typical road race: These vehi-
cles — participating in the DARPA Grand Challenge
2005 — were expected to literally navigate their
own paths to the finish line, without human guid-
ance or interference.
Nearly seven hours later, the first robotic
vehicle completed the course. Just 12 minutes
behind this winner was “Sandstorm,” the first of
two vehicles engineered in part by Caterpillar
and competing for the “Red Team.” In another
10 minutes, the second Red Team vehicle,
“H1ghlander,” was the third to make history. As
no vehicle even finished the inaugural Grand
Challenge in 2004, this year’s teams demon-
strated significant strides in robotics engineering
and technology.
ROBOTS VICTORIOUS
THOMAS GIESE AND SAM KHERAT, TECHNOLOGY & SOLUTIONS DIVISION; LARRY MUELLER, CAT ELECTRONICS; KEN STRATTON, TECHNOLOGY & SOLUTIONS; DAVE HUDSON, GLOBAL MINING; JOSHUA STRUBLE AND MIKE ROUSSIN, TECHNOLOGY & SOLUTIONS: CATERPILLAR EMPLOYEE MEMBERS OF THE DARPA RED TEAM

14 CATERPILLAR 2005 Annual Report Our Work is Driven by Our Values 15
WE ARE DIGGINGDEEPER
COMMITTED TO CUSTOMERS
With the mining industry experiencing unprecedented growth around the globe, Caterpillar has turned up the heat on its mining
equipment production across the board, working around the clock to increase production. Caterpillar moved quickly in 2005 to upgrade
its manufacturing facility in Decatur, Illinois, dramatically boosting production capacity at a critical site. Decatur manufactures
Caterpillar’s newest mining innovation, the 793D mining truck, introduced in October with five distinct configurations that offer custom-
ers a broad choice to best suit their specific needs. All 793Ds are designed to provide low cost per ton with uncompromising quality.
In this extraordinary time, customers are looking to Caterpillar more than ever — not just to supply them with equipment — but
also for ideas and strategies for responding to the high demand. In 2005, current industry challenges were a much-discussed topic at
Caterpillar’s annual Global Mining Forum, where Caterpillar listened to customers and shared plans for helping meet the high demand.
The global mining industry is enjoying unprece-
dented demand for the minerals, metals and
energy fuels it extracts — copper, lead, zinc, iron,
gold, nickel and other mined commodities are all
trading at record or near-record highs. Fueled by
growing global demand, most notably in China
and India, mining companies are expanding pro-
duction. Caterpillar’s Global Mining Division is a
major partner of the industry — supplying the
trucks, loading tools and support equipment
needed by mines to responsibly extract minerals
and energy fuels. Caterpillar has significantly
increased its production of mining trucks in the
last three years. And we’re working in close part-
nership with our dealers and customers to sched-
ule product deliveries, optimize parts logistics,
extend tire life and track component lives — to
keep the wheels turning on the world’s fleet of Cat
mining equipment.
MEETING RECORD DEMAND
HEATHER BARNA, FABRICATION SPECIALIST-3, LARGE MINING TRUCK LINE — MINING & CONSTRUCTION EQUIPMENT DIVISION: DECATUR, ILLINOIS
A CAT 793 ON SITE AND AT WORK

Our Work is Not Finished 17
WE ARE SPEAKING A DIFFERENT LANGUAGE
ACCELERATING ASIAN OPPORTUNITIES
No other country or region can match the growth opportunities that China presents for Caterpillar. But the prospects come with a
pressing need to move quickly in this fast-growing market because Caterpillar’s global leadership demands success in the region.
Caterpillar made great strides in 2005 investing in a new Innovation Center in Qingdao, Shandong Province, to accelerate the
introduction of Cat technology in China and position Caterpillar as a national leader. The Center will support China-based ventures
including Shandong SEM Machinery, a key Chinese wheel loader manufacturer providing new opportunities in China.
In the third quarter, several Caterpillar divisions became involved with the Shanghai Municipal Government, developer of
the world’s largest industrial park, including Cat Reman and Cat Logistics. As part of the project, Caterpillar and the developer
are working to facilitate trade and investment in the Shanghai region, which will help drive the success of Caterpillar’s China
Distribution Center and Remanufacturing Services Operations.
NANJING DONG LU JOB SITE: SHANGHAI, CHINA
One of the world’s largest natural gas fields
is tucked away in a remote area of Western Siberia
— an unforgiving arctic wilderness where tem-
peratures can dip below a chilling - 40 degrees. In
the remote Yamal-Nenets Autonomous Region
more than 30 Caterpillar® earthmovers work
22-hour days, seven days a week, to help Stroygas-
consulting build and maintain a network of
access roads that bring the region’s resources
within reach.
Most site work can be done only during
the frigid winter months when the ground is frozen.
Cat machines can reliably withstand the winter’s
punishing conditions and schedule. The Cat 740
articulated truck is particularly versatile. It can use
the existing access roads vulnerable to spring’s
melting snow and heavy rains without inflicting
significant surface damage, and its rough terrain
capability and low ground pressure mean it can
work when the ground is softer or frozen.
TACKLING THE SIBERIAN TUNDRA
CATERPILLAR® D9 AT WORK IN SIBERIA
Even though Caterpillar is an 80-year-old company, we are just getting started. Our work today enables tomorrow’s progress — and the building of an economic and social infrastructure designed to meet the growing demands of a growing world.
OUR WORKIS NOT FINISHED
OUR WORK: SECTION TWO

TAR SANDS, ALBERTA, CANADA
33PERCENT
18 CATERPILLAR 2005 Annual Report Our Work is Not Finished 19
Alberta’s oil sands site—known as the Athabasca
Oil Sand Deposit—is the world’s largest deposit
of oil, housing an estimated 1.7 to 2.5 trillion
barrels of crude oil. It’s understood that there is
little potential of finding conventional crude oil
fields in North America beyond the Gulf Coast, so
these oil sands are truly a buried treasure. They
potentially represent more than one-third of the
world’s oil reserves—as much as all the existing
proven reserves of liquid petroleum in the world.
Mining the Athabasca sands produces more than
882,000 barrels of crude each day, and the supply
is beginning to feature prominently in international
trade talks as inexpensive oil becomes more and
more scarce. Production is expected to continue
for at least another 50 years, with output expected
to increase sixfold by the year 2030. The petro-
leum contained within the Athabasca Oil Sands
represents one of the most promising possible
sources of non-Middle Eastern oil available, and
will likely play an increasingly important role in
meeting the ever-growing global demand for oil.
UNEARTHING POWER
A fleet of more than 100 Cat 797 trucks along with hundreds more Cat machines are hard at work freeing up a treasure trove of energy
buried in 54,000-plus square miles (139,860 sq km) of earth in Alberta, Canada. The deposits contain a staggering amount of crude
oil in the form of oil sands. After initial processing with hot water and certain chemicals, the oil is extracted from the sands in a
syrupy state called bitumen. But to get to this stage, the overburden above the sands must first be removed and hauled away before
the oil-bearing sands can be delivered to the processing facilities.
Cat dealer Finning (Canada) dedicates 10 percent of its 3,000-person workforce to perform the 24/7 service and fleet maintenance
this extreme operating environment demands. Working in soft underfoot conditions in the summer and frigid temperatures in the
winter, machines require dedicated, comprehensive support. In the tightly scheduled, highly productive oil sands mines, unscheduled
shutdowns are not an option.
BURIED TREASURE
WE ARE PROVIDINGTHE FUEL FOR GROWTH
ATHABASCA OIL SANDS: ALBERTA, CANADA
THE ATHABASCA OIL SANDS COULD POSSIBLY CONTAIN A LITTLE MORE THAN ONE-THIRD OF THE WORLD’S PROVEN OIL RESERVES.

20 CATERPILLAR 2005 Annual Report Our Work is Not Finished 21
WE ARE ADVANCING PROGRESS
For the past 15 years, India has closely followed
China as the world’s second-fastest-growing
economy. Infrastructure is needed to support a
rapidly expanding economy fueled by entrepre-
neurship, and Caterpillar is leading the charge in
projects like the National Highway Authority of
India’s Golden Quadrilateral. With just over 500
miles to go, the “GQ” will ultimately encompass
3,625 miles (5,834 km) of four-to-six-lane high-
way that connects the four major metro areas of
Delhi, Kolkata, Mumbai and Chennai. Nearly 170
Cat machines are moving earth for the GQ while
about 50 Cat generator sets provide power for the
project. The Golden Quadrilateral is just one of
the most prominent examples of the kind of basic
infrastructure building that Caterpillar enables in
the developing world. Across growing economies
in Asia, Latin America and Africa, Cat machines,
generators and turbines are building the roads,
airports, hospitals and sewer systems that the
developing world needs.GRADING THE GOLDEN QUADRILATERAL
BUILDING A RESERVOIR OF CLEAN ENERGY
With its geothermal hot springs and glacial rivers, Iceland has long been a leader in the use of clean, renewable energy sources.
The ability to create low-cost, environmentally-friendly electricity has been a major factor in Iceland’s industrial development in
recent years.
Iceland’s latest project draws together two glacial rivers in a single reservoir to power generators deep inside the mountains.
The resulting output of 4,600 gigawatts of electricity will run Alcoa’s new aluminum smelting plant under construction in Northeast
Iceland. The reservoir is expected to begin generating power in April 2007.
Cat equipment was needed to construct site roads and otherwise prepare the area for construction of what will be Europe’s
highest rock-filled dam. Iceland Cat dealer Hekla won contracts to supply the bulk of the equipment needed and formed a joint
venture with Italian dealer CGT to supply one of the two contractors. The two contractors from Iceland and Italy chose Hekla and
CGT because of machine reliability and excellent dealer service.
BUILDING ROADS TO ECONOMIC GROWTH
KARAHNJUKAR HYDROPOWER PROJECT: EASTERN ICELAND

22 CATERPILLAR 2005 Annual Report Our Work is Not Finished 23
Emission-reducing ACERT clean-diesel technology
is at work in nearly 12,000 machine engines,
nearly 4,500 Caterpillar industrial engines and
more than 300,000 on-highway truck and bus
engines. This breakthrough technology from
Caterpillar was the first to reduce emissions at
the point of combustion, and capitalizes on
Caterpillar’s proven leadership in engine elec-
tronics, fuel injection systems and combustion
technology. More than 400 6 Sigma projects led
to the development of ACERT Technology. With
even-more stringent emissions regulations slated
to take effect in 2007, Caterpillar is in the pro-
cess of field-testing a new generation of ACERT
Technology that will meet or exceed the 2007
standards. We will be ready to ship 2007- compliant
engines before the new regulations come into
play. In addition, ACERT Technology not only
achieves emissions compliance for its customers
— it also offers superior fuel economy that saves
them money.
WE ARE RISING TO THE CHALLENGE
ACERT® TECHNOLOGY: NEW STANDARDS A HALF CENTURY OF TECH LEADERSHIP
Fifty years after its trailblazing introduction, Caterpillar’s D9 track-type tractor retains its edge as a technologically advanced
bulldozer with the power and reliability its operators have come to expect.
Launched in 1955 to answer market demands for a larger, stronger track-type tractor, the D9 embodied Caterpillar’s talent
for innovation and delivered a host of state-of-the-art features — a new engine, powertrain, stronger track and a new transmission
system — that made it the world’s most powerful production track-type tractor. Through continued modernization and cutting-edge
technology, Caterpillar has worked hard to keep today’s iteration, the D9T, just as cutting-edge. A global leader in its size class, the
D9T looks and operates quite differently from its ancestor, but shares the same high quality and uncompromised reliability — and
features high-tech exclusives that leave its competitors in the dust. AccuGrade® GPS and electro-hydraulic controls make operation
easier and more productive — and an 18-liter Cat C18 engine with ACERT® Technology ensures the kind of environmentally responsible
performance today’s world requires. CAT C18 ENGINE WITH ACERT® TECHNOLOGY
CATERPILLAR’S TINAJA HILLS DEMONSTRATION & LEARNING CENTER: GREEN VALLEY, ARIZONA

24 CATERPILLAR 2005 Annual Report Our Work is Not Finished 25
Caterpillar is more than just a manufacturer. The
company is a leader in the services that allow our
customers to finance, maintain and support our
machines. An industry leader in providing inte-
grated logistics solutions and supply chain man-
agement, Cat Logistics serves more than 60
third-party clients worldwide. Leveraging Cater-
pillar’s expertise in building its own logistics
capabilities positions clients for stronger perfor-
mance. In 2005, General Motors Europe formed
a joint venture with Cat Logistics, allowing for the
largest logistics services agreement since its for-
mation in 1987.
Solid profit performance and investment-
grade credit ratings are mainstays of Cat Financial,
the company’s finance division. Record revenues
continued in 2005, along with growth opportunities
in China. Also this year, the division introduced
the Cat AccessAccount,TM a flexible, revolving
charge account that customers use to pay for parts,
service and rentals at most U.S. Cat dealers.
WE ARE DOING MORETHAN BUILDING
CATERPILLAR REMANUFACTURING FACILITY: PRENTISS COUNTY, MISSISSIPPI
RIGHT PLACE, RIGHT TIME, RIGHT TERMS GOOD AS NEW
One of Caterpillar’s unique capabilities is remanufacturing, an advanced recycling process that helps lower customer costs and contributes
to a sustainable environment. Founded in the 1970s, today Cat Reman is one of the world’s largest remanufacturers.
Cat Reman annually remanufactures more than 2 million units — recycling more than 135 million pounds of products at its
facilities in North America, Europe and soon in China. Using 6 Sigma, we introduced more than 30 new Reman products in 2005.
The division’s recent move to offer its capabilities to original equipment manufacturers in other industries has attracted top
companies. In 2005, Cat Reman formed new alliances with both Land Rover, as a preferred supplier for remanufacturing products and
services, and with longstanding business partner Honeywell, as a remanufacturer of its Garrett® turbochargers.
Cat Reman also acquired a minority stake in French remanufacturer Eurenov S.A. to expand its European presence in automotive,
industrial engine and transmission remanufacturing. With top-line growth of 65 percent since 2001, Cat Reman is well-positioned as
a growth division for the 21st century. CAT FINANCIAL NEW RETAIL FINANCING
(dollars in millions)
05040301 02
$8,049
$9,948
$11,660
$7,287$6,813

26 CATERPILLAR 2005 Annual Report Our Work is Not Finished 27
WE ARE LENDING A HAND
In February 2005, Venezuela was battered by
torrential rains that destroyed or severely dam-
aged a good portion of the country’s infrastructure
and marooned much of its rural, poor population.
Immediately, the government declared an emer-
gency in six states and the Caracas metro area. The
Minister of Infrastructure’s office began seeking
a contractor to supply 300 machines necessary
for emergency rebuilding and repair. Competing
against two other companies, Cat dealer Venequip
quickly arranged a plant tour for the Minister and
other officials. Venequip was ultimately hired to
provide Cat equipment plus operator training,
product support shops and parts inventory, laptop
computers and other support items. The machines
went directly to work — repairing roads, bridges
and other infrastructure in a way that is helping
the people of this country reclaim their lives and
mobility. This quick response is indicative of the
commitment Caterpillar and its dealers have to
the communities in which we do business.
HURRICANE KATRINA FLOOD RELIEF EFFORTS: NEW ORLEANS, LOUISIANA
VENEZUELAN FLOOD RELIEF REBUILDING INFRASTRUCTURE, REBUILDING LIVES
When natural disasters strike, Caterpillar, its dealers and employees respond with the equipment, know-how and money these
stricken areas so desperately need. Caterpillar’s immediate, widespread response to hurricanes Katrina, Rita and Wilma mobilized
products, personnel and resources to assist the governmental and third-party agencies with disaster relief. High-level actions: ship-
ping Cat power modules to the Gulf Coast to power both homes and pumping efforts. Diverting significant commercial equipment
to aid in recovery and cleanup. Shipping machines ready to work upon arrival. Increasing and expediting parts delivery to support
working equipment. Mobilizing technicians from Solar Turbines to help our oil and gas customers assess and repair equipment on
and off-shore and get back up and running. Many Caterpillar employees traveled to the region to physically assist and thousands
gave generously from their pocketbooks, with contributions matched by the Caterpillar Foundation.
A CAT EXCAVATOR ATTACKS A MUDSLIDE

28 CATERPILLAR 2005 Annual Report Our Work is Not Finished 29
Hôpital Albert Schweitzer (HAS) in Deschapelles,
Haiti, serves 5,000 sick and injured people each
month. To help ensure that these hurting people
receive much-needed healthcare, four Caterpillar
3400 generator sets work nonstop behind the
scenes providing electricity for the hospital.
“Without the electricity provided by Caterpillar
generators, our work would be difficult, to say
the least,” said Debbie Berquist Jules, HAS’s
chief operating officer. “Equipment sterilization
would take longer, anesthesia machines wouldn’t
work, and the nurses would have to do their work
by candle or lamp light.” To put things in per-
spective, the area surrounding the hospital has
been without power for nearly a year, due to
problems with the country’s electrical grid. Prior
to that, power was sporadic at best. As a result
of this situation, many local children use the
dependable, always-on hospital security lights
to provide illumination so they can complete
their homework.
ATERRO SANITÁRIO MUNICIPAL BANDEIRANTES: SÃO PAULO, BRAZIL
CAT POWER PROVIDES CRITICAL CARE WASTE NOT
Landfill-emitted methane and carbonic gases wreak havoc on the environment, accelerating global warming and contaminating the
air we breathe. São Paulo’s Aterro Sanitário Municipal Bandeirantes — Brazil’s main sanitary landfill — produces literally tons of this
unfortunate by-product. The city and one of the landfill’s operators decided to get creative, and turned to Caterpillar to help build
a gas power generation plant on site that converts the gases into electrical energy, which is supplied to the local electric company
as well as local businesses.
Local Cat dealer Sotreq S.A. plays a pivotal role in the project, which is expected to reduce methane emissions by 8 million
tons over 15 years. Sotreq designed a turnkey conversion solution, then built the power plant. It houses and maintains 24 16-cylinder
Cat generator sets, each producing 925 kilowatts of continuous power, to keep the plant in production. Sotreq also provided project
management and logistics management, and helped integrate plant suppliers. Today, dealer personnel are on site 24 hours a day,
ensuring nonstop operation of what has become the world’s largest sanitary gas-powered energy generation center.
WE ARE LOOKINGTO THE FUTURE
CHILDREN OUTSIDE HÔPITAL ALBERT SCHWEITZER

Management’s Review of Operations 31
MANAGEMENT’S REVIEW OF OPERATIONS
Team Caterpillar’s focus in 2005 on meeting unprecedented
customer demand produced another strong year for Caterpillar
— in both record sales and revenues as well as profit per share.
Employees, suppliers and dealers all responded incredibly well
to realize the opportunity.
In 2005, sales and revenues reached $36.34 billion,
up $6.03 billion, or 20 percent, from 2004. The increase was
a result of $2.64 billion of higher Machinery volume, $1.08
billion of higher Engine volume, $1.83 billion of improved
price realization and a $363 million increase in Financial
Products revenues. Currency had a positive impact on sales
of $128 million.
Full-year profit was the highest in company history—
$2.85 billion, or $4.04 per share, up 40 percent. The improve-
ment was primarily the result of higher price realization and sales
volume, partially offset by an increase in core operating costs.
The increase was a result of higher manufacturing costs, primar-
ily material costs and supply chain-related inefficiencies. The
remainder of the increase was to support the significant increase
in sales volume along with new product programs.
Machinery and Engines operating profit as a percent of
sales increased substantially — from 8.3 percent in 2004 to
10.3 percent in 2005. The increase was the result of improved
price realization, higher sales volume and management of
period cost structure, somewhat offset by continued pressure
on variable manufacturing costs.
2005 was a strong year for operating cash flow — $3.11
billion on a consolidated basis and $2.81 billion for Machinery and
Engines, which included $912 million of pension contributions.
For Machinery and Engines, operating cash flow was primarily used
to repurchase 33.9 million shares of stock, fund $1.16 billion of
capital expenditures and pay $618 million of dividends.
Operating profit in 2005 improved $1.10 billion, or 41
percent, from 2004, driven by higher price realization and sales
volume, partially offset by higher core operating costs and
retirement benefits.
MACHINERY
Machinery sales in 2005 were $22.93 billion, an increase of
$4.09 billion, or 22 percent, from 2004. Sales were an all-time
record for a year. Sales volume accounted for $2.64 billion
of the increase, price realization added $1.34 billion and the
remaining $107 million was due to currency.
Growth in sales volume resulted from increased ship-
ments to dealers in response to broad-based gains in reported
dealer deliveries to end users. All regions and most industries
participated in this growth, which showed little sign of abating
as the year ended. Worldwide, dealers reported increases to
machine inventory in both 2004 and 2005. At the end of 2005,
dealers reported lower machine inventory, as measured by
months of supply, than at the end of 2004.
In North America, sales were up $2.49 billion, or 24
percent, from 2004. Sales volume increased $1.65 billion and
price realization added $832 million. Growth in sales volume
resulted largely from increased sales through our dealer
network, the result of favorable metals and energy prices and
increased construction spending. Dealers built machine inven-
tories in line with deliveries so that inventories in months of
deliveries were the same as at the end of 2004.
Sales in Europe, Africa, the Middle East and the Com-
monwealth of Independent States (EAME) increased 16
percent, or $711 million, compared to 2004. Sales volume
accounted for $421 million, improved price realization added
$253 million and the remaining $37 million came from the
favorable impact of currency. Volume growth occurred as a
result of increased sales through our dealer network. Low
interest rates benefited housing construction in Europe, and
higher metals and energy prices supported both construction
and mining in Africa/Middle East (AME). Mining and energy
investment in the Commonwealth of Independent States (CIS)
increased and had a positive effect on Caterpillar sales.
In Latin America, sales rose $472 million, or 31 percent,
from the same period a year ago — $304 million from increased
2005FINANCIAL REVIEW
OUR WORK: SECTION THREE

32% Heavy Construction
27% General Construction
18% Mining
4% Industrial 3% Forestry 3% Waste
5% Paving/Other
8% Quarry & Aggregates
NEW MACHINE DISTRIBUTION TO END USERS(2005 worldwide distribution by major end use)
NEW ENGINE DISTRIBUTION TO END USERS(2005 worldwide distribution by major end use)
30% Electrical Power
29% On-Highway
24% Oil & Gas
9% Industrial
8% Marine
32 CATERPILLAR 2005 Annual Report Management’s Review of Operations 33
ENGINES
Sales were $11.08 billion in 2005, up $1.58 billion — or 17
percent — from 2004. Volume accounted for $1.08 billion,
price realization added $484 million and currency added
$21 million.
Dealer engine inventory increased during both full-year
2005 and 2004. The 2005 inventory increase was less than
the 2004 increase, which slightly reduced the company’s year-
over-year sales growth. Months of inventory relative to deliveries
declined in most regions and sectors compared to 2004.
In North America, sales were up 17 percent. Sales of
petroleum engines increased 50 percent, primarily from
increased sales of reciprocating engines for drilling and gas
compression and turbines and related services for gas produc-
tion and transmission. High oil and gas prices were a signifi-
cant factor behind the increase in sales. Sales of on-highway
truck engines were up 5 percent, primarily due to expansion
and replacement of truck fleets. Sales of electric power engines
were up 21 percent, with widespread demand for generator
sets for communications, data center and standby applications.
Marine engine sales were up 33 percent, primarily from in-
creased demand for workboats and petroleum support vessels.
Sales in EAME increased 22 percent. Sales into the elec-
tric power sector were up 35 percent, with widespread growth
in demand for reciprocating generator sets, support from Mid-
dle East reconstruction efforts and incremental revenue from
the acquisition of Turbomach, a turbine generator set pack-
ager and service provider. Marine engine sales increased 20
percent, with strong demand for oceangoing and inland water-
way vessels. Sales of industrial engines were up 8 percent — a
result of increases in demand from a broad range of industrial
equipment customers, partially offset by lower demand from
agricultural equipment manufacturers. Petroleum engine sales
dropped 4 percent for the year, primarily from reduced ship-
ments for turbines and turbine-related services for offshore oil
platforms and gas transmission projects.
Latin America sales were up 21 percent. Sales of petroleum
engines increased 49 percent, with nearly all of the
increase from sales of turbines and turbine-related services
to support increased investment in oil production. Sales of
electric power engines increased 44 percent, benefiting from
investments in generator sets for electricity reliability and
disaster preparedness as well as demand for rental fleets. Sales
of industrial engines decreased 34 percent, with reduced
demand for engines for agricultural equipment. Sales of marine
engines declined 37 percent, impacted by limited shipyard
capacity and comparison with a high 2004 base.
In Asia/Pacific, sales were up 4 percent. Sales of marine
engines were up 26 percent, with increased demand for ocean-
going and petroleum support vessels due to strong freight and
petroleum demand. Petroleum engine sales increased 12
percent, with widespread demand for reciprocating engines for
petroleum site power, drilling and well support and demand for
turbines and related services to support production. Electric
power engine sales declined 19 percent, with most of the
decline due to centralized electrical demand management
actions and improved electricity reliability in China that drove
reduced demand for generator sets.
volume, $120 million from improved price realization and the
remaining $48 million due to currency, primarily related to a
stronger Brazilian real. Increased sales through our dealer
network into both construction and mining sectors
accounted for all the sales volume growth.
In Asia/Pacific, sales increased 17 percent, or
$419 million, compared to 2004— $259 million from higher
volume, $138 million from improved price realization and the
remaining $22 million due to currency. Sales volume in most
of the larger countries increased, a result of very strong mining
activity and continued growth in construction. In China, sales
were down modestly for the year.
Machinery operating profit of $2.43 billion was up $675
million, or 38 percent, from 2004. The favorable impact of
improved price realization and higher sales volume was par-
tially offset by higher core operating costs and higher retire-
ment benefits.
2005 2004 2003
(dollars in millions)
North America $ 4,887 $ 4,184 $ 3,222
EAME $ 3,638 $ 2,994 $ 2,356
Asia / Pacific $ 1,508 $ 1,452 $ 999
Latin America $ 1,042 $ 862 $ 793
(1) Does not include internal engine transfers of $2,065, $1,738 and $1,358 (dollars in millions) in 2005, 2004 and 2003, respectively. Internal engine transfers are valued at prices comparable to those for unrelated parties.
ENGINES(1): SALES BY GEOGRAPHIC REGION
CUSTOMERS BY INDUSTRY
2005 2004 2003
(dollars in millions)
North America $ 12,822 $ 10,337 $ 7,310
EAME $ 5,222 $ 4,511 $ 3,596
Asia / Pacific $ 2,905 $ 2,486 $ 1,844
Latin America $ 1,982 $ 1,510 $ 928
MACHINERY: SALES BY GEOGRAPHIC REGION

* Eliminations of ($160), ($89), ($105), ($131) and ($249) (dollars in millions) for 2001, 2002, 2003, 2004 and 2005 respectively, are required to arrive at consolidated operating profit.
EXPORTS FROM THE U.S.(dollars in millions)
01
$1
2,1
58
$1
1,9
75
$1
3,6
78 $
18
,84
4
$2
2,9
31
02 03 04 05
Machinery Engines
01
$6
,86
9
$6
,67
3
$7
,37
0
$9
,49
2
$1
1,0
75
02 03 04 05
Financial Products
01
$1
,48
3
$1
,53
7
$1
,75
9
$1
,97
0
$2
,33
3
02 03 04 05 01
$8
44
$9
18 $1
,19
9 $1
,75
6
$2
,43
1
02 03 04 05
Machinery Engines
01
$3
53
$1
73
$1
83 $
58
9
$1
,07
1
02 03 04 05
Financial Products
01
$3
26
$3
18
$3
93
$4
70
$5
31
02 03 04 05
01
$1
4
$1
3
$1
3
$1
7
$2
7
02 03 04 05
CORPORATE GIVING(dollars in millions)
01
$8
88
$9
09
$1
,03
7
$1
,23
2
$1
,55
2
02 03 04 05
Canada
01
$1
,22
9
$1
,11
4
$1
,26
9
$1
,60
2 $2
,21
9
02 03 04 05
Latin America
01
$1
,99
6
$1
,94
4
$2
,15
1
$2
,55
7 $3
,15
3
02 03 04 05
EAME
01
$1
,05
6
$1
,21
4
$1
,31
5 $1
,95
0
$2
,23
2
02 03 04 05
Asia / Pacific
SALES & REVENUES(dollars in millions)
OPERATING PROFIT*(dollars in millions)
01
$6
96
$6
56
$6
69
$9
28 $
1,0
84
02 03 04 05
RESEARCH AND DEVELOPMENT(dollars in millions)
01
$2
90
$2
84 $3
36 $
41
5
$4
45
02 03 04 05
(dollars in thousands)
FINANCIAL INFORMATION
Engines operating profit of $1.07 billion was up $482
million, or 82 percent, from 2004. The favorable impact of
improved price realization and higher sales volume was par-
tially offset by higher core operating costs and higher retire-
ment benefits.
FINANCIAL PRODUCTS
Revenues were $2.33 billion, up $363 million — or 18 per-
cent —from 2004. The increase was due primarily to a $211
million favorable impact from continued growth of earning as-
sets and an $89 million impact of higher interest rates on new
and existing finance receivables at Cat Financial. Also, there
was a $47 million increase in revenues at Cat Insurance, pri-
marily due to an increase in earned premiums.
Financial Products operating profit of $531 million was
up $61 million, or 13 percent, from 2004. The increase was
primarily due to $123 million favorable impact from the con-
tinued growth of earning assets at Cat Financial. Partially off-
setting this increase were $33 million in higher operating ex-
penses, primarily related to growth at Cat Financial and a $28
million decrease in operating profit at Cat Insurance, primarily
due to less favorable insurance reserve adjustments in 2005
than in 2004.
34 CATERPILLAR 2005 Annual Report Financial Information 35
FULL-TIME EMPLOYEES AT YEAR END
WHERE APPLICABLE, FINANCIAL INFORMATION HAS BEEN GROUPED AS:
Consolidated: Caterpillar Inc. and its subsidiaries
Machinery and Engines: Primarily our design, manufacturing, marketing and parts distribution operations for our machinery and engines lines of business
Financial Products: Our finance and insurance subsidiaries, primarily Caterpillar Financial Services Corporation (Cat Financial) and Caterpillar Insurance
Holdings, Inc.
STOCKHOLDER INFORMATIONSALES & REVENUES PER EMPLOYEE
2005 2004 2003
Inside U.S. 43,878 38,128 35,260
Outside U.S. 41,238 38,792 33,909
TOTAL 85,116 76,920 69,169
(by region)
North America 43,933 38,396 35,486
EAME 23,137 22,169 20,547
Latin America 11,688 10,733 8,533
Asia / Pacific 6,358 5,622 4,603
TOTAL 85,116 76,920 69,169
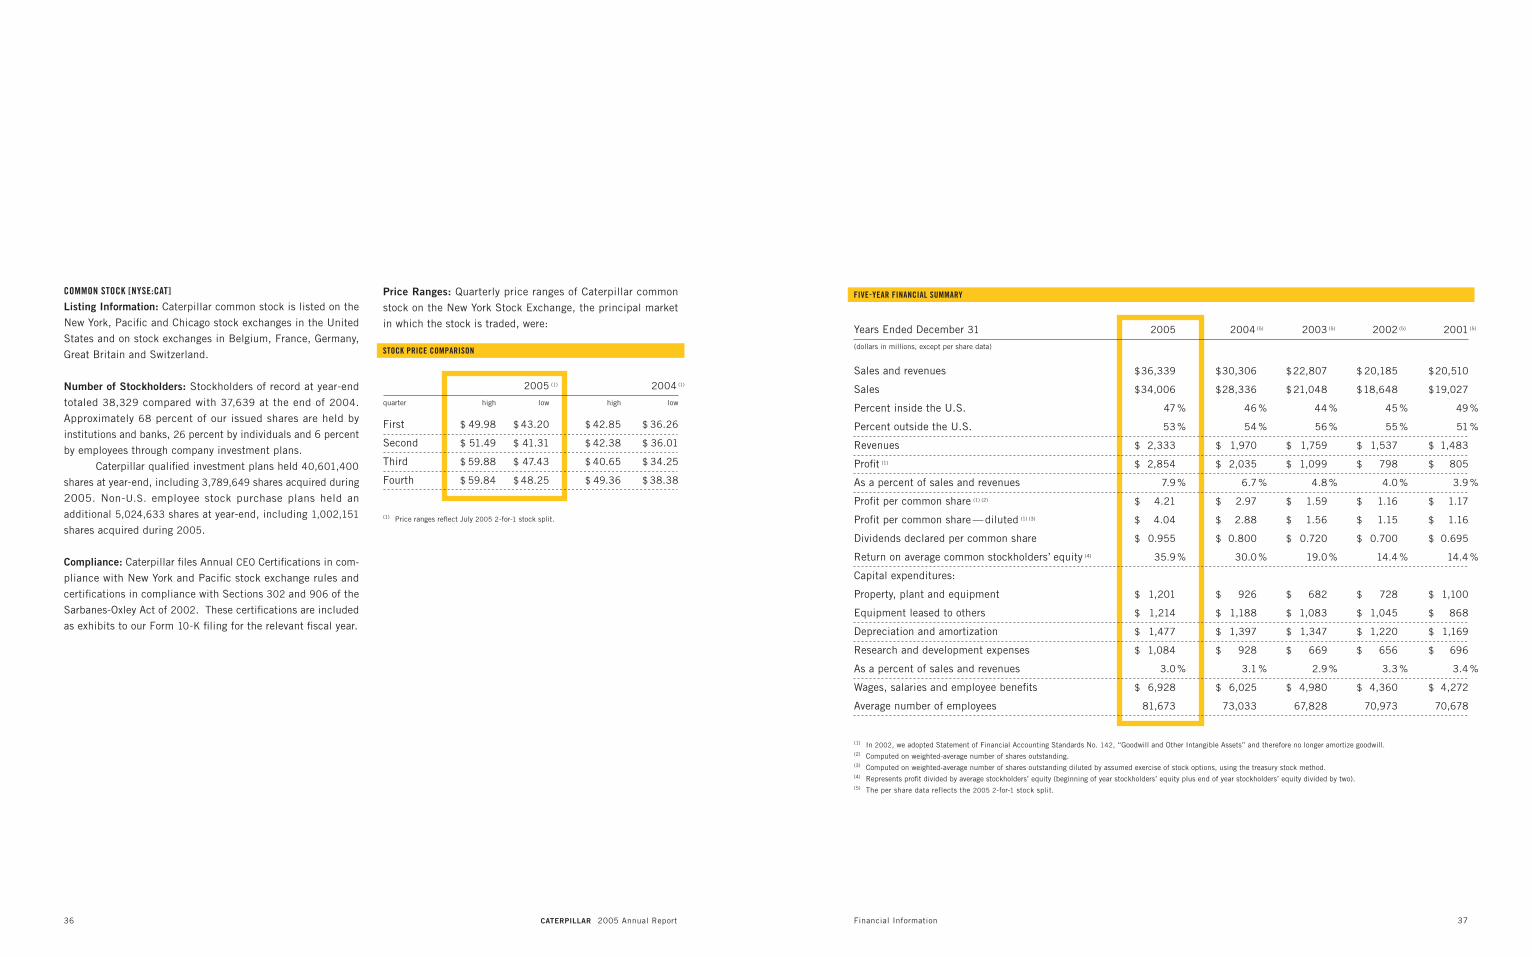
Years Ended December 31 2005 2004 (5) 2003 (5) 2002 (5) 2001 (5)
(dollars in millions, except per share data)
Sales and revenues $ 36,339 $ 30,306 $ 22,807 $ 20,185 $ 20,510
Sales $ 34,006 $ 28,336 $ 21,048 $ 18,648 $ 19,027
Percent inside the U.S. 47 % 46 % 44 % 45 % 49 %
Percent outside the U.S. 53 % 54 % 56 % 55 % 51 %
Revenues $ 2,333 $ 1,970 $ 1,759 $ 1,537 $ 1,483
Profit (1) $ 2,854 $ 2,035 $ 1,099 $ 798 $ 805
As a percent of sales and revenues 7.9 % 6.7 % 4.8 % 4.0 % 3.9 %
Profit per common share (1) (2) $ 4.21 $ 2.97 $ 1.59 $ 1.16 $ 1.17
Profit per common share — diluted (1) (3) $ 4.04 $ 2.88 $ 1.56 $ 1.15 $ 1.16
Dividends declared per common share $ 0.955 $ 0.800 $ 0.720 $ 0.700 $ 0.695
Return on average common stockholders’ equity (4) 35.9 % 30.0 % 19.0 % 14.4 % 14.4 %
Capital expenditures:
Property, plant and equipment $ 1,201 $ 926 $ 682 $ 728 $ 1,100
Equipment leased to others $ 1,214 $ 1,188 $ 1,083 $ 1,045 $ 868
Depreciation and amortization $ 1,477 $ 1,397 $ 1,347 $ 1,220 $ 1,169
Research and development expenses $ 1,084 $ 928 $ 669 $ 656 $ 696
As a percent of sales and revenues 3.0 % 3.1 % 2.9 % 3.3 % 3.4 %
Wages, salaries and employee benefits $ 6,928 $ 6,025 $ 4,980 $ 4,360 $ 4,272
Average number of employees 81,673 73,033 67,828 70,973 70,678
(1) In 2002, we adopted Statement of Financial Accounting Standards No. 142, “Goodwill and Other Intangible Assets” and therefore no longer amortize goodwill.(2) Computed on weighted-average number of shares outstanding.(3) Computed on weighted-average number of shares outstanding diluted by assumed exercise of stock options, using the treasury stock method.(4) Represents profit divided by average stockholders’ equity (beginning of year stockholders’ equity plus end of year stockholders’ equity divided by two).(5) The per share data reflects the 2005 2-for-1 stock split.
36 CATERPILLAR 2005 Annual Report Financial Information 37
COMMON STOCK [NYSE:CAT]
Listing Information: Caterpillar common stock is listed on the
New York, Pacific and Chicago stock exchanges in the United
States and on stock exchanges in Belgium, France, Germany,
Great Britain and Switzerland.
Number of Stockholders: Stockholders of record at year-end
totaled 38,329 compared with 37,639 at the end of 2004.
Approximately 68 percent of our issued shares are held by
institutions and banks, 26 percent by individuals and 6 percent
by employees through company investment plans.
Caterpillar qualified investment plans held 40,601,400
shares at year-end, including 3,789,649 shares acquired during
2005. Non-U.S. employee stock purchase plans held an
additional 5,024,633 shares at year-end, including 1,002,151
shares acquired during 2005.
Compliance: Caterpillar files Annual CEO Certifications in com-
pliance with New York and Pacific stock exchange rules and
certifications in compliance with Sections 302 and 906 of the
Sarbanes-Oxley Act of 2002. These certifications are included
as exhibits to our Form 10-K filing for the relevant fiscal year.
Price Ranges: Quarterly price ranges of Caterpillar common
stock on the New York Stock Exchange, the principal market
in which the stock is traded, were:
STOCK PRICE COMPARISON
FIVE-YEAR FINANCIAL SUMMARY
2005 (1) 2004 (1)
quarter high low high low
First $ 49.98 $ 43.20 $ 42.85 $ 36.26
Second $ 51.49 $ 41.31 $ 42.38 $ 36.01
Third $ 59.88 $ 47.43 $ 40.65 $ 34.25
Fourth $ 59.84 $ 48.25 $ 49.36 $ 38.38
(1) Price ranges reflect July 2005 2-for-1 stock split.

38 CATERPILLAR 2005 Annual Report Board of Directors and Officers 39
W. Frank Blount
Mr. Blount, 67, is chairman and CEO of JI Ventures, Inc. (venture capital)
and TTS Management Corporation (private equity management). He is former
chairman and CEO of Cypress Communications Inc. (telecommunications).
He is also director of ADTRAN, Inc., Alcatel S.A., Entergy Corporation and
Hanson PLC and serves on the advisory board of China Telecom in Beijing.
He has been a Caterpillar director since 1995.
Dr. John R. Brazil
Dr. Brazil, 60, is president of Trinity University (San Antonio, Texas) and
former president of Bradley University (Peoria, Illinois). He was elected a
director in 1998.
John T. Dillon
Mr. Dillon, 67, is vice chairman of Evercore Capital Partners (advisory and
investment) and senior managing director of the firm’s investment activities
and private equity businesses. He is the former chairman and CEO of
International Paper (paper and forest products). He is also a director of
E. I. du Pont de Nemours and Company, Kellogg Co. and Vertis Inc. He
became a Caterpillar director in 1997.
Eugene V. Fife
Mr. Fife, 65, is managing principal of Vawter Capital LLC (private invest-
ment). He is also the non-executive chairman of Eclipsys Corporation
(health information technology) and served as the interim CEO and presi-
dent of Eclipsys from April to November 2005. He became a Caterpillar
director in 2002.
Gail D. Fosler
Ms. Fosler, 58, is executive vice president and chief economist of The
Conference Board (research and business membership). Prior to her current
position, she was senior vice president of The Conference Board. She is also
a director of Baxter International Inc. She has been a Caterpillar director
since 2003.
Juan Gallardo
Mr. Gallardo, 58, is chairman of Grupo Embotelladoras Unidas S.A. de C.V.
(bottling). He is former chairman of Mexico Fund Inc. (mutual fund), former
chairman and CEO of Grupo Azucarero Mexico, S.A. de C.V. (sugar mills)
and former vice chairman of Home Mart de Mexico, S.A. de C.V. (retail
trade). He is also a director of Lafarge SA, Grupo Mexico, S.A. de C.V., and
Mexicana de Aviacion and is a member of the Mexican Business
Roundtable. He was elected a Caterpillar director in 1998.
David R. Goode
Mr. Goode, 65, is former chairman, president and CEO of Norfolk Southern
Corporation (holding company engaged principally in surface transporta-
tion). He also serves as a director of Delta Air Lines, Inc., Norfolk Southern
Corporation and Texas Instruments Incorporated. He has been a Caterpillar
director since 1993.
Peter A. Magowan
Mr. Magowan, 64, is president and managing general partner of the San
Francisco Giants (major league baseball team) and a director of
DaimlerChrysler AG. He became a Caterpillar director in 1993.
William A. Osborn
Mr. Osborn, 58, is chairman and CEO of Northern Trust Corporation (multibank
holding company) and The Northern Trust Company (bank). He is also a
director of Nicor Inc. and Tribune Company. He was elected a Caterpillar
director in 2000.
James W. Owens
Mr. Owens, 60, is chairman and CEO of Caterpillar Inc., a position he has held
since February 2004. Since joining the company as a corporate economist in
1972, he has held numerous management positions worldwide — including
president of Solar Turbines Incorporated and chief financial officer, group
president and vice chairman of Caterpillar. Mr. Owens is director of Alcoa
Inc., International Business Machines, The Institute for International
Economics and a member of the Council on Foreign Relations. He is also a
member of The Business Council, Business Roundtable, the Manufacturing
Council and the Global Advisory Council to The Conference Board. He became
a Caterpillar director in 2004.
Gordon R. Parker
Mr. Parker, 70, is former chairman of Newmont Mining Corporation (gold
properties production, exploration and acquisition). He is a director of
Phelps Dodge Corporation. He has been a Caterpillar director since 1995
and is retiring from the board in 2006.
Charles D. Powell
Lord Powell, 64, is chairman of Safinvest Limited (asset and investment
management) and LVMH Services Limited (luxury goods), as well as former
chairman of Phillips Fine Art Auctioneers and Sagitta Asset Management
Limited. He also serves as a director of LMVH Moet-Hennessy Louis Vuitton,
Mandarin Oriental International Ltd., Textron Corporation, Schindler Holding
Ltd. and Yell Group plc. He has been a Caterpillar director since 2001.
Edward B. Rust, Jr.
Mr. Rust, 55, is chairman and CEO of State Farm Mutual Automobile
Insurance Company (insurance). He is also president and CEO of State Farm
Fire and Casualty Company, State Farm Life Insurance Company and other
principal State Farm affiliates, as well as trustee and president of State
Farm Mutual Fund Trust and State Farm Variable Product Trust. He is a
director of Helmerich & Payne, Inc. and The McGraw-Hill Companies, Inc.
He became a Caterpillar director in 2003.
Joshua I. Smith
Mr. Smith, 65, is chairman and managing partner of the Coaching Group,
LLC (management consulting), where he has served as vice chairman and
chief development officer of iGate, Inc. (broadband networking company).
He serves as a director of CardioComm Solutions Inc., Federal Express
Corporation and The Allstate Corporation. He has been a Caterpillar director
since 1993.
BOARD OF DIRECTORS 2005
OFFICERS (AS OF JANUARY 1, 2006)
COMMITTEE MEMBERSHIP
James W. Owens
CHAIRMAN/CHIEF EXECUTIVE OFFICER
Stuart L. Levenick
Douglas R. Oberhelman
Gerald L. Shaheen
Gérard R. Vittecoq
Steven H. Wunning
GROUP PRESIDENTS
VICE PRESIDENTS
Kent M. Adams
Financial Products
Ali M. Bahaj Corporate Auditing & Compliance
Sidney C. Banwart Human Services
Michael J. Baunton
Europe, Africa & Middle East Product
Development & Operations
Rodney C. Beeler Asia Pacific Marketing
Mary H. Bell Logistics
James B. Buda
Legal Services
David B. Burritt Global Finance & Strategic Support
Rodney L. Bussell Mining & Construction Equipment
Christopher C. Curfman
Global Mining
Paolo Fellin
Europe, Africa & Middle East Marketing
Steven L. Fisher Remanufacturing
Thomas A. Gales
Latin America Division
Stephen A. Gosselin
Solar Turbines Incorporated
Hans A. Haefeli Industrial Power Systems
John S. Heller Systems & Processes
Richard P. Lavin
Asia Pacific Operations/SCM
William D. Mayo
North American Commercial Division
Daniel M. Murphy
Global Purchasing
Gerald Palmer Wheel Loaders & Excavators
James J. Parker Power Systems Marketing
Mark R. Pflederer Technology & Solutions
Edward J. Rapp
Building Construction Products
William J. Rohner Electric Power
Christiano V. Schena
Motion & Power Control
William F. Springer Marketing & Product Support
Gary A. Stroup
Large Power Systems
James D. Waters
Caterpillar Production Systems
Donald G. Western
Specialty Industries
Robert T. Williams
Track-Type Tractors
Eugene V. Fife
Chair
W. Frank Blount
John T. Dillon
David R. Goode
Gordon R. Parker
Edward B. Rust, Jr.
William A. Osborn
Chair
John R. Brazil
Gail D. Fosler
Peter A. Magowan
Charles D. Powell
Joshua I. Smith
John T. Dillon
Chair
W. Frank Blount
Juan Gallardo
David R. Goode
Peter A. Magowan
Edward B. Rust, Jr.
John R. Brazil
Chair
Gail D. Fosler
Juan Gallardo
Gordon R. Parker
Charles D. Powell
Joshua I. Smith
James B. Buda
David B. Burritt
John S. Heller
Mark R. Pflederer
Bradley M. Halverson
Kevin E. Colgan
Robin D. Beran
Tinkie E. Demmin Laurie J. Huxtable
Kent M. Adams
Financial Products
Steven L. Fisher Remanufacturing
James D. Waters
Caterpillar Production
Systems
William D. Mayo
North American
Commercial Division
AUDIT COMMITTEE COMPENSATION COMMITTEE GOVERNANCE COMMITTEE PUBLIC POLICY COMMITTEE
GENERAL COUNSEL AND SECRETARY
CHIEF INFORMATION OFFICER
CHIEF FINANCIAL OFFICER
CHIEF TECHNOLOGY OFFICER
CONTROLLER
TREASURER
ASSISTANT TREASURER
ASSISTANT SECRETARIES
NEW VICE PRESIDENTS

40 CATERPILLAR 2005 Annual Report
SUPPLEMENTAL STOCK INFORMATION
Current stockholders and other interested investors may purchase Caterpillar
Inc. common stock directly through the Investor Services Program sponsored
and administrated by our Transfer Agent. Current stockholders can get more
information on the program from our Transfer Agent using the contact information
provided below. Non-stockholders can request program materials by calling
800.842.7629 (U.S. and Canada) or 201.329.8660 (outside U.S. and Canada).
The Investor Services Program materials are available online from the Mellon
Investor Services website or linked from www.cat.com/dspp.
STOCK PRICE PLAN
COMPANY INFORMATIONCURRENT INFORMATION ANNUAL MEETING
HISTORICAL INFORMATION INTERNET
CREDITS
Caterpillar Corporate Public Affairs
PRODUCED BY
Williamson Printing Corporation
PRINTING
DESIGN & WRITING
VSA Partners, Inc. CAT, CATERPILLAR, their respective logos, ACCUGRADE, ACERT, CAT
ACCESSACCOUNT, TODAY’S WORK. TOMORROW’S WORLD., and “Caterpillar
Yellow,” as well as corporate and product identity used herein, are trademarks
of Caterpillar and may not be used without permission. SOLAR is a trademark
of Solar Turbines Incorporated and may not be used without permission. PERKINS,
the “square and circles” design, and “Perkins Blue,” are trademarks of Perkins
Holdings Limited and may not be used without permission. FG WILSON and
the “globe” design are trademarks of FG Wilson (Engineering) Limited and
may not be used without permission. GARRETT is a registered trademark of
Honeywell International Inc.
TRADEMARK INFORMATION
PHOTOGRAPHY
Mitch Colgan
Colgan Photographic
Paul Elledge
Paul Elledge Photography
Marc Esser
Caterpillar Inc.
Dan Gilkes
Freelance Photographer
Michael Goodman
Michael Goodman Photography
Karl Grobl
www.karlgrobl.com
S. Kanakaraj
Freelance Photographer
Mike LaVallier
Caterpillar Inc.
Doug Leunig
Caterpillar Inc.
Kevin May
Freelance Photographer
www.redteamracing.org
Carnegie Mellon University
INDIVIDUAL STOCKHOLDERS SHOULD CONTACT INVESTOR RELATIONS
Stock Transfer Agent
Mellon Investor Services
P.O. Box 3315
South Hackensack, NJ 07606-3315
Telephone: 866.203.6622, (U.S. and Canada)
201.680.6578 (outside U.S. and Canada)
Hearing impaired: 800.231.5469, (U.S. and Canada)
201.680.6610 (outside U.S. and Canada)
Website: www.melloninvestor.com
Caterpillar Assistant Secretary
Laurie J. Huxtable
100 N.E. Adams Street
Peoria, IL 61629-7310
Telephone: 309.675.4619
Facsimile: 309.675.6620
Email: [email protected]
Institutional analysts, portfolio managers and repre-
sentatives of financial institutions seeking additional
information about the company should contact:
Mike DeWalt
Director of Investor Relations
Caterpillar Inc.
100 N.E. Adams Street
Peoria, IL 61629-5310
Telephone: 309.675.4549
Facsimile: 309.675.4457
Email: [email protected]
Website: www.cat.com/investor
Phone our Information Hotline — 800.228.7717 (U.S. and Canada) or
858.244.2080 (outside U.S. and Canada) — to request company publications
by mail, listen to a summary of our latest financial results and current outlook
or request a copy of results by fax or mail. Visit www.cat.com/materialsrequest
to view or download materials online or register for e-mail alerts.
On June 14, 2006, at 1:30 p.m., the annual meeting of stockholders will be held
at Northern Trust Corporation, Chicago, Illinois. Requests for proxies are being
sent to stockholders with this report mailed on or about April 28, 2006.
View or download online at www.cat.com/historical. Visit us on the Internet at www.cat.com. Information contained on our website
is not incorporated by reference into this document.
© 2
006
CATE
RPIL
LAR
AL
L RI
GHTS
RES
ERVE
D
INCO
RPOR
ATED
IN D
ELAW
ARE
AN
EQU
AL O
PPOR
TUNI
TY E
MPL
OYER
P
RINT
ED IN
THE
USA
ON
PAPE
R M
ADE
WIT
H 30
% P
OST-
CONS
UMER
WAS
TE F
IBER
.SAFE HARBOR STATEMENTCertain statements in this report relate to future events and expectations that constitute forward-looking statements involving known and unknown factors that may cause actual results of Caterpillar Inc. to be different from those expressed or implied in the forward-looking statements. In this context, words such as “expects,” “anticipates,” “intends,” “plans,” “believes,” “seeks,” “will” or other similar words and phrases often identify forward-looking statements. Actual results of the company may differ materially from those described or implied in such forward-looking statements based on a number of factors and uncertainties, including, but not limited to, changes in economic, political or competitive conditions; market acceptance of the company’s products and services; changes in law, regulations and tax rates; and other general economic, business and financing conditions and factors described in more detail in the company’s filings with the Securities and Exchange Commission, including in its Annual Report on Form 10-K filed on February 22, 2006. We do not undertake to update our forward-looking statements.

TOMORROW’S
WORLD
TODAY’SWORK
2005 ANNUAL REPORTWWW.CAT.COM PEORIA, IL 61629 309.675.1000 YECX0018
CATERPILLAR 2005 ANNUAL REPORT

APPENDIX
CATERPILLAR INC.
GENERAL AND FINANCIAL INFORMATION
2005
A-1

A-2
TABLE OF CONTENTS
Page
Management’s Report on Internal Control Over Financial Reporting. . . . . . . . . . . . . . . . . . . . . . . . . . . . . . A-3
Report of Independent Registered Public Accounting Firm. . . . . . . . . . . . . . . . . . . . . . . . . . . . . . . . . . . . . . . . . A-4
Consolidated Financial Statements and Notes. . . . . . . . . . . . . . . . . . . . . . . . . . . . . . . . . . . . . . . . . . . . . . . . . . . . . . . . A-5
Five-year Financial Summary . . . . . . . . . . . . . . . . . . . . . . . . . . . . . . . . . . . . . . . . . . . . . . . . . . . . . . . . . . . . . . . . . . . . . . . . . A-37
Management’s Discussion and Analysis (MD&A)
Overview . . . . . . . . . . . . . . . . . . . . . . . . . . . . . . . . . . . . . . . . . . . . . . . . . . . . . . . . . . . . . . . . . . . . . . . . . . . . . . . . . . . . . . . . . . . A-38
2005 Compared with 2004. . . . . . . . . . . . . . . . . . . . . . . . . . . . . . . . . . . . . . . . . . . . . . . . . . . . . . . . . . . . . . . . . . . . . . . . A-38
Fourth Quarter 2005 Compared with Fourth Quarter 2004 . . . . . . . . . . . . . . . . . . . . . . . . . . . . . . . . . . . . A-42
2004 Compared with 2003. . . . . . . . . . . . . . . . . . . . . . . . . . . . . . . . . . . . . . . . . . . . . . . . . . . . . . . . . . . . . . . . . . . . . . . . A-46
Glossary of Terms . . . . . . . . . . . . . . . . . . . . . . . . . . . . . . . . . . . . . . . . . . . . . . . . . . . . . . . . . . . . . . . . . . . . . . . . . . . . . . . . . A-49
Liquidity and Capital Resources . . . . . . . . . . . . . . . . . . . . . . . . . . . . . . . . . . . . . . . . . . . . . . . . . . . . . . . . . . . . . . . . . A-50
Critical Accounting Policies . . . . . . . . . . . . . . . . . . . . . . . . . . . . . . . . . . . . . . . . . . . . . . . . . . . . . . . . . . . . . . . . . . . . . . A-51
Employment. . . . . . . . . . . . . . . . . . . . . . . . . . . . . . . . . . . . . . . . . . . . . . . . . . . . . . . . . . . . . . . . . . . . . . . . . . . . . . . . . . . . . . . . A-53
Other Matters . . . . . . . . . . . . . . . . . . . . . . . . . . . . . . . . . . . . . . . . . . . . . . . . . . . . . . . . . . . . . . . . . . . . . . . . . . . . . . . . . . . . . . A-53
Supplemental Consolidating Data . . . . . . . . . . . . . . . . . . . . . . . . . . . . . . . . . . . . . . . . . . . . . . . . . . . . . . . . . . . . . . . . A-58
Outlook . . . . . . . . . . . . . . . . . . . . . . . . . . . . . . . . . . . . . . . . . . . . . . . . . . . . . . . . . . . . . . . . . . . . . . . . . . . . . . . . . . . . . . . . . . . . . A-61
Supplemental Stockholder Information . . . . . . . . . . . . . . . . . . . . . . . . . . . . . . . . . . . . . . . . . . . . . . . . . . . . . . . . . . . . . . . A-64
Directors and Officers . . . . . . . . . . . . . . . . . . . . . . . . . . . . . . . . . . . . . . . . . . . . . . . . . . . . . . . . . . . . . . . . . . . . . . . . . . . . . . . . . . A-65

The management of Caterpillar Inc. (company) is responsible for establishing and maintaining adequate internal controlover financial reporting. Our internal control over financial reporting is a process designed to provide reasonable assur-ance regarding the reliability of our financial reporting and the preparation of financial statements for external purposesin accordance with generally accepted accounting principles. Our internal control over financial reporting includes thosepolicies and procedures that (i) pertain to the maintenance of records that, in reasonable detail, accurately and fairly reflectthe transactions and dispositions of the assets of the company; (ii) provide reasonable assurance that transactions arerecorded as necessary to permit preparation of financial statements in accordance with generally accepted accounting prin-ciples, and that receipts and expenditures of the company are being made only in accordance with authorizations of man-agement and directors of the company; and (iii) provide reasonable assurance regarding prevention or timely detection ofunauthorized acquisition, use, or disposition of the company’s assets that could have a material effect on the financialstatements.
Because of its inherent limitations, internal control over financial reporting may not prevent or detect misstatements.Also, projections of any evaluation of effectiveness to future periods are subject to the risk that controls may become inad-equate because of changes in conditions, or that the degree of compliance with the policies or procedures may deteriorate.
Management assessed the effectiveness of the company’s internal control over financial reporting as of December 31,2005. In making this assessment, we used the criteria set forth by the Committee of Sponsoring Organizations of theTreadway Commission (COSO) in Internal Control — Integrated Framework. Based on our assessment we concludedthat, as of December 31, 2005, the company’s internal control over financial reporting was effective based on those criteria.
Our management’s assessment of the effectiveness of the company’s internal control over financial reporting as ofDecember 31, 2005 has been audited by PricewaterhouseCoopers LLP, an independent registered public accounting firm.The report appears on page A-4.
James W. OwensChairman of the Board
David B. BurrittChief Financial Officer
February 21, 2006
MANAGEMENT’S REPORT ON Caterpillar Inc.INTERNAL CONTROL OVER FINANCIAL REPORTING
A-3

REPORT OF INDEPENDENT REGISTERED PUBLIC ACCOUNTING FIRM
TO THE BOARD OF DIRECTORS AND STOCKHOLDERS OF CATERPILLAR INC.:
We have completed integrated audits of Caterpillar Inc.’s 2005 and 2004 consolidated financial statements and of its internal controlover financial reporting as of December 31, 2005, and an audit of its 2003 consolidated financial statements in accordance with thestandards of the Public Company Accounting Oversight Board (United States). Our opinions, based on our audits, are presented below.
Consolidated financial statementsIn our opinion, the accompanying consolidated statement of financial position and the related statements of consolidated results of opera-tions, changes in stockholders’ equity, and cash flow, including pages A-5 through A-36, present fairly, in all material respects, thefinancial position of Caterpillar Inc. and its subsidiaries at December 31, 2005, 2004, and 2003, and the results of their operations andtheir cash flows for each of the three years in the period ended December 31, 2005 in conformity with accounting principles generallyaccepted in the United States of America. These financial statements are the responsibility of the Company’s management. Our respon-sibility is to express an opinion on these financial statements based on our audits. We conducted our audits of these statements inaccordance with the standards of the Public Company Accounting Oversight Board (United States). Those standards require that weplan and perform the audit to obtain reasonable assurance about whether the financial statements are free of material misstatement.An audit of financial statements includes examining, on a test basis, evidence supporting the amounts and disclosures in the financialstatements, assessing the accounting principles used and significant estimates made by management, and evaluating the overall financialstatement presentation. We believe that our audits provide a reasonable basis for our opinion.
Internal control over financial reportingAlso, in our opinion, management’s assessment, included in Management’s Report on Internal Control Over Financial Reportingappearing on page A-3, that the Company maintained effective internal control over financial reporting as of December 31, 2005based on criteria established in Internal Control — Integrated Framework issued by the Committee of Sponsoring Organizations ofthe Treadway Commission (COSO), is fairly stated, in all material respects, based on those criteria. Furthermore, in our opinion, theCompany maintained, in all material respects, effective internal control over financial reporting as of December 31, 2005, based oncriteria established in Internal Control — Integrated Framework issued by the COSO. The Company’s management is responsiblefor maintaining effective internal control over financial reporting and for its assessment of the effectiveness of internal control overfinancial reporting. Our responsibility is to express opinions on management’s assessment and on the effectiveness of the Company’sinternal control over financial reporting based on our audit. We conducted our audit of internal control over financial reporting inaccordance with the standards of the Public Company Accounting Oversight Board (United States). Those standards require that weplan and perform the audit to obtain reasonable assurance about whether effective internal control over financial reporting was maintainedin all material respects. An audit of internal control over financial reporting includes obtaining an understanding of internal controlover financial reporting, evaluating management’s assessment, testing and evaluating the design and operating effectiveness of internalcontrol, and performing such other procedures as we consider necessary in the circumstances. We believe that our audit provides areasonable basis for our opinions.
A company’s internal control over financial reporting is a process designed to provide reasonable assurance regarding the reliabilityof financial reporting and the preparation of financial statements for external purposes in accordance with generally accepted accountingprinciples. A company’s internal control over financial reporting includes those policies and procedures that (i) pertain to the maintenanceof records that, in reasonable detail, accurately and fairly reflect the transactions and dispositions of the assets of the company; (ii) providereasonable assurance that transactions are recorded as necessary to permit preparation of financial statements in accordance with generallyaccepted accounting principles, and that receipts and expenditures of the company are being made only in accordance with authoriza-tions of management and directors of the company; and (iii) provide reasonable assurance regarding prevention or timely detectionof unauthorized acquisition, use, or disposition of the company’s assets that could have a material effect on the financial statements.
Because of its inherent limitations, internal control over financial reporting may not prevent or detect misstatements. Also, projectionsof any evaluation of effectiveness to future periods are subject to the risk that controls may become inadequate because of changes inconditions, or that the degree of compliance with the policies or procedures may deteriorate.
Peoria, IllinoisFebruary 21, 2006
A-4

STATEMENT 1 Caterpillar Inc.Consolidated Results of Operations for the Years Ended December 31(Dollars in millions except per share data)
A-5
2005 2004 2003________ _______ _______Sales and revenues:
Sales of Machinery and Engines . . . . . . . . . . . . . . . . . . . . . . . . . . . . . . . . . . . . . . . . . . . . . . . . . . . . . . . . . . . . . . . . . . . . . . . . . . . . . . . . . . . . . . . . . . . . . . . . . . . . . . . . . . . $34,006 $28,336 $21,048Revenues of Financial Products. . . . . . . . . . . . . . . . . . . . . . . . . . . . . . . . . . . . . . . . . . . . . . . . . . . . . . . . . . . . . . . . . . . . . . . . . . . . . . . . . . . . . . . . . . . . . . . . . . . . . . . . . . . . 2,333 1,970 1,759________ _______ _______
Total sales and revenues . . . . . . . . . . . . . . . . . . . . . . . . . . . . . . . . . . . . . . . . . . . . . . . . . . . . . . . . . . . . . . . . . . . . . . . . . . . . . . . . . . . . . . . . . . . . . . . . . . . . . . . . . . . . . . . 36,339 30,306 22,807
Operating costs:Cost of goods sold. . . . . . . . . . . . . . . . . . . . . . . . . . . . . . . . . . . . . . . . . . . . . . . . . . . . . . . . . . . . . . . . . . . . . . . . . . . . . . . . . . . . . . . . . . . . . . . . . . . . . . . . . . . . . . . . . . . . . . . . . . 26,558 22,497 16,997Selling, general and administrative expenses . . . . . . . . . . . . . . . . . . . . . . . . . . . . . . . . . . . . . . . . . . . . . . . . . . . . . . . . . . . . . . . . . . . . . . . . . . . . . . . . . . . . . . . . . . . . . 3,190 2,926 2,322Research and development expenses. . . . . . . . . . . . . . . . . . . . . . . . . . . . . . . . . . . . . . . . . . . . . . . . . . . . . . . . . . . . . . . . . . . . . . . . . . . . . . . . . . . . . . . . . . . . . . . . . . . . . . 1,084 928 669Interest expense of Financial Products . . . . . . . . . . . . . . . . . . . . . . . . . . . . . . . . . . . . . . . . . . . . . . . . . . . . . . . . . . . . . . . . . . . . . . . . . . . . . . . . . . . . . . . . . . . . . . . . . . . . 768 524 474Other operating expenses . . . . . . . . . . . . . . . . . . . . . . . . . . . . . . . . . . . . . . . . . . . . . . . . . . . . . . . . . . . . . . . . . . . . . . . . . . . . . . . . . . . . . . . . . . . . . . . . . . . . . . . . . . . . . . . . . . 955 747 675________ _______ _______
Total operating costs . . . . . . . . . . . . . . . . . . . . . . . . . . . . . . . . . . . . . . . . . . . . . . . . . . . . . . . . . . . . . . . . . . . . . . . . . . . . . . . . . . . . . . . . . . . . . . . . . . . . . . . . . . . . . . . . . . . 32,555 27,622 21,137________ _______ _______
Operating profit . . . . . . . . . . . . . . . . . . . . . . . . . . . . . . . . . . . . . . . . . . . . . . . . . . . . . . . . . . . . . . . . . . . . . . . . . . . . . . . . . . . . . . . . . . . . . . . . . . . . . . . . . . . . . . . . . . . . . . . . . . . . . . 3,784 2,684 1,670
Interest expense excluding Financial Products. . . . . . . . . . . . . . . . . . . . . . . . . . . . . . . . . . . . . . . . . . . . . . . . . . . . . . . . . . . . . . . . . . . . . . . . . . . . . . . . . . . . . . . . . . . . 260 230 246Other income (expense) . . . . . . . . . . . . . . . . . . . . . . . . . . . . . . . . . . . . . . . . . . . . . . . . . . . . . . . . . . . . . . . . . . . . . . . . . . . . . . . . . . . . . . . . . . . . . . . . . . . . . . . . . . . . . . . . . . . . 377 253 53________ _______ _______
Consolidated profit before taxes . . . . . . . . . . . . . . . . . . . . . . . . . . . . . . . . . . . . . . . . . . . . . . . . . . . . . . . . . . . . . . . . . . . . . . . . . . . . . . . . . . . . . . . . . . . . . . . . . . . . . . . . . 3,901 2,707 1,477Provision for income taxes . . . . . . . . . . . . . . . . . . . . . . . . . . . . . . . . . . . . . . . . . . . . . . . . . . . . . . . . . . . . . . . . . . . . . . . . . . . . . . . . . . . . . . . . . . . . . . . . . . . . . . . . . . . . . . . . . 1,120 731 398________ _______ _______Profit of consolidated companies . . . . . . . . . . . . . . . . . . . . . . . . . . . . . . . . . . . . . . . . . . . . . . . . . . . . . . . . . . . . . . . . . . . . . . . . . . . . . . . . . . . . . . . . . . . . . . . . . . . . . . . . . . 2,781 1,976 1,079
Equity in profit (loss) of unconsolidated affiliated companies. . . . . . . . . . . . . . . . . . . . . . . . . . . . . . . . . . . . . . . . . . . . . . . . . . . . . . . . . . . . . . . . . . . . . . . . . . . . 73 59 20________ _______ _______Profit . . . . . . . . . . . . . . . . . . . . . . . . . . . . . . . . . . . . . . . . . . . . . . . . . . . . . . . . . . . . . . . . . . . . . . . . . . . . . . . . . . . . . . . . . . . . . . . . . . . . . . . . . . . . . . . . . . . . . . . . . . . . . . . . . . . . . . . . . . . . $ 2,854 $ 2,035 $ 1,099________ _______ _______________ _______ _______
Profit per common share. . . . . . . . . . . . . . . . . . . . . . . . . . . . . . . . . . . . . . . . . . . . . . . . . . . . . . . . . . . . . . . . . . . . . . . . . . . . . . . . . . . . . . . . . . . . . . . . . . . . . . . . . . . . . . . . . . . $ 4.21 $ 2.97 $ 1.59Profit per common share — diluted(1) . . . . . . . . . . . . . . . . . . . . . . . . . . . . . . . . . . . . . . . . . . . . . . . . . . . . . . . . . . . . . . . . . . . . . . . . . . . . . . . . . . . . . . . . . . . . . . . . . . . $ 4.04 $ 2.88 $ 1.56Weighted-average common shares outstanding (millions)
— Basic. . . . . . . . . . . . . . . . . . . . . . . . . . . . . . . . . . . . . . . . . . . . . . . . . . . . . . . . . . . . . . . . . . . . . . . . . . . . . . . . . . . . . . . . . . . . . . . . . . . . . . . . . . . . . . . . . . . . . . . . . . . . . . . . . . . . 678.4 684.5 690.4— Diluted(1) . . . . . . . . . . . . . . . . . . . . . . . . . . . . . . . . . . . . . . . . . . . . . . . . . . . . . . . . . . . . . . . . . . . . . . . . . . . . . . . . . . . . . . . . . . . . . . . . . . . . . . . . . . . . . . . . . . . . . . . . . . . . . . . 705.8 707.4 702.7
Cash dividends declared per common share. . . . . . . . . . . . . . . . . . . . . . . . . . . . . . . . . . . . . . . . . . . . . . . . . . . . . . . . . . . . . . . . . . . . . . . . . . . . . . . . . . . . . . . . . . $ .96 $ .80 $ .72
(1) Diluted by assumed exercise of stock options, using the treasury stock method.
See accompanying Notes to Consolidated Financial Statements.

A-6
STATEMENT 2Consolidated Financial Position at December 31(Dollars in millions)
2005 2004 2003________ _______ _______Assets
Current assets:Cash and short-term investments . . . . . . . . . . . . . . . . . . . . . . . . . . . . . . . . . . . . . . . . . . . . . . . . . . . . . . . . . . . . . . . . . . . . . . . . . . . . . . . . . . . . . . . . . . . . . . . . . . . . . $ 1,108 $ 445 $ 342Receivables — trade and other . . . . . . . . . . . . . . . . . . . . . . . . . . . . . . . . . . . . . . . . . . . . . . . . . . . . . . . . . . . . . . . . . . . . . . . . . . . . . . . . . . . . . . . . . . . . . . . . . . . . . . . . 7,526 7,463 4,030Receivables — finance. . . . . . . . . . . . . . . . . . . . . . . . . . . . . . . . . . . . . . . . . . . . . . . . . . . . . . . . . . . . . . . . . . . . . . . . . . . . . . . . . . . . . . . . . . . . . . . . . . . . . . . . . . . . . . . . . 6,442 5,182 5,167Retained interests in securitized trade receivables. . . . . . . . . . . . . . . . . . . . . . . . . . . . . . . . . . . . . . . . . . . . . . . . . . . . . . . . . . . . . . . . . . . . . . . . . . . . . . . . . . . . — — 1,550Deferred and refundable income taxes . . . . . . . . . . . . . . . . . . . . . . . . . . . . . . . . . . . . . . . . . . . . . . . . . . . . . . . . . . . . . . . . . . . . . . . . . . . . . . . . . . . . . . . . . . . . . . . . 344 398 707Prepaid expenses . . . . . . . . . . . . . . . . . . . . . . . . . . . . . . . . . . . . . . . . . . . . . . . . . . . . . . . . . . . . . . . . . . . . . . . . . . . . . . . . . . . . . . . . . . . . . . . . . . . . . . . . . . . . . . . . . . . . . . . 2,146 1,369 1,424Inventories . . . . . . . . . . . . . . . . . . . . . . . . . . . . . . . . . . . . . . . . . . . . . . . . . . . . . . . . . . . . . . . . . . . . . . . . . . . . . . . . . . . . . . . . . . . . . . . . . . . . . . . . . . . . . . . . . . . . . . . . . . . . . . 5,224 4,675 3,047________ _______ _______
Total current assets . . . . . . . . . . . . . . . . . . . . . . . . . . . . . . . . . . . . . . . . . . . . . . . . . . . . . . . . . . . . . . . . . . . . . . . . . . . . . . . . . . . . . . . . . . . . . . . . . . . . . . . . . . . . . . . . . . . . . . . . . 22,790 19,532 16,267Property, plant and equipment — net . . . . . . . . . . . . . . . . . . . . . . . . . . . . . . . . . . . . . . . . . . . . . . . . . . . . . . . . . . . . . . . . . . . . . . . . . . . . . . . . . . . . . . . . . . . . . . . . . . . . . 7,988 7,682 7,251Long-term receivables — trade and other . . . . . . . . . . . . . . . . . . . . . . . . . . . . . . . . . . . . . . . . . . . . . . . . . . . . . . . . . . . . . . . . . . . . . . . . . . . . . . . . . . . . . . . . . . . . . . . . 1,037 764 510Long-term receivables — finance . . . . . . . . . . . . . . . . . . . . . . . . . . . . . . . . . . . . . . . . . . . . . . . . . . . . . . . . . . . . . . . . . . . . . . . . . . . . . . . . . . . . . . . . . . . . . . . . . . . . . . . . . 10,301 9,903 7,735Investments in unconsolidated affiliated companies. . . . . . . . . . . . . . . . . . . . . . . . . . . . . . . . . . . . . . . . . . . . . . . . . . . . . . . . . . . . . . . . . . . . . . . . . . . . . . . . . . . . . . 565 517 800Deferred income taxes . . . . . . . . . . . . . . . . . . . . . . . . . . . . . . . . . . . . . . . . . . . . . . . . . . . . . . . . . . . . . . . . . . . . . . . . . . . . . . . . . . . . . . . . . . . . . . . . . . . . . . . . . . . . . . . . . . . . . . 768 674 616Intangible assets . . . . . . . . . . . . . . . . . . . . . . . . . . . . . . . . . . . . . . . . . . . . . . . . . . . . . . . . . . . . . . . . . . . . . . . . . . . . . . . . . . . . . . . . . . . . . . . . . . . . . . . . . . . . . . . . . . . . . . . . . . . . 424 315 239Goodwill . . . . . . . . . . . . . . . . . . . . . . . . . . . . . . . . . . . . . . . . . . . . . . . . . . . . . . . . . . . . . . . . . . . . . . . . . . . . . . . . . . . . . . . . . . . . . . . . . . . . . . . . . . . . . . . . . . . . . . . . . . . . . . . . . . . . . 1,451 1,450 1,398Other assets . . . . . . . . . . . . . . . . . . . . . . . . . . . . . . . . . . . . . . . . . . . . . . . . . . . . . . . . . . . . . . . . . . . . . . . . . . . . . . . . . . . . . . . . . . . . . . . . . . . . . . . . . . . . . . . . . . . . . . . . . . . . . . . . . 1,745 2,258 1,895________ _______ _______
Total assets . . . . . . . . . . . . . . . . . . . . . . . . . . . . . . . . . . . . . . . . . . . . . . . . . . . . . . . . . . . . . . . . . . . . . . . . . . . . . . . . . . . . . . . . . . . . . . . . . . . . . . . . . . . . . . . . . . . . . . . . . . . . . . . . . . . $47,069 $43,095 $36,711________ _______ _______________ _______ _______
LiabilitiesCurrent liabilities:
Short-term borrowings:— Machinery and Engines . . . . . . . . . . . . . . . . . . . . . . . . . . . . . . . . . . . . . . . . . . . . . . . . . . . . . . . . . . . . . . . . . . . . . . . . . . . . . . . . . . . . . . . . . . . . . . . . . . . . . . . . $ 871 $ 93 $ 72— Financial Products . . . . . . . . . . . . . . . . . . . . . . . . . . . . . . . . . . . . . . . . . . . . . . . . . . . . . . . . . . . . . . . . . . . . . . . . . . . . . . . . . . . . . . . . . . . . . . . . . . . . . . . . . . . . . 4,698 4,064 2,685
Accounts payable . . . . . . . . . . . . . . . . . . . . . . . . . . . . . . . . . . . . . . . . . . . . . . . . . . . . . . . . . . . . . . . . . . . . . . . . . . . . . . . . . . . . . . . . . . . . . . . . . . . . . . . . . . . . . . . . . . . . . . . 3,471 3,580 2,259Accrued expenses . . . . . . . . . . . . . . . . . . . . . . . . . . . . . . . . . . . . . . . . . . . . . . . . . . . . . . . . . . . . . . . . . . . . . . . . . . . . . . . . . . . . . . . . . . . . . . . . . . . . . . . . . . . . . . . . . . . . . . 2,617 2,261 1,952Accrued wages, salaries and employee benefits . . . . . . . . . . . . . . . . . . . . . . . . . . . . . . . . . . . . . . . . . . . . . . . . . . . . . . . . . . . . . . . . . . . . . . . . . . . . . . . . . . . . . . 1,845 1,730 1,802Customer advances. . . . . . . . . . . . . . . . . . . . . . . . . . . . . . . . . . . . . . . . . . . . . . . . . . . . . . . . . . . . . . . . . . . . . . . . . . . . . . . . . . . . . . . . . . . . . . . . . . . . . . . . . . . . . . . . . . . . . 395 447 253Dividends payable . . . . . . . . . . . . . . . . . . . . . . . . . . . . . . . . . . . . . . . . . . . . . . . . . . . . . . . . . . . . . . . . . . . . . . . . . . . . . . . . . . . . . . . . . . . . . . . . . . . . . . . . . . . . . . . . . . . . . . 168 141 127Deferred and current income taxes payable . . . . . . . . . . . . . . . . . . . . . . . . . . . . . . . . . . . . . . . . . . . . . . . . . . . . . . . . . . . . . . . . . . . . . . . . . . . . . . . . . . . . . . . . . . . 528 259 216Long-term debt due within one year:
— Machinery and Engines . . . . . . . . . . . . . . . . . . . . . . . . . . . . . . . . . . . . . . . . . . . . . . . . . . . . . . . . . . . . . . . . . . . . . . . . . . . . . . . . . . . . . . . . . . . . . . . . . . . . . . . . 340 6 32— Financial Products . . . . . . . . . . . . . . . . . . . . . . . . . . . . . . . . . . . . . . . . . . . . . . . . . . . . . . . . . . . . . . . . . . . . . . . . . . . . . . . . . . . . . . . . . . . . . . . . . . . . . . . . . . . . . 4,159 3,525 2,949________ _______ _______
Total current liabilities . . . . . . . . . . . . . . . . . . . . . . . . . . . . . . . . . . . . . . . . . . . . . . . . . . . . . . . . . . . . . . . . . . . . . . . . . . . . . . . . . . . . . . . . . . . . . . . . . . . . . . . . . . . . . . . . . . . . . . 19,092 16,106 12,347Long-term debt due after one year:
— Machinery and Engines . . . . . . . . . . . . . . . . . . . . . . . . . . . . . . . . . . . . . . . . . . . . . . . . . . . . . . . . . . . . . . . . . . . . . . . . . . . . . . . . . . . . . . . . . . . . . . . . . . . . . . . . 2,717 3,663 3,603— Financial Products . . . . . . . . . . . . . . . . . . . . . . . . . . . . . . . . . . . . . . . . . . . . . . . . . . . . . . . . . . . . . . . . . . . . . . . . . . . . . . . . . . . . . . . . . . . . . . . . . . . . . . . . . . . . . 12,960 12,174 10,943
Liability for postemployment benefits . . . . . . . . . . . . . . . . . . . . . . . . . . . . . . . . . . . . . . . . . . . . . . . . . . . . . . . . . . . . . . . . . . . . . . . . . . . . . . . . . . . . . . . . . . . . . . . . . . . . . 2,991 2,986 3,172Deferred income taxes and other liabilities . . . . . . . . . . . . . . . . . . . . . . . . . . . . . . . . . . . . . . . . . . . . . . . . . . . . . . . . . . . . . . . . . . . . . . . . . . . . . . . . . . . . . . . . . . . . . . . . 877 699 568________ _______ _______
Total liabilities . . . . . . . . . . . . . . . . . . . . . . . . . . . . . . . . . . . . . . . . . . . . . . . . . . . . . . . . . . . . . . . . . . . . . . . . . . . . . . . . . . . . . . . . . . . . . . . . . . . . . . . . . . . . . . . . . . . . . . . . . . . . . . . 38,637 35,628 30,633________ _______ _______
Stockholders’ equityCommon stock of $1.00 par value:
Authorized shares: 900,000,000Issued shares (2005, 2004 and 2003 — 814,894,624) at paid-in amount . . . . . . . . . . . . . . . . . . . . . . . . . . . . . . . . . . . . . . . . . . . . . . . . . . . . . . . . . 1,859 1,231 1,059
Treasury stock (2005 — 144,027,405 shares; 2004 — 129,020,726 shares; and 2003 — 127,370,544 shares) at cost . . . . . . . . . . (4,637) (3,277) (2,914)Profit employed in the business . . . . . . . . . . . . . . . . . . . . . . . . . . . . . . . . . . . . . . . . . . . . . . . . . . . . . . . . . . . . . . . . . . . . . . . . . . . . . . . . . . . . . . . . . . . . . . . . . . . . . . . . . . . 11,808 9,937 8,450Accumulated other comprehensive income . . . . . . . . . . . . . . . . . . . . . . . . . . . . . . . . . . . . . . . . . . . . . . . . . . . . . . . . . . . . . . . . . . . . . . . . . . . . . . . . . . . . . . . . . . . . . . . . (598) (424) (517)________ _______ _______
Total stockholders’ equity . . . . . . . . . . . . . . . . . . . . . . . . . . . . . . . . . . . . . . . . . . . . . . . . . . . . . . . . . . . . . . . . . . . . . . . . . . . . . . . . . . . . . . . . . . . . . . . . . . . . . . . . . . . . . . . . . 8,432 7,467 6,078________ _______ _______
Total liabilities and stockholders’ equity . . . . . . . . . . . . . . . . . . . . . . . . . . . . . . . . . . . . . . . . . . . . . . . . . . . . . . . . . . . . . . . . . . . . . . . . . . . . . . . . . . . . . . . . . . . . . . $47,069 $43,095 $36,711________ _______ _______________ _______ _______
See accompanying Notes to Consolidated Financial Statements.

A-7
2005 2004 2003________________ _______________ _______________Common stock:
Balance at beginning of year . . . . . . . . . . . . . . . . . . . . . . . . . . . . . . . . . . . . . . . . . . . . . . . . . . . . . . . . . . . . . . . . . . . . . . . . . . . . . . . . $ 1,231 $ 1,059 $ 1,034Common shares issued from treasury stock . . . . . . . . . . . . . . . . . . . . . . . . . . . . . . . . . . . . . . . . . . . . . . . . . . . . . . . . . . . . . . . 290 172 25Impact of 2-for-1 stock split. . . . . . . . . . . . . . . . . . . . . . . . . . . . . . . . . . . . . . . . . . . . . . . . . . . . . . . . . . . . . . . . . . . . . . . . . . . . . . . . . 338 — —_______ ______ ______Balance at year-end . . . . . . . . . . . . . . . . . . . . . . . . . . . . . . . . . . . . . . . . . . . . . . . . . . . . . . . . . . . . . . . . . . . . . . . . . . . . . . . . . . . . . . . . . . 1,859 1,231 1,059_______ ______ ______
Treasury stock:Balance at beginning of year . . . . . . . . . . . . . . . . . . . . . . . . . . . . . . . . . . . . . . . . . . . . . . . . . . . . . . . . . . . . . . . . . . . . . . . . . . . . . . . . (3,277) (2,914) (2,669)Shares issued: 2005 — 18,912,521; 2004 — 12,216,618; 2003 — 9,913,946. . . . . . . . . . . . . . . . . . . . . . . . 324 176 160Shares repurchased: 2005 — 33,919,200; 2004 — 13,866,800; 2003 — 10,900,000. . . . . . . . . . . . . . . . (1,684) (539) (405)_______ ______ ______Balance at year-end . . . . . . . . . . . . . . . . . . . . . . . . . . . . . . . . . . . . . . . . . . . . . . . . . . . . . . . . . . . . . . . . . . . . . . . . . . . . . . . . . . . . . . . . . . (4,637) (3,277) (2,914)_______ ______ ______
Profit employed in the business:Balance at beginning of year . . . . . . . . . . . . . . . . . . . . . . . . . . . . . . . . . . . . . . . . . . . . . . . . . . . . . . . . . . . . . . . . . . . . . . . . . . . . . . . . 9,937 8,450 7,849Profit . . . . . . . . . . . . . . . . . . . . . . . . . . . . . . . . . . . . . . . . . . . . . . . . . . . . . . . . . . . . . . . . . . . . . . . . . . . . . . . . . . . . . . . . . . . . . . . . . . . . . . . . . . 2,854 $2,854 2,035 $2,035 1,099 $ 1,099Dividends declared . . . . . . . . . . . . . . . . . . . . . . . . . . . . . . . . . . . . . . . . . . . . . . . . . . . . . . . . . . . . . . . . . . . . . . . . . . . . . . . . . . . . . . . . . . (645) (548) (498)Impact of 2-for-1 stock split. . . . . . . . . . . . . . . . . . . . . . . . . . . . . . . . . . . . . . . . . . . . . . . . . . . . . . . . . . . . . . . . . . . . . . . . . . . . . . . . . (338) — —_______ ______ ______Balance at year-end . . . . . . . . . . . . . . . . . . . . . . . . . . . . . . . . . . . . . . . . . . . . . . . . . . . . . . . . . . . . . . . . . . . . . . . . . . . . . . . . . . . . . . . . . . 11,808 9,937 8,450_______ ______ ______
Accumulated other comprehensive income:Foreign currency translation adjustment:
Balance at beginning of year . . . . . . . . . . . . . . . . . . . . . . . . . . . . . . . . . . . . . . . . . . . . . . . . . . . . . . . . . . . . . . . . . . . . . . . . . . . . 489 348 86Aggregate adjustment for year . . . . . . . . . . . . . . . . . . . . . . . . . . . . . . . . . . . . . . . . . . . . . . . . . . . . . . . . . . . . . . . . . . . . . . . . . . (187) (187) 141 141 262 262_______ ______ ______Balance at year-end. . . . . . . . . . . . . . . . . . . . . . . . . . . . . . . . . . . . . . . . . . . . . . . . . . . . . . . . . . . . . . . . . . . . . . . . . . . . . . . . . . . . . . 302 489 348_______ ______ ______
Minimum pension liability adjustment — consolidated companies:Balance at beginning of year (net of tax of: 2005 — $485; 2004 — $460; 2003 — $383) . . . . . . . . (993) (934) (771)Aggregate adjustment for year (net of tax of: 2005 — $36; 2004 — $25; 2003 — $77) . . . . . . . . . . 96 96 (59) (59) (163) (163)_______ ______ ______Balance at year-end (net of tax of: 2005 — $449; 2004 — $485; 2003 — $460). . . . . . . . . . . . . . . . . . (897) (993) (934)_______ ______ ______
Minimum pension liability adjustment — unconsolidated companies:Balance at beginning of year . . . . . . . . . . . . . . . . . . . . . . . . . . . . . . . . . . . . . . . . . . . . . . . . . . . . . . . . . . . . . . . . . . . . . . . . . . . . (48) (48) (37)Aggregate adjustment for year . . . . . . . . . . . . . . . . . . . . . . . . . . . . . . . . . . . . . . . . . . . . . . . . . . . . . . . . . . . . . . . . . . . . . . . . . . 11 11 — — (11) (11)_______ ______ ______Balance at year-end. . . . . . . . . . . . . . . . . . . . . . . . . . . . . . . . . . . . . . . . . . . . . . . . . . . . . . . . . . . . . . . . . . . . . . . . . . . . . . . . . . . . . . (37) (48) (48)_______ ______ ______
Derivative financial instruments:Balance at beginning of year (net of tax of: 2005 — $58; 2004 — $54; 2003 — $5). . . . . . . . . . . . . . 110 104 11Gains/(losses) deferred during year (net of tax of: 2005 — $0; 2004 — $48; 2003 — $29). . . . . . (5) (5) 90 90 53 53(Gains)/losses reclassified to earnings during year
(net of tax of: 2005 — $45; 2004 — $44; 2003 — $20) . . . . . . . . . . . . . . . . . . . . . . . . . . . . . . . . . . . . . . . . (87) (87) (84) (84) 40 40_______ ______ ______Balance at year-end (net of tax of: 2005 — $13; 2004 — $58; 2003 — $54) . . . . . . . . . . . . . . . . . . . . . . 18 110 104_______ ______ ______
Available-for-sale securities:Balance at beginning of year (net of tax of: 2005 — $7; 2004 — $5; 2003 — $17) . . . . . . . . . . . . . . . 18 13 (31)Gains/(losses) deferred during year (net of tax of: 2005 — $3; 2004 — $3; 2003 — $11) . . . . . . . 3 3 6 6 23 23(Gains)/losses reclassified to earnings during year
(net of tax of: 2005 — $1; 2004 — $1; 2003 — $11) . . . . . . . . . . . . . . . . . . . . . . . . . . . . . . . . . . . . . . . . . . . (5) (5) (1) (1) 21 21_______ ______ ______ ______ ______ ______Balance at year-end (net of tax of: 2005 — $9; 2004 — $7; 2003 — $5) . . . . . . . . . . . . . . . . . . . . . . . . . . 16 18 13_______ ______ ______
Total accumulated other comprehensive income . . . . . . . . . . . . . . . . . . . . . . . . . . . . . . . . . . . . . . . . . . . . . . . . . . . . . (598) (424) (517)_______ ______ ______Comprehensive income . . . . . . . . . . . . . . . . . . . . . . . . . . . . . . . . . . . . . . . . . . . . . . . . . . . . . . . . . . . . . . . . . . . . . . . . . . . . . . . . . . . . . $2,680 $ 2,128 $ 1,324______ ______ ____________ ______ ______
Stockholders’ equity at year-end. . . . . . . . . . . . . . . . . . . . . . . . . . . . . . . . . . . . . . . . . . . . . . . . . . . . . . . . . . . . . . . . . . . . . . . . . . $ 8,432 $ 7,467 $ 6,078_______ ______ _____________ ______ ______
STATEMENT 3 Caterpillar Inc.Changes in Consolidated Stockholders’ Equity for the Years Ended December 31(Dollars in millions)
See accompanying Notes to Consolidated Financial Statements.
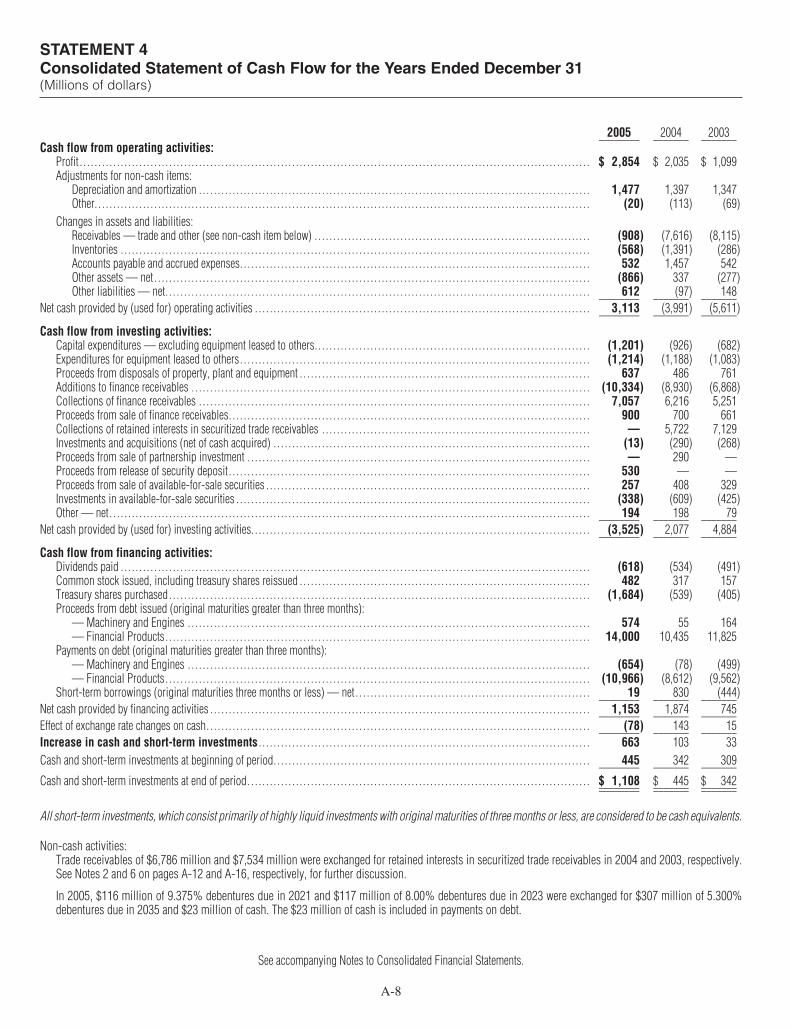
2005 2004 2003________ _______ _______Cash flow from operating activities:
Profit . . . . . . . . . . . . . . . . . . . . . . . . . . . . . . . . . . . . . . . . . . . . . . . . . . . . . . . . . . . . . . . . . . . . . . . . . . . . . . . . . . . . . . . . . . . . . . . . . . . . . . . . . . . . . . . . . . . . . . . . . . . . . . . . . . . . . . . . . $ 2,854 $ 2,035 $ 1,099Adjustments for non-cash items:
Depreciation and amortization . . . . . . . . . . . . . . . . . . . . . . . . . . . . . . . . . . . . . . . . . . . . . . . . . . . . . . . . . . . . . . . . . . . . . . . . . . . . . . . . . . . . . . . . . . . . . . . . . . . . . . . . . 1,477 1,397 1,347Other. . . . . . . . . . . . . . . . . . . . . . . . . . . . . . . . . . . . . . . . . . . . . . . . . . . . . . . . . . . . . . . . . . . . . . . . . . . . . . . . . . . . . . . . . . . . . . . . . . . . . . . . . . . . . . . . . . . . . . . . . . . . . . . . . . . . . (20) (113) (69)
Changes in assets and liabilities:Receivables — trade and other (see non-cash item below) . . . . . . . . . . . . . . . . . . . . . . . . . . . . . . . . . . . . . . . . . . . . . . . . . . . . . . . . . . . . . . . . . . . . . . . . . . (908) (7,616) (8,115)Inventories . . . . . . . . . . . . . . . . . . . . . . . . . . . . . . . . . . . . . . . . . . . . . . . . . . . . . . . . . . . . . . . . . . . . . . . . . . . . . . . . . . . . . . . . . . . . . . . . . . . . . . . . . . . . . . . . . . . . . . . . . . . . . . (568) (1,391) (286)Accounts payable and accrued expenses. . . . . . . . . . . . . . . . . . . . . . . . . . . . . . . . . . . . . . . . . . . . . . . . . . . . . . . . . . . . . . . . . . . . . . . . . . . . . . . . . . . . . . . . . . . . . . 532 1,457 542Other assets — net . . . . . . . . . . . . . . . . . . . . . . . . . . . . . . . . . . . . . . . . . . . . . . . . . . . . . . . . . . . . . . . . . . . . . . . . . . . . . . . . . . . . . . . . . . . . . . . . . . . . . . . . . . . . . . . . . . . . . (866) 337 (277)Other liabilities — net. . . . . . . . . . . . . . . . . . . . . . . . . . . . . . . . . . . . . . . . . . . . . . . . . . . . . . . . . . . . . . . . . . . . . . . . . . . . . . . . . . . . . . . . . . . . . . . . . . . . . . . . . . . . . . . . . . 612 (97) 148________ _______ _______
Net cash provided by (used for) operating activities . . . . . . . . . . . . . . . . . . . . . . . . . . . . . . . . . . . . . . . . . . . . . . . . . . . . . . . . . . . . . . . . . . . . . . . . . . . . . . . . . . . . . . . . . . 3,113 (3,991) (5,611)________ _______ _______
Cash flow from investing activities:Capital expenditures — excluding equipment leased to others. . . . . . . . . . . . . . . . . . . . . . . . . . . . . . . . . . . . . . . . . . . . . . . . . . . . . . . . . . . . . . . . . . . . . . . . . . (1,201) (926) (682)Expenditures for equipment leased to others. . . . . . . . . . . . . . . . . . . . . . . . . . . . . . . . . . . . . . . . . . . . . . . . . . . . . . . . . . . . . . . . . . . . . . . . . . . . . . . . . . . . . . . . . . . . . . (1,214) (1,188) (1,083)Proceeds from disposals of property, plant and equipment . . . . . . . . . . . . . . . . . . . . . . . . . . . . . . . . . . . . . . . . . . . . . . . . . . . . . . . . . . . . . . . . . . . . . . . . . . . . . . 637 486 761Additions to finance receivables . . . . . . . . . . . . . . . . . . . . . . . . . . . . . . . . . . . . . . . . . . . . . . . . . . . . . . . . . . . . . . . . . . . . . . . . . . . . . . . . . . . . . . . . . . . . . . . . . . . . . . . . . . . (10,334) (8,930) (6,868)Collections of finance receivables . . . . . . . . . . . . . . . . . . . . . . . . . . . . . . . . . . . . . . . . . . . . . . . . . . . . . . . . . . . . . . . . . . . . . . . . . . . . . . . . . . . . . . . . . . . . . . . . . . . . . . . . . 7,057 6,216 5,251Proceeds from sale of finance receivables. . . . . . . . . . . . . . . . . . . . . . . . . . . . . . . . . . . . . . . . . . . . . . . . . . . . . . . . . . . . . . . . . . . . . . . . . . . . . . . . . . . . . . . . . . . . . . . . . 900 700 661Collections of retained interests in securitized trade receivables . . . . . . . . . . . . . . . . . . . . . . . . . . . . . . . . . . . . . . . . . . . . . . . . . . . . . . . . . . . . . . . . . . . . . . . . — 5,722 7,129Investments and acquisitions (net of cash acquired) . . . . . . . . . . . . . . . . . . . . . . . . . . . . . . . . . . . . . . . . . . . . . . . . . . . . . . . . . . . . . . . . . . . . . . . . . . . . . . . . . . . . . (13) (290) (268)Proceeds from sale of partnership investment . . . . . . . . . . . . . . . . . . . . . . . . . . . . . . . . . . . . . . . . . . . . . . . . . . . . . . . . . . . . . . . . . . . . . . . . . . . . . . . . . . . . . . . . . . . . — 290 —Proceeds from release of security deposit . . . . . . . . . . . . . . . . . . . . . . . . . . . . . . . . . . . . . . . . . . . . . . . . . . . . . . . . . . . . . . . . . . . . . . . . . . . . . . . . . . . . . . . . . . . . . . . . . 530 — —Proceeds from sale of available-for-sale securities . . . . . . . . . . . . . . . . . . . . . . . . . . . . . . . . . . . . . . . . . . . . . . . . . . . . . . . . . . . . . . . . . . . . . . . . . . . . . . . . . . . . . . . 257 408 329Investments in available-for-sale securities . . . . . . . . . . . . . . . . . . . . . . . . . . . . . . . . . . . . . . . . . . . . . . . . . . . . . . . . . . . . . . . . . . . . . . . . . . . . . . . . . . . . . . . . . . . . . . . (338) (609) (425)Other — net. . . . . . . . . . . . . . . . . . . . . . . . . . . . . . . . . . . . . . . . . . . . . . . . . . . . . . . . . . . . . . . . . . . . . . . . . . . . . . . . . . . . . . . . . . . . . . . . . . . . . . . . . . . . . . . . . . . . . . . . . . . . . . . . . 194 198 79________ _______ _______
Net cash provided by (used for) investing activities. . . . . . . . . . . . . . . . . . . . . . . . . . . . . . . . . . . . . . . . . . . . . . . . . . . . . . . . . . . . . . . . . . . . . . . . . . . . . . . . . . . . . . . . . . . (3,525) 2,077 4,884________ _______ _______
Cash flow from financing activities:Dividends paid . . . . . . . . . . . . . . . . . . . . . . . . . . . . . . . . . . . . . . . . . . . . . . . . . . . . . . . . . . . . . . . . . . . . . . . . . . . . . . . . . . . . . . . . . . . . . . . . . . . . . . . . . . . . . . . . . . . . . . . . . . . . . . (618) (534) (491)Common stock issued, including treasury shares reissued . . . . . . . . . . . . . . . . . . . . . . . . . . . . . . . . . . . . . . . . . . . . . . . . . . . . . . . . . . . . . . . . . . . . . . . . . . . . . . 482 317 157Treasury shares purchased . . . . . . . . . . . . . . . . . . . . . . . . . . . . . . . . . . . . . . . . . . . . . . . . . . . . . . . . . . . . . . . . . . . . . . . . . . . . . . . . . . . . . . . . . . . . . . . . . . . . . . . . . . . . . . . . . (1,684) (539) (405)Proceeds from debt issued (original maturities greater than three months):
— Machinery and Engines . . . . . . . . . . . . . . . . . . . . . . . . . . . . . . . . . . . . . . . . . . . . . . . . . . . . . . . . . . . . . . . . . . . . . . . . . . . . . . . . . . . . . . . . . . . . . . . . . . . . . . . . . . . . 574 55 164— Financial Products. . . . . . . . . . . . . . . . . . . . . . . . . . . . . . . . . . . . . . . . . . . . . . . . . . . . . . . . . . . . . . . . . . . . . . . . . . . . . . . . . . . . . . . . . . . . . . . . . . . . . . . . . . . . . . . . . . 14,000 10,435 11,825
Payments on debt (original maturities greater than three months):— Machinery and Engines . . . . . . . . . . . . . . . . . . . . . . . . . . . . . . . . . . . . . . . . . . . . . . . . . . . . . . . . . . . . . . . . . . . . . . . . . . . . . . . . . . . . . . . . . . . . . . . . . . . . . . . . . . . . (654) (78) (499)— Financial Products. . . . . . . . . . . . . . . . . . . . . . . . . . . . . . . . . . . . . . . . . . . . . . . . . . . . . . . . . . . . . . . . . . . . . . . . . . . . . . . . . . . . . . . . . . . . . . . . . . . . . . . . . . . . . . . . . . (10,966) (8,612) (9,562)
Short-term borrowings (original maturities three months or less) — net . . . . . . . . . . . . . . . . . . . . . . . . . . . . . . . . . . . . . . . . . . . . . . . . . . . . . . . . . . . . . . . 19 830 (444)________ _______ _______Net cash provided by financing activities . . . . . . . . . . . . . . . . . . . . . . . . . . . . . . . . . . . . . . . . . . . . . . . . . . . . . . . . . . . . . . . . . . . . . . . . . . . . . . . . . . . . . . . . . . . . . . . . . . . . . . 1,153 1,874 745________ _______ _______Effect of exchange rate changes on cash. . . . . . . . . . . . . . . . . . . . . . . . . . . . . . . . . . . . . . . . . . . . . . . . . . . . . . . . . . . . . . . . . . . . . . . . . . . . . . . . . . . . . . . . . . . . . . . . . . . . . . . (78) 143 15________ _______ _______Increase in cash and short-term investments . . . . . . . . . . . . . . . . . . . . . . . . . . . . . . . . . . . . . . . . . . . . . . . . . . . . . . . . . . . . . . . . . . . . . . . . . . . . . . . . . . . . . . . . . 663 103 33Cash and short-term investments at beginning of period. . . . . . . . . . . . . . . . . . . . . . . . . . . . . . . . . . . . . . . . . . . . . . . . . . . . . . . . . . . . . . . . . . . . . . . . . . . . . . . . . . . . . 445 342 309________ _______ _______
Cash and short-term investments at end of period. . . . . . . . . . . . . . . . . . . . . . . . . . . . . . . . . . . . . . . . . . . . . . . . . . . . . . . . . . . . . . . . . . . . . . . . . . . . . . . . . . . . . . . . . . . . $ 1,108 $ 445 $ 342________ _______ _______________ _______ _______
All short-term investments, which consist primarily of highly liquid investments with original maturities of three months or less, are considered to be cash equivalents.
Non-cash activities:Trade receivables of $6,786 million and $7,534 million were exchanged for retained interests in securitized trade receivables in 2004 and 2003, respectively.See Notes 2 and 6 on pages A-12 and A-16, respectively, for further discussion.
In 2005, $116 million of 9.375% debentures due in 2021 and $117 million of 8.00% debentures due in 2023 were exchanged for $307 million of 5.300%debentures due in 2035 and $23 million of cash. The $23 million of cash is included in payments on debt.
STATEMENT 4Consolidated Statement of Cash Flow for the Years Ended December 31(Millions of dollars)
A-8
See accompanying Notes to Consolidated Financial Statements.

A-9
1. Operations and summary ofsignificant accounting policies
A. Nature of operations
We operate in three principal lines of business:(1) Machinery — A principal line of business which includes
the design, manufacture, marketing and sales of construction,mining and forestry machinery — track and wheel tractors, trackand wheel loaders, pipelayers, motor graders, wheel tractor-scrapers, track and wheel excavators, backhoe loaders, log skid-ders, log loaders, off-highway trucks, articulated trucks, pavingproducts, telehandlers, skid steer loaders and related parts. Alsoincludes logistics services for other companies.
(2) Engines — A principal line of business including thedesign, manufacture, marketing and sales of engines for Caterpillarmachinery, electric power generation systems; on-highwayvehicles and locomotives; marine, petroleum, construction,industrial, agricultural and other applications; and related parts.Reciprocating engines meet power needs ranging from 5 to21,500 horsepower (4 to over 16 000 kilowatts). Turbines rangefrom 1,600 to 20,500 horsepower (1 200 to 15 000 kilowatts).
(3) Financial Products — A principal line of business consist-ing primarily of Caterpillar Financial Services Corporation (CatFinancial), Caterpillar Insurance Holdings, Inc. (Cat Insurance),Caterpillar Power Ventures Corporation (Cat Power Ventures) andtheir subsidiaries. Cat Financial provides a wide range of financ-ing alternatives to customers and dealers for Caterpillar machineryand engines, Solar gas turbines, as well as other equipment andmarine vessels. Cat Financial also extends loans to customersand dealers. Cat Insurance provides various forms of insuranceto customers and dealers to help support the purchase and leaseof our equipment. Cat Power Ventures is an active investor inindependent power projects using Caterpillar power generationequipment and services.
Our Machinery and Engines operations are highly integrated.Throughout the Notes, Machinery and Engines represents theaggregate total of these principal lines of business.
Our products are sold primarily under the brands “Caterpillar,”“Cat,” “Solar Turbines,” “MaK,” “Perkins,” “FG Wilson” and“Olympian.”
We conduct operations in our Machinery and Engines lines ofbusiness under highly competitive conditions, including intense pricecompetition. We place great emphasis on the high quality and per-formance of our products and our dealers’ service support. Althoughno one competitor is believed to produce all of the same types ofmachines and engines that we do, there are numerous compa-nies, large and small, which compete with us in the sale of eachof our products.
Machines are distributed principally through a worldwide orga-nization of dealers (dealer network), 54 located in the United Statesand 128 located outside the United States. Worldwide, these dealersserve 182 countries and operate 3,510 places of business, including1,587 dealer rental outlets. Reciprocating engines are sold princi-pally through the dealer network and to other manufacturers foruse in products manufactured by them. Some of the reciprocatingengines manufactured by Perkins are also sold through a world-wide network of 140 distributors located in 170 countries along with3,500 supporting dealers. Most of the electric power generation
systems manufactured by FG Wilson are sold through a world-wide network of 200 dealers located in 180 countries. Our dealersdo not deal exclusively with our products; however, in most casessales and servicing of our products are the dealers’ principalbusiness. Turbines and large marine reciprocating engines aresold through sales forces employed by the company. At times,these employees are assisted by independent sales representatives.
Manufacturing activities of the Machinery and Engines lines ofbusiness are conducted in 41 plants in the United States; nineeach in the United Kingdom and Italy; six in China; five inMexico; three each in France, India and Northern Ireland; twoeach in Australia, Germany, Brazil, and Japan; and one each inBelgium, Hungary, Indonesia, The Netherlands, Poland, Russia,South Africa, Switzerland and Tunisia. Thirteen parts distribu-tion centers are located in the United States and thirteen arelocated outside the United States.
The Financial Products line of business also conducts opera-tions under highly competitive conditions. Financing for users ofCaterpillar products is available through a variety of competitivesources, principally commercial banks and finance and leasingcompanies. We emphasize prompt and responsive service tomeet customer requirements and offer various financing plansdesigned to increase the opportunity for sales of our products andgenerate financing income for our company. Financial Productsactivity is conducted primarily in the United States, with additionaloffices in Asia, Australia, Canada, Europe and Latin America.
See Note 2 for discussion of the reclassification of certainreceivables and related cash flows.
B. Basis of consolidation
The financial statements include the accounts of Caterpillar Inc.and its subsidiaries. Investments in companies that are owned20% to 50% or are less than 20% owned and for which we havesignificant influence are accounted for by the equity method (seeNote 11). We consolidate all variable interest entities whereCaterpillar Inc. is the primary beneficiary.
Certain amounts for prior years have been reclassified to con-form with the current-year financial statement presentation.
Other operating expense primarily includes Cat Financial’sdepreciation of equipment leased to others, Cat Insurance under-writing expenses, gains (losses) on disposal of long-lived assetsand long-lived asset impairment charges.
C. Sales and revenue recognition
Sales of Machinery and Engines are recognized when title trans-fers and the risks and rewards of ownership have passed to cus-tomers or independently owned and operated dealers.
Our standard invoice terms are established by marketing region.When a sale is made to a dealer, the dealer is responsible for pay-ment even if the product is not sold to an end customer and mustmake payment within the standard terms to avoid interest costs.Interest at or above prevailing market rates is charged on any pastdue balance. Our policy is to not forgive this interest. In 2005,2004 and 2003, terms were extended to not more than one yearfor $287 million, $15 million and $54 million of receivables,respectively. For 2005, 2004 and 2003, these amounts representless than 1% of consolidated sales.
NOTES TO CONSOLIDATED FINANCIAL STATEMENTS

NOTES continued
A-10
Sales with payment terms of two months or more were as follows:(Dollars in millions)
2 $ 261 0.8% $ 96 0.3% $ 116 0.6%3 548 1.6% 175 0.6% 27 0.1%4 262 0.8% 117 0.4% 28 0.1%5 916 2.7% 750 2.6% 594 2.8%6 8,147 23.9% 6,172 21.9% 4,104 19.5%
7-12 345 1.0% 831 2.9% 671 3.2%
We establish a bad debt allowance for Machinery and Enginesreceivables when it becomes probable that the receivable willnot be collected. Our allowance for bad debts is not significant.No significant write-offs of Machinery and Engines receivableswere made during 2005, 2004 or 2003.
Revenues of Financial Products represent primarily financeand lease revenues of Cat Financial. Finance revenues are rec-ognized over the term of the contract at a constant rate of returnon the scheduled uncollected principal balance. Lease revenuesare recognized in the period earned. Recognition of income issuspended when collection of future income is not probable.Accrual is resumed, and previously suspended income is recog-nized, when the receivable becomes contractually current and/orcollection doubts are removed. Cat Financial provides whole-sale inventory financing to dealers. Please refer to Note 7 andNote 8 for more information.
D. InventoriesInventories are stated at the lower of cost or market. Cost is prin-cipally determined using the last-in, first-out (LIFO) method.The value of inventories on the LIFO basis represented about80% of total inventories at December 31, 2005, 2004 and 2003.
If the FIFO (first-in, first-out) method had been in use, inven-tories would have been $2,345 million, $2,124 million and$1,863 million higher than reported at December 31, 2005, 2004and 2003, respectively.
E. Securitized receivablesWe periodically sell finance receivables in securitization trans-actions. When finance receivables are securitized, we retaininterests in the receivables in the form of interest-only strips,servicing rights, cash reserve accounts and subordinated certifi-cates. The retained interests are recorded in other assets at fairvalue. We estimate fair value based on the present value of futureexpected cash flows using key assumptions for credit losses, pre-payment speeds and discount rates. Please refer to Note 8 formore information.
Prior to June 2005, we securitized trade receivables. We retainedinterests in the receivables in the form of certificates. The fairvalue of the certificated retained interests approximated carryingvalue due to their short-term nature. Please refer to Note 6 formore information.
F. Depreciation and amortizationDepreciation of plant and equipment is computed principallyusing accelerated methods. Depreciation on equipment leasedto others, primarily for Financial Products, is computed using thestraight-line method over the term of the lease. The depreciable
basis is the original cost of the equipment less the estimated residualvalue of the equipment at the end of the lease term. In 2005, 2004and 2003, Cat Financial depreciation on equipment leased to otherswas $615 million, $575 million and $527 million, respectively,and was included in “Other operating expenses” in Statement 1.In 2005, 2004 and 2003 consolidated depreciation expense was$1,444 million, $1,366 million and $1,332 million, respectively.Amortization of purchased intangibles is computed using thestraight-line method, generally not to exceed a period of 20 years.Accumulated amortization was $107 million, $91 million and$44 million at December 31, 2005, 2004 and 2003, respectively.
G. Foreign currency translationThe functional currency for most of our Machinery and Enginesconsolidated companies is the U.S. dollar. The functional currencyfor most of our Financial Products and equity basis companies isthe respective local currency. Gains and losses resulting from thetranslation of foreign currency amounts to the functional currencyare included in “Other income (expense)” in Statement 1. Gainsand losses resulting from translating assets and liabilities from thefunctional currency to U.S. dollars are included in “Accumulatedother comprehensive income” in Statement 2.
H. Derivative financial instrumentsOur earnings and cash flow are subject to fluctuations due tochanges in foreign currency exchange rates, interest rates andcommodity prices. Our Risk Management Policy (policy) allowsfor the use of derivative financial instruments to prudently man-age foreign currency exchange rate, interest rate and commod-ity price exposure. Our policy specifies that derivatives are notto be used for speculative purposes. Derivatives that we use areprimarily foreign currency forward and option contracts, inter-est rate swaps and commodity forward and option contracts. Ourderivative activities are subject to the management, direction andcontrol of our financial officers. Risk management practices, includ-ing the use of financial derivative instruments, are presented tothe Audit Committee of the board of directors at least annually.
All derivatives are recognized on the Consolidated FinancialPosition at their fair value. On the date the derivative contract isentered, we designate the derivative as (1) a hedge of the fairvalue of a recognized liability (“fair value” hedge), (2) a hedgeof a forecasted transaction or the variability of cash flow to bepaid (“cash flow” hedge), or (3) an “undesignated” instrument.Changes in the fair value of a derivative that is qualified, desig-nated and highly effective as a fair value hedge, along with thegain or loss on the hedged liability that is attributable to thehedged risk, are recorded in current earnings. Changes in the fairvalue of a derivative that is qualified, designated and highlyeffective as a cash flow hedge are recorded in other compre-hensive income until earnings are affected by the forecastedtransaction or the variability of cash flow and are then reportedin current earnings. Changes in the fair value of undesignatedderivative instruments and the ineffective portion of designatedderivative instruments are reported in current earnings. Cashflows from derivative financial instruments are classified withinthe same category as the item being hedged on the ConsolidatedStatement of Cash Flow.
We formally document all relationships between hedginginstruments and hedged items, as well as the risk-managementobjective and strategy for undertaking various hedge transactions.
26.3%$ 5,54028.7%$ 8,14130.8%$10,479
Percentof SalesSales
Percentof SalesSales
Percentof SalesSales
Payment Terms(months)
200320042005

Caterpillar Inc.
A-11
This process includes linking all derivatives that are designatedas fair value hedges to specific liabilities on the ConsolidatedFinancial Position and linking cash flow hedges to specific fore-casted transactions or variability of cash flow.
We also formally assess, both at the hedge’s inception and on anongoing basis, whether the derivatives that are used in hedgingtransactions are highly effective in offsetting changes in fair valuesor cash flow of hedged items. When it is determined that a deriva-tive is not highly effective as a hedge or that it has ceased to be ahighly effective hedge, we discontinue hedge accounting prospec-tively, in accordance with Statement of Financial AccountingStandards No. 133 “Accounting for Derivative Instruments andHedging Activities” (SFAS 133). Please refer to Note 3 for moreinformation on derivatives.
I. Impairment of available-for-sale securities
Available-for-sale securities are reviewed monthly to identifymarket values below cost of 20% or more. If a decline for a debtsecurity is in excess of 20% for six months, the investment isevaluated to determine if the decline is due to general declinesin the marketplace or if the investment has been impaired andshould be written down to market value pursuant to Statement ofFinancial Accounting Standards No. 115, “Accounting for CertainInvestments in Debt and Equity Securities” (SFAS 115). Afterthe six-month period, debt securities with declines from cost inexcess of 20% are evaluated monthly for impairment. For equitysecurities, if a decline from cost of 20% or more continues for a12-month period, an other than temporary impairment is recog-nized without continued analysis.
J. Income taxes
The provision for income taxes is determined using the asset andliability approach for accounting for income taxes in accordancewith Statement of Financial Accounting Standards No. 109,“Accounting for Income Taxes” (SFAS 109). Tax laws requireitems to be included in tax filings at different times than the itemsare reflected in the financial statements. A current liability isrecognized for the estimated taxes payable for the current year.Deferred taxes represent the future tax consequences expected tooccur when the reported amounts of assets and liabilities arerecovered or paid. Deferred taxes are adjusted for enacted changesin tax rates and tax laws. Valuation allowances are recorded toreduce deferred tax assets when it is more likely than not that atax benefit will not be realized.
K. Estimates in financial statements
The preparation of financial statements in conformity with account-ing principles generally accepted in the United States of Americarequires management to make estimates and assumptions that affectreported amounts. The more significant estimates include: residualvalues for leased assets, fair market values for goodwill impairmenttests, warranty liability, and reserves for product liability and insur-ance losses, postemployment benefits, post-sale discounts, creditlosses and income taxes.
L. New accounting standards
SFAS 151 — In November 2004, the Financial Accounting Stan-dards Board (FASB) issued Statement of Financial AccountingStandards No. 151 (SFAS 151), “Inventory Costs — an amend-ment of ARB No. 43, Chapter 4.” SFAS 151 discusses the general
principles applicable to the pricing of inventory. Paragraph 5 ofARB 43, Chapter 4 provides guidance on allocating certain coststo inventory. This Statement amends ARB 43, Chapter 4, to clarifythat abnormal amounts of idle facility expense, freight, handlingcosts, and wasted materials (spoilage) should be recognized ascurrent-period charges. In addition, this Statement requires thatallocation of fixed production overheads to the costs of conver-sion be based on the normal capacity of production facilities. Asrequired by SFAS 151, we will adopt this new accounting stan-dard on January 1, 2006. The adoption of SFAS 151 is not expectedto have a material impact on our financial statements.
SFAS 153 — In December 2004, the FASB issued Statement ofFinancial Accounting Standards No. 153 (SFAS 153), “Exchangesof Non-monetary Assets — an amendment of APB OpinionNo. 29.” SFAS 153 addresses the measurement of exchanges ofnon-monetary assets. It eliminates the exception from fair valuemeasurement for non-monetary exchanges of similar productiveassets in paragraph 21(b) of APB Opinion No. 29 “Accountingfor Non-monetary Transactions” and replaces it with an excep-tion for exchanges that do not have commercial substance. A non-monetary exchange has commercial substance if the future cashflows of the entity are expected to change significantly as a resultof the exchange. As required by SFAS 153, we adopted this newaccounting standard effective July 1, 2005. The adoption ofSFAS 153 did not have a material impact on our financial statements.
SFAS 123R — In December 2004, the FASB issued State-ment of Financial Accounting Standards No. 123R (revised 2004)“Share-Based Payment,” (SFAS 123R). SFAS 123R requiresthat the cost resulting from all share-based payment transactionsbe recognized in the financial statements. SFAS 123R also estab-lishes fair value as the measurement method in accounting forshare-based payments with employees. The FASB required theprovisions of SFAS 123R be adopted for interim or annual periodsbeginning after June 15, 2005. In April 2005, the SEC adopteda new rule amending the compliance dates for SFAS 123R. Inaccordance with this rule, we will adopt this new accountingstandard effective January 1, 2006. We will adopt the new guid-ance using the modified prospective method.
Our stock-based compensation plans allow for immediate vest-ing upon retirement for employees who are 55 years old or olderwith more than 10 years of service and who have fulfilled therequisite service period. Prior to the adoption of SFAS 123R, com-pensation expense for awards associated with these employeeshas been recognized in the pro forma net profit over the nominalvesting period. Upon adoption of SFAS 123R, compensationexpense will be recognized over the period from the grant dateto the end date of the requisite service period for employees whomeet the immediate vesting upon retirement requirements. Forthose employees who become eligible for immediate vestingupon retirement subsequent to the requisite service period andprior to the completion of the vesting period, compensation expensewill be recognized over the period from grant date to the datethe eligibility is achieved. Application of the nominal vestingperiod for these employees did not have a significant impact onthe 2005, 2004 and 2003 pro forma net profit.
In anticipation of delaying vesting until three years after thegrant date for future grants, the 2004 employee stock option grant(issued in June) fully vested on December 31, 2004. In order to

better align our employee stock option program with the over-all market, the number of options granted in 2005 (issued inFebruary) was significantly reduced from the previous year. Inresponse to this decrease, we elected to immediately vest the2005 option grant.
We expect the application of the expensing provisions ofSFAS 123R will result in a pretax expense of approximately$125 million in 2006. As a result of the vesting decisions dis-cussed above, a full complement of expense related to stock-based compensation will not be recognized in our results ofoperations until 2009. Based on the same assumptions used tovalue our 2006 compensation expense, we estimate our pretaxexpense associated with our stock-based compensation planswill range from approximately $160 million in 2007 to approxi-mately $210 million in 2009.
FIN 47 — In March 2005, the FASB issued FIN 47, “Account-ing for Conditional Asset Retirement Obligations, an interpreta-tion of FASB Statement No. 143, Accounting for Asset RetirementObligations.” FIN 47 clarifies that SFAS 143 requires accrualof the fair value of legally required asset retirement obligationsif sufficient information exists to reasonably estimate the fairvalue. We adopted this new accounting standard during thefourth quarter of 2005. The adoption of FIN 47 did not have amaterial impact on our financial statements.
SFAS 154 — In June 2005, the FASB issued Statement ofFinancial Accounting Standards No. 154 (SFAS 154), “Account-ing Changes and Error Corrections.” SFAS 154 changes therequirements for the accounting for and reporting of a change inaccounting principle. This Statement requires retrospective appli-cations to prior periods’ financial statements of a voluntarychange in accounting principle unless it is impracticable. In addi-tion, this Statement requires that a change in depreciation, amor-tization, or depletion for long-lived, non-financial assets beaccounted for as a change in accounting estimate effected by achange in accounting principle. This new accounting standardis effective January 1, 2006. The adoption of SFAS 154 is notexpected to have a material impact on our financial statements.
M. Stock-based compensation
We currently use the intrinsic value method of accounting for stock-based employee compensation in accordance with AccountingPrinciples Board Opinion No. 25, “Accounting for Stock Issuedto Employees.” Therefore, no compensation expense is recog-nized in association with our options.
In 2004, we switched from using the Black-Scholes option-pricing model to the binomial option-pricing model in order tocalculate the fair value of our options. We believe this modelmore accurately reflects the value of the options than the Black-Scholes option-pricing model. Grants made prior to 2004 con-tinue to be valued using the Black-Scholes model. Please referto Note 18 for additional information on our stock-based com-pensation plans.
The following tables illustrate the effect on profit and profitper share if we had applied the fair value method of Statementof Financial Accounting Standards (SFAS 123), “Accountingfor Stock-Based Compensation” for 2005 and 2004 grants usingthe binomial option-pricing model and 2003 using the Black-Scholes option-pricing model.
Years ended December 31,
(Dollars in millions except per share data) 2005 2004 2003_____ _____ _____Profit, as reported . . . . . . . . . . . . . . . . . . . . . . . . . . . . . . . . . . . $2,854 $ 2,035 $1,099Deduct: Total stock-based employee
compensation expense determined underfair value based method for all awards,net of related tax effects. . . . . . . . . . . . . . . . . . . . . . . . . . . (135) (161) (69)_____ _____ _____
Pro forma net profit . . . . . . . . . . . . . . . . . . . . . . . . . . . . . . . . . $2,719 $ 1,874 $1,030_____ _____ __________ _____ _____Profit per share of common stock:
As reported:Basic . . . . . . . . . . . . . . . . . . . . . . . . . . . . . . . . . . . . . . . . . . . . . $ 4.21 $ 2.97 $ 1.59Diluted . . . . . . . . . . . . . . . . . . . . . . . . . . . . . . . . . . . . . . . . . . . $ 4.04 $ 2.88 $ 1.56
Pro forma:Basic . . . . . . . . . . . . . . . . . . . . . . . . . . . . . . . . . . . . . . . . . . . . . $ 4.01 $ 2.74 $ 1.49Diluted . . . . . . . . . . . . . . . . . . . . . . . . . . . . . . . . . . . . . . . . . . . $ 3.85 $ 2.65 $ 1.47
Pro forma net profit and profit per share in 2004 using the Black-Scholesoption-pricing model would have been:
Year endedDecember 31,
(Dollars in millions except per share data) 2004_____Profit, as reported . . . . . . . . . . . . . . . . . . . . . . . . . . . . . . . . . . . . . . . . . . . . . . . . . . . . . . $ 2,035Deduct: Total stock-based employee compensation
expense determined under fair value based methodfor all awards, net of related tax effects . . . . . . . . . . . . . . . . . . . . . . . . . . . . . (202)_____
Pro forma net profit . . . . . . . . . . . . . . . . . . . . . . . . . . . . . . . . . . . . . . . . . . . . . . . . . . . . $ 1,833__________Profit per share of common stock:
As reported:Basic. . . . . . . . . . . . . . . . . . . . . . . . . . . . . . . . . . . . . . . . . . . . . . . . . . . . . . . . . . . . . . . . $ 2.97Diluted. . . . . . . . . . . . . . . . . . . . . . . . . . . . . . . . . . . . . . . . . . . . . . . . . . . . . . . . . . . . . . $ 2.88
Pro forma:Basic. . . . . . . . . . . . . . . . . . . . . . . . . . . . . . . . . . . . . . . . . . . . . . . . . . . . . . . . . . . . . . . . $ 2.68Diluted. . . . . . . . . . . . . . . . . . . . . . . . . . . . . . . . . . . . . . . . . . . . . . . . . . . . . . . . . . . . . . $ 2.59
2. Reclassification of certain receivables andrelated cash flows
A. Consolidated financial positionOur Machinery and Engines operations generate trade receivablesfrom the sale of inventory to dealers and customers. Certain ofthese receivables are sold to Cat Financial. Cat Financial holdsthe receivables and prior to June 2005, securitized a portion ofthe dealer receivables using a revolving securitization structure.Cat Financial’s portion of the securitized trade receivables wasrepresented by certificated retained interests. Cat Financial alsogenerates wholesale inventory receivables from its direct financ-ing of inventory purchases by dealers. Previously, the certificatedretained interests as well as the wholesale inventory receivableswere classified as Finance Receivables in our ConsolidatedFinancial Position. In the fourth quarter of 2004, we reclassifiedthe certificated retained interests from Finance Receivables toRetained Interests in Securitized Trade Receivables and thewholesale inventory receivables from Finance Receivables toTrade and Other Receivables in our Consolidated FinancialPosition. These changes were made to align the financial posi-tion with the cash flow changes discussed below.
B. Consolidated statement of cash flowDuring the fourth quarter of 2004, the staff of the Securities andExchange Commission expressed concern regarding the classi-fications of certain cash flows by companies with captive finance
NOTES continued
A-12

Caterpillar Inc.
A-13
subsidiaries. As a result of this concern, management decided tomake reclassifications to the 2003 Consolidated Statement ofCash Flow as described below.
Securitized trade receivables
Prior to the fourth quarter of 2004, we reported an increase incash flow from operating activities in the Consolidated Statementof Cash Flow when Machinery and Engines sold receivables toCat Financial that were subsequently securitized. Concurrently,Cat Financial’s entire purchase of these receivables was includedin Additions to Finance Receivables (investing activity) in theConsolidated Statement of Cash Flow. The receivables wereimmediately securitized and the portion sold to a third party wasincluded in Proceeds from Sale of Finance Receivables (investingactivity) in the Consolidated Statement of Cash Flow. Subsequently,collection of the certificated retained interests was included inCollection of Finance Receivables (investing activity) in theConsolidated Statement of Cash Flow. This cash flow treatmentfollowed our principal lines of business reporting, however, whenwe reported an increase in cash flow from operating activitiesand a corresponding outflow from investing activities there wasno increase in cash on a consolidated basis from the sale of inven-tory to our dealers and customers.
In the fourth quarter of 2004, we made a reclassification toeliminate the offsetting non-cash intercompany transactions inthe Consolidated Statement of Cash Flow. In addition, we reclas-sified the proceeds from sale of trade receivables to operatingactivities. The reclassification properly classifies cash receiptsfrom the sale of inventory as operating activities and reflects thatthese cash flows, although held and managed by Cat Financial,arise from our sale of Machinery and Engines inventory.
The securitization structure mentioned above involved a secu-ritization trust. During 2003, the trust was a qualifying specialpurpose entity (QSPE) and thus, in accordance with Statement ofFinancial Accounting Standards No. 140 (SFAS 140), “Accountingfor Transfers and Servicing of Financial Assets and Extinguish-ment of Liabilities,” was not consolidated. (See Note 6 for dis-cussion of the 2004 QSPE status of the trust and termination ofthe trust in 2005.) When receivables were placed into the trust,we received cash for the portion sold to third party purchasersand the portion retained by Cat Financial was represented bycertificated retained interests. Placing receivables into a securi-tization trust changes their nature and the receipt of certificatedretained interests is considered a non-cash transaction. We havenoted this non-cash transaction on the Consolidated Statement ofCash Flow and quantified the receivables decrease resulting fromthis transaction and thus excluded from operating activities. Thisreflects that certificated retained interests, not cash, were receivedfor these sales. The certificated retained interests are consideredheld-to-maturity securities as defined by SFAS 115. SFAS 115requires that collection of held-to-maturity securities be classifiedas an investing activity. We have therefore reclassified the col-lection of the certificated retained interests from Collection ofFinance Receivables to Collections of Retained Interests in Secu-ritized Trade Receivables within the investing activities sectionof the Consolidated Statement of Cash Flow. The impact of thesechanges is a significant reduction to cash flow from operatingactivities and a significant increase in cash flow from investing
activities. This reflects that although inventory was sold, thenature of the receivable was changed to a security. The subse-quent collection of that security is shown as an investing activity.
Wholesale inventory receivables
Prior to the fourth quarter of 2004, we reported an increase incash flow from operating activities when a dealer remitted pay-ment for a trade receivable that was subsequently financed withthe issuance of a wholesale inventory receivable by Cat Financial.The issuance of a wholesale inventory receivable by Cat Financialwas reported as an Addition to Finance Receivables in the Consol-idated Statement of Cash Flow and the subsequent collectionwas reported as a Collection of Finance Receivables. Similar tosecuritized receivables, this cash flow treatment followed our prin-cipal lines of business reporting, however, when we reported anincrease in cash flow from operating activities and a correspondingoutflow from investing activities there was no increase in cashon a consolidated basis from the sale of inventory to our dealersand customers. We therefore eliminated the offsetting non-cashtransaction in the Consolidated Statement of Cash Flow. In addi-tion, we reclassified the collection of wholesale inventory receiv-ables to operating activities. The reclassification properly classifiescash receipts from the sale of inventory as operating activities andreflects that these cash flows, although held and managed by CatFinancial, arise from our sale of Machinery and Engines inventory.
These reclassifications had no impact on the “Increase in Cashand Short-term Investments” on the Statement of ConsolidatedCash Flow.
Prior amounts reported have been reclassified to conform tothis presentation as follows:
2003____________________________Previous As
(Millions of dollars) classification(1) Change Reclassified__________ _______ ________Consolidated Financial Position— Statement 2
Receivables — trade and other . . . . . $ 3,671 $ 359 $ 4,030Receivables — finance . . . . . . . . . . . . . . 7,076 (1,909) 5,167Retained interests in securitized
trade receivables . . . . . . . . . . . . . . . . . . . — 1,550 1,550Long-term receivables —
trade and other . . . . . . . . . . . . . . . . . . . . . 82 428 510Long-term receivables — finance . . 8,163 (428) 7,735
Consolidated Statement ofCash Flow — Statement 4
Receivables — trade and other . . . . . $ (438) $ (7,677) $ (8,115)Net cash provided by (used for)
operating activities ........ . 2,066 (7,677) (5,611)
Additions to finance receivables. . . . . (17,146) 10,278 (6,868)Collections of finance receivables. . . 13,882 (8,631) 5,251Proceeds from sale of
finance receivables. . . . . . . . . . . . . . . . . 1,760 (1,099) 661Collections of retained interests
in securitized trade receivables. . . . — 7,129 7,129Net cash provided by (used for)
investing activities ........ . (2,793) 7,677 4,884(1) Certain amounts do not agree to prior period reported amounts due to unrelated reclassifications.

NOTES continued
A-14
3. Derivative financial instrumentsand risk management
A. Foreign currency exchange rate riskForeign currency exchange rate movements create a degree of riskby affecting the U.S. dollar value of sales made and costs incurredin foreign currencies. Movements in foreign currency rates also affectour competitive position as these changes may affect business prac-tices and/or pricing strategies of non-U.S.-based competitors. Addi-tionally, we have balance sheet positions denominated in foreigncurrency, thereby creating exposure to movements in exchange rates.
Our Machinery and Engines operations purchase, manufactureand sell products in many locations around the world. As we have adiversified revenue and cost base, we manage our future foreigncurrency cash flow exposure on a net basis. We use foreign cur-rency forward and option contracts to manage unmatched foreigncurrency cash inflow and outflow. Our objective is to minimize therisk of exchange rate movements that would reduce the U.S. dollarvalue of our foreign currency cash flow. Our policy allows for man-aging anticipated foreign currency cash flow for up to four years.
We generally designate as cash flow hedges at inception ofthe contract any Australian dollar, Brazilian real, British pound,Canadian dollar, euro, Japanese yen, Mexican peso, Singaporedollar, Chinese yuan, New Zealand dollar or Swiss franc forwardor option contracts that meet the standard for hedge accounting.Designation is performed on a specific exposure basis to supporthedge accounting. The remainder of Machinery and Engines for-eign currency contracts are undesignated. We designate as fairvalue hedges specific euro forward contracts used to hedge firmcommitments.
As of December 31, 2005, $8 million of deferred net lossesincluded in equity (“Accumulated other comprehensive income”in Statement 2), are expected to be reclassified to current earnings[“Other income (expense)”] over the next twelve months whenearnings are positively affected by the hedged transactions. As ofDecember 31, 2004 and 2003, the projected reclassification wasa gain of $102 million and $70 million, respectively. The decreasefrom 2004 to 2005 is due to expiration of several Machinery andEngines long-term hedges. The actual amount recorded in “Otherincome (expense)” will vary based on exchange rates at the timethe hedged transactions impact earnings. There were no circum-stances where hedge treatment was discontinued during 2005,2004 or 2003.
In managing foreign currency risk for our Financial Productsoperations, our objective is to minimize earnings volatility resultingfrom conversion and the remeasurement of net foreign currencybalance sheet positions. Our policy allows the use of foreign cur-rency forward and option contracts to offset the risk of currencymismatch between our receivables and debt. All such foreigncurrency forward and option contracts are undesignated.Gains/(losses) included in current earnings [Other income (expense)]on undesignated contracts:(Millions of dollars) 2005 2004 2003_____ _____ _____Machinery and Engines:
On undesignated contracts . . . . . . . . . . . . . . . . . . . . . . . $ 25 $ (9) $ (1)Financial Products:
On undesignated contracts . . . . . . . . . . . . . . . . . . . . . . . $ 58 $ (46) $(121)_____ ____ ____$ 83 $ (55) $(122)_____ ____ _________ ____ ____
Gains and losses on the Financial Products contracts aboveare substantially offset by balance sheet translation gains and losses.
B. Interest rate riskInterest rate movements create a degree of risk by affecting theamount of our interest payments and the value of our fixed ratedebt. Our practice is to use interest rate swap agreements to man-age our exposure to interest rate changes and, in some cases,lower the cost of borrowed funds.
Machinery and Engines operations generally use fixed rate debtas a source of funding. Our objective is to minimize the cost of bor-rowed funds. Our policy allows us to enter into fixed-to-floatinginterest rate swaps and forward rate agreements to meet that objec-tive with the intent to designate as fair value hedges at inceptionof the contract all fixed-to-floating interest rate swaps. Designationas a hedge of the fair value of our fixed rate debt is performed to sup-port hedge accounting. During 2001, our Machinery and Enginesoperations liquidated all fixed-to-floating interest rate swaps.The gain ($11 million as of December 31, 2005) is being amortizedto earnings ratably over the remaining life of the hedged debt.
Financial Products operations have a match funding policythat addresses interest rate risk by aligning the interest rate profile(fixed or floating rate) of their debt portfolio with the interest rateprofile of their receivables portfolio within predetermined rangeson an on-going basis. In connection with that policy, we useinterest rate derivative instruments to modify the debt structureto match assets within the receivables portfolio. This match fund-ing reduces the volatility of margins between interest-bearingassets and interest-bearing liabilities, regardless of which direc-tion interest rates move. This is accomplished by changing thecharacteristics of existing debt instruments or entering into newagreements in combination with the issuance of new debt.
Our policy allows us to use floating-to-fixed, fixed-to-floatingand floating-to-floating interest rate swaps to meet the matchfunding objective. To support hedge accounting, we designatefixed-to-floating interest rate swaps as fair value hedges of the fairvalue of our fixed rate debt at the inception of the contract. FinancialProducts’ practice is to designate most floating-to-fixed interestrate swaps as cash flow hedges of the variability of future cash flowsat the inception of the swap contract. Designation as a hedge ofthe variability of cash flow is performed to support hedge account-ing. Financial Products liquidated fixed-to-floating interest rateswaps during 2005, 2004 and 2002. The gains ($14 million as ofDecember 31, 2005) are being amortized to earnings ratably overthe remaining life of the hedged debt.
Gains/(losses) included in current earnings [Other income (expense)]:(Millions of dollars) 2005 2004 2003_____ _____ _____Fixed-to-floating interest rate swaps
Machinery and Engines:Gain on liquidated swaps. . . . . . . . . . . . . . . . . . . . . . . $ 5 $ 5 $ 6
Financial Products:Loss on designated interest
rate derivatives . . . . . . . . . . . . . . . . . . . . . . . . . . . . . . . . (71) (28) (20)Gain on hedged debt. . . . . . . . . . . . . . . . . . . . . . . . . . . . 71 28 20Gain on liquidated swaps —
included in interest expense . . . . . . . . . . . . . . . . . 5 2 2______ _____ _____$ 10 $ 7 $ 8______ _____ ___________ _____ _____
As of December 31, 2005, $12 million of deferred net gainsincluded in equity (“Accumulated other comprehensive income”in Statement 2), related to Financial Products floating-to-fixedinterest rate swaps, are expected to be reclassified to currentearnings (“Interest expense of Financial Products”) over the next
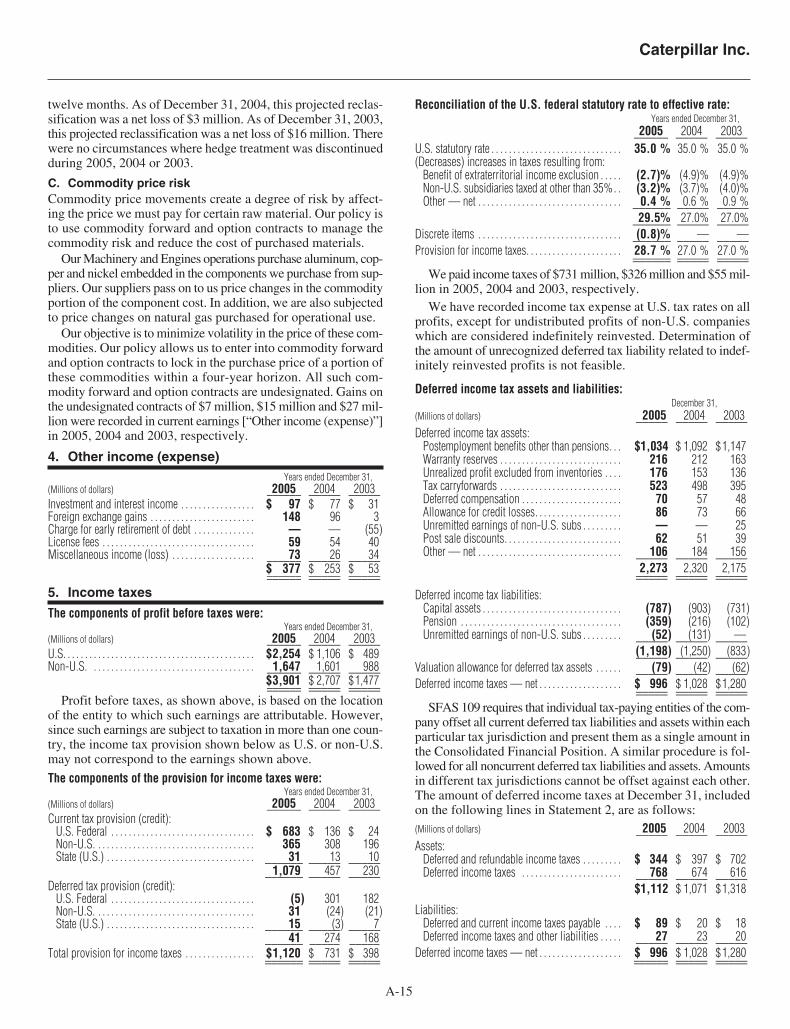
Caterpillar Inc.
A-15
twelve months. As of December 31, 2004, this projected reclas-sification was a net loss of $3 million. As of December 31, 2003,this projected reclassification was a net loss of $16 million. Therewere no circumstances where hedge treatment was discontinuedduring 2005, 2004 or 2003.
C. Commodity price riskCommodity price movements create a degree of risk by affect-ing the price we must pay for certain raw material. Our policy isto use commodity forward and option contracts to manage thecommodity risk and reduce the cost of purchased materials.
Our Machinery and Engines operations purchase aluminum, cop-per and nickel embedded in the components we purchase from sup-pliers. Our suppliers pass on to us price changes in the commodityportion of the component cost. In addition, we are also subjectedto price changes on natural gas purchased for operational use.
Our objective is to minimize volatility in the price of these com-modities. Our policy allows us to enter into commodity forwardand option contracts to lock in the purchase price of a portion ofthese commodities within a four-year horizon. All such com-modity forward and option contracts are undesignated. Gains onthe undesignated contracts of $7 million, $15 million and $27 mil-lion were recorded in current earnings [“Other income (expense)”]in 2005, 2004 and 2003, respectively.
4. Other income (expense)Years ended December 31,
(Millions of dollars) 2005 2004 2003______ _____ _____Investment and interest income . . . . . . . . . . . . . . . . . $ 97 $ 77 $ 31Foreign exchange gains . . . . . . . . . . . . . . . . . . . . . . . . 148 96 3Charge for early retirement of debt . . . . . . . . . . . . . . — — (55)License fees . . . . . . . . . . . . . . . . . . . . . . . . . . . . . . . . . . . 59 54 40Miscellaneous income (loss) . . . . . . . . . . . . . . . . . . . 73 26 34______ _____ _____
$ 377 $ 253 $ 53______ _____ ___________ _____ _____5. Income taxes
The components of profit before taxes were:Years ended December 31,
(Millions of dollars) 2005 2004 2003______ _____ _____U.S. . . . . . . . . . . . . . . . . . . . . . . . . . . . . . . . . . . . . . . . . . . . $2,254 $ 1,106 $ 489Non-U.S. . . . . . . . . . . . . . . . . . . . . . . . . . . . . . . . . . . . . . 1,647 1,601 988______ _____ _____
$3,901 $ 2,707 $1,477______ _____ ___________ _____ _____Profit before taxes, as shown above, is based on the location
of the entity to which such earnings are attributable. However,since such earnings are subject to taxation in more than one coun-try, the income tax provision shown below as U.S. or non-U.S.may not correspond to the earnings shown above.
The components of the provision for income taxes were:Years ended December 31,
(Millions of dollars) 2005 2004 2003______ _____ _____Current tax provision (credit):
U.S. Federal . . . . . . . . . . . . . . . . . . . . . . . . . . . . . . . . . $ 683 $ 136 $ 24Non-U.S. . . . . . . . . . . . . . . . . . . . . . . . . . . . . . . . . . . . . 365 308 196State (U.S.) . . . . . . . . . . . . . . . . . . . . . . . . . . . . . . . . . . 31 13 10______ _____ _____
1,079 457 230______ _____ _____Deferred tax provision (credit):
U.S. Federal . . . . . . . . . . . . . . . . . . . . . . . . . . . . . . . . . (5) 301 182Non-U.S. . . . . . . . . . . . . . . . . . . . . . . . . . . . . . . . . . . . . 31 (24) (21)State (U.S.) . . . . . . . . . . . . . . . . . . . . . . . . . . . . . . . . . . 15 (3) 7______ _____ _____
41 274 168______ _____ _____Total provision for income taxes . . . . . . . . . . . . . . . . $1,120 $ 731 $ 398______ _____ ___________ _____ _____
Reconciliation of the U.S. federal statutory rate to effective rate:Years ended December 31,
2005 2004 2003______ _____ _____U.S. statutory rate . . . . . . . . . . . . . . . . . . . . . . . . . . . . . . 35.0)% 35.0)% 35.0)%(Decreases) increases in taxes resulting from:
Benefit of extraterritorial income exclusion . . . . . (2.7)% (4.9)% (4.9)%Non-U.S. subsidiaries taxed at other than 35%. . (3.2)% (3.7)% (4.0)%Other — net . . . . . . . . . . . . . . . . . . . . . . . . . . . . . . . . . 0.4)% 0.6)% 0.9)%______ _____ _____
29.5% 27.0% 27.0%______ _____ _____Discrete items . . . . . . . . . . . . . . . . . . . . . . . . . . . . . . . . . (0.8)% — —______ _____ _____Provision for income taxes. . . . . . . . . . . . . . . . . . . . . . 28.7)% 27.0)% 27.0)%______ _____ ___________ _____ _____
We paid income taxes of $731 million, $326 million and $55 mil-lion in 2005, 2004 and 2003, respectively.
We have recorded income tax expense at U.S. tax rates on allprofits, except for undistributed profits of non-U.S. companieswhich are considered indefinitely reinvested. Determination ofthe amount of unrecognized deferred tax liability related to indef-initely reinvested profits is not feasible.
Deferred income tax assets and liabilities:December 31,
(Millions of dollars) 2005 2004 2003_____ _____ _____Deferred income tax assets:
Postemployment benefits other than pensions. . . $1,034 $ 1,092 $1,147Warranty reserves . . . . . . . . . . . . . . . . . . . . . . . . . . . . 216 212 163Unrealized profit excluded from inventories . . . . 176 153 136Tax carryforwards . . . . . . . . . . . . . . . . . . . . . . . . . . . . 523 498 395Deferred compensation . . . . . . . . . . . . . . . . . . . . . . . 70 57 48Allowance for credit losses. . . . . . . . . . . . . . . . . . . . 86 73 66Unremitted earnings of non-U.S. subs . . . . . . . . . — — 25Post sale discounts. . . . . . . . . . . . . . . . . . . . . . . . . . . 62 51 39Other — net . . . . . . . . . . . . . . . . . . . . . . . . . . . . . . . . . 106 184 156_____ _____ _____
2,273 2,320 2,175_____ _____ __________ _____ _____
Deferred income tax liabilities:Capital assets . . . . . . . . . . . . . . . . . . . . . . . . . . . . . . . . (787) (903) (731)Pension . . . . . . . . . . . . . . . . . . . . . . . . . . . . . . . . . . . . . (359) (216) (102)Unremitted earnings of non-U.S. subs . . . . . . . . . (52) (131) —_____ _____ _____
(1,198) (1,250) (833)_____ _____ _____Valuation allowance for deferred tax assets . . . . . . (79) (42) (62)_____ _____ _____Deferred income taxes — net . . . . . . . . . . . . . . . . . . . $ 996 $ 1,028 $1,280_____ _____ __________ _____ _____
SFAS 109 requires that individual tax-paying entities of the com-pany offset all current deferred tax liabilities and assets within eachparticular tax jurisdiction and present them as a single amount inthe Consolidated Financial Position. A similar procedure is fol-lowed for all noncurrent deferred tax liabilities and assets. Amountsin different tax jurisdictions cannot be offset against each other.The amount of deferred income taxes at December 31, includedon the following lines in Statement 2, are as follows:(Millions of dollars) 2005 2004 2003_____ _____ _____Assets:
Deferred and refundable income taxes . . . . . . . . . $ 344 $ 397 $ 702Deferred income taxes . . . . . . . . . . . . . . . . . . . . . . . 768 674 616_____ _____ _____
$1,112 $ 1,071 $1,318
Liabilities:Deferred and current income taxes payable . . . . $ 89 $ 20 $ 18Deferred income taxes and other liabilities . . . . . 27 23 20_____ _____ _____
Deferred income taxes — net . . . . . . . . . . . . . . . . . . . $ 996 $ 1,028 $1,280______ _____ ___________ _____ _____

As of December 31, 2005, amounts and expiration dates ofU.S. foreign tax credits available to carry forward were:
(Millions of dollars)
2006-2011 2012 2013 2014 2015 Total_____________________________________________________$0 $36 $109 $74 $18 $237
As of December 31, 2005, amounts and expiration dates ofnet operating loss carryforwards in various non-U.S. taxing juris-dictions were:
(Millions of dollars)
2006 2007 2008 2009 2010-2015 Unlimited Total_____________________________________________________$7 $3 $0 $5 $137 $569 $721A valuation allowance has been recorded at certain non-U.S. sub-
sidiaries that have not yet demonstrated consistent and/or sustain-able profitability to support the recognition of net deferred tax assets.
As of December 31, 2005, approximately $890 million of statetax net operating losses (NOLs) and $36 million of state tax creditcarryforwards were available. Of the NOLs, 67% expire after2015. The state tax credit carryforwards expire over the nextten years. We established a valuation allowance for those NOLsand credit carryforwards likely to expire prior to utilization.
In December 2004, the FASB issued FASB Staff PositionNo. 109-1 “Application of FASB Statement No. 109, Accountingfor Income Taxes, to the Tax Deduction on Qualified ProductionActivities Provided by the American Jobs Creation Act of 2004”(FSP 109-1). FSP 109-1 provides accounting guidance for com-panies that will be eligible for a tax deduction resulting from “qual-ified production activities income” as defined in the American JobsCreation Act of 2004 (the Act). FSP 109-1 requires this deductionbe treated as a special deduction in accordance with SFAS 109,which does not require a revaluation of our U.S. deferred tax assets.We applied the guidance in FSP 109-1 upon recognition of this taxdeduction beginning January 1, 2005. The application of FSP 109-1did not have a material impact on our financial statements.
In December 2004, the FASB issued FASB Staff PositionNo. 109-2 “Accounting and Disclosure Guidance for the ForeignEarnings Repatriation Provision within the American Jobs CreationAct of 2004” (FSP 109-2). FSP 109-2 provides accounting guidancefor the one-time tax deduction of 85% of non-U.S. earnings thatare repatriated in excess of a base amount as defined in the Act.SFAS 109 requires a company to reflect in the period of enactmentthe effect of a new tax law. Due to the lack of clarification of certainprovisions within the Act, FSP 109-2 allowed companies timebeyond the financial reporting period of enactment to evaluatethe effect of the Act. We completed our evaluation in the secondquarter and recognized a provision for income taxes of $33 millionin 2005 under the provisions of the Act. We repatriated earningsof $1.4 billion in 2005, which includes approximately $500 mil-lion subject to the preferential treatment allowed by the Act. Inconnection with our repatriation plan, we now intend to indefinitelyreinvest earnings of a few selected non-U.S. subsidiaries and havereversed the associated deferred tax liability of $38 million.
The 2005 provision for income taxes also includes the impactof favorable tax settlements of $26 million primarily related tonon-U.S. tax jurisdictions. The net impact of repatriation planningand these favorable tax settlements was a $31 million decrease toour 2005 provision for income taxes. Excluding these discreteitems, the effective tax rate for 2005 was 29.5%.
During the second quarter of 2005, the Internal Revenue Service(IRS) completed its field examination of our 1995 through 1999U.S. tax returns. In connection with this examination, we receivednotices of certain adjustments proposed by the IRS, primarilyrelated to foreign sales corporation (FSC) commissions, foreigntax credit calculations and R&D credits. We disagree with theseproposed adjustments and are vigorously disputing this matterthrough applicable IRS and judicial procedures, as appropriate.Although the final resolution of the proposed adjustments is uncer-tain, in the opinion of our management, the ultimate dispositionof these matters will not have a material adverse effect on ourconsolidated financial position, liquidity or results of operations.
6. Sales and servicing of trade receivables
Our Machinery and Engines operations generate trade receiv-ables from the sale of inventory to dealers and customers. Certainof these receivables are sold to Cat Financial.
A. Prior to June 2005, Cat Financial periodically securitized aportion of the dealer receivables using a revolving securitizationstructure. We used a trust which issued a collateralized trust obli-gation (CTO) certificate to third party purchasers for their portionof these receivables. The trust also issued a transferor certificate(certificated retained interests) to Cat Financial for the portion notrepresented by the CTO.
For 2003 and through August of 2004, the trust was a quali-fying special purpose entity (QSPE) and thus, in accordance withSFAS 140, was not consolidated. The outstanding principal bal-ance of the CTO was not included in our Consolidated FinancialPosition during these periods. As of December 31, 2003, the cer-tificated retained interests of $1,550 million were included in“Retained Interests in Securitized Trade Receivables” in Statement 2.
From September 2004 through May 2005, because of a signif-icant increase in Machinery and Engines’ sales and subsequentsale of the receivables to Cat Financial, our certificated retainedinterests in the trust exceeded 90% of the fair value of trust assets.Thus, during this period, the trust did not qualify as a QSPE asdefined by SFAS 140. We therefore consolidated the trust inaccordance with FIN 46R, “Consolidation of Variable InterestEntities” (revised) as it represents a variable interest entity for whichCat Financial is the primary beneficiary. As of December 31, 2004,assets of the trust of $2,587 million were included in “Receivables— trade and other” in Statement 2 and the CTO of $240 mil-lion was included in “Short-term Borrowings.” Please refer toNote 15.
Cat Financial serviced the dealer receivables and received anannual servicing fee of approximately 1% of the average out-standing principal balance of the securitized trade receivablestransferred to third party purchasers. Consolidated expenses of$7 million and $6 million related to the securitized receivableswere recognized during 2004 and 2003, respectively, and areincluded in “Other income (expense)” on Statement 1. Expectedcredit losses were assumed to be 0% because dealer receivableshave historically had no losses and none were expected. Thecarrying value of the certificated retained interests approximatedfair value due to their short-term nature. Other than the certifi-cated retained interests (assets of the trust when consolidated),the investors and the securitization facilities had no recourse toCat Financial’s assets for failure of debtors to pay when due.
NOTES continued
A-16

Caterpillar Inc.
A-17
(Millions of dollars) 2004 2003______ ______Cash flow from securitizations:Proceeds from collections reinvested
in revolving securitization(1) . . . . . . . . . . . . . . . . . . . . . . . . . . . . $ 663 $ 1,099Servicing fees received(1) . . . . . . . . . . . . . . . . . . . . . . . . . . . . . . . . . 2 2Characteristics of securitized receivables:Principal balance at December 31:
Certificated retained interests . . . . . . . . . . . . . . . . . . . . . . . . . . $ — $ 1,550Collateralized trust obligation . . . . . . . . . . . . . . . . . . . . . . . . . . — 240
Average balance for the year ended December 31(1):Certificated retained interests . . . . . . . . . . . . . . . . . . . . . . . . . . $ 1,936 $ 1,350Collateralized trust obligation . . . . . . . . . . . . . . . . . . . . . . . . . . 240 240
(1) For 2004, proceeds, servicing fees received and average balances include only the periods thetrust was a QSPE.
In June 2005, Cat Financial terminated the trade receivablesecuritization trust and no longer securitizes trade receivables.Upon termination, receivables held by the trust were transferredback to Cat Financial.B. In June 2005, Cat Financial transferred an undivided interestof $240 million in trade receivables to third party purchasers. Inaccordance with SFAS 140, the transfer to third party purchasersis accounted for as a sale. Cat Financial services the transferredtrade receivables and receives an annual servicing fee of approxi-mately 1% of the average outstanding principal balance. Consoli-dated expense of $8 million related to the sale of trade receivableswas recognized during 2005 and is included in “Other income(expense)” on Statement 1.
The remaining interest as of December 31, 2005 of $3,028 mil-lion is included in “Receivables — trade and other” in Statement 2.The cash collections from these receivables held by Cat Financial,including those attributable to the third party purchasers, are firstapplied to satisfy any obligations of Cat Financial to those pur-chasers. The third party purchasers have no recourse to CatFinancial’s assets, other than the remaining interest, for failureof debtors to pay when due. For Cat Financial’s remaining inter-est in trade receivables, carrying amount approximated fair valuedue to the short-term nature of these receivables.
7. Wholesale inventory receivablesWholesale inventory receivables are receivables of Cat Financialthat arise when Cat Financial provides financing for a dealer’s pur-chase of inventory. These receivables are included in “Receivables— trade and other” and “Long-term receivables — trade and other”in Statement 2 and were $1,282 million, $991 million and $764 mil-lion at December 31, 2005, 2004 and 2003, respectively. Please referto Note 20 on page A-28 and Table III on page A-29 for fair valueinformation.Contractual maturities of outstanding wholesale inventory receivables:
December 31, 2005Wholesale Wholesale
(Millions of dollars) Installment Finance WholesaleAmounts Due In Contracts Leases Notes Total___________ _______ ______ ______ ______2006 . . . . . . . . . . . . . . . . . . . . . . $ 37 $ 73 $ 441 $ 5512007 . . . . . . . . . . . . . . . . . . . . . . 13 52 254 3192008 . . . . . . . . . . . . . . . . . . . . . . 14 36 250 3002009 . . . . . . . . . . . . . . . . . . . . . . 10 19 18 472010 . . . . . . . . . . . . . . . . . . . . . . 7 7 14 28Thereafter . . . . . . . . . . . . . . . . . — — 3 3_____ _____ _____ ______
81 187 980 1,248Guaranteed residual value . . — 85 — 85Less: Unearned income . . . . . 4 18 29 51_____ _____ _____ ______Total . . . . . . . . . . . . . . . . . . . . . . $ 77 $ 254 $ 951 $ 1,282_____ _____ _____ ___________ _____ _____ ______
8. Finance receivables
Finance receivables are receivables of Cat Financial, which gen-erally can be repaid or refinanced without penalty prior to contrac-tual maturity. Total finance receivables reported in Statement 2are net of an allowance for credit losses.
During 2005, 2004 and 2003, Cat Financial securitized retailinstallment sale contracts and finance leases into public asset-backed securitization facilities. The securitization facilities arequalifying special purpose entities and thus, in accordance withSFAS 140, are not consolidated. These finance receivables, whichare being held in securitization trusts, are secured by new andused equipment. Cat Financial retained servicing responsibilitiesand subordinated interests related to these securitizations. For2005, subordinated interests included subordinated certificateswith an initial fair value of $8 million, an interest in certain futurecash flow (excess) with an initial fair value of $1 million and areserve account with an initial fair value of $12 million. For2004, subordinated interests included subordinated certificateswith an initial fair value of $8 million, an interest in certain futurecash flow (excess) with an initial fair value of $2 million and areserve account with an initial fair value of $10 million. For2003, subordinated interests included subordinated certificateswith an initial fair value of $9 million, an interest in certain futurecash flow (excess) with an initial fair value of $14 million anda reserve account with an initial fair value of $10 million. Thecompany’s retained interests generally are subordinate to theinvestors’ interests. Net gains of $12 million, $13 million and$22 million were recognized on these transactions in 2005, 2004and 2003, respectively.
Significant assumptions used to estimate the fair value of theretained interests and subordinated certificates at the time of thetransaction were:
2005 2004 2003_____ _____ _____Discount rate . . . . . . . . . . . . . . . . . . . . . . . . . . . . . . . . . . 10.8% 10.7% 11.0%Weighted-average prepayment rate . . . . . . . . . . . . . . . . 14.0% 14.0% 14.0%Expected credit losses . . . . . . . . . . . . . . . . . . . . . . . . . . . . . . 1.0% 1.0% 1.0%
These assumptions are based on our historical experience,market trends and anticipated performance relative to the par-ticular assets securitized.
The company receives annual servicing fees of approximately1% of the unpaid note value.
As of December 31, 2005, 2004 and 2003, the subordinatedretained interests in the public securitizations totaled $72 million,$73 million and $73 million, respectively. Key assumptions usedto determine the fair value of the retained interests were:
2005 2004 2003_____ _____ _____Cash flow discount rates
on retained interests andsubordinated tranches . . . . . . . . . . . . . . . 10.7% 10.7% 9.1-10.8%
Weighted-average maturity . . . . . . . . . . . . 30 months 28 months 27 monthsAverage prepayment rate . . . . . . . . . . . . . . . 14.0% 14.0% 14.0%Expected credit losses . . . . . . . . . . . . . . . . . 1.0% 1.0% 1.0%
The investors and the securitization trusts have no recourse toCat Financial’s other assets for failure of debtors to pay when due.
We estimated the impact of individual 10% and 20% changesto the key economic assumptions used to determine the fair valueof residual cash flow in retained interests on our income. An

NOTES continued
A-18
independent, adverse change to each key assumption had animmaterial impact on the fair value of residual cash flow.
We consider an account past due if any portion of an installmentis due and unpaid for more than 30 days. Recognition of income issuspended when management determines that collection of futureincome is not probable (generally after 120 days past due). Accrualis resumed, and previously suspended income is recognized, whenthe receivable becomes contractually current and/or collectiondoubts are removed. Cash receipts on impaired loans or financeleases are recorded against the receivable and then to any unrec-ognized income. Investment in loans/finance leases on non-accrual status were $175 million, $176 million and $233 millionand past due over 90 days and still accruing were $31 million,$11 million and $25 million as of December 31, 2005, 2004 and2003, respectively.
Cat Financial provides financing only when acceptable crite-ria are met. Credit decisions are based on, among other things,the customer’s credit history, financial strength and intended use
of equipment. Cat Financial typically maintains a security inter-est in retail financed equipment and requires physical damageinsurance coverage on financed equipment.
Please refer to Table I above for additional finance receiv-ables information and Note 20 on page A-28 and Table III onpage A-29 for fair value information.
9. Inventories
December 31,(Millions of dollars) 2005 2004 2003______ _____ _____Raw materials. . . . . . . . . . . . . . . . . . . . . . . . . . . . . . . . . . $1,689 $ 1,592 $1,105Work-in-process . . . . . . . . . . . . . . . . . . . . . . . . . . . . . . . 814 664 377Finished goods . . . . . . . . . . . . . . . . . . . . . . . . . . . . . . . . 2,493 2,209 1,381Supplies. . . . . . . . . . . . . . . . . . . . . . . . . . . . . . . . . . . . . . . 228 210 184______ _____ _____Total inventories . . . . . . . . . . . . . . . . . . . . . . . . . . . . . . . $5,224 $ 4,675 $3,047______ _____ ___________ _____ _____
We had long-term material purchase obligations of approxi-mately $890 million at December 31, 2005.
TABLE I — Finance Receivables Information (Millions of dollars)_______________________________________________________________________________________________________________
2005 2004 2003______ ______ ______Cash flow from securitizations:Proceeds from initial sales of receivables . . . . . . . . . . . . . . . . . . . . . . . . . . . . . . . . . . . . . . . . . . . . . . . . . . . . . . . . . . . . . . . . . . . . . . . . . $ 829 $ 639 $ 661Servicing fees received . . . . . . . . . . . . . . . . . . . . . . . . . . . . . . . . . . . . . . . . . . . . . . . . . . . . . . . . . . . . . . . . . . . . . . . . . . . . . . . . . . . . . . . . . . . . . 11 9 8Cash flows received on retained interests . . . . . . . . . . . . . . . . . . . . . . . . . . . . . . . . . . . . . . . . . . . . . . . . . . . . . . . . . . . . . . . . . . . . . . . . . 38 34 15Characteristics of securitized receivables:At December 31:
Total securitized principal balance . . . . . . . . . . . . . . . . . . . . . . . . . . . . . . . . . . . . . . . . . . . . . . . . . . . . . . . . . . . . . . . . . . . . . . . . . . . . $ 980 $ 815 $ 813Loans more than 30 days past due . . . . . . . . . . . . . . . . . . . . . . . . . . . . . . . . . . . . . . . . . . . . . . . . . . . . . . . . . . . . . . . . . . . . . . . . . . . . 23 26 34Weighted average maturity (in months) . . . . . . . . . . . . . . . . . . . . . . . . . . . . . . . . . . . . . . . . . . . . . . . . . . . . . . . . . . . . . . . . . . . . . . . 30 28 27
For the year ended December 31:Average securitized principal balance . . . . . . . . . . . . . . . . . . . . . . . . . . . . . . . . . . . . . . . . . . . . . . . . . . . . . . . . . . . . . . . . . . . . . . . . . $1,085 $ 873 $ 884Net credit losses. . . . . . . . . . . . . . . . . . . . . . . . . . . . . . . . . . . . . . . . . . . . . . . . . . . . . . . . . . . . . . . . . . . . . . . . . . . . . . . . . . . . . . . . . . . . . . . . 3 4 6
Contractual maturities of outstanding finance receivables:December 31, 2005
Retail RetailInstallment Finance Retail Wholesale
Amounts Due In Contracts Leases Notes Notes Total___________ _______ ______ ______ ______ ______2006 . . . . . . . . . . . . . . . . $ 2,760 $ 2,085 $ 1,896 $ 137 $ 6,8782007 . . . . . . . . . . . . . . . . 1,988 1,465 850 15 4,3182008 . . . . . . . . . . . . . . . . 1,312 951 626 7 2,8962009 . . . . . . . . . . . . . . . . 657 516 439 — 1,6122010 . . . . . . . . . . . . . . . . 214 218 374 — 806Thereafter . . . . . . . . . . . . 39 205 731 — 975_____ _____ _____ _____ ______
6,970 5,440 4,916 159 17,485Residual value . . . . . . . — 938 — — 938Less: Unearned
income . . . . . . . . . . . . 681 623 74 — 1,378_____ _____ _____ _____ ______Total. . . . . . . . . . . . . . . . . $ 6,289 $ 5,755 $ 4,842 $ 159 $ 17,045_____ _____ _____ _____ ___________ _____ _____ _____ ______
Impaired loans and leases:2005 2004 2003____ ____ ____
Average recorded investment . . . . . . . . . . . . . . . . . . . . . . $ 143 $ 265 $ 321____ ____ ________ ____ ____At December 31:
Recorded investment . . . . . . . . . . . . . . . . . . . . . . . . . . . . $ 106 $ 181 $ 275Impaired loans/finance leases for which there
is a related allowance for credit losses . . . . . . . . . . $ 33 $ 51 $ 98Impaired loans/finance leases for which there
is no related allowance for credit losses . . . . . . . . $ 73 $ 130 $ 177
Allowance for credit loss activity:2005 2004 2003_____ _____ _____
Balance at beginning of year . . . . . . . . . . . . . . . . . . . . . . $ 278 $ 241 $ 207Provision for credit losses . . . . . . . . . . . . . . . . . . . . . . . . 92 105 101Receivables written off . . . . . . . . . . . . . . . . . . . . . . . . . . . (62) (88) (104)Recoveries on receivables previously written off. . . . 17 16 22Other — net . . . . . . . . . . . . . . . . . . . . . . . . . . . . . . . . . . . . . (23) 4 15_____ _____ _____Balance at end of year . . . . . . . . . . . . . . . . . . . . . . . . . . . . $ 302 $ 278 $ 241_____ _____ __________ _____ _____
In estimating the allowance for credit losses, we review accountsthat are past due, non-performing or in bankruptcy.
Cat Financial’s net retail finance leases:December 31,
2005 2004 2003_____ _____ _____Total minimum lease payments receivable . . . . . . . . . $5,440 $ 4,876 $4,096Estimated residual value of leased assets:
Guaranteed . . . . . . . . . . . . . . . . . . . . . . . . . . . . . . . . . . . . 384 379 323Unguaranteed. . . . . . . . . . . . . . . . . . . . . . . . . . . . . . . . . . 554 540 558_____ _____ _____
6,378 5,795 4,977Less: Unearned income . . . . . . . . . . . . . . . . . . . . . . . . . . 623 550 498_____ _____ _____Net retail finance leases . . . . . . . . . . . . . . . . . . . . . . . . . . $5,755 $ 5,245 $ 4,479_____ _____ __________ _____ _____
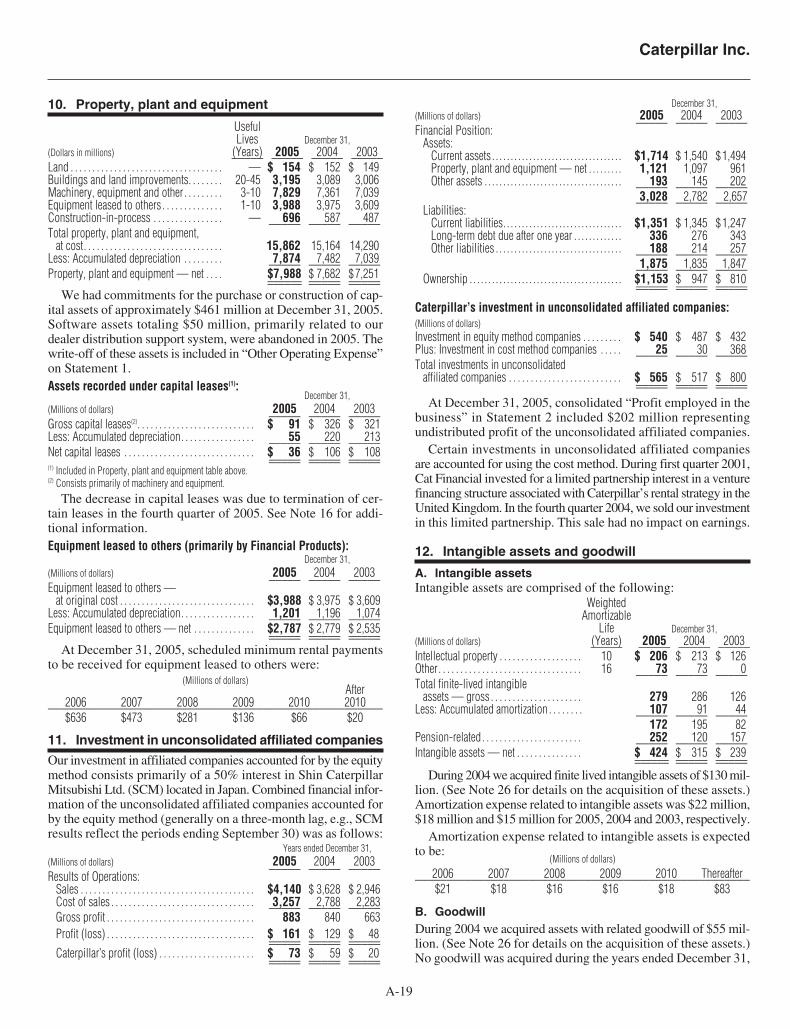
Caterpillar Inc.
A-19
10. Property, plant and equipment
UsefulLives December 31,
(Dollars in millions) (Years) 2005 2004 2003_____ _____ _____ _____Land . . . . . . . . . . . . . . . . . . . . . . . . . . . . . . . . . . . — $ 154 $ 152 $ 149Buildings and land improvements. . . . . . . . 20-45 3,195 3,089 3,006Machinery, equipment and other. . . . . . . . . 3-10 7,829 7,361 7,039Equipment leased to others . . . . . . . . . . . . . . 1-10 3,988 3,975 3,609Construction-in-process . . . . . . . . . . . . . . . . — 696 587 487_____ _____ _____Total property, plant and equipment,
at cost. . . . . . . . . . . . . . . . . . . . . . . . . . . . . . . . 15,862 15,164 14,290Less: Accumulated depreciation . . . . . . . . . 7,874 7,482 7,039_____ _____ _____Property, plant and equipment — net . . . . $7,988 $ 7,682 $7,251______ _____ ___________ _____ _____
We had commitments for the purchase or construction of cap-ital assets of approximately $461 million at December 31, 2005.Software assets totaling $50 million, primarily related to ourdealer distribution support system, were abandoned in 2005. Thewrite-off of these assets is included in “Other Operating Expense”on Statement 1. Assets recorded under capital leases(1):
December 31,(Millions of dollars) 2005 2004 2003_____ _____ _____Gross capital leases(2). . . . . . . . . . . . . . . . . . . . . . . . . . . $ 91 $ 326 $ 321Less: Accumulated depreciation. . . . . . . . . . . . . . . . . 55 220 213_____ _____ _____Net capital leases . . . . . . . . . . . . . . . . . . . . . . . . . . . . . . $ 36 $ 106 $ 108_____ _____ __________ _____ _____(1) Included in Property, plant and equipment table above.(2) Consists primarily of machinery and equipment.
The decrease in capital leases was due to termination of cer-tain leases in the fourth quarter of 2005. See Note 16 for addi-tional information.Equipment leased to others (primarily by Financial Products):
December 31,(Millions of dollars) 2005 2004 2003_____ _____ _____Equipment leased to others —
at original cost . . . . . . . . . . . . . . . . . . . . . . . . . . . . . . . $3,988 $ 3,975 $ 3,609Less: Accumulated depreciation. . . . . . . . . . . . . . . . . 1,201 1,196 1,074_____ _____ _____Equipment leased to others — net . . . . . . . . . . . . . . $2,787 $ 2,779 $ 2,535_____ _____ __________ _____ _____
At December 31, 2005, scheduled minimum rental paymentsto be received for equipment leased to others were:
(Millions of dollars)After
2006 2007 2008 2009 2010 2010_____________________________________________________$636 $473 $281 $136 $66 $20
11. Investment in unconsolidated affiliated companies
Our investment in affiliated companies accounted for by the equitymethod consists primarily of a 50% interest in Shin CaterpillarMitsubishi Ltd. (SCM) located in Japan. Combined financial infor-mation of the unconsolidated affiliated companies accounted forby the equity method (generally on a three-month lag, e.g., SCMresults reflect the periods ending September 30) was as follows:
Years ended December 31,(Millions of dollars) 2005 2004 2003_____ _____ _____Results of Operations:
Sales . . . . . . . . . . . . . . . . . . . . . . . . . . . . . . . . . . . . . . . . $4,140 $ 3,628 $ 2,946Cost of sales . . . . . . . . . . . . . . . . . . . . . . . . . . . . . . . . . 3,257 2,788 2,283_____ _____ _____Gross profit . . . . . . . . . . . . . . . . . . . . . . . . . . . . . . . . . . 883 840 663Profit (loss) . . . . . . . . . . . . . . . . . . . . . . . . . . . . . . . . . . $ 161 $ 129 $ 48_____ _____ __________ _____ _____Caterpillar’s profit (loss) . . . . . . . . . . . . . . . . . . . . . . $ 73 $ 59 $ 20_____ _____ __________ _____ _____
December 31,(Millions of dollars) 2005 2004 2003_____ _____ _____Financial Position:
Assets:Current assets. . . . . . . . . . . . . . . . . . . . . . . . . . . . . . . . . . . $1,714 $ 1,540 $1,494Property, plant and equipment — net . . . . . . . . . 1,121 1,097 961Other assets . . . . . . . . . . . . . . . . . . . . . . . . . . . . . . . . . . . . . 193 145 202_____ _____ _____
3,028 2,782 2,657_____ _____ _____Liabilities:
Current liabilities. . . . . . . . . . . . . . . . . . . . . . . . . . . . . . . . $1,351 $ 1,345 $1,247Long-term debt due after one year . . . . . . . . . . . . . 336 276 343Other liabilities . . . . . . . . . . . . . . . . . . . . . . . . . . . . . . . . . . 188 214 257_____ _____ _____
1,875 1,835 1,847_____ _____ _____Ownership . . . . . . . . . . . . . . . . . . . . . . . . . . . . . . . . . . . . . . . . . $1,153 $ 947 $ 810_____ _____ __________ _____ _____
Caterpillar’s investment in unconsolidated affiliated companies:(Millions of dollars)Investment in equity method companies . . . . . . . . . $ 540 $ 487 $ 432Plus: Investment in cost method companies . . . . . 25 30 368_____ _____ _____Total investments in unconsolidated
affiliated companies . . . . . . . . . . . . . . . . . . . . . . . . . . $ 565 $ 517 $ 800_____ _____ __________ _____ _____
At December 31, 2005, consolidated “Profit employed in thebusiness” in Statement 2 included $202 million representingundistributed profit of the unconsolidated affiliated companies.
Certain investments in unconsolidated affiliated companiesare accounted for using the cost method. During first quarter 2001,Cat Financial invested for a limited partnership interest in a venturefinancing structure associated with Caterpillar’s rental strategy in theUnited Kingdom. In the fourth quarter 2004, we sold our investmentin this limited partnership. This sale had no impact on earnings.
12. Intangible assets and goodwill
A. Intangible assetsIntangible assets are comprised of the following:
WeightedAmortizable
Life December 31,(Millions of dollars) (Years) 2005 2004 2003_____ _____ _____ _____Intellectual property . . . . . . . . . . . . . . . . . . . 10 $ 206 $ 213 $ 126Other. . . . . . . . . . . . . . . . . . . . . . . . . . . . . . . . . 16 73 73 0_____ _____ _____Total finite-lived intangible
assets — gross . . . . . . . . . . . . . . . . . . . . . 279 286 126Less: Accumulated amortization . . . . . . . . 107 91 44_____ _____ _____
172 195 82Pension-related . . . . . . . . . . . . . . . . . . . . . . . 252 120 157_____ _____ _____Intangible assets — net . . . . . . . . . . . . . . . $ 424 $ 315 $ 239______ _____ ___________ _____ _____
During 2004 we acquired finite lived intangible assets of $130 mil-lion. (See Note 26 for details on the acquisition of these assets.)Amortization expense related to intangible assets was $22 million,$18 million and $15 million for 2005, 2004 and 2003, respectively.
Amortization expense related to intangible assets is expectedto be:
(Millions of dollars)2006 2007 2008 2009 2010 Thereafter_____________________________________________________$21 $18 $16 $16 $18 $83
B. GoodwillDuring 2004 we acquired assets with related goodwill of $55 mil-lion. (See Note 26 for details on the acquisition of these assets.)No goodwill was acquired during the years ended December 31,
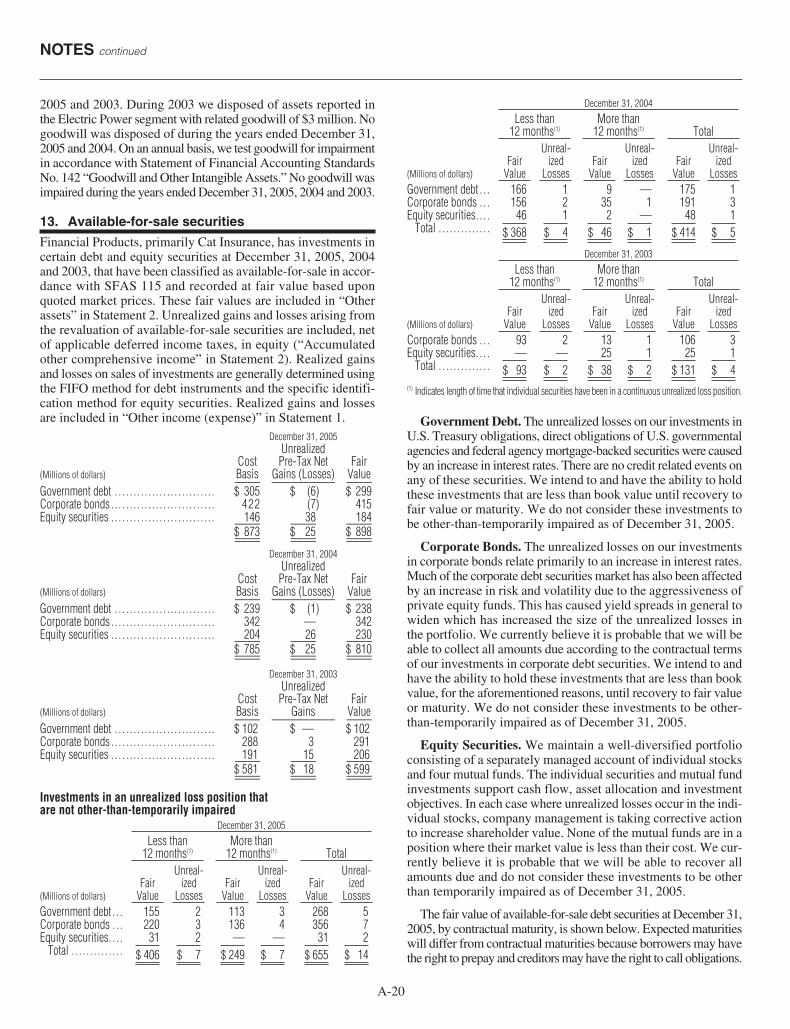
NOTES continued
A-20
2005 and 2003. During 2003 we disposed of assets reported inthe Electric Power segment with related goodwill of $3 million. Nogoodwill was disposed of during the years ended December 31,2005 and 2004. On an annual basis, we test goodwill for impairmentin accordance with Statement of Financial Accounting StandardsNo. 142 “Goodwill and Other Intangible Assets.” No goodwill wasimpaired during the years ended December 31, 2005, 2004 and 2003.
13. Available-for-sale securities
Financial Products, primarily Cat Insurance, has investments incertain debt and equity securities at December 31, 2005, 2004and 2003, that have been classified as available-for-sale in accor-dance with SFAS 115 and recorded at fair value based uponquoted market prices. These fair values are included in “Otherassets” in Statement 2. Unrealized gains and losses arising fromthe revaluation of available-for-sale securities are included, netof applicable deferred income taxes, in equity (“Accumulatedother comprehensive income” in Statement 2). Realized gainsand losses on sales of investments are generally determined usingthe FIFO method for debt instruments and the specific identifi-cation method for equity securities. Realized gains and lossesare included in “Other income (expense)” in Statement 1.
December 31, 2005Unrealized
Cost Pre-Tax Net Fair(Millions of dollars) Basis Gains (Losses) Value____ __________ ____Government debt . . . . . . . . . . . . . . . . . . . . . . . . . . . $ 305 $ (6) $ 299Corporate bonds . . . . . . . . . . . . . . . . . . . . . . . . . . . . 422 (7) 415 Equity securities . . . . . . . . . . . . . . . . . . . . . . . . . . . . 146 38 184____ ____ ____
$ 873 $ 25 $ 898____ ____ ________ ____ ____December 31, 2004
UnrealizedCost Pre-Tax Net Fair
(Millions of dollars) Basis Gains (Losses) Value____ __________ ____Government debt . . . . . . . . . . . . . . . . . . . . . . . . . . . $ 239 $ (1) $ 238Corporate bonds . . . . . . . . . . . . . . . . . . . . . . . . . . . . 342 — 342Equity securities . . . . . . . . . . . . . . . . . . . . . . . . . . . . 204 26 230____ ____ ____
$ 785 $ 25 $ 810____ ____ ________ ____ ____
December 31, 2003Unrealized
Cost Pre-Tax Net Fair(Millions of dollars) Basis Gains Value____ __________ ____Government debt . . . . . . . . . . . . . . . . . . . . . . . . . . . $ 102 $ — $ 102Corporate bonds . . . . . . . . . . . . . . . . . . . . . . . . . . . . 288 3 291Equity securities . . . . . . . . . . . . . . . . . . . . . . . . . . . . 191 15 206____ ____ ____
$ 581 $ 18 $ 599____ ____ ________ ____ ____
Investments in an unrealized loss position thatare not other-than-temporarily impaired
(Millions of dollars)
Government debt . . .Corporate bonds . . .Equity securities. . . .
Total . . . . . . . . . . . . . .
(Millions of dollars)
Government debt . . .Corporate bonds . . .Equity securities. . . .
Total . . . . . . . . . . . . . .
(Millions of dollars)
Corporate bonds . . .Equity securities. . . .
Total . . . . . . . . . . . . . .
(1) Indicates length of time that individual securities have been in a continuous unrealized loss position.
Government Debt. The unrealized losses on our investments inU.S. Treasury obligations, direct obligations of U.S. governmentalagencies and federal agency mortgage-backed securities were causedby an increase in interest rates. There are no credit related events onany of these securities. We intend to and have the ability to holdthese investments that are less than book value until recovery tofair value or maturity. We do not consider these investments tobe other-than-temporarily impaired as of December 31, 2005.
Corporate Bonds. The unrealized losses on our investmentsin corporate bonds relate primarily to an increase in interest rates.Much of the corporate debt securities market has also been affectedby an increase in risk and volatility due to the aggressiveness ofprivate equity funds. This has caused yield spreads in general towiden which has increased the size of the unrealized losses inthe portfolio. We currently believe it is probable that we will beable to collect all amounts due according to the contractual termsof our investments in corporate debt securities. We intend to andhave the ability to hold these investments that are less than bookvalue, for the aforementioned reasons, until recovery to fair valueor maturity. We do not consider these investments to be other-than-temporarily impaired as of December 31, 2005.
Equity Securities. We maintain a well-diversified portfolioconsisting of a separately managed account of individual stocksand four mutual funds. The individual securities and mutual fundinvestments support cash flow, asset allocation and investmentobjectives. In each case where unrealized losses occur in the indi-vidual stocks, company management is taking corrective actionto increase shareholder value. None of the mutual funds are in aposition where their market value is less than their cost. We cur-rently believe it is probable that we will be able to recover allamounts due and do not consider these investments to be otherthan temporarily impaired as of December 31, 2005.
The fair value of available-for-sale debt securities at December 31,2005, by contractual maturity, is shown below. Expected maturitieswill differ from contractual maturities because borrowers may havethe right to prepay and creditors may have the right to call obligations.
$ 4$ 131$ 2$ 38$ 2$ 93125125——3106113293
Unreal-ized
LossesFair
Value
Unreal-ized
LossesFair
Value
Unreal-ized
LossesFair
Value
TotalMore than
12 months(1)Less than
12 months(1)
December 31, 2003
$ 5$ 414$ 1$ 46$ 4$ 368148—2146319113521561175—91166
Unreal-ized
LossesFair
Value
Unreal-ized
LossesFair
Value
Unreal-ized
LossesFair
Value
TotalMore than
12 months(1)Less than
12 months(1)
December 31, 2004
$ 14$ 655$ 7$ 249$ 7$ 406231——231735641363220526831132155
Unreal-ized
LossesFair
Value
Unreal-ized
LossesFair
Value
Unreal-ized
LossesFair
Value
TotalMore than
12 months(1)Less than
12 months(1)
December 31, 2005

Caterpillar Inc.
A-21
A. Benefit obligations_______________________________________________________________________________________________________________U.S. Pension Benefits Non-U.S. Pension Benefits Other Postretirement Benefits________________________ ________________________ ________________________
(Millions of dollars) 2005 2004 2003 2005 2004 2003 2005 2004 2003______ ______ ______ ______ ______ ______ ______ ______ ______Change in benefit obligation:
Benefit obligation, beginning of year . . . . . . . . . . $ 9,593 $ 8,993 $ 7,844 $ 2,097 $ 1,836 $ 1,517 $ 4,926 $ 5,004 $ 4,465Service cost . . . . . . . . . . . . . . . . . . . . . . . . . . . . . . . . . . . . . 150 143 122 58 53 43 86 66 70Interest cost . . . . . . . . . . . . . . . . . . . . . . . . . . . . . . . . . . . . . 555 548 554 109 97 83 294 265 298Plan amendments . . . . . . . . . . . . . . . . . . . . . . . . . . . . . . . 204 — (27) (8) — — 412 — (6)Actuarial losses (gains). . . . . . . . . . . . . . . . . . . . . . . . . 863 584 1,148 254 54 118 458 (64) 474Foreign currency exchange rates. . . . . . . . . . . . . . . — — — (65) 135 137 (2) 2 4Participant contributions . . . . . . . . . . . . . . . . . . . . . . . — — — 12 11 10 28 58 25Benefits paid . . . . . . . . . . . . . . . . . . . . . . . . . . . . . . . . . . . . (686) (675) (648) (96) (89) (72) (384) (405) (326)______ ______ ______ ______ ______ ______ ______ ______ ______Benefit obligation, end of year . . . . . . . . . . . . . . . . . $10,679 $ 9,593 $ 8,993 $ 2,361 $ 2,097 $ 1,836 $ 5,818 $ 4,926 $ 5,004______ ______ ______ ______ ______ ______ ______ ______ ____________ ______ ______ ______ ______ ______ ______ ______ ______Accumulated benefit obligation, end of year . . . $10,213 $ 9,040 $ 8,379 $ 2,069 $ 1,844 $ 1,660______ ______ ______ ______ ______ ____________ ______ ______ ______ ______ ______
Weighted-average assumptions used todetermine benefit obligations, end of year:
Discount rate(1) . . . . . . . . . . . . . . . . . . . . . . . . . . . . . . . . . . 5.6% 5.9% 6.2% 4.6% 5.2% 5.1% 5.6% 5.9% 6.1%Rate of compensation increase(1) . . . . . . . . . . . . . . . 4.0% 4.0% 4.0% 3.7% 3.5% 3.2% 4.0% 4.0% 4.0%
(1) End of year rates are used to determine net periodic cost for the subsequent year. See Note 14E.
_______________________________________________________________________________________________________________
Assumed health care cost trend rates have a significant effect on the amounts reported for the health care plans. A one-percentage-point change in assumed health care cost trend rates would have the following effects:
One-percentage- One-percentage-(Millions of dollars) point increase point decrease___________ ___________Effect on 2005 service and interest cost components of other postretirement benefit cost . . . . . . . . . . . . . . . . . . . . . . . . . . . . . . . . . . . . . . . . . . . . . . $ 34 $ (29)Effect on accumulated postretirement benefit obligation . . . . . . . . . . . . . . . . . . . . . . . . . . . . . . . . . . . . . . . . . . . . . . . . . . . . . . . . . . . . . . . . . . . . . . . . . . . . . . . . . . $432 $(376)
.
Fair(Millions of dollars) Value____Due in one year or less . . . . . . . . . . . . . . . . . . . . . . . . . . . . . . . . . . . . . . . . . . . . . . . . . . . . . $ 43Due after one year through five years. . . . . . . . . . . . . . . . . . . . . . . . . . . . . . . . . . . . . . $308Due after five years through ten years . . . . . . . . . . . . . . . . . . . . . . . . . . . . . . . . . . . . . $ 92Due after ten years . . . . . . . . . . . . . . . . . . . . . . . . . . . . . . . . . . . . . . . . . . . . . . . . . . . . . . . . . . $271
Proceeds from sales of investments in debt and equity securitiesduring 2005, 2004 and 2003 were $257 million, $408 millionand $329 million, respectively. Gross gains of $14 million, $8 mil-lion and $3 million and gross losses of $6 million, $6 millionand $2 million have been included in current earnings as a resultof these sales for 2005, 2004 and 2003, respectively.
During 2003, we recognized pretax charges in accordance withthe application of SFAS 115 for “other than temporary” declinesin the market value of securities in the Cat Insurance and CaterpillarInvestment Management Ltd. investment portfolios of $33 mil-lion. During 2005 and 2004, there were no charges for “otherthan temporary” declines in the market value of securities.
14. Postemployment benefit plans
We have both U.S. and non-U.S. pension plans covering sub-stantially all of our U.S. employees and a portion of our non-U.S. employees, primarily in our European facilities. Our definedbenefit plans provide a benefit based on years of service and/orthe employee’s average earnings near retirement. Our definedcontribution plans allow employees to contribute a portion of
their salary to help save for retirement, and in certain cases, weprovide a matching contribution. We also have defined-benefitretirement health care and life insurance plans covering sub-stantially all of our U.S. employees.
In January 2005, amendments were made to both U.S. hourlypension and other postretirement benefit plans due to the companyand the United Auto Workers reaching a new six-year laboragreement that will expire on March 1, 2011. These plans werere-measured as of January 10, 2005 to account for the benefitchanges. The result was a $29 million increase in pension cost,and a $69 million increase in other postretirement benefit cost for2005. In addition, the Additional Minimum Pension Liabilityincreased $233 million as a result of the re-measurement. Theliability was offset by an increase in pension-related intangibleassets of $164 million and a decrease in other comprehensiveincome (pre-tax) of $69 million.
In April 2005, amendments were made to our U.S. salariedand management other postretirement benefit plan. The plan wasre-measured, resulting in a reduction of $18 million in other post-retirement benefit cost for 2005.
We use a November 30th measurement date for our U.S. pen-sion and other postretirement benefit plans and a September 30thmeasurement date for our non-U.S. pension plans. Year-end assetand obligation amounts are disclosed as of the plan measure-ment dates.

NOTES continued
A-22
B. Plan assets_______________________________________________________________________________________________________________U.S. Pension Benefits Non-U.S. Pension Benefits Other Postretirement Benefits________________________ ________________________ ________________________
(Millions of dollars) 2005 2004 2003 2005 2004 2003 2005 2004 2003______ ______ ______ ______ ______ ______ ______ ______ ______Change in plan assets:
Fair value of plan assets, beginning of year. . . . $ 8,725 $ 7,728 $ 6,443 $ 1,503 $ 1,262 $ 1,024 $ 994 $ 867 $ 849Actual return on plan assets. . . . . . . . . . . . . . . . . . . . 860 1,106 1,290 272 124 120 100 118 140Foreign currency exchange rates. . . . . . . . . . . . . . . — — — (47) 91 96 — — —Company contributions. . . . . . . . . . . . . . . . . . . . . . . . . 542 566 643 390 104 84 573 356 179Participant contributions . . . . . . . . . . . . . . . . . . . . . . . — — — 12 11 10 28 58 25Benefits paid . . . . . . . . . . . . . . . . . . . . . . . . . . . . . . . . . . . . (686) (675) (648) (96) (89) (72) (384) (405) (326)Settlements . . . . . . . . . . . . . . . . . . . . . . . . . . . . . . . . . . . . . . — — — (10) — — — — —______ ______ ______ ______ ______ ______ ______ ______ ______Fair value of plan assets, end of year . . . . . . . . . . $ 9,441 $ 8,725 $ 7,728 $ 2,024 $ 1,503 $ 1,262 $ 1,311 $ 994 $ 867______ ______ ______ ______ ______ ______ ______ ______ ____________ ______ ______ ______ ______ ______ ______ ______ ______
_______________________________________________________________________________________________________________
The asset allocation for our pension and other postretirement benefit plans at the end of 2005, 2004 and 2003, and the target alloca-tion for 2006, by asset category, are as follows:
Target Percentage of Plan Assets Allocation at Year End_______ ___________________________
2006 2005 2004 2003_______ _______ _______ _______U.S. pension:
Equity securities. . . . . . . . . . . . . . . . . . . . . . . . . . . . . . . . . . . . . . . . . . . . . . . . . . . . . . . . . . . . . . . . . . . . . . . . . . . . . . . . . . . . . . . . . . . . . . . . . 70% 72% 74% 75%Debt securities . . . . . . . . . . . . . . . . . . . . . . . . . . . . . . . . . . . . . . . . . . . . . . . . . . . . . . . . . . . . . . . . . . . . . . . . . . . . . . . . . . . . . . . . . . . . . . . . . . 30% 28% 26% 25%_______ _______ _______ _______Total. . . . . . . . . . . . . . . . . . . . . . . . . . . . . . . . . . . . . . . . . . . . . . . . . . . . . . . . . . . . . . . . . . . . . . . . . . . . . . . . . . . . . . . . . . . . . . . . . . . . . . . . . . . . . . 100% 100% 100% 100%_______ _______ _______ ______________ _______ _______ _______
Non-U.S. pension:Equity securities. . . . . . . . . . . . . . . . . . . . . . . . . . . . . . . . . . . . . . . . . . . . . . . . . . . . . . . . . . . . . . . . . . . . . . . . . . . . . . . . . . . . . . . . . . . . . . . . . 64% 63% 54% 56%Debt securities . . . . . . . . . . . . . . . . . . . . . . . . . . . . . . . . . . . . . . . . . . . . . . . . . . . . . . . . . . . . . . . . . . . . . . . . . . . . . . . . . . . . . . . . . . . . . . . . . . 29% 30% 38% 39%Real estate . . . . . . . . . . . . . . . . . . . . . . . . . . . . . . . . . . . . . . . . . . . . . . . . . . . . . . . . . . . . . . . . . . . . . . . . . . . . . . . . . . . . . . . . . . . . . . . . . . . . . . . 6% 5% 6% 4%Other . . . . . . . . . . . . . . . . . . . . . . . . . . . . . . . . . . . . . . . . . . . . . . . . . . . . . . . . . . . . . . . . . . . . . . . . . . . . . . . . . . . . . . . . . . . . . . . . . . . . . . . . . . . . . 1% 2% 2% 1%_______ _______ _______ _______Total. . . . . . . . . . . . . . . . . . . . . . . . . . . . . . . . . . . . . . . . . . . . . . . . . . . . . . . . . . . . . . . . . . . . . . . . . . . . . . . . . . . . . . . . . . . . . . . . . . . . . . . . . . . . . . 100% 100% 100% 100%_______ _______ _______ ______________ _______ _______ _______
Other postretirement benefits:Equity securities. . . . . . . . . . . . . . . . . . . . . . . . . . . . . . . . . . . . . . . . . . . . . . . . . . . . . . . . . . . . . . . . . . . . . . . . . . . . . . . . . . . . . . . . . . . . . . . . . 80% 84% 84% 84%Debt securities . . . . . . . . . . . . . . . . . . . . . . . . . . . . . . . . . . . . . . . . . . . . . . . . . . . . . . . . . . . . . . . . . . . . . . . . . . . . . . . . . . . . . . . . . . . . . . . . . . 20% 16% 16% 16%_______ _______ _______ _______Total. . . . . . . . . . . . . . . . . . . . . . . . . . . . . . . . . . . . . . . . . . . . . . . . . . . . . . . . . . . . . . . . . . . . . . . . . . . . . . . . . . . . . . . . . . . . . . . . . . . . . . . . . . . . . . 100% 100% 100% 100%_______ _______ _______ ______________ _______ _______ _______
_______________________________________________________________________________________________________________
Our target asset allocations reflect our investment strategy of maximizing the long-term rate of return on plan assets and the resultingfunded status, within an appropriate level of risk. The U.S. plans are rebalanced to plus or minus five percentage points of the targetasset allocation ranges on a monthly basis. The frequency of rebalancing for the non-U.S. plans varies depending on the plan.
Equity securities within plan assets include Caterpillar Inc. common stock in the amounts of:U.S. Pension Benefits(1) Non-U.S. Pension Benefits Other Postretirement Benefits________________________ ________________________ ________________________
(Millions of dollars) 2005 2004 2003 2005 2004 2003 2005 2004 2003______ ______ ______ ______ ______ ______ ______ ______ ______Caterpillar Inc. common stock . . . . . . . . . . . . . . . . . . . $ 371 $ 299 $ 245 $ 2 $ — $ — $ 5 $ 1 $ 2______ ______ ______ ______ ______ ______ ______ ______ ____________ ______ ______ ______ ______ ______ ______ ______ ______(1) Amounts represent 4% of total plan assets for 2005 and 3% for 2004 and 2003.

C. Funded statusThe funded status of the plans, reconciled to the amount reported on the Consolidated Financial Position, is as follows:_______________________________________________________________________________________________________________(Millions of dollars) U.S. Pension Benefits Non-U.S. Pension Benefits Other Postretirement Benefits________________________ ________________________ ________________________End of Year 2005 2004 2003 2005 2004 2003 2005 2004 2003______ ______ ______ ______ ______ ______ ______ ______ ______Fair value of plan assets . . . . . . . . . . . . . . . . . . . . . . . . . . $ 9,441 $ 8,725 $ 7,728 $ 2,024 $ 1,503 $ 1,262 $ 1,311 $ 994 $ 867Benefit obligations . . . . . . . . . . . . . . . . . . . . . . . . . . . . . . . . 10,679 9,593 8,993 2,361 2,097 1,836 5,818 4,926 5,004Over (under) funded status . . . . . . . . . . . . . . . . . . . . . . . (1,238) (868) (1,265) (337) (594) (574) (4,507) (3,932) (4,137)Amounts not yet recognized:
Unrecognized prior service cost (benefit) . . . . . 303 158 202 22 27 31 208 (232) (280)Unrecognized net actuarial loss . . . . . . . . . . . . . . . . 3,070 2,552 2,518 746 726 677 1,595 1,232 1,364Unrecognized net obligation existing
at adoption of SFAS 87/106. . . . . . . . . . . . . . . . . . — — — 2 3 6 14 16 17Contributions made after measurement date. . . 1 — 1 1 22 14 28 27 57______ ______ ______ ______ ______ ______ ______ ______ ______
Net amount recognized in financial position . . . . $ 2,136 $ 1,842 $ 1,456 $ 434 $ 184 $ 154 $(2,662) $ (2,889) $ (2,979)______ ______ ______ ______ ______ ______ ______ ______ ______
Components of net amount recognizedin financial position:Prepaid benefit costs. . . . . . . . . . . . . . . . . . . . . . . . . . . . . . $ 1,487 $ 1,099 $ 1,136 $ 466 $ 28 $ 61 $ — $ — $ —Accrued benefit liabilities. . . . . . . . . . . . . . . . . . . . . . . . . (71) (97) (548) (59) (173) (127) (599) (402) (341)Intangible assets . . . . . . . . . . . . . . . . . . . . . . . . . . . . . . . . . . 237 95 127 16 25 30 — — —Liability for postemployment benefits. . . . . . . . . . . . (760) (248) (136) (92) (181) (327) (2,063) (2,487) (2,638)Accumulated other
comprehensive income (pretax). . . . . . . . . . . . . . . . 1,243 993 877 103 485 517 — — —______ ______ ______ ______ ______ ______ ______ ______ ______Net asset (liability) recognized . . . . . . . . . . . . . . . . . . . $ 2,136 $ 1,842 $ 1,456 $ 434 $ 184 $ 154 $(2,662) $ (2,889) $ (2,979)______ ______ ______ ______ ______ ______ ______ ______ ____________ ______ ______ ______ ______ ______ ______ ______ _____________________________________________________________________________________________________________________
The following amounts relate to our pension plans with projected benefit obligations in excess of plan assets:U.S. Pension Benefits Non-U.S. Pension Benefits___________________________ ___________________________
at Year-end at Year-end___________________________ ___________________________(Millions of dollars) 2005 2004 2003 2005 2004 2003_______ _______ _______ _______ _______ _______Projected benefit obligation . . . . . . . . . . . . . . . . . . . . . . . . . . . . . . . . . . . . . . . . . . . . . . . . . . . . $ (10,679) $ (9,593) $ (8,993) $ (2,319) $ (2,059) $ (1,800)Accumulated benefit obligation . . . . . . . . . . . . . . . . . . . . . . . . . . . . . . . . . . . . . . . . . . . . . . . . $ (10,213) $ (9,040) $ (8,379) $ (2,034) $ (1,813) $ (1,633)Fair value of plan assets . . . . . . . . . . . . . . . . . . . . . . . . . . . . . . . . . . . . . . . . . . . . . . . . . . . . . . . . $ 9,441 $ 8,725 $ 7,728 $ 1,973 $ 1,455 $ 1,216_______________________________________________________________________________________________________________
The following amounts relate to our pension plans with accumulated benefit obligations in excess of plan assets:U.S. Pension Benefits Non-U.S. Pension Benefits___________________________ ___________________________
at Year-end at Year-end___________________________ ___________________________(Millions of dollars) 2005 2004 2003 2005 2004 2003_______ _______ _______ _______ _______ _______Projected benefit obligation . . . . . . . . . . . . . . . . . . . . . . . . . . . . . . . . . . . . . . . . . . . . . . . . . . . . $ (4,594) $ (3,975) $ (3,785) $ (556) $ (2,003) $ (1,761)Accumulated benefit obligation . . . . . . . . . . . . . . . . . . . . . . . . . . . . . . . . . . . . . . . . . . . . . . . . $ (4,564) $ (3,959) $ (3,751) $ (506) $ (1,767) $ (1,601)Fair value of plan assets . . . . . . . . . . . . . . . . . . . . . . . . . . . . . . . . . . . . . . . . . . . . . . . . . . . . . . . . $ 3,733 $ 3,614 $ 3,083 $ 382 $ 1,406 $ 1,181_______________________________________________________________________________________________________________
The accumulated postretirement benefit obligation exceeds plan assets for all of our other postretirement benefit plans.
Caterpillar Inc.
A-23

NOTES continued
A-24
D. Expected cash flowInformation about the expected cash flow for the pension and other postretirement benefit plans follows:_______________________________________________________________________________________________________________
U.S. Pension Non-U.S. Pension Other Postretirement(Millions of dollars) Benefits Benefits Benefits_________________ _________________ _________________Employer contributions:
2006 (expected). . . . . . . . . . . . . . . . . . . . . . . . . . . . . . . . . . . . . . . . . . . . . . . . . . . . . . . . . . . . . . . $ 10 $ 30 $ 550Expected benefit payments:
2006 . . . . . . . . . . . . . . . . . . . . . . . . . . . . . . . . . . . . . . . . . . . . . . . . . . . . . . . . . . . . . . . . . . . . . . . . . . . 700 70 3502007 . . . . . . . . . . . . . . . . . . . . . . . . . . . . . . . . . . . . . . . . . . . . . . . . . . . . . . . . . . . . . . . . . . . . . . . . . . . 710 70 3702008 . . . . . . . . . . . . . . . . . . . . . . . . . . . . . . . . . . . . . . . . . . . . . . . . . . . . . . . . . . . . . . . . . . . . . . . . . . . 710 80 3802009 . . . . . . . . . . . . . . . . . . . . . . . . . . . . . . . . . . . . . . . . . . . . . . . . . . . . . . . . . . . . . . . . . . . . . . . . . . . 720 80 3902010 . . . . . . . . . . . . . . . . . . . . . . . . . . . . . . . . . . . . . . . . . . . . . . . . . . . . . . . . . . . . . . . . . . . . . . . . . . . 730 90 4002011-2015 . . . . . . . . . . . . . . . . . . . . . . . . . . . . . . . . . . . . . . . . . . . . . . . . . . . . . . . . . . . . . . . . . . . . 3,700 490 2,120______ ______ ______Total . . . . . . . . . . . . . . . . . . . . . . . . . . . . . . . . . . . . . . . . . . . . . . . . . . . . . . . . . . . . . . . . . . . . . . . . . . . $ 7,270 $ 880 $ 4,010______ ______ ____________ ______ ______The above table reflects the total benefits expected to be paid from the plan or from company assets and does not include the partici-
pants’ share of the cost. The expected benefit payments for our other postretirement benefits include payments for prescription drugbenefits. Expected Medicare Part D subsidy amounts expected to be received by the company which will offset other postretirementbenefit payments are as follows:
2011-(Millions of dollars) 2006 2007 2008 2009 2010 2015 Total______ ______ ______ ______ ______ ______ ______
Other postretirement benefits . . . . . . . . . . . . . . . . . . . . . . . . . . . . . . . . . . . . . . . . . . . . . . . . $ 20 $ 20 $ 20 $ 30 $ 30 $ 170 $ 290
E. Net periodic cost_______________________________________________________________________________________________________________U.S. Pension Benefits Non-U.S. Pension Benefits Other Postretirement Benefits________________________ ________________________ ________________________
(Millions of dollars) 2005 2004 2003 2005 2004 2003 2005 2004 2003______ ______ ______ ______ ______ ______ ______ ______ ______Components of net periodic benefit cost:
Service cost . . . . . . . . . . . . . . . . . . . . . . . . . . . . . . . . . . . $ 150 $ 143 $ 122 $ 58 $ 53 $ 43 $ 86 $ 66 $ 70Interest cost . . . . . . . . . . . . . . . . . . . . . . . . . . . . . . . . . . . 555 548 554 109 97 83 294 265 298Expected return on plan assets. . . . . . . . . . . . . . . (712) (697) (680) (111) (103) (94) (91) (74) (88)Settlement loss. . . . . . . . . . . . . . . . . . . . . . . . . . . . . . . . — — — 3 — — — — —Amortization of:
Net asset existing at adoptionof SFAS 87/106. . . . . . . . . . . . . . . . . . . . . . . . . . . — — — 1 3 3 2 2 —
Prior service cost(1) . . . . . . . . . . . . . . . . . . . . . . . . . 59 44 49 7 6 5 (29) (48) (47)Net actuarial loss . . . . . . . . . . . . . . . . . . . . . . . . . . . 197 142 27 50 38 14 85 45 36______ ______ ______ ______ ______ ______ ______ ______ ______
Total cost included in operating profit . . . . . . . $ 249 $ 180 $ 72 $ 117 $ 94 $ 54 $ 347 $ 256 $ 269______ ______ ______ ______ ______ ______ ______ ______ ____________ ______ ______ ______ ______ ______ ______ ______ ______Weighted-average assumptionsused to determine net cost:
Discount rate(2) . . . . . . . . . . . . . . . . . . . . . . . . . . . . . . . . 5.9% 6.2% 7.0% 5.2% 5.1% 5.4% 5.8% 6.1% 7.0%Expected return on plan assets(3) . . . . . . . . 9.0% 9.0% 9.0% 7.1% 7.4% 7.1% 9.0% 9.0% 9.0%Rate of compensation increase. . . . . . . . . . . . . . . 4.0% 4.0% 4.0% 3.5% 3.2% 3.3% 4.0% 4.0% 4.0%
(1) Prior service costs for both pension and other postretirement benefits are generally amortized using the straight-line method over the average remaining service period to the full retirement eligibility date ofemployees expected to receive benefits from the plan amendment. For other postretirement benefit plans in which all or almost all of the plan’s participants are fully eligible for benefits under the plan, priorservice costs are amortized using the straight-line method over the remaining life expectancy of those participants.
(2) For U.S. plans impacted by the January 2005 plan amendments, a 5.8% discount rate was utilized for valuing the plan re-measurement. For the April 2005 other postretirement benefit plan amendment, a 5.7%discount rate was utilized for valuing the plan re-measurement.
(3) The weighted-average rates for 2006 are 9.0% and 7.5% for U.S. and non-U.S. plans, respectively._______________________________________________________________________________________________________________
The assumed discount rate is used to discount future benefitobligations back to today’s dollars. The U.S. discount rate isbased on the Moody’s Aa bond yield as of our measurement date,November 30, and represents the rate at which our benefit obli-gations could effectively be settled. To validate the discount rate,a detailed analysis of the individual plans’ expected cash flowsis made annually. This involves analyzing Caterpillar’s projectedcash flows against a high quality bond yield curve, calculated
using a wide population of corporate Aa bonds. The modeleddiscount rate that results from matching the aggregate expectedfuture cash flows from the Caterpillar benefit plans to the yieldcurve of high quality corporate bonds is consistent with the annu-alized Moody’s Aa rate. A similar process is used to determinethe assumed discount rate for our non-U.S. plans. This rate issensitive to changes in interest rates. A decrease in the discountrate would increase our obligation and future expense.

Our U.S. expected long-term rate of return on plan assets isbased on our estimate of long-term passive returns for equitiesand fixed income securities weighted by the allocation of ourpension assets. Based on historical performance, we increase thepassive returns due to our active management of the plan assets.To arrive at our expected long-term return, the amount addedfor active management was 1% for 2005, 2004 and 2003. A sim-ilar process is used to determine this rate for our non-U.S. plans.
The assumed health care trend rate represents the rate at whichhealth care costs are assumed to increase. To calculate the 2005benefit expense, we assumed an increase of 8.4% for 2005. Thisrate was assumed to decrease gradually to the ultimate healthcare trend rate of 5.0% in 2012. This rate represents 3.0% gen-eral inflation plus 2.0% additional health care inflation. Based onour recent expenses and our forecast of changes, we expect anincrease of 8.5% during 2006 with a gradual decrease to the ulti-mate health care trend rate of 5.0% in 2013. The revised ultimaterate also represents 3.0% general inflation plus 2.0% additionalhealth care inflation.
Our U.S. postretirement health care plans provide for prescrip-tion drug benefits. On December 8, 2003, the Medicare Prescrip-tion Drug, Improvement and Modernization Act of 2003 (theAct) was signed into law. The Act introduces a prescription drugbenefit under Medicare (Medicare part D) as well as a federalsubsidy to sponsors of retiree health care benefit plans that pro-vide a benefit that is at least actuarially equivalent to Medicarepart D. In January 2004, the FASB issued FASB Staff PositionNo. 106-1 (FSP 106-1), “Accounting and Disclosure Require-ments Related to the Medicare Prescription Drug, Improvementand Modernization Act of 2003.” As permitted by FSP 106-1,we made a one-time election to defer accounting for the effectsof the Act pending further guidance from the FASB.
In May 2004, the FASB issued FASB Staff Position No. 106-2(FSP 106-2), which superseded FSP 106-1. FSP 106-2 providesaccounting guidance to employers that have determined that pre-scription drug benefits available under their retiree health carebenefit plans are at least actuarially equivalent to Medicare Part D.The FSP requires that the benefit attributable to past service beaccounted for as an actuarial gain and the benefit related to cur-rent service be reported as a reduction in service cost.
We determined that most of our U.S. retiree health care plansare at least actuarially equivalent to Medicare Part D and willqualify for the federal subsidy. In the third quarter of 2004, weadopted FSP 106-2 retroactive to December 31, 2003 (the periodend that includes the date of the Act’s enactment) as permittedby the FSP. The impact was a reduction in our accumulatedpostretirement benefit obligation of $284 million related to ben-efits attributed to past service. The reduction in the componentsof 2005 and 2004 net periodic postretirement benefits expensewas as follows:(Millions of dollars) 2005 2004______ _____Service cost . . . . . . . . . . . . . . . . . . . . . . . . . . . . . . . . . . . . . . . . . . . . . . $ 7 $ 4Interest cost . . . . . . . . . . . . . . . . . . . . . . . . . . . . . . . . . . . . . . . . . . . . . . 24 18Prior service cost. . . . . . . . . . . . . . . . . . . . . . . . . . . . . . . . . . . . . . . . . 4 —Amortization of actuarial gain . . . . . . . . . . . . . . . . . . . . . . . . . . . . . 33 29______ _____Total reduction in net periodic
postretirement benefit cost . . . . . . . . . . . . . . . . . . . . . . . . . . . . . . $ 68 $ 51______ ___________ _____
F. Other postemployment benefit plansWe offer long-term disability benefits, continued health care fordisabled employees, survivor income benefit insurance and sup-plemental unemployment benefits to substantially all eligibleU.S. employees.
G. Summary of long-term liability:December 31,
(Millions of dollars) 2005 2004 2003______ _____ _____Pensions:
U.S. pensions. . . . . . . . . . . . . . . . . . . . . . . . . . . . . . . . $ 760 $ 248 $ 136Non-U.S. pensions . . . . . . . . . . . . . . . . . . . . . . . . . . . 92 181 327______ _____ _____
Total pensions . . . . . . . . . . . . . . . . . . . . . . . . . . . . . . . . . 852 429 463Postretirement benefits other than pensions. . . . . . 2,063 2,487 2,638Other postemployment benefits . . . . . . . . . . . . . . . . . 76 70 71______ _____ _____
$2,991 $ 2,986 $3,172______ _____ ___________ _____ _____H. Defined contribution plansWe have both U.S. and non-U.S. employee defined contributionplans to help employees save for retirement. In January 2003, weintroduced a company match to our U.S. 401(k) plan. This planallows eligible employees to contribute a portion of their salaryto the plan on a tax-deferred basis, and we provide a matchingcontribution equal to 100% of employee contributions to the planup to 6% of their compensation. Various other U.S. and non-U.S.defined contribution plans allow eligible employees to contributea portion of their salary to the plans, and in some cases, we providea matching contribution to the funds.
Total company costs related to U.S. and non-U.S. defined con-tribution plans were the following:(Millions of dollars) 2005 2004 2003______ _____ _____U.S. plans . . . . . . . . . . . . . . . . . . . . . . . . . . . . . . . . . . . . . $ 135 $ 110 $ 106Non-U.S. plans . . . . . . . . . . . . . . . . . . . . . . . . . . . . . . . . 18 11 11______ _____ _____
$ 153 $ 121 $ 117______ _____ ___________ _____ _____
15. Short-term borrowingsDecember 31,
(Millions of dollars) 2005 2004 2003______ _____ _____Machinery and Engines:
Notes payable to banks . . . . . . . . . . . . . . . . . . . . . . . $ 543 $ 93 $ 72Commercial paper. . . . . . . . . . . . . . . . . . . . . . . . . . . . 328 — —_____ _____ _____
871 93 72Financial Products:
Notes payable to banks . . . . . . . . . . . . . . . . . . . . . . . 257 370 183Commercial paper. . . . . . . . . . . . . . . . . . . . . . . . . . . . 3,936 2,972 2,087Collateralized trust obligation . . . . . . . . . . . . . . . . . — 240 —Demand notes . . . . . . . . . . . . . . . . . . . . . . . . . . . . . . . 505 482 415_____ _____ _____
4,698 4,064 2,685_____ _____ _____Total short-term borrowings . . . . . . . . . . . . . . . . . . . . $5,569 $ 4,157 $2,757_____ _____ __________ _____ _____
See Note 6 for further discussion of the collateralized trustobligation.
The weighted average interest rates on external short-termborrowings outstanding were:
December 31,2005 2004 2003_____ _____ _____
Notes payable to banks . . . . . . . . . . . . . . . . . . . . . . . . . 5.4% 5.9% 6.5%Commercial paper . . . . . . . . . . . . . . . . . . . . . . . . . . . . . 3.4% 2.5% 2.1%Collateralized trust obligation . . . . . . . . . . . . . . . . . . . — 2.3% —Demand notes . . . . . . . . . . . . . . . . . . . . . . . . . . . . . . . . . 4.2% 2.3% 2.3%
Please refer to Note 20 on page A-28 and Table III on page A-29for fair value information on short-term borrowings.
Caterpillar Inc.
A-25

16. Long-term debtDecember 31,
(Millions of dollars) 2005 2004 2003_____ _____ _____Machinery and Engines:
Notes — 6.550% due 2011 . . . . . . . . . . . . . . . . $ 250 $ 250 $ 250Debentures — 9.000% due 2006. . . . . . . . . . . — 206 208Debentures — 7.250% due 2009. . . . . . . . . . . 310 313 315Debentures — 9.375% due 2011. . . . . . . . . . . 123 123 123Debentures — 9.375% due 2021. . . . . . . . . . . 120 236 236Debentures — 8.000% due 2023. . . . . . . . . . . 82 199 199Debentures — 6.625% due 2028. . . . . . . . . . . 299 299 299Debentures — 7.300% due 2031. . . . . . . . . . . 348 348 348Debentures — 5.300% due 2035. . . . . . . . . . . 200 — —Debentures — 6.950% due 2042. . . . . . . . . . . 249 249 249Debentures — 7.375% due 2097. . . . . . . . . . . 297 297 297Capital lease obligations . . . . . . . . . . . . . . . . . . . 66 665 611Commercial paper . . . . . . . . . . . . . . . . . . . . . . . . . — 40 45Deposit obligations . . . . . . . . . . . . . . . . . . . . . . . . 231 245 236Other. . . . . . . . . . . . . . . . . . . . . . . . . . . . . . . . . . . . . . 142 193 187______ ______ ______
Total Machinery and Engines . . . . . . . . . . . . . . . . . 2,717 3,663 3,603Financial Products:
Commercial paper . . . . . . . . . . . . . . . . . . . . . . . . . $ 299 $ 1,400 $ 1,825Medium-term notes . . . . . . . . . . . . . . . . . . . . . . . . 12,187 10,468 8,775Deposit obligations . . . . . . . . . . . . . . . . . . . . . . . . 232 232 232Other. . . . . . . . . . . . . . . . . . . . . . . . . . . . . . . . . . . . . . 242 74 111______ ______ ______
Total Financial Products . . . . . . . . . . . . . . . . . . . . . 12,960 12,174 10,943______ ______ ______Total long-term debt due after one year . . . . . . . $15,677 $ 15,837 $14,546______ ______ ____________ ______ ______
All outstanding notes and debentures are unsecured. The cap-ital lease obligations which were collateralized by leased man-ufacturing equipment and/or security deposits, were terminatedin the fourth quarter of 2005. This resulted in the fulfillment ofthe capital lease obligation and conversion of the associated secu-rity deposits into cash. The deposit obligations have correspond-ing security deposits, which are included in “Other assets” inStatement 2. These deposit obligations and corresponding secu-rity deposits relate to two finance arrangements which provideus a return. These finance arrangements require that we committo certain long-term obligations and provide security depositswhich will fulfill these obligations when they become due.
On September 13, 2005, $116 million of 9.375% debenturesdue in 2021 and $117 million of 8.00% debentures due in 2023were exchanged for $307 million of 5.30% debentures due in2035 and $23 million of cash. The book value of the 5.30%debentures due in 2035 was $200 million at December 31, 2005,which results in an effective yield of 8.55%.
We may redeem the 6.55% notes and the 5.30%, 7.25%,6.625%, 7.3%, 6.95% and 7.375% debentures in whole or in partat our option at any time at a redemption price equal to the greaterof 100% of the principal amount of the debentures to be redeemedor the sum of the present value of the remaining scheduled payments.
The terms of other notes and debentures do not specify aredemption option prior to maturity.
Based on long-term credit agreements, $299 million, $1,440 mil-lion and $1,870 million of commercial paper outstanding atDecember 31, 2005, 2004 and 2003, respectively, was classifiedas long-term debt due after one year.
Medium-term notes are offered by prospectus and are issuedthrough agents at fixed and floating rates. Financial Productsmedium-term notes have a weighted average interest rate of 4.1%with remaining maturities up to 20 years at December 31, 2005.
The aggregate amounts of maturities of long-term debt duringeach of the years 2006 through 2010, including amounts duewithin one year and classified as current, are:
December 31,(Millions of dollars) 2006 2007 2008 2009 2010_____ _____ _____ _____ _____Machinery and Engines . . . . . . . . $ 340 $ 88 $ 25 $ 550 $ 1Financial Products. . . . . . . . . . . . . 4,159 3,882 2,731 1,994 2,333_____ _____ _____ _____ _____
$ 4,499 $ 3,970 $ 2,756 $ 2,544 $ 2,334_____ _____ _____ _____ __________ _____ _____ _____ _____The above table includes $708 million of medium-term notes
that can be called at par.Interest paid on short-term and long-term borrowings for 2005,
2004 and 2003 was $1,030 million, $766 million and $718 mil-lion, respectively.
Please refer to Note 20 on page A-28 and Table III on page A-29for fair value information on long-term debt.
17. Credit commitmentsDecember 31, 2005
Machinery Financial(Millions of dollars) Consolidated and Engines Products_________ _________ _______Credit lines available:
Global credit facilities. . . . . . . . . . . . $5,750 (1) $ 600 (1) $5,150 (1)
Other external . . . . . . . . . . . . . . . . . . . . 2,177 911 1,266_____ _____ _____Total credit lines available . . . . . . . . . 7,927 1,511 6,416Less: Global credit facilities
supporting commercial paper . . . 4,563 328 4,235Less: Utilized credit . . . . . . . . . . . . . . . . 531 143 388_____ _____ _____Available credit . . . . . . . . . . . . . . . . . . . . . $2,833 $1,040 $1,793_____ _____ __________ _____ _____(1) We have three global credit facilities with a syndicate of banks totaling $5,750 million available
in the aggregate to both Machinery and Engines and Financial Products to support commercialpaper programs. Based on management’s allocation decision, which can be revised at any timeduring the year, the portion of the facility available to Cat Financial at December 31, 2005 was$5,150 million. The five-year facility of $2,500 million expires in September 2009. The five-yearfacility of $1,625 million expires in September 2010. The 364-day facility of $1,625 millionexpires in September 2006. The facility expiring in September 2006 has a provision that allowsCaterpillar or Cat Financial to obtain a one-year loan in September 2006 that would mature inSeptember 2007.As part of Cat Financial’s 2005 global credit facilities renewal,
the year-end leverage covenant (debt-to-equity ratio) has beenincreased to 8.5:1, from previous level of 8:1 which aligns it withthe 8.5:1 six-month moving average leverage covenant. AtDecember 31, 2005, there were no borrowings under these linesand Cat Financial was in compliance with all debt covenants.
18. Capital stock
A. Stock optionsIn 1996, stockholders approved the Stock Option and Long-TermIncentive Plan (the Plan) providing for the granting of options topurchase common stock to officers and other key employees, aswell as non-employee directors. The Plan reserves 144 millionshares of common stock for issuance (128 million under the Planand 16 million under prior stock option plans). Options grantedprior to 2004 vest at the rate of one-third per year over the threeyear period following the date of grant. In anticipation of delayingvesting until three years after the grant date for future grants, the2004 grant vested on December 31, 2004. In order to better alignour employee stock option program with the overall market, thenumber of options granted in 2005 (issued in February) wassignificantly reduced from the previous year. In response to thisdecrease, we elected to immediately vest the 2005 option grant.All grants continue to have a maximum term of 10 years. Common
NOTES continued
A-26

Caterpillar Inc.
A-27
shares issued under stock options, including treasury shares reis-sued, totaled 18,912,521 for 2005, 12,207,420 for 2004 and9,850,992 for 2003. We recognized income tax benefits relatedto employees’ exercise of stock options of $134 million, $80 mil-lion, and $45 million in 2005, 2004 and 2003, respectively.
The Plan grants options which have exercise prices equal to theaverage market price on the date of grant. A summary of the proforma net profit and profit per share amounts is shown in Item Mof Note 1. In 2004, we switched from using the Black-Scholesoption-pricing model to the binomial option-pricing model inorder to calculate the fair value of our options. We believe thismodel more accurately reflects the value of the options than usingthe Black-Scholes option-pricing model. Grants made prior to2004 continue to be valued using the Black-Scholes model.
Please refer to Table II below for additional financial infor-mation on our stock options.
B. Stockholders’ rights planOn June 17, 2005, Caterpillar Inc. executed a Fourth Amended andRestated version of its Stockholders’ Rights Plan with MellonInvestor Services LLC. The modified agreement called for the
final termination date of the Stockholders’ Rights Plan to bemoved up from December 11, 2006 to June 30, 2005, terminatingthe Stockholders’ Rights Plan approximately 17 months earlier thanthe original agreement and subsequent amendments had specified.
19. Profit per share
Computations of profit per share:(Dollars in millions except per share data) 2005 2004 2003_____ _____ _____Profit for the period (A) . . . . . . . . . . . . . . . . . . . . . . . . . . . . . $2,854 $ 2,035 $1,099Determination of shares (millions):
Weighted average number of common sharesoutstanding (B). . . . . . . . . . . . . . . . . . . . . . . . . . . . . . . . . . 678.4 684.5 690.4
Shares issuable on exercise of stock options,net of shares assumed to be purchased outof proceeds at average market price . . . . . . . . . . . 27.4 22.9 12.3
Average common shares outstanding for fullydiluted computation (C) . . . . . . . . . . . . . . . . . . . . . . . . 705.8 707.4 702.7
Profit per share of common stock:Assuming no dilution (A/B) . . . . . . . . . . . . . . . . . . . . . . $ 4.21 $ 2.97 $ 1.59Assuming full dilution (A/C) . . . . . . . . . . . . . . . . . . . . . $ 4.04 $ 2.88 $ 1.56
Shares outstanding as of December 31(in millions) . . . . . . . . . . . . . . . . . . . . . . . . . . . . . . . . . . . . . . . 670.9 685.9 687.5
TABLE II — Financial Information Related to Capital Stock_______________________________________________________________________________________________________________
Changes in the status of common shares subject to issuance under options:2005 2004 2003___________________ ___________________ ___________________
Weighted- Weighted- Weighted-Average Average AverageExercise Exercise Exercise
Shares Price Shares Price Shares Price_________ _______ _________ _______ _________ _______Fixed Options:
Outstanding at beginning of year . . . . . . . . . . . . . . . . . . . . . . . . . . . . . . . . . . . . . . . . . . . . 82,448,348 $ 28.80 78,999,344 $ 25.69 77,442,728 $ 24.46Granted to officers and key employees . . . . . . . . . . . . . . . . . . . . . . . . . . . . . . . . . . . . . . 12,565,872 $ 45.64 17,781,466 $ 38.63 16,836,200 $ 27.15Granted to outside directors. . . . . . . . . . . . . . . . . . . . . . . . . . . . . . . . . . . . . . . . . . . . . . . . . . 104,000 $ 44.90 104,000 $ 40.64 112,000 $ 26.03Exercised . . . . . . . . . . . . . . . . . . . . . . . . . . . . . . . . . . . . . . . . . . . . . . . . . . . . . . . . . . . . . . . . . . . . . . (20,086,770) $ 26.68 (13,651,840) $ 23.86 (15,258,040) $ 21.02Lapsed. . . . . . . . . . . . . . . . . . . . . . . . . . . . . . . . . . . . . . . . . . . . . . . . . . . . . . . . . . . . . . . . . . . . . . . . . (170,868) $ 24.31 (784,622) $ 25.60 (133,544) $ 25.09__________ ________ ________Outstanding at end of year. . . . . . . . . . . . . . . . . . . . . . . . . . . . . . . . . . . . . . . . . . . . . . . . . . . . 74,860,582 $ 32.23 82,448,348 $ 28.80 78,999,344 $ 25.69__________ ________ __________________ ________ ________Options exercisable at year-end. . . . . . . . . . . . . . . . . . . . . . . . . . . . . . . . . . . . . . . . . . . . . . 69,848,250 $ 32.58 67,241,232 $ 29.28 47,301,974 $ 25.14Weighted-average fair value of options granted during the year . . . . . . . . . . . $ 11.95 $ 9.03 $ 6.41
Stock options outstanding and exercisable:Options Outstanding Options Exercisable__________________________________________________ ________________________________Weighted-Average
Remaining# Outstanding Contractual Life Weighted-Average # Outstanding Weighted-Average
Exercise Prices at 12/31/05 (Years) Exercise Price at 12/31/05 Exercise Price_____________ _____________ _____________ _____________ _____________ _____________$16.45-$22.76 4,600,935 4.0 $19.06 4,600,935 $19.06$25.36-$31.17 41,480,829 5.8 $27.16 36,537,813 $27.16$38.63-$45.64 28,778,818 8.7 $41.65 28,709,502 $41.65_____________ _____________
74,860,582 $32.23 69,848,250 $32.58_____________ __________________________ _____________Weighted-average assumptions used in determining fair value of option grants: Grant Year________________________________________
2005(1) 2004(1) 2003(2)__________ __________ __________Dividend yield . . . . . . . . . . . . . . . . . . . . . . . . . . . . . . . . . . . . . . . . . . . . . . . . . . . . . . . . . . . . . . . . . . . . . . . . . . . . . . . . . . . . . . . . . . . . . . . . . . . . . 2.11% 1.89% 2.75%Expected volatility . . . . . . . . . . . . . . . . . . . . . . . . . . . . . . . . . . . . . . . . . . . . . . . . . . . . . . . . . . . . . . . . . . . . . . . . . . . . . . . . . . . . . . . . . . . . . . . . . 26.48% 25.98% 29.6%Risk-free interest rates . . . . . . . . . . . . . . . . . . . . . . . . . . . . . . . . . . . . . . . . . . . . . . . . . . . . . . . . . . . . . . . . . . . . . . . . . . . . . . . . . . . . . . . . . . . . 3.98% 5.13% 2.52%Expected lives . . . . . . . . . . . . . . . . . . . . . . . . . . . . . . . . . . . . . . . . . . . . . . . . . . . . . . . . . . . . . . . . . . . . . . . . . . . . . . . . . . . . . . . . . . . . . . . . . . . . . 7 years 6 years 6 years(1) Assumptions used in the binomial option-pricing model valuation.(2) Assumptions used in Black-Scholes valuation.

NOTES continued
A-28
Stock options to purchase 104,000 and 8,535,088 shares of com-mon stock at a weighted-average price of $40.64 and $31.17were outstanding at December 31, 2004 and 2003, respectively,but were not included in the computation of diluted profit pershare because the options’ exercise price was greater than theaverage market price of the common shares; no such optionswere outstanding at December 31, 2005.
On June 8, 2005, Caterpillar’s Board of Directors approved a2-for-1 stock split in the form of a 100 percent stock dividend.The stock split shares were distributed on July 13, 2005 to stock-holders of record at the close of business on June 22, 2005. Capitalaccounts, share data and profit per share data reflect the stocksplit, applied retroactively, to all periods presented.
20. Fair values of financial instruments
We used the following methods and assumptions to estimate thefair value of our financial instruments:
Cash and short-term investments — carrying amount approxi-mated fair value.
Long-term investments (other than investments in uncon-solidated affiliated companies) — fair value for available-for-sale securities was estimated based on quoted market prices. Fairvalue for security deposits approximated carrying value.
Foreign currency forward and option contracts — fair valueof forward contracts was determined by discounting the futurecash flow resulting from the differential between the contractprice and the forward rate. Fair value of option contracts was deter-mined by using the Black-Scholes model.
Finance receivables — fair value was estimated by discount-ing the future cash flow using current rates, representative ofreceivables with similar remaining maturities. Historical bad-debt experience also was considered.
Wholesale inventory receivables — fair value was estimatedby discounting the future cash flow using current rates, repre-sentative of receivables with similar remaining maturities.
Short-term borrowings — carrying amount approximatedfair value.
Long-term debt — for Machinery and Engines notes anddebentures, fair value was estimated based on quoted marketprices. For Financial Products, fair value was estimated by dis-counting the future cash flow using our current borrowing rates forsimilar types and maturities of debt, except for floating rate notesand commercial paper supported by long-term credit agreementsfor which the carrying amounts were considered a reasonableestimate of fair value. For deposit obligations carrying valueapproximated fair value.
Interest rate swaps — fair value was estimated based on theamount that we would receive or pay to terminate our agree-ments as of year-end.
Guarantees — fair value is estimated based on the premiumwe would require to issue the same guarantee in a stand alonearm’s-length transaction with an unrelated party.
Please refer to Table III on page A-29 for the fair values of ourfinancial instruments.
21. Concentration of credit risk
Financial instruments with potential credit risk consist primar-ily of trade and finance receivables and short-term and long-terminvestments. Additionally, to a lesser extent, we have a potentialcredit risk associated with counterparties to derivative contracts.
Trade receivables are primarily short-term receivables from inde-pendently owned and operated dealers and customers which arisein the normal course of business. We perform regular credit eval-uations of our dealers and customers. Collateral generally is notrequired, and the majority of our trade receivables are unsecured.We do, however, when deemed necessary, make use of variousdevices such as security agreements and letters of credit to pro-tect our interests. No single dealer or customer represents a sig-nificant concentration of credit risk.
Finance receivables and wholesale inventory receivables pri-marily represent receivables under installment sales contracts,receivables arising from leasing transactions and notes receiv-able. We generally maintain a secured interest in the equipmentfinanced. No single customer or region represents a significantconcentration of credit risk.
Short-term and long-term investments are held with high qualityinstitutions and, by policy, the amount of credit exposure to any oneinstitution is limited. Long-term investments, included in “Otherassets” in Statement 2, are comprised primarily of investments whichcollateralize deposit obligations and investments of Cat Insurancesupporting insurance reserve requirements. At December 31, 2004and 2003, long-term investments also included investmentswhich collateralized capital lease obligations (see Note 16).
For derivatives contracts, collateral is generally not requiredof the counterparties or of our company. We do not anticipatenonperformance by any of the counterparties. Our exposure tocredit loss in the event of nonperformance by the counterpartiesis limited to only those gains that we have recorded, but havenot yet received cash payment. At December 31, 2005, 2004 and2003, the exposure to credit loss was $141 million, $312 millionand $336 million, respectively.
Please refer to Note 20 above and Table III on page A-29 forfair value information.
22. Operating leases
We lease certain computer and communications equipment, trans-portation equipment and other property through operating leases.Total rental expense for operating leases was $257 million, $224 mil-lion and $198 million for 2005, 2004 and 2003, respectively.
Minimum payments for operating leases having initial or remain-ing non-cancelable terms in excess of one year are:
Years ended December 31,(Millions of dollars)
After2006 2007 2008 2009 2010 2010 Total_____________________________________________________$213 $167 $146 $113 $97 $365 $1,101
23. Guarantees and product warranty
We have guaranteed to repurchase loans of certain Caterpillardealers from third party lenders in the event of default. Theseguarantees arose in conjunction with Cat Financial’s relationshipwith third party dealers who sell Caterpillar equipment. These

Caterpillar Inc.
A-29
guarantees generally have one-year terms and are secured, pri-marily by dealer assets.
We provide loan guarantees to a third party lender for financ-ing associated with machinery purchased by customers. The loanguarantees are for the remote chance that the customers willbecome insolvent. These guarantees have an average three-yearterm and are secured by the machinery.
Cat Financial has provided a limited indemnity to a third partybank for $40 million resulting from the assignment of certainleases to that bank. The indemnity is for the remote chance thatthe insurers of these leases would become insolvent. The indem-nity expires December 15, 2012 and is unsecured.
No loss has been experienced or is anticipated under any ofthese guarantees. At December 31, 2005, 2004 and 2003, therelated book value was $9 million, $10 million and $5 million,respectively. The maximum potential amount of future payments(undiscounted and without reduction for any amounts that maypossibly be recovered under recourse or collateralized provi-sions) we could be required to make under the guarantees atDecember 31 are as follows:(Millions of dollars) 2005 2004 2003______ _____ _____Guarantees with Caterpillar Dealers . . . . . . . . . . . . . $ 434 $ 364 $ 380Guarantees with Customers. . . . . . . . . . . . . . . . . . . . . 27 29 —Limited Indemnity . . . . . . . . . . . . . . . . . . . . . . . . . . . . . . 40 45 —Guarantees — other . . . . . . . . . . . . . . . . . . . . . . . . . . . 53 17 37______ _____ _____Total guarantees . . . . . . . . . . . . . . . . . . . . . . . . . . . . . . . $ 554 $ 455 $ 417______ _____ ___________ _____ _____
We are party to agreements in the normal course of businesswith selected customers and Caterpillar dealers in which we com-mit to provide a set dollar amount of financing on a pre-approved
basis. We also provide lines of credit to selected customers andCaterpillar dealers, of which a portion remains unused as of theend of the period. Commitments and lines of credit generally havefixed expiration dates or other termination clauses. It has beenour experience that not all commitments and lines of credit willbe used. Management applies the same credit policies when mak-ing commitments and granting lines of credit as it does for anyother financing. We do not require collateral for these commit-ments/lines, but if credit is extended, collateral may be requiredupon funding. The amount of the unused commitments and linesof credit for dealers as of December 31, 2005 was $4,729 millioncompared to $5,019 million at December 31, 2004 and $4,784 mil-lion at December 31, 2003. The amount of the unused commit-ments and lines of credit for customers as of December 31, 2005was $1,972 million compared to $1,499 million at December 31,2004 and $1,336 million at December 31, 2003.
Our product warranty liability is determined by applying his-torical claim rate experience to the current field population anddealer inventory. Historical claim rates are developed using a rollingaverage of actual warranty payments. Effective in the third quar-ter of 2004, we refined our process to utilize more detailed claimrates by product. This provides more comprehensive productwarranty information for management. This change did not havea material impact on our financial statements.
(Millions of dollars) 2005 2004 2003______ _____ _____Warranty liability, January 1 . . . . . . . . . . . . . . . . . . . . $ 785 $ 624 $ 693Reduction in liability (payments) . . . . . . . . . . . . . . . . (712) (571) (503)Increase in liability (new warranties). . . . . . . . . . . . . 806 732 434______ _____ _____Warranty liability, December 31 . . . . . . . . . . . . . . . . . $ 879 $ 785 $ 624______ _____ ___________ _____ _____
TABLE III — Fair Values of Financial Instruments_______________________________________________________________________________________________________________
2005 2004 2003_________________ _________________ _________________Carrying Fair Carrying Fair Carrying Fair
(Millions of dollars) Amount Value Amount Value Amount Value Reference________ ________ ________ ________ ________ ________ _______Asset (Liability) at December 31
Cash and short-term investments . . . . . . . . . . . . . . . . . $ 1,108) $ 1,108) $ 445) $ 445) $ 342) $ 342) Statement 2Long-term investments . . . . . . . . . . . . . . . . . . . . . . . . . . . . 1,356) 1,356) 1,852) 1,852) 1,574) 1,574) Notes 13 and 21Foreign currency contracts . . . . . . . . . . . . . . . . . . . . . . . . (1) (1) 176) 176) 167) 167) Note 3Finance receivables — net
(excluding tax leases(1)) . . . . . . . . . . . . . . . . . . . . . . . . . . 15,214) 15,210) 13,457) 13,445) 11,439) 11,489) Note 8Wholesale inventory receivables — net
(excluding finance type leases(1)). . . . . . . . . . . . . . . . 1,089) 1,085) 882) 857) 681) 666) Note 7Short-term borrowings. . . . . . . . . . . . . . . . . . . . . . . . . . . . . (5,569) (5,569) (4,157) (4,157) (2,757) (2,757) Note 15Long-term debt
(including amounts due within one year)Machinery and Engines. . . . . . . . . . . . . . . . . . . . . . . . (3,057) (3,465) (3,669) (4,186) (3,635) (4,109) Note 16Financial Products . . . . . . . . . . . . . . . . . . . . . . . . . . . . . (17,119) (17,176) (15,699) (15,843) (13,892) (14,078) Note 16
Interest rate swapsFinancial Products —
in a net receivable position. . . . . . . . . . . . . . . . . . . . 94) 94) 75) 75) 87) 87) Note 3in a net payable position . . . . . . . . . . . . . . . . . . . . . . (114) (114) (69) (69) (59) (59) Note 3
Guarantees(2) . . . . . . . . . . . . . . . . . . . . . . . . . . . . . . . . . . . . . . . . (9) (10) (10) (10) (5) (9) Note 23(1) Total excluded items have a net carrying value at December 31, 2005, 2004 and 2003 of $1,719 million, $1,737 million and $1,546 million, respectively.(2) The carrying amount provisions of FASB Interpretation No. 45 related to guarantees are effective for guarantees issued or modified subsequent to December 31, 2002 only, whereas the fair value amount
is for all guarantees.

NOTES continued
A-30
24. Environmental and legal matters
The company is regulated by federal, state and international envi-ronmental laws governing our use of substances and control ofemissions. In addition to governing our manufacturing and otheroperations, these laws often impact the development of our prod-ucts, including through required compliance with air emissionsstandards applicable to internal combustion engines. Compliancewith these existing laws has not had a material impact on ourcapital expenditures, earnings, or competitive position.
We are cleaning up contamination at a number of locations,often with other companies, pursuant to federal and state laws.When it is probable we will pay cleanup costs at a site and thosecosts can be estimated, the costs are charged against our earnings.In formulating that estimate, we do not consider amounts expectedto be recovered from insurance companies or others.
The amount recorded for environmental cleanup is not mate-rial and is included in “Accrued expenses” in Statement 2.
We cannot estimate costs on sites in the very early stages ofcleanup. Currently, we have several sites in the very early stagesof cleanup, and there is no more than a remote chance that amaterial amount for cleanup at any individual site or at all sitesin the aggregate will be required.
Pursuant to a consent decree Caterpillar entered with theUnited States Environmental Protection Agency (EPA), the com-pany was required to meet certain emission standards by October2002. The decree provides that if engine manufacturers were unableto meet the standards at that time, they would be required to paya Non-Conformance Penalty (NCP) on each engine sold that didnot meet the standard. The amount of the NCP would be based onhow close to meeting the standard the engine came — the moreout of compliance the higher the penalty. The company beganintroduction of fully compliant ACERT engines in 2003 and bythe end of 2003 Caterpillar was only producing fully compliantengine models. As a result, NCPs were not payable for anyengines built in 2004. NCPs of $153 million were paid in 2003.
In addition, the consent decree required Caterpillar to pay a fineof $25 million, which was expensed in 1998, and to make invest-ments totaling $35 million in environmental-related products byJuly 7, 2007. During the first quarter of 2005, Caterpillar madequalifying investments of $3 million surpassing its investmentrequirement in environmental-related products with an accu-mulated investment of $38 million. A future benefit is expectedto be realized from these environmental projects related toCaterpillar’s ability to capitalize on the technologies it devel-oped in complying with its environmental project obligations.In short, Caterpillar expects to receive a positive net return on theenvironmental projects by being able to market the technologyit developed.
We have disclosed certain individual legal proceedings in thisfiling. Additionally, we are involved in other unresolved legalactions that arise in the normal course of business. The mostprevalent of these unresolved actions involve disputes related toproduct design, manufacture and performance liability (includ-ing claimed asbestos and welding fumes exposure), contracts,employment issues and intellectual property rights. Although itis not possible to predict with certainty the outcome of theseunresolved legal actions or the range of probable loss, we believe
that these unresolved legal actions will not individually or in theaggregate have a material impact on our consolidated financialposition, liquidity or results of operations.
On January 16, 2002, Caterpillar commenced an action in theCircuit Court of the Tenth Judicial Circuit of Illinois in Peoria,Illinois, against Navistar International Transportation Corporationand International Truck and Engine Corporation (collectivelyNavistar). The lawsuit arises out of a long-term purchase contractbetween Caterpillar and Navistar effective May 31, 1988, asamended from time to time (the Purchase Agreement). The pend-ing complaint alleges, among other things, that Navistar breachedits contractual obligations by: (i) paying Caterpillar $8.08 lessper fuel injector than the agreed upon price for new unit injec-tors delivered by Caterpillar; (ii) refusing to pay contractuallyagreed upon surcharges owed as a result of Navistar orderingless than planned volumes of replacement unit injectors; and (iii)refusing to pay contractually agreed upon interest stemming fromNavistar’s late payments. As of December 31, 2005, the net pastdue receivable from Navistar regarding the foregoing and includedin “Long-term receivables — trade and other” in Statement 2 totaled$139 million. The pending complaint also has claims alleging thatNewstream Enterprises and Navistar, collectively and individu-ally, failed to pay the applicable price to Caterpillar for shipmentsof unit injectors to Newstream. As of December 31, 2005, thenet past due receivables for the foregoing, included in “Long-term receivables — trade and other” in Statement 2 totaled$12 million. The pending complaint further alleges that SturmanIndustries, Inc. and Sturman Engine Systems, Inc. colluded withNavistar to utilize technology that Sturman Industries, Inc. mis-appropriated from Caterpillar to help Navistar develop its G2fuel system, and tortiously interfered with the Purchase Agree-ment and Caterpillar’s prospective economic relationship withNavistar. The pending complaint further alleges that the two par-ties’ collusion led Navistar to select Sturman Engine Systems,Inc. and another company, instead of Caterpillar, to develop andmanufacture the G2 fuel system.
On September 30, 2005, International Truck and EngineCorporation (International) commenced an action againstCaterpillar in the Circuit Court of the Tenth Judicial Circuit ofIllinois in Peoria, Illinois. The lawsuit states that it arises out ofthe May 31, 1988 Purchase Agreement described above. TheComplaint alleges, among other things, that Caterpillar procuredthe May 31, 1988 Purchase Agreement by fraudulently misrep-resenting or concealing information related to the business ofselling fuel injectors to International, and that Caterpillarbreached the Purchase Agreement. International’s Complaintdoes not specify the amount of damages being sought. Caterpillarintends to defend itself vigorously in this case.
On May 7, 2002, International commenced an action againstCaterpillar in the Circuit Court of DuPage County, Illinois regard-ing a long-term agreement term sheet (“term sheet”) (the “firstlawsuit”). In its sixth amended complaint in the first lawsuit,International alleged that the term sheet constitutes a legallybinding contract for the sale of heavy-duty engines at specifiedprices through the end of 2006, alleged that Caterpillar breachedthe term sheet by, among other things, raising certain priceseffective October 1, 2002, and also alleged that Caterpillarbreached an obligation to negotiate a comprehensive long-term

Caterpillar Inc.
A-31
agreement referenced in the term sheet. International soughtdeclaratory and injunctive relief as well as damages in an amountto be determined at trial. Caterpillar denied International’s claimsand has filed a counterclaim seeking a declaration that the termsheet has been effectively terminated. Caterpillar also assertedthat pursuant to a subsequent agreement International releasedCaterpillar from certain of its claims. On September 24, 2003,the Appellate Court of Illinois, ruling on an interlocutory appeal,issued an order consistent with Caterpillar’s position that, even ifthe court subsequently determines that the term sheet is a bindingcontract, it is indefinite in duration and was therefore terminableat will by Caterpillar upon reasonable notice. On April 12, 2005International commenced a second, related action againstCaterpillar in the Circuit Court of DuPage County, Illinois (the“second lawsuit”). The second lawsuit contained allegations sim-ilar to the allegations contained in the first lawsuit. Internationalalso alleged in the second lawsuit that Caterpillar materiallybreached the subsequent agreement. On June 15, 2005 Internationalvoluntarily dismissed its complaint in the first lawsuit. The secondlawsuit has been consolidated with Caterpillar’s counterclaimsfrom the first lawsuit. Trial is currently scheduled to begin duringthe third quarter of 2006. This case is not related to the breach ofcontract action brought by Caterpillar against Navistar which iscurrently pending in the Circuit Court of Peoria County, Illinois.
In a letter dated November 15, 2004, the EPA proposed a civilpenalty of $641,392 to Caterpillar for the alleged failure to com-ply with certain requirements of the Federal Clean Air Act. TheEPA alleges that Caterpillar constructed a facility in Emporia,Kansas and failed to comply with Section 112(g)(2)(B) of theClean Air Act. Caterpillar sold the Emporia facility in December2002. We are seeking a settlement of this matter with all con-cerned parties and, in the opinion of our management, the ulti-mate disposition of these matters will not have a material adverseeffect on our consolidated financial position, liquidity or resultsof operations.
25. Segment information
A. Basis for segment information
Caterpillar is organized based on a decentralized structure thathas established accountabilities to continually improve businessfocus and increase our ability to react quickly to changes in boththe global business cycle and competitors’ actions. Our currentstructure uses a product, geographic matrix organization com-prised of multiple profit and service center divisions.
Caterpillar is a highly integrated company. The majority of ourprofit centers are product focused. They are primarily responsiblefor the design, manufacture and ongoing support of their products.However, some of these product-focused profit centers also havemarketing responsibilities. We also have geographically-basedprofit centers that are focused primarily on marketing. However,one of these profit centers also has some manufacturing respon-sibilities. One of our profit centers provides various financialservices to our customers and dealers. The service center divisionsperform corporate functions and provide centralized services.
We have developed an internal measurement system to eval-uate performance and to drive continuous improvement. Thismeasurement system, which is not based on generally acceptedaccounting principles (GAAP), is intended to motivate desired
behavior of employees and drive performance. It is not intendedto measure a division’s contribution to enterprise results. Thesales and cost information used for internal purposes varies sig-nificantly from our consolidated, externally reported informa-tion resulting in substantial reconciling items. Each division hasspecific performance targets and is evaluated and compensatedbased on achieving those targets. Performance targets differ fromdivision to division; therefore, meaningful comparisons cannotbe made among the profit or service center divisions. It is the com-parison of actual results to budgeted results that makes our inter-nal reporting valuable to management. Consequently, we feelthat the financial information required by Statement of FinancialAccounting Standards No. 131 (SFAS 131), “Disclosures aboutSegments of an Enterprise and Related Information” has limitedvalue for our external readers.
Due to Caterpillar’s high level of integration and our concernthat segment disclosures based on SFAS 131 requirements havelimited value to external readers, we are continuing to disclose finan-cial results for our three principal lines of business (Machinery,Engines and Financial Products) in our Management’s Discussionand Analysis beginning on page A-38.
B. Description of segments
The profit center divisions meet the SFAS 131 definition of“operating segments;” however, the service center divisions donot. Several of the profit centers have similar characteristics andhave been aggregated. The following is a brief description of ournine reportable segments and the business activities included inthe All Other category.
Primarily responsible for market-ing machinery through dealers in Australia, Asia (excludingJapan) and the Pacific Rim.
Primarily responsible forthe design, manufacture and ongoing support of medium andlarge machinery used in a variety of construction and miningapplications.
Primarily responsible for marketingmachinery through dealers in Europe, Africa, the Middle Eastand the Commonwealth of Independent States.
Primarily responsible for the design, manu-facture and ongoing support of natural gas and diesel poweredgenerator sets as well as integrated systems used in the electricpower generation industry. Also includes marketing throughdealers worldwide.
Provides financing to cus-tomers and dealers for the purchase and lease of Caterpillar andother equipment, as well as some financing for Caterpillar salesto dealers. Financing plans include operating and finance leases,installment sale contracts, working capital loans and wholesalefinancing plans. The division also provides various forms ofinsurance to customers and dealers to help support the purchaseand lease of our equipment.
Primarily responsible for the design,manufacture and ongoing support of C7 and larger reciprocatingengines. These engines are used in various industries and appli-cations including on-highway truck, electric power, indus-trial/rail, marine, petroleum and Caterpillar machinery.
Large Power Products:
Financing & Insurance Services:
Electric Power:
EAME Marketing:
Construction & Mining Products:
Asia/Pacific Marketing:

Primarily responsible for marketing machin-ery and engines through dealers in Latin America. Also includesthe manufacturing of machinery and components used in a varietyof construction and mining applications.
Primarily responsible for mar-keting machinery through dealers in the United States and Canada.
Primarily responsible for mar-keting and ongoing support of reciprocating engines sold intoon-highway truck, marine and petroleum industry applications.
Primarily includes activities such as: service sup-port and parts distribution to Caterpillar dealers worldwide; logisticsservices for Caterpillar and other companies; remanufacturingof Caterpillar engines and components and remanufacturing ser-vices for other companies; design, manufacture and ongoing sup-port for reciprocating engines used in industrial applications;design, manufacture, marketing and ongoing support of turbines;regional manufacturing of construction and mining machineryand components in Europe, Asia, and Australia; design, manu-facture and ongoing support of building construction, paving andforestry machinery and related components and control systems.
C. Segment measurement and reconciliations
Please refer to Table IV on pages A-33 to A-35 for financial infor-mation regarding our segments. There are several accountingdifferences between our segment reporting and our external report-ing. Our segments are measured on an accountable basis; there-fore, only those items for which divisional management is directlyresponsible are included in the determination of segment profit/(loss) and assets. We changed the composition of our reportablesegments and made several organizational changes that impactedour segment reporting in 2005. The information for 2003 and2004 has been restated to conform to the 2005 presentation. Wemade several changes to our segment reporting methodologiesin 2004. Most notable are a change in the current cost method-ology used to value inventory and cost of sales for segment report-ing purposes, as well as a change in the manner that interestexpense is charged to segments. Amounts for 2003 have beenrestated to conform to this methodology.
The following is a list of the more significant accountingdifferences:
● Generally, liabilities are managed at the corporate leveland are not included in segment operations. Segmentaccountable assets generally include inventories, receiv-ables, property, plant and equipment.
● We account for intersegment transfers using a systemof market-based prices. With minor exceptions, each ofthe profit centers either sells or purchases virtually all ofits products to or from other profit centers within the com-pany. Our high level of integration results in our internallyreported sales being approximately double that of our con-solidated, externally reported sales.
● Segment inventories and cost of sales are valued using acurrent cost methodology.
● Postretirement benefit expenses are split; segments aregenerally responsible for service and prior services costs,with the remaining elements of net periodic benefit costincluded as a methodology difference.
● Interest expense is imputed (i.e., charged) to profit cen-ters based on their level of accountable assets.
● Accountable profit is determined on a pretax basis.Reconciling items are created based on accounting differences
between segment reporting and our consolidated, external report-ing. Please refer to Table IV on pages A-33 to A-35 for financialinformation regarding significant reconciling items. Most of ourreconciling items are self-explanatory given the above explana-tions of accounting differences. However, for the reconciliationof profit, we have grouped the reconciling items as follows:
● Corporate costs: Certain corporate costs are not chargedto our segments. These costs are related to corporaterequirements and strategies that are considered to be forthe benefit of the entire organization.
● Timing: Timing differences in the recognition of costsbetween segment reporting and consolidated externalreporting.
● Methodology differences: See previous discussion ofsignificant accounting differences between segmentreporting and consolidated external reporting.
All Other:
Power Systems Marketing:
North America Marketing:
Latin America:
NOTES continued
A-32

Caterpillar Inc.
A-33
TABLE IV — Segment Information (Millions of dollars)_______________________________________________________________________________________________________________
Business Segments:Machinery and Engines____________________________________________________________________________________________
Asia/ Construction Large North Power Financing Consoli-Pacific & Mining EAME Electric Power Latin America Systems All & Insurance dated
Marketing Products Marketing Power Products America Marketing Marketing Other Total Services Total_______ _______ _______ _______ _______ _______ _______ _______ _______ _______ _______ _______2005External sales and revenues . . . . . . . . . $ 2,462 5 4,441 2,119 (260) 2,275 10,988 4,669 7,110 $ 33,809 2,867 $ 36,676Intersegment sales and revenues. . . . $ 3 9,925 5 187 7,303 1,703 385 87 14,388 $ 33,986 35 $ 34,021Total sales and revenues. . . . . . . . . . . . . $ 2,465 9,930 4,446 2,306 7,043 3,978 11,373 4,756 21,498 $ 67,795 2,902 $ 70,697Depreciation and amortization. . . . . . . $ 2 89 1 18 154 44 2 8 373 $ 691 646 $ 1,337Imputed interest expense . . . . . . . . . . . . $ 7 42 4 18 48 26 4 3 247 $ 399 798 $ 1,197Accountable profit (loss). . . . . . . . . . . . . $ 91 1,473 75 110 490 200 276 112 1,884 $ 4,711 566 $ 5,277Accountable assets at Dec. 31. . . . . . . $ 257 1,559 103 592 1,657 878 31 40 8,583 $ 13,700 26,815 $ 40,515Capital expenditures . . . . . . . . . . . . . . . . . $ 2 177 1 27 186 51 5 5 517 $ 971 1,232 $ 2,203
2004External sales and revenues . . . . . . . . . $ 2,110 (47) 3,878 1,757 (176) 1,730 8,882 3,930 6,059 $ 28,123 2,439 $ 30,562Intersegment sales and revenues. . . . $ — 7,565 6 141 6,242 1,236 323 75 11,806 $ 27,394 1 $ 27,395Total sales and revenues. . . . . . . . . . . . . $ 2,110 7,518 3,884 1,898 6,066 2,966 9,205 4,005 17,865 $ 55,517 2,440 $ 57,957Depreciation and amortization. . . . . . . $ 1 82 1 35 158 46 1 (6) 359 $ 677 604 $ 1,281Imputed interest expense . . . . . . . . . . . . $ 9 34 4 17 50 20 1 4 211 $ 350 543 $ 893Accountable profit (loss). . . . . . . . . . . . . $ 134 900 82 (37) 243 228 392 9 1,320 $ 3,271 460 $ 3,731Accountable assets at Dec. 31. . . . . . . $ 240 1,348 107 618 1,578 775 (61) 124 8,064 $ 12,793 24,450 $ 37,243Capital expenditures . . . . . . . . . . . . . . . . . $ — 109 — 19 108 41 6 — 436 $ 719 1,327 $ 2,046
2003External sales and revenues . . . . . . . . . $ 1,569 (31) 3,131 1,226 (110) 1,153 6,437 2,971 4,521 $ 20,867 2,076 $ 22,943Intersegment sales and revenues. . . . $ — 5,655 5 154 4,637 719 209 47 9,048 $ 20,474 2 $ 20,476Total sales and revenues. . . . . . . . . . . . . $ 1,569 5,624 3,136 1,380 4,527 1,872 6,646 3,018 13,569 $ 41,341 2,078 $ 43,419Depreciation and amortization. . . . . . . $ 1 86 1 19 167 43 1 2 367 $ 687 551 $ 1,238Imputed interest expense . . . . . . . . . . . . $ 7 31 4 13 47 22 8 7 189 $ 328 477 $ 805Accountable profit (loss). . . . . . . . . . . . . $ 109 450 48 (47) 32 107 269 (114) 772 $ 1,626 337 $ 1,963Accountable assets at Dec. 31. . . . . . . $ 266 1,096 88 489 1,656 640 251 164 6,369 $ 11,019 20,467 $ 31,486Capital expenditures . . . . . . . . . . . . . . . . . $ — 68 — 13 102 35 8 4 355 $ 585 1,220 $ 1,805_______________________________________________________________________________________________________________
Reconciliations:Machinery Financing & Consolidating Consolidated
and Engines Insurance Services Adjustments Total______________ ______________ ______________ ______________Sales & Revenues_______________2005Total external sales and revenues from business segments . . . . . . . . . . . . . . . . . . . . $ 33,809 $ 2,867 $ — $ 36,676Other . . . . . . . . . . . . . . . . . . . . . . . . . . . . . . . . . . . . . . . . . . . . . . . . . . . . . . . . . . . . . . . . . . . . . . . . . . . . . . . 197 (217) (317) (1) (337)_______ _______ _______ _______Total sales and revenues. . . . . . . . . . . . . . . . . . . . . . . . . . . . . . . . . . . . . . . . . . . . . . . . . . . . . . . . . . $ 34,006 $ 2,650 $ (317) $ 36,339_______ _______ _______ ______________ _______ _______ _______
2004Total external sales and revenues from business segments . . . . . . . . . . . . . . . . . . . . $ 28,123 $ 2,439 $ — $ 30,562Other . . . . . . . . . . . . . . . . . . . . . . . . . . . . . . . . . . . . . . . . . . . . . . . . . . . . . . . . . . . . . . . . . . . . . . . . . . . . . . . 213 (270) (199) (1) (256)_______ _______ _______ _______Total sales and revenues. . . . . . . . . . . . . . . . . . . . . . . . . . . . . . . . . . . . . . . . . . . . . . . . . . . . . . . . . . $ 28,336 $ 2,169 $ (199) $ 30,306_______ _______ _______ ______________ _______ _______ _______
2003Total external sales and revenues from business segments . . . . . . . . . . . . . . . . . . . . $ 20,867 $ 2,076 $ — $ 22,943Other . . . . . . . . . . . . . . . . . . . . . . . . . . . . . . . . . . . . . . . . . . . . . . . . . . . . . . . . . . . . . . . . . . . . . . . . . . . . . . . 181 (123) (194) (1) (136)_______ _______ _______ _______Total sales and revenues. . . . . . . . . . . . . . . . . . . . . . . . . . . . . . . . . . . . . . . . . . . . . . . . . . . . . . . . . . $ 21,048 $ 1,953 $ (194) $ 22,807_______ _______ _______ ______________ _______ _______ _______(1) Elimination of Financial Products revenues from Machinery and Engines.
Continued on Page A-34

NOTES continued
A-34
TABLE IV Continued — Segment Information (Millions of dollars)_______________________________________________________________________________________________________________
Reconciliations:Machinery Financing & Consolidated
and Engines Insurance Services Total______________ ______________ ______________Profit before taxes_______________2005Total accountable profit from business segments. . . . . . . . . . . . . . . . . . . . . . . . . . . . . . . $ 4,711 $ 566 $ 5,277Corporate costs . . . . . . . . . . . . . . . . . . . . . . . . . . . . . . . . . . . . . . . . . . . . . . . . . . . . . . . . . . . . . . . . . . . (728) — (728)Timing . . . . . . . . . . . . . . . . . . . . . . . . . . . . . . . . . . . . . . . . . . . . . . . . . . . . . . . . . . . . . . . . . . . . . . . . . . . . . (133) — (133)Methodology differences:
Inventory/cost of sales. . . . . . . . . . . . . . . . . . . . . . . . . . . . . . . . . . . . . . . . . . . . . . . . . . . . . . . . . . 14 — 14Postretirement benefit expense. . . . . . . . . . . . . . . . . . . . . . . . . . . . . . . . . . . . . . . . . . . . . . . . . (386) — (386)Financing costs . . . . . . . . . . . . . . . . . . . . . . . . . . . . . . . . . . . . . . . . . . . . . . . . . . . . . . . . . . . . . . . . . (14) — (14)Equity in profit of unconsolidated affiliated companies. . . . . . . . . . . . . . . . . . . . . . . (64) (9) (73)Currency. . . . . . . . . . . . . . . . . . . . . . . . . . . . . . . . . . . . . . . . . . . . . . . . . . . . . . . . . . . . . . . . . . . . . . . . . (21) — (21)Other methodology differences. . . . . . . . . . . . . . . . . . . . . . . . . . . . . . . . . . . . . . . . . . . . . . . . . (33) 23 (10)
Other . . . . . . . . . . . . . . . . . . . . . . . . . . . . . . . . . . . . . . . . . . . . . . . . . . . . . . . . . . . . . . . . . . . . . . . . . . . . . . . (25) — (25)_______ _______ _______Total profit before taxes . . . . . . . . . . . . . . . . . . . . . . . . . . . . . . . . . . . . . . . . . . . . . . . . . . . . . . . . . . . $ 3,321 $ 580 $ 3,901_______ _______ ______________ _______ _______2004Total accountable profit from business segments. . . . . . . . . . . . . . . . . . . . . . . . . . . . . . . $ 3,271 $ 460 $ 3,731Corporate costs . . . . . . . . . . . . . . . . . . . . . . . . . . . . . . . . . . . . . . . . . . . . . . . . . . . . . . . . . . . . . . . . . . . (601) — (601)Timing . . . . . . . . . . . . . . . . . . . . . . . . . . . . . . . . . . . . . . . . . . . . . . . . . . . . . . . . . . . . . . . . . . . . . . . . . . . . . (94) — (94)Methodology differences:
Inventory/cost of sales. . . . . . . . . . . . . . . . . . . . . . . . . . . . . . . . . . . . . . . . . . . . . . . . . . . . . . . . . . (62) — (62)Postretirement benefit expense. . . . . . . . . . . . . . . . . . . . . . . . . . . . . . . . . . . . . . . . . . . . . . . . . (270) — (270)Financing costs . . . . . . . . . . . . . . . . . . . . . . . . . . . . . . . . . . . . . . . . . . . . . . . . . . . . . . . . . . . . . . . . . 52 — 52Equity in profit of unconsolidated affiliated companies. . . . . . . . . . . . . . . . . . . . . . . (56) (3) (59)Currency. . . . . . . . . . . . . . . . . . . . . . . . . . . . . . . . . . . . . . . . . . . . . . . . . . . . . . . . . . . . . . . . . . . . . . . . . 35 — 35Other methodology differences. . . . . . . . . . . . . . . . . . . . . . . . . . . . . . . . . . . . . . . . . . . . . . . . . (89) 48 (41)
Other . . . . . . . . . . . . . . . . . . . . . . . . . . . . . . . . . . . . . . . . . . . . . . . . . . . . . . . . . . . . . . . . . . . . . . . . . . . . . . . 16 — 16_______ _______ _______Total profit before taxes . . . . . . . . . . . . . . . . . . . . . . . . . . . . . . . . . . . . . . . . . . . . . . . . . . . . . . . . . . . $ 2,202 $ 505 $ 2,707_______ _______ ______________ _______ _______2003Total accountable profit from business segments. . . . . . . . . . . . . . . . . . . . . . . . . . . . . . . $ 1,626 $ 337 $ 1,963Corporate costs . . . . . . . . . . . . . . . . . . . . . . . . . . . . . . . . . . . . . . . . . . . . . . . . . . . . . . . . . . . . . . . . . . . (512) — (512)Timing . . . . . . . . . . . . . . . . . . . . . . . . . . . . . . . . . . . . . . . . . . . . . . . . . . . . . . . . . . . . . . . . . . . . . . . . . . . . . 54 — 54Methodology differences:
Inventory/cost of sales. . . . . . . . . . . . . . . . . . . . . . . . . . . . . . . . . . . . . . . . . . . . . . . . . . . . . . . . . . (30) — (30)Postretirement benefit expense. . . . . . . . . . . . . . . . . . . . . . . . . . . . . . . . . . . . . . . . . . . . . . . . . (162) — (162)Financing costs . . . . . . . . . . . . . . . . . . . . . . . . . . . . . . . . . . . . . . . . . . . . . . . . . . . . . . . . . . . . . . . . . 84 — 84Equity in profit of unconsolidated affiliated companies. . . . . . . . . . . . . . . . . . . . . . . (16) (4) (20)Currency. . . . . . . . . . . . . . . . . . . . . . . . . . . . . . . . . . . . . . . . . . . . . . . . . . . . . . . . . . . . . . . . . . . . . . . . . 48 — 48Other methodology differences. . . . . . . . . . . . . . . . . . . . . . . . . . . . . . . . . . . . . . . . . . . . . . . . . (32) 38 6
Other . . . . . . . . . . . . . . . . . . . . . . . . . . . . . . . . . . . . . . . . . . . . . . . . . . . . . . . . . . . . . . . . . . . . . . . . . . . . . . . 46 — 46_______ _______ _______Total profit before taxes . . . . . . . . . . . . . . . . . . . . . . . . . . . . . . . . . . . . . . . . . . . . . . . . . . . . . . . . . . . $ 1,106 $ 371 $ 1,477_______ _______ ______________ _______ _______
Machinery Financing & Consolidating Consolidatedand Engines Insurance Services Adjustments Total______________ ______________ ______________ ______________Assets______
2005Total accountable assets from business segments. . . . . . . . . . . . . . . . . . . . . . . . . . . . . . $ 13,700 $ 26,815 $ — $ 40,515Items not included in segment assets:
Cash and short-term investments. . . . . . . . . . . . . . . . . . . . . . . . . . . . . . . . . . . . . . . . . . . . . . 951 157 — 1,108Intercompany receivables. . . . . . . . . . . . . . . . . . . . . . . . . . . . . . . . . . . . . . . . . . . . . . . . . . . . . . . 310 67 (377) —Trade and other receivables . . . . . . . . . . . . . . . . . . . . . . . . . . . . . . . . . . . . . . . . . . . . . . . . . . . . 332 — — 332Investments in unconsolidated affiliated companies. . . . . . . . . . . . . . . . . . . . . . . . . . 407 — — 407Investment in Financial Products . . . . . . . . . . . . . . . . . . . . . . . . . . . . . . . . . . . . . . . . . . . . . . 3,253 — (3,253) —Deferred income taxes and prepaids . . . . . . . . . . . . . . . . . . . . . . . . . . . . . . . . . . . . . . . . . . . 3,282 100 (340) 3,042Intangible assets and other assets . . . . . . . . . . . . . . . . . . . . . . . . . . . . . . . . . . . . . . . . . . . . . 1,692 — — 1,692Service center assets. . . . . . . . . . . . . . . . . . . . . . . . . . . . . . . . . . . . . . . . . . . . . . . . . . . . . . . . . . . . 1,030 — — 1,030
Liabilities included in segment assets . . . . . . . . . . . . . . . . . . . . . . . . . . . . . . . . . . . . . . . . . . . 1,242 14 — 1,256Inventory methodology differences . . . . . . . . . . . . . . . . . . . . . . . . . . . . . . . . . . . . . . . . . . . . . . (2,300) — — (2,300)Other . . . . . . . . . . . . . . . . . . . . . . . . . . . . . . . . . . . . . . . . . . . . . . . . . . . . . . . . . . . . . . . . . . . . . . . . . . . . . . . 88 (101) — (13)_______ _______ _______ _______Total assets . . . . . . . . . . . . . . . . . . . . . . . . . . . . . . . . . . . . . . . . . . . . . . . . . . . . . . . . . . . . . . . . . . . . . . . . $ 23,987 $ 27,052 $ (3,970) $ 47,069_______ _______ _______ ______________ _______ _______ _______
Continued on Page A-35

Caterpillar Inc.
A-35
TABLE IV Continued — Segment Information (Millions of dollars)_______________________________________________________________________________________________________________
Reconciliations:Machinery Financing & Consolidating Consolidated
and Engines Insurance Services Adjustments Total______________ ______________ ______________ ______________
Assets______2004Total accountable assets from business segments. . . . . . . . . . . . . . . . . . . . . . . . . . . . . . $ 12,793 $ 24,450 $ — $ 37,243Items not included in segment assets:
Cash and short-term investments. . . . . . . . . . . . . . . . . . . . . . . . . . . . . . . . . . . . . . . . . . . . . . 270 175 — 445Intercompany receivables. . . . . . . . . . . . . . . . . . . . . . . . . . . . . . . . . . . . . . . . . . . . . . . . . . . . . . . 443 18 (461) —Trade and other receivables . . . . . . . . . . . . . . . . . . . . . . . . . . . . . . . . . . . . . . . . . . . . . . . . . . . . 547 — — 547Investments in unconsolidated affiliated companies. . . . . . . . . . . . . . . . . . . . . . . . . . 367 — (1) 366Investment in Financial Products . . . . . . . . . . . . . . . . . . . . . . . . . . . . . . . . . . . . . . . . . . . . . . 3,012 — (3,012) —Deferred income taxes and prepaids . . . . . . . . . . . . . . . . . . . . . . . . . . . . . . . . . . . . . . . . . . . 2,477 92 (317) 2,252Intangible assets and other assets . . . . . . . . . . . . . . . . . . . . . . . . . . . . . . . . . . . . . . . . . . . . . 2,158 — — 2,158Service center assets. . . . . . . . . . . . . . . . . . . . . . . . . . . . . . . . . . . . . . . . . . . . . . . . . . . . . . . . . . . . 1,001 — — 1,001
Liabilities included in segment assets . . . . . . . . . . . . . . . . . . . . . . . . . . . . . . . . . . . . . . . . . . . 1,346 — — 1,346Inventory methodology differences . . . . . . . . . . . . . . . . . . . . . . . . . . . . . . . . . . . . . . . . . . . . . . (2,235) — — (2,235)Other . . . . . . . . . . . . . . . . . . . . . . . . . . . . . . . . . . . . . . . . . . . . . . . . . . . . . . . . . . . . . . . . . . . . . . . . . . . . . . . 90 (123) 5 (28)_______ _______ _______ _______Total assets . . . . . . . . . . . . . . . . . . . . . . . . . . . . . . . . . . . . . . . . . . . . . . . . . . . . . . . . . . . . . . . . . . . . . . . . $ 22,269 $ 24,612 $ (3,786) $ 43,095_______ _______ _______ ______________ _______ _______ _______
2003Total accountable assets from business segments. . . . . . . . . . . . . . . . . . . . . . . . . . . . . . $ 11,019 $ 20,467 $ — $ 31,486Items not included in segment assets:
Cash and short-term investments. . . . . . . . . . . . . . . . . . . . . . . . . . . . . . . . . . . . . . . . . . . . . . 220 122 — 342Intercompany receivables. . . . . . . . . . . . . . . . . . . . . . . . . . . . . . . . . . . . . . . . . . . . . . . . . . . . . . . 572 397 (969) —Trade and other receivables . . . . . . . . . . . . . . . . . . . . . . . . . . . . . . . . . . . . . . . . . . . . . . . . . . . . 232 — — 232Investments in unconsolidated affiliated companies. . . . . . . . . . . . . . . . . . . . . . . . . . 325 — — 325Investment in Financial Products . . . . . . . . . . . . . . . . . . . . . . . . . . . . . . . . . . . . . . . . . . . . . . 2,547 — (2,547) —Deferred income taxes and prepaids . . . . . . . . . . . . . . . . . . . . . . . . . . . . . . . . . . . . . . . . . . . 2,736 77 (228) 2,585Intangible assets and other assets . . . . . . . . . . . . . . . . . . . . . . . . . . . . . . . . . . . . . . . . . . . . . 2,110 — — 2,110Service center assets. . . . . . . . . . . . . . . . . . . . . . . . . . . . . . . . . . . . . . . . . . . . . . . . . . . . . . . . . . . . 943 — — 943
Liabilities included in segment assets . . . . . . . . . . . . . . . . . . . . . . . . . . . . . . . . . . . . . . . . . . . 925 — — 925Inventory methodology differences . . . . . . . . . . . . . . . . . . . . . . . . . . . . . . . . . . . . . . . . . . . . . . (2,035) — — (2,035)Other . . . . . . . . . . . . . . . . . . . . . . . . . . . . . . . . . . . . . . . . . . . . . . . . . . . . . . . . . . . . . . . . . . . . . . . . . . . . . . . (143) (91) 32 (202)_______ _______ _______ _______Total assets . . . . . . . . . . . . . . . . . . . . . . . . . . . . . . . . . . . . . . . . . . . . . . . . . . . . . . . . . . . . . . . . . . . . . . . . $ 19,451 $ 20,972 $ (3,712) $ 36,711_______ _______ _______ ______________ _______ _______ ______________________________________________________________________________________________________________________
Enterprise-wide Disclosures:External sales and revenues from products and services:
2005 2004 2003_____ _____ _____Machinery . . . . . . . . . . . . . . . . . . . . . . . . . . . . . . . . . . . . . . $22,931 $18,844 $13,678Engines . . . . . . . . . . . . . . . . . . . . . . . . . . . . . . . . . . . . . . . . . 11,075 9,492 7,370Financial Products . . . . . . . . . . . . . . . . . . . . . . . . . . . . . 2,333 1,970 1,759_______ ______ ______
Total consolidated . . . . . . . . . . . . . . . . . . . . . . . . . . . $36,339 $30,306 $22,807_______ ______ _____________ ______ ______
Information about Geographic Areas:External Sales & Revenues(1) Net property, plant and equipment___________________________ ___________________________
December 31,
2005 2004 2003 2005 2004 2003_______ _______ _______ _______ _______ _______Inside United States. . . . . . . . . . . . . . . . . . . . . . . . . . . . . . . . . . . . . . . . . . . . . . . . . . . . . . . . . . . . . $ 17,348 $ 14,198 $ 10,064 $ 4,725 $ 4,424 $ 4,276Outside United States . . . . . . . . . . . . . . . . . . . . . . . . . . . . . . . . . . . . . . . . . . . . . . . . . . . . . . . . . . . 18,991 16,108 12,743 3,263(2) 3,258(2) 2,975(2)_______ _______ _______ _______ _______ _______
Total . . . . . . . . . . . . . . . . . . . . . . . . . . . . . . . . . . . . . . . . . . . . . . . . . . . . . . . . . . . . . . . . . . . . . . . . . . . $ 36,339 $ 30,306 $ 22,807 $ 7,988 $ 7,682 $ 7,251_______ _______ _______ _______ _______ ______________ _______ _______ _______ _______ _______(1) Sales of machinery and engines are based on dealer location. Revenues from services provided are based on where service is rendered.(2) Amount includes $692 million, $681 million and $675 million of net property, plant and equipment located in the United Kingdom as of December 31, 2005, 2004 and 2003, respectively.
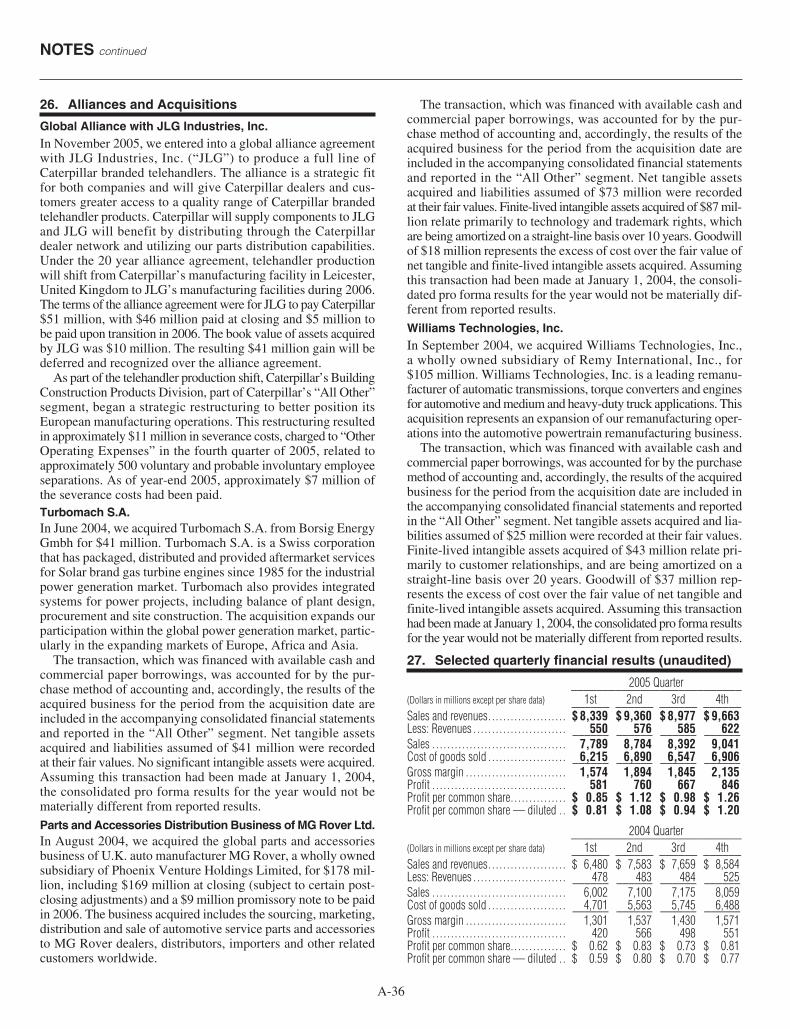
NOTES continued
A-36
26. Alliances and Acquisitions
Global Alliance with JLG Industries, Inc.In November 2005, we entered into a global alliance agreementwith JLG Industries, Inc. (“JLG”) to produce a full line ofCaterpillar branded telehandlers. The alliance is a strategic fitfor both companies and will give Caterpillar dealers and cus-tomers greater access to a quality range of Caterpillar brandedtelehandler products. Caterpillar will supply components to JLGand JLG will benefit by distributing through the Caterpillardealer network and utilizing our parts distribution capabilities.Under the 20 year alliance agreement, telehandler productionwill shift from Caterpillar’s manufacturing facility in Leicester,United Kingdom to JLG’s manufacturing facilities during 2006.The terms of the alliance agreement were for JLG to pay Caterpillar$51 million, with $46 million paid at closing and $5 million tobe paid upon transition in 2006. The book value of assets acquiredby JLG was $10 million. The resulting $41 million gain will bedeferred and recognized over the alliance agreement.
As part of the telehandler production shift, Caterpillar’s BuildingConstruction Products Division, part of Caterpillar’s “All Other”segment, began a strategic restructuring to better position itsEuropean manufacturing operations. This restructuring resultedin approximately $11 million in severance costs, charged to “OtherOperating Expenses” in the fourth quarter of 2005, related toapproximately 500 voluntary and probable involuntary employeeseparations. As of year-end 2005, approximately $7 million ofthe severance costs had been paid.Turbomach S.A.In June 2004, we acquired Turbomach S.A. from Borsig EnergyGmbh for $41 million. Turbomach S.A. is a Swiss corporationthat has packaged, distributed and provided aftermarket servicesfor Solar brand gas turbine engines since 1985 for the industrialpower generation market. Turbomach also provides integratedsystems for power projects, including balance of plant design,procurement and site construction. The acquisition expands ourparticipation within the global power generation market, partic-ularly in the expanding markets of Europe, Africa and Asia.
The transaction, which was financed with available cash andcommercial paper borrowings, was accounted for by the pur-chase method of accounting and, accordingly, the results of theacquired business for the period from the acquisition date areincluded in the accompanying consolidated financial statementsand reported in the “All Other” segment. Net tangible assetsacquired and liabilities assumed of $41 million were recordedat their fair values. No significant intangible assets were acquired.Assuming this transaction had been made at January 1, 2004,the consolidated pro forma results for the year would not bematerially different from reported results.
Parts and Accessories Distribution Business of MG Rover Ltd.In August 2004, we acquired the global parts and accessoriesbusiness of U.K. auto manufacturer MG Rover, a wholly ownedsubsidiary of Phoenix Venture Holdings Limited, for $178 mil-lion, including $169 million at closing (subject to certain post-closing adjustments) and a $9 million promissory note to be paidin 2006. The business acquired includes the sourcing, marketing,distribution and sale of automotive service parts and accessoriesto MG Rover dealers, distributors, importers and other relatedcustomers worldwide.
The transaction, which was financed with available cash andcommercial paper borrowings, was accounted for by the pur-chase method of accounting and, accordingly, the results of theacquired business for the period from the acquisition date areincluded in the accompanying consolidated financial statementsand reported in the “All Other” segment. Net tangible assetsacquired and liabilities assumed of $73 million were recordedat their fair values. Finite-lived intangible assets acquired of $87 mil-lion relate primarily to technology and trademark rights, whichare being amortized on a straight-line basis over 10 years. Goodwillof $18 million represents the excess of cost over the fair value ofnet tangible and finite-lived intangible assets acquired. Assumingthis transaction had been made at January 1, 2004, the consoli-dated pro forma results for the year would not be materially dif-ferent from reported results.
Williams Technologies, Inc.In September 2004, we acquired Williams Technologies, Inc.,a wholly owned subsidiary of Remy International, Inc., for$105 million. Williams Technologies, Inc. is a leading remanu-facturer of automatic transmissions, torque converters and enginesfor automotive and medium and heavy-duty truck applications. Thisacquisition represents an expansion of our remanufacturing oper-ations into the automotive powertrain remanufacturing business.
The transaction, which was financed with available cash andcommercial paper borrowings, was accounted for by the purchasemethod of accounting and, accordingly, the results of the acquiredbusiness for the period from the acquisition date are included inthe accompanying consolidated financial statements and reportedin the “All Other” segment. Net tangible assets acquired and lia-bilities assumed of $25 million were recorded at their fair values.Finite-lived intangible assets acquired of $43 million relate pri-marily to customer relationships, and are being amortized on astraight-line basis over 20 years. Goodwill of $37 million rep-resents the excess of cost over the fair value of net tangible andfinite-lived intangible assets acquired. Assuming this transactionhad been made at January 1, 2004, the consolidated pro forma resultsfor the year would not be materially different from reported results.
27. Selected quarterly financial results (unaudited)
2005 Quarter___________________________(Dollars in millions except per share data) 1st 2nd 3rd 4th______ ______ ______ ______Sales and revenues. . . . . . . . . . . . . . . . . . . . . $ 8,339 $ 9,360 $ 8,977 $ 9,663Less: Revenues . . . . . . . . . . . . . . . . . . . . . . . . . 550 576 585 622______ ______ ______ ______Sales . . . . . . . . . . . . . . . . . . . . . . . . . . . . . . . . . . . . 7,789 8,784 8,392 9,041Cost of goods sold . . . . . . . . . . . . . . . . . . . . . 6,215 6,890 6,547 6,906______ ______ ______ ______Gross margin . . . . . . . . . . . . . . . . . . . . . . . . . . . 1,574 1,894 1,845 2,135Profit . . . . . . . . . . . . . . . . . . . . . . . . . . . . . . . . . . . . 581 760 667 846Profit per common share. . . . . . . . . . . . . . . $ 0.85 $ 1.12 $ 0.98 $ 1.26Profit per common share — diluted . . $ 0.81 $ 1.08 $ 0.94 $ 1.20
2004 Quarter___________________________(Dollars in millions except per share data) 1st 2nd 3rd 4th______ ______ ______ ______Sales and revenues. . . . . . . . . . . . . . . . . . . . . $ 6,480 $ 7,583 $ 7,659 $ 8,584Less: Revenues . . . . . . . . . . . . . . . . . . . . . . . . . 478 483 484 525______ ______ ______ ______Sales . . . . . . . . . . . . . . . . . . . . . . . . . . . . . . . . . . . . 6,002 7,100 7,175 8,059Cost of goods sold . . . . . . . . . . . . . . . . . . . . . 4,701 5,563 5,745 6,488______ ______ ______ ______Gross margin . . . . . . . . . . . . . . . . . . . . . . . . . . . 1,301 1,537 1,430 1,571Profit . . . . . . . . . . . . . . . . . . . . . . . . . . . . . . . . . . . . 420 566 498 551Profit per common share. . . . . . . . . . . . . . . $ 0.62 $ 0.83 $ 0.73 $ 0.81Profit per common share — diluted . . $ 0.59 $ 0.80 $ 0.70 $ 0.77

A-37
Years ended December 31, 2005 2004(5) 2003(5) 2002(5) 2001(5)______ ______ ______ ______ ______
Sales and revenues . . . . . . . . . . . . . . . . . . . . . . . . . . . . . . . . . . . . . . . . . . . . . . . . $36,339 30,306 22,807 20,185 20,510
Sales . . . . . . . . . . . . . . . . . . . . . . . . . . . . . . . . . . . . . . . . . . . . . . . . . . . . . . . . . . . $34,006 28,336 21,048 18,648 19,027
Percent inside the United States . . . . . . . . . . . . . . . . . . . . . . . . . . . 47% 46% 44% 45% 49%
Percent outside the United States. . . . . . . . . . . . . . . . . . . . . . . . . . 53% 54% 56% 55% 51%
Revenues . . . . . . . . . . . . . . . . . . . . . . . . . . . . . . . . . . . . . . . . . . . . . . . . . . . . . . . $ 2,333 1,970 1,759 1,537 1,483
Profit(1) . . . . . . . . . . . . . . . . . . . . . . . . . . . . . . . . . . . . . . . . . . . . . . . . . . . . . . . . . . . . . . $ 2,854 2,035 1,099 798 805
Profit per common share(1)(2) . . . . . . . . . . . . . . . . . . . . . . . . . . . . . . . . . . . . . . . $ 4.21 2.97 1.59 1.16 1.17
Profit per common share — diluted(1)(3) . . . . . . . . . . . . . . . . . . . . . . . . . . $ 4.04 2.88 1.56 1.15 1.16
Dividends declared per share of common stock . . . . . . . . . . . . . . . . . $ 0.955 0.800 0.720 0.700 0.695
Return on average common stockholders’ equity(4) . . . . . . . . . . . . . . 35.9% 30.0% 19.0% 14.4% 14.4%
Capital expenditures:
Property, plant and equipment. . . . . . . . . . . . . . . . . . . . . . . . . . . . . . . . . $ 1,201 926 682 728 1,100
Equipment leased to others . . . . . . . . . . . . . . . . . . . . . . . . . . . . . . . . . . . . $ 1,214 1,188 1,083 1,045 868
Depreciation and amortization . . . . . . . . . . . . . . . . . . . . . . . . . . . . . . . . . . . . $ 1,477 1,397 1,347 1,220 1,169
Research and development expenses. . . . . . . . . . . . . . . . . . . . . . . . . . . . . $ 1,084 928 669 656 696
As a percent of sales and revenues. . . . . . . . . . . . . . . . . . . . . . . . . . . . 3.0% 3.1% 2.9% 3.3% 3.4%
Wages, salaries and employee benefits. . . . . . . . . . . . . . . . . . . . . . . . . . . $ 6,928 6,025 4,980 4,360 4,272
Average number of employees . . . . . . . . . . . . . . . . . . . . . . . . . . . . . . . . . . . . 81,673 73,033 67,828 70,973 70,678
December 31,
Total assets. . . . . . . . . . . . . . . . . . . . . . . . . . . . . . . . . . . . . . . . . . . . . . . . . . . . . . . . . $47,069 43,095 36,711 32,705 30,489
Long-term debt due after one year:
Consolidated . . . . . . . . . . . . . . . . . . . . . . . . . . . . . . . . . . . . . . . . . . . . . . . . . . . $15,677 15,837 14,546 11,774 11,452
Machinery and Engines . . . . . . . . . . . . . . . . . . . . . . . . . . . . . . . . . . . . . . . . $ 2,717 3,663 3,603 3,581 3,653
Financial Products . . . . . . . . . . . . . . . . . . . . . . . . . . . . . . . . . . . . . . . . . . . . . $12,960 12,174 10,943 8,193 7,799
Total debt:
Consolidated . . . . . . . . . . . . . . . . . . . . . . . . . . . . . . . . . . . . . . . . . . . . . . . . . . . $25,745 23,525 20,284 17,861 16,763
Machinery and Engines . . . . . . . . . . . . . . . . . . . . . . . . . . . . . . . . . . . . . . . . $ 3,928 3,762 3,707 3,903 3,945
Financial Products . . . . . . . . . . . . . . . . . . . . . . . . . . . . . . . . . . . . . . . . . . . . . $21,817 19,763 16,577 13,958 12,818
(1) In 2002, we adopted Statement of Financial Accounting Standards No. 142, “Goodwill and Other Intangible Assets” and therefore no longer amortize goodwill.(2) Computed on weighted-average number of shares outstanding.(3) Computed on weighted-average number of shares outstanding diluted by assumed exercise of stock options, using the treasury stock method.(4) Represents profit divided by average stockholders’ equity (beginning of year stockholders’ equity plus end of year stockholders’ equity divided by two).(5) The per share data reflects the 2005 2-for-1 stock split, applied retroactively, to all periods presented.
Five-year Financial Summary Caterpillar Inc.(Dollars in millions except per share data)

A-38
Sales and Revenues by Geographic Region
% North % % Latin % Asia/ %(Millions of dollars) Total Change America Change EAME Change America Change Pacific Change
2005Machinery. . . . . . . . . . . . . . $22,931 22% $12,822 24% $ 5,222 16% $ 1,982 31% $ 2,905 17%Engines(1) . . . . . . . . . . . . . . . 11,075 17% 4,887 17% 3,638 22% 1,042 21% 1,508 4%Financial Products(2) . . . 2,333 18% 1,659 20% 341 1% 148 25% 185 42%_______ _______ _______ _______ _______
$36,339 20% $19,368 22% $ 9,201 17% $ 3,172 27% $ 4,598 13%_______ _______ _______ _______ ______________ _______ _______ _______ _______2004Machinery. . . . . . . . . . . . . . $18,844 $10,337 $ 4,511 $ 1,510 $ 2,486Engines(1) . . . . . . . . . . . . . . . 9,492 4,184 2,994 862 1,452Financial Products(2) . . . 1,970 1,384 338 118 130_______ _______ _______ _______ _______
$30,306 $15,905 $ 7,843 $ 2,490 $ 4,068_______ _______ _______ _______ ______________ _______ _______ _______ _______(1) Does not include internal engine transfers of $2,065 million and $1,738 million in 2005 and 2004, respectively. Internal engines transfers are valued at prices comparable to those for unrelated parties.(2) Does not include revenues earned from Machinery and Engines of $317 million and $199 million in 2005 and 2004, respectively.
2005 COMPARED WITH 2004
MANAGEMENT’S DISCUSSION AND ANALYSIS
OVERVIEWWe effectively responded to unprecedented customer demandin 2005 and reported full-year sales and revenues of $36.339 bil-lion and profit per share of $4.04. Sales and revenues rose 20 per-cent from 2004, and profit per share was up 40 percent—both wererecords. Fourth-quarter sales and revenues of $9.663 billion andprofit per share of $1.20 were both all-time records for any quarterin Caterpillar history.
2005 was an incredibly strong year for us. With the surge incustomer demand and production, our employees, suppliers anddealers have responded in spectacular fashion to help us realizethe opportunity. We should celebrate our 2005 accomplishmentsknowing Caterpillar is extremely well-positioned going forward.
2005 sales and revenues of $36.339 billion were up $6.033 bil-lion, or 20 percent, from 2004. The increase was a result of$3.715 billion of higher sales volume, $1.827 billion of improvedprice realization and a $363 million increase in FinancialProducts revenues.
Profit of $2.854 billion, or $4.04 a share, was up 40 percent.The improvement was primarily the result of higher price real-ization and sales volume, partially offset by an increase in coreoperating costs. The increase was a result of higher materialcosts, primarily steel, and costs to support higher volume andongoing investment in new products and technology.
Our focus this year has been on meeting customer deliveryexpectations while creating stockholder value. Over the past twoyears we’ve more than doubled production at several of our man-
ufacturing facilities, particularly those manufacturing largemachines. We’ve done this without additional bricks and mor-tar and with a focus on managing our period cost structure.
In 2006, we expect sales and revenues of about $40 billionand profit per share between $4.65 and $5.00.
2006 should be another year of excellent growth forCaterpillar. Most of the industries we serve are strong, and thefundamental economic picture remains positive. Our emphasisis on execution with 6 Sigma as we implement our new strategyto achieve our 2010 goals, with even greater focus on improv-ing employee safety, product quality and product availability.
It is our objective to provide the most meaningful disclosuresin our Management’s Discussion and Analysis in order to explainsignificant changes in our company’s results of operations andliquidity and capital resources. As discussed in Note 25, our seg-ment financial information is not based on generally acceptedaccounting principles and it is not intended to measure contri-butions to enterprise results. Therefore, it is impractical for us totry to discuss our company’s results of operations and liquidityand capital resources solely based on segment information.Where practical, we have linked our discussions to segmentinformation provided in Note 25 and Table IV on pages A-31 toA-35 (see “Reconciliation of Machinery and Engines Sales byGeographic Region to External Sales by Marketing Segment”on page A-39). Our discussions will focus on consolidated resultsand our three principal lines of business, Machinery, Enginesand Financial Products.
*Glossary of terms included on pages A-49 to A-50; first occurrence of terms shown in bold italics.

Caterpillar Inc.
A-39
Reconciliation of Machinery and Engine Sales by Geographic Region to External Sales by Marketing Segment
(Millions of dollars) 2005 2004 2003
North America Geographic Region . . . . . . . . . . . . . . . . . . . . . . . . . . . . . . . . . . . . . . . . . . . . . . . . . . . . . . . . . . . . $ 17,709 $ 14,521 $ 10,532Sales included in the Power Systems Marketing segment . . . . . . . . . . . . . . . . . . . . . . . . . . . . . . . . . . . . (3,431) (2,896) (2,166)Sales included in the Electric Power segment . . . . . . . . . . . . . . . . . . . . . . . . . . . . . . . . . . . . . . . . . . . . . . . . . (603) (499) (316)Company owned dealer sales included in the All Other segment . . . . . . . . . . . . . . . . . . . . . . . . . . . (878) (766) (388)Other*. . . . . . . . . . . . . . . . . . . . . . . . . . . . . . . . . . . . . . . . . . . . . . . . . . . . . . . . . . . . . . . . . . . . . . . . . . . . . . . . . . . . . . . . . . . . . (1,809) (1,478) (1,225)_______ _______ _______North America Marketing external sales . . . . . . . . . . . . . . . . . . . . . . . . . . . . . . . . . . . . . . . . . . . . . . . . . . . . . . $ 10,988 $ 8,882 $ 6,437_______ _______ ______________ _______ _______
EAME Geographic Region. . . . . . . . . . . . . . . . . . . . . . . . . . . . . . . . . . . . . . . . . . . . . . . . . . . . . . . . . . . . . . . . . . . . . . $ 8,860 $ 7,505 $ 5,952Sales included in the Power Systems Marketing segment . . . . . . . . . . . . . . . . . . . . . . . . . . . . . . . . . . . . (625) (515) (419)Sales included in the Electric Power segment . . . . . . . . . . . . . . . . . . . . . . . . . . . . . . . . . . . . . . . . . . . . . . . . . (1,087) (903) (610)Other*. . . . . . . . . . . . . . . . . . . . . . . . . . . . . . . . . . . . . . . . . . . . . . . . . . . . . . . . . . . . . . . . . . . . . . . . . . . . . . . . . . . . . . . . . . . . . (2,707) (2,209) (1,792)_______ _______ _______EAME Marketing external sales . . . . . . . . . . . . . . . . . . . . . . . . . . . . . . . . . . . . . . . . . . . . . . . . . . . . . . . . . . . . . . . $ 4,441 $ 3,878 $ 3,131_______ _______ ______________ _______ _______
Latin America Geographic Region . . . . . . . . . . . . . . . . . . . . . . . . . . . . . . . . . . . . . . . . . . . . . . . . . . . . . . . . . . . . . $ 3,024 $ 2,372 $ 1,721Sales included in the Power Systems Marketing segment . . . . . . . . . . . . . . . . . . . . . . . . . . . . . . . . . . . . (145) (153) (62)Sales included in the Electric Power segment . . . . . . . . . . . . . . . . . . . . . . . . . . . . . . . . . . . . . . . . . . . . . . . . . (25) (19) (6)Other*. . . . . . . . . . . . . . . . . . . . . . . . . . . . . . . . . . . . . . . . . . . . . . . . . . . . . . . . . . . . . . . . . . . . . . . . . . . . . . . . . . . . . . . . . . . . . (579) (470) (500)_______ _______ _______Latin America external sales . . . . . . . . . . . . . . . . . . . . . . . . . . . . . . . . . . . . . . . . . . . . . . . . . . . . . . . . . . . . . . . . . . . $ 2,275 $ 1,730 $ 1,153_______ _______ ______________ _______ _______
Asia/Pacific Geographic Region . . . . . . . . . . . . . . . . . . . . . . . . . . . . . . . . . . . . . . . . . . . . . . . . . . . . . . . . . . . . . . . $ 4,413 $ 3,938 $ 2,843Sales included in the Power Systems Marketing segment . . . . . . . . . . . . . . . . . . . . . . . . . . . . . . . . . . . . (468) (366) (324)Sales included in the Electric Power segment . . . . . . . . . . . . . . . . . . . . . . . . . . . . . . . . . . . . . . . . . . . . . . . . . (404) (336) (294)Other*. . . . . . . . . . . . . . . . . . . . . . . . . . . . . . . . . . . . . . . . . . . . . . . . . . . . . . . . . . . . . . . . . . . . . . . . . . . . . . . . . . . . . . . . . . . . . (1,079) (1,126) (656)_______ _______ _______Asia/Pacific Marketing external sales . . . . . . . . . . . . . . . . . . . . . . . . . . . . . . . . . . . . . . . . . . . . . . . . . . . . . . . . . $ 2,462 $ 2,110 $ 1,569_______ _______ ______________ _______ _______*Mostly represents external sales of the All Other segment.
SALES AND REVENUES
The chart above graphically illustrates reasons for the change in Consolidated Sales and Revenues between 2004 (at left) and 2005 (at right). Items favorablyimpacting sales and revenues appear as upward stair steps with the corresponding dollar amounts above each bar. Caterpillar management utilizes these chartsinternally to visually communicate with its Board and employees.
10,000
15,000
20,000
25,000
30,000
35,000
40,000
Mill
ions
of $
2004 Sales &Revenues
MachineryVolume
2,637
EnginesVolume
1,078
PriceRealization
1,827
Currency
128
FinancialProductsRevenues
363
2005 Sales &Revenues
36,339
Consolidated Sales and Revenues Comparison2005 vs. 2004
30,306

A-40
MANAGEMENT’S DISCUSSION AND ANALYSIS continued
Sales and revenues for 2005 were $36.339 billion, up $6.033 billion,or 20 percent, from 2004. Machinery volume was up $2.637 bil-lion, Engines volume was up $1.078 billion, price realizationimproved $1.827 billion and currency had a positive impact onsales of $128 million. In addition, Financial Products revenuesincreased $363 million.Machinery sales in 2005 were $22.931 billion, an increase of$4.087 billion, or 22 percent, from 2004. Sales were an all-timerecord for a year. Sales volume accounted for $2.637 billion ofthe increase, price realization added $1.343 billion and theremaining $107 million was due to currency.
Growth in sales volume resulted from increased shipments todealers in response to broad-based gains in reported dealer deliv-eries to end users. All regions and most industries participatedin this growth, which showed little sign of abating as the yearended. Worldwide, dealers reported increases to machine inven-tory in both 2004 and 2005. At the end of 2005, dealers reportedlower machine inventory, as measured by months of supply, thanat the end of 2004.• North America sales were up $2.485 billion, or 24 percent,
from 2004; sales volume increased $1.653 billion and pricerealization added $832 million. Growth in sales volume resultedlargely from increased sales through our dealer network, theresult of favorable metals and energy prices and increased con-struction spending. Dealers built machine inventories in linewith deliveries so that inventories in months of deliveries werethe same as at the end of 2004.
• EAME sales increased 16 percent, or $711 million, comparedto 2004. Sales volume accounted for $421 million, improvedprice realization added $253 million and the remaining $37 mil-lion came from the favorable impact of currency. Volume growthoccurred as a result of increased sales through our dealer net-work. Low interest rates benefited housing construction in Europe,and higher metals and energy prices supported both construc-tion and mining in Africa/Middle East (AME). Mining andenergy investment in the Commonwealth of Independent States(CIS) increased and had a positive effect on Caterpillar sales.
• Latin America sales rose $472 million, or 31 percent, from thesame period a year ago — $304 million from increased volume,$120 million from improved price realization and the remain-ing $48 million due to currency, primarily related to a strongerBrazilian real. Increased sales through our dealer network intoboth construction and mining sectors accounted for all the salesvolume growth; dealer machine inventories declined in bothabsolute amount and months of deliveries.
• Asia/Pacific sales were up 17 percent, or $419 million, higherthan last year — $259 million from higher volume, $138 millionfrom improved price realization and the remaining $22 milliondue to currency. Sales volume in most of the larger countriesincreased, a result of very strong mining activity and continuedgrowth in construction. In China, sales were down modestly forthe year. Sales in China have been rising since early in 2005following a steep downturn in the second half of 2004. Dealersin the Asia/Pacific region added less to their inventories thanin 2004. Dealer machine inventories at December 2005, inmonths of deliveries, were below 2004.
Engine sales were $11.075 billion in 2005, up $1.583 billion, or17 percent, from 2004. Volume accounted for $1.078 billion, pricerealization added $484 million and currency added $21 million.
Dealer engine inventory increased during both full-year 2005and full-year 2004. The 2005 inventory increase was less than the2004 increase, which slightly reduced the company’s year-over-year sales growth. Months of inventory relative to deliveries declinedin most regions and sectors compared to 2004.• North America sales were up 17 percent. Sales of petroleum
engines increased 50 percent, primarily from increased salesof reciprocating engines for drilling and gas compression andturbines and related services for gas production and transmis-sion. High oil and gas prices were a significant factor behindthe increase in sales. Sales of on-highway truck engines wereup 5 percent, primarily due to expansion and replacement oftruck fleets. Sales of electric power engines were up 21 percent,with widespread demand for generator sets for communica-tions, data center and standby applications. Marine engine saleswere up 33 percent, primarily from increased demand for work-boats and petroleum support vessels.
• EAME sales increased 22 percent. Sales into the electric powersector were up 35 percent, with widespread growth in demandfor reciprocating generator sets, support from Middle East recon-struction efforts and incremental revenue from the acquisition ofTurbomach, a turbine generator set packager and service provider.Marine engine sales increased 20 percent, with strong demandfor oceangoing and inland waterway vessels. Sales of indus-trial engines were up 8 percent — a result of increases in demandfrom a broad range of industrial equipment customers, partiallyoffset by lower demand from agricultural equipment manufactur-ers. Petroleum engine sales dropped 4 percent for the year, pri-marily from reduced shipments for turbines and turbine-relatedservices for offshore oil platforms and gas transmission projects.
• Latin America sales were up 21 percent. Sales of petroleumengines increased 49 percent, with nearly all of the increasefrom sales of turbines and turbine-related services to supportincreased investment in oil production. Sales of electric powerengines increased 44 percent, benefiting from investments ingenerator sets for electricity reliability and disaster prepared-ness as well as demand for rental fleets. Sales of industrialengines decreased 34 percent, with reduced demand for enginesfor agricultural equipment. Sales of marine engines declined37 percent, impacted by limited shipyard capacity and com-parison with a high 2004 base.
• Asia/Pacific sales were up 4 percent. Sales of marine engineswere up 26 percent, with increased demand for oceangoingand petroleum support vessels due to strong freight and petroleumdemand. Petroleum engine sales increased 12 percent, withwidespread demand for reciprocating engines for petroleumsite power, drilling and well support as well as demand for tur-bines and related services to support production. Electric powerengine sales declined 19 percent, with most of the decline dueto centralized electrical demand management actions andimproved electricity reliability in China that drove reduceddemand for generator sets.
Financial Products revenues were $2.333 billion, up $363 mil-lion, or 18 percent, from 2004. The increase was due primarilyto a $211 million favorable impact from continued growth ofEarning Assets and an $89 million impact of higher interest rateson new and existing finance receivables at Cat Financial. Also,there was a $47 million increase in revenues at Cat Insurance, pri-marily due to an increase in earned premiums.

Caterpillar Inc.
A-41
OPERATING PROFIT
The chart above graphically illustrates reasons for the change in Consolidated Operating Profit between 2004 (at left) and 2005 (at right). Items favorably impactingoperating profit appear as upward stair steps with the corresponding dollar amounts above each bar, while items negatively impacting operating profit appear asdownward stair steps with dollar amounts reflected in parentheses above each bar. Caterpillar management utilizes these charts internally to visually communicatewith its Board and employees.
Mill
ions
of $
2004Operating
Profit
2,684
SalesVolume
1,287
PriceRealization
1,827
Currency
(74)
CoreOperating
Costs
(1,668)
RetirementBenefits
(215)
FinancialProducts
61
ConsolidatingAdjustments
(118)
2005Operating
Profit
3,784
Consolidated Operating Profit Comparison2005 vs. 2004
1,000
1,500
2,000
2,500
3,000
3,500
4,000
4,500
5,000
5,500
6,000
Operating profit in 2005 improved $1.100 billion, or 41 percent,from last year, driven by higher price realization and sales vol-ume, partially offset by higher core operating costs and retire-ment benefits.
Core operating costs rose $1.668 billion from 2004, primarilydue to a $1.296 billion increase in manufacturing costs. Approxi-mately two-thirds of the manufacturing cost increase was attri-butable to variable costs — primarily higher material costs andsupply chain-related inefficiencies. The remainder of the man-ufacturing cost increase was due to higher period manufactur-ing costs; the significant increase in Machinery and Enginessales volume was a key driver. For the year, period manufactur-ing costs increased 13 percent on a sales increase of 20 percent.
Non-manufacturing-related core operating costs were up$372 million — primarily the result of higher SG&A and R&D
expenses to support new product programs and growth. Full-year Machinery and Engines SG&A as a percent of sales declinedfrom 9.0 percent to 8.2 percent but was up $176 million in 2005versus 2004, excluding the impact of currency and retirementbenefits. Full-year Machinery and Engines R&D as a percent ofsales declined from 3.3 percent to 3.2 percent but was up $138 mil-lion in 2005 versus 2004, excluding the impact of currency andretirement benefits.
Full-year Machinery and Engines Other Operating Costs wereup $58 million. This was due primarily to about $70 million incharges related to our dealer distribution support software and theglobal telehandler alliance that was announced in the fourth quar-ter of 2005.
Operating Profit by Principal Line of Business
Change Change(Millions of dollars) 2005 2004 $ %
Machinery(1) . . . . . . . . . . . . . . . . . . . . . . . . . . . . . . . . . . . . . . . . . . . . . . . . . . . . . . . . . . . . . . . . . . . . . $ 2,431 $ 1,756 $ 675 38%Engines(1). . . . . . . . . . . . . . . . . . . . . . . . . . . . . . . . . . . . . . . . . . . . . . . . . . . . . . . . . . . . . . . . . . . . . . . . . 1,071 589 482 82%Financial Products . . . . . . . . . . . . . . . . . . . . . . . . . . . . . . . . . . . . . . . . . . . . . . . . . . . . . . . . . . . . . . 531 470 61 13%Consolidating Adjustments. . . . . . . . . . . . . . . . . . . . . . . . . . . . . . . . . . . . . . . . . . . . . . . . . . . . (249) (131) (118)_______ _______ _______Consolidated Operating Profit . . . . . . . . . . . . . . . . . . . . . . . . . . . . . . . . . . . . . . . . . . . . . . . . . $ 3,784 $ 2,684 $ 1,100 41%_______ _______ ______________ _______ _______(1) Caterpillar operations are highly integrated; therefore, the company uses a number of allocations to determine lines of business operating profit for Machinery and Engines.

MANAGEMENT’S DISCUSSION AND ANALYSIS continued
A-42
Machinery operating profit of $2.431 billion was up $675 mil-lion, or 38 percent, from 2004. The favorable impact of improvedprice realization and higher sales volume was partially offset byhigher core operating costs and higher retirement benefits.Engines operating profit of $1.071 billion was up $482 million,or 82 percent, from 2004. The favorable impact of improvedprice realization and higher sales volume was partially offset byhigher core operating costs and higher retirement benefits.Financial Products operating profit of $531 million was up$61 million, or 13 percent, from 2004. The increase was primarilydue to $123 million favorable impact from the continued growthof earning assets at Cat Financial. Partially offsetting this increasewere $33 million in higher operating expenses, primarily relatedto growth at Cat Financial and a $28 million decrease in operatingprofit at Cat Insurance, primarily due to less favorable insurancereserve adjustments in 2005 than in 2004.
OTHER PROFIT/LOSS ITEMSOther income/expense was income of $377 million comparedwith income of $253 million in 2004. The improvement was dueto the favorable impact of currency, higher interest income andthe absence of a number of expense items incurred during 2004that were individually not significant.The provision for income taxes in 2005 reflects an annual taxrate of 29.5 percent, excluding the discrete items discussed below,and compares to a 27 percent rate in 2004. The increase is primar-ily due to a reduction in our Extraterritorial Income Exclusion(ETI) benefits, partially attributable to the impact of the AmericanJobs Creation Act (AJCA) permitting only 80 percent of ETI bene-fits in 2005 and to a change in our geographic mix of profits.
During 2005, we repatriated earnings of $1.4 billion, whichincludes approximately $500 million subject to preferential taxtreatment allowed by the AJCA. We recognized a charge of$33 million related to this repatriation. In connection with ourcurrent repatriation plan, we changed our intention of repatriatingearnings for a few selected non-U.S. subsidiaries and recognizedan income tax benefit of $38 million. In addition, we recognizedan income tax benefit of $26 million from the settlement of several
non-U.S. tax issues. The net impact of these items is a $31 milliondiscrete benefit to our 2005 provision for income taxes.
Supplemental Information(Millions of dollars) 2005 2004 2003Identifiable Assets:
Machinery . . . . . . . . . . . . . . . . . . . . . $ 14,877 $ 13,717 $ 11,806Engines . . . . . . . . . . . . . . . . . . . . . . . . 9,110 8,552 7,645Financial Products . . . . . . . . . . . . 27,052 24,612 20,972Consolidating Adjustments. . . (3,970) (3,786) (3,712)_______ _______ _______
Total. . . . . . . . . . . . . . . . . . . . . . . . . . $ 47,069 $ 43,095 $ 36,711_______ _______ ______________ _______ _______Capital Expenditures:
Machinery . . . . . . . . . . . . . . . . . . . . . $ 685 $ 546 $ 386Engines . . . . . . . . . . . . . . . . . . . . . . . . 426 297 278Financial Products . . . . . . . . . . . . 1,304 1,271 1,101_______ _______ _______
Total. . . . . . . . . . . . . . . . . . . . . . . . . . $ 2,415 $ 2,114 $ 1,765_______ _______ ______________ _______ _______Depreciation and Amortization:
Machinery . . . . . . . . . . . . . . . . . . . . . $ 476 $ 442 $ 453Engines . . . . . . . . . . . . . . . . . . . . . . . . 359 353 345Financial Products . . . . . . . . . . . . 642 602 549_______ _______ _______
Total. . . . . . . . . . . . . . . . . . . . . . . . . . $ 1,477 $ 1,397 $ 1,347_______ _______ ______________ _______ _______Caterpillar operations are highly integrated; therefore, the company uses a number of alloca-tions to determine lines of business financial data.
UAW LABOR AGREEMENTIn January 2005 the company and about 9,000 employees rep-resented by the United Auto Workers reached a new six-year laboragreement that will expire on March 1, 2011. This agreementpositions the company and all our employees for long-term com-petitiveness. While the initial impact was about a $100 millionincrease in retirement benefits in 2005, with the establishment ofa very competitive market-based new hire wage package, theintroduction of employee and retiree health care cost-sharing andother operational effectiveness improvements, we believe wehave a long-term cost structure that enables us to compete fromour traditional manufacturing and logistics locations.
Sales and Revenues by Geographic Region
% North % % Latin % Asia/ %(Millions of dollars) Total Change America Change EAME Change America Change Pacific Change
Fourth Quarter 2005Machinery. . . . . . . . . . . . . . $ 5,857 14% $ 3,375 )21)% $ 1,238 (3)% $ 465 4% $ 779 20%Engines(1) . . . . . . . . . . . . . . . 3,184 10% 1,162 (4)% 1,130 (18)% 347 26% 545 19%Financial Products(2) . . . 622 18% 447 )23)% 85 (3)% 43 26% 47 21%_______ _______ _______ _______ _______
$ 9,663 13% $ 4,984 )14)% $ 2,453 ) 6)% $ 855 13% $ 1,371 20%_______ _______ _______ _______ ______________ _______ _______ _______ _______Fourth Quarter 2004Machinery. . . . . . . . . . . . . . $ 5,157 $ 2,783 $ 1,279 $ 447 $ 648Engines(1) . . . . . . . . . . . . . . . 2,902 1,213 955 276 458Financial Products(2) . . . 525 364 88 34 39_______ _______ _______ _______ _______
$ 8,584 $ 4,360 $ 2,322 $ 757 $ 1,145_______ _______ _______ _______ ______________ _______ _______ _______ _______(1) Does not include internal engine transfers of $458 million and $420 million in 2005 and 2004, respectively. Internal engines transfers are valued at prices comparable to those for unrelated parties.(2) Does not include revenues earned from Machinery and Engines of $93 million and $57 million in 2005 and 2004, respectively.
FOURTH QUARTER 2005 COMPARED WITH FOURTH QUARTER 2004

Caterpillar Inc.
A-43
SALES AND REVENUES
The chart above graphically illustrates reasons for the change in Consolidated Sales and Revenues between Fourth Quarter 2004 (at left) and Fourth Quarter 2005(at right). Items favorably impacting sales and revenues appear as upward stair steps with the corresponding dollar amounts above each bar, while items negativelyimpacting sales and revenues appear as downward stair steps with the corresponding dollar amount in parentheses above each bar. Caterpillar management utilizesthese charts internally to visually communicate with its Board and employees.
5,000
6,000
7,000
8,000
9,000
10,000
11,000
Mill
ions
of $
Fourth Quarter2004 Sales &
Revenues
MachineryVolume
287
EnginesVolume
176
PriceRealization
604
Currency
(85)
FinancialProductsRevenues
97
Fourth Quarter2005 Sales &
Revenues
9,663
Consolidated Sales and Revenues ComparisonFourth Quarter 2005 vs. Fourth Quarter 2004
8,584
Sales and revenues for the fourth quarter of 2005 were $9.663 bil-lion, up $1.079 billion, or 13 percent, from fourth quarter 2004.Price realization improved $604 million, Machinery volume wasup $287 million, Engines volume was up $176 million and cur-rency had an unfavorable impact on sales of $85 million due pri-marily to a weaker euro compared with fourth quarter 2004. Inaddition, Financial Products revenues increased $97 million.
Machinery sales in fourth quarter 2005 were $5.857 billion, anincrease of $700 million, or 14 percent, from fourth quarter 2004.Price realization accounted for $456 million of the increase, salesvolume added $287 million and currency had an unfavorableimpact of $43 million.
Dealers reported continued strong gains in deliveries to endusers in most regions and industries. Dealers added much lessto inventories than in the fourth quarter 2004. Worldwide machineinventories in months of deliveries, as reported by dealers, werelower than a year earlier.
• North America sales were up $592 million, or 21 percent, fromfourth quarter 2004; price realization increased $308 millionand sales volume added $284 million. The growth in sales vol-ume resulted from increased sales through our dealer networkdue to continued good growth in dealer deliveries from a yearearlier when activity benefited from the ending of depreciationincentives in the United States. Low long-term interest rates,good corporate profits and passage of a highway bill in theUnited States boosted construction spending. Higher metalsand coal prices supported investment in mining.
• EAME sales decreased 3 percent, or $41 million, comparedto fourth quarter 2004. Currency unfavorably impacted sales
by $62 million, and sales volume declined $50 million. Theseitems were partially offset by $71 million of improved pricerealization. Dealers reduced inventories much more in fourthquarter 2005 than they did in the fourth quarter 2004, morethan offsetting good growth in reported deliveries. The declinein sales volume was largely in Europe, where the economyjust started to show some improvement in the last half of theyear. Sales volume in Africa/Middle East increased signifi-cantly in response to higher commodity prices, particularly oil.
• Latin America sales rose $18 million, or 4 percent, from thesame quarter last year — $35 million from improved price real-ization and $16 million from the impact of currency. These itemswere partially offset by a $33 million decline in sales volume,the result of dealers not building inventory as they did last year.Both construction and mining continued to do well in mostcountries.
• Asia/Pacific sales were 20 percent, or $131 million, higher thanlast year — $86 million from higher volume, $42 million fromimproved price realization and the remaining $3 million dueto currency. The growth in sales volume occurred largely inChina, where sales through our dealer network continued torecover from last year’s sharp decline.
Engines sales were $3.184 billion in fourth quarter 2005 — up10 percent from the fourth quarter 2004. Sales volume accountedfor 6 percent of the increase, while price realization accountedfor 5 percent partially offset by a 1 percent unfavorable impactof currency on sales.
Dealer engine inventory increased during both fourth quarter2005 and fourth quarter 2004. The 2005 inventory increase was

less than the 2004 increase, which slightly reduced the com-pany’s quarter-over-quarter sales growth. Months of inventoryrelative to deliveries declined in most regions and sectors com-pared to fourth quarter 2004.
• North America sales were down 4 percent. Sales of petroleumengines increased 32 percent, primarily from increased salesof reciprocating engines to support gas drilling and compres-sion, supported by high gas prices and well service and fracapplications. Sales of electric power engines increased 20 per-cent, with widespread demand for reciprocating generator setsto support data center and non residential construction activ-ity. Sales of marine engines were up 32 percent, primarily dueto increased workboat activity driven by high petroleum demand.Sales of on-highway truck engines decreased 26 percent, withthe majority of the reduction due to truck original equipmentmanufacturers’ (OEM) decisions to reduce finished engineinventory holdings as engine availability improved.
• EAME sales increased 18 percent. Sales of engines into the elec-tric power sector were up 17 percent, with widespread growth indemand for reciprocating generator sets partially offset by reduceddemand for turbines and turbine-related services. Sales of petrol-eum engines increased 57 percent, primarily due to increasedturbine sales to support oil production in Africa. Sales of enginesto the industrial sector declined 10 percent with reduced demandfor agricultural equipment and some impact from verticalengine integration. Sales of marine engines declined 13 per-cent, driven by reduced demand for oceangoing vessel engines.
• Latin America sales were up 26 percent. Sales of petroleumengines increased 89 percent from increased sales of turbinesand turbine-related services to support increased investmentin oil production. Sales of electric power engines doubled dueto increased sales of power plant projects and widespreaddemand for small standby generator sets. Sales of industrialengines declined 47 percent with reduced demand for enginesfor agricultural equipment. Sales of marine engines declined38 percent, impacted by shipyard capacity.
• Asia/Pacific sales were up 19 percent. Sales of engines tothe petroleum sector were up 13 percent, primarily due to drillrig power applications to support oil production. Sales of indus-trial engines increased 59 percent with increased marketpreference for Caterpillar engines. Sales of marine enginesremained about flat as full shipyard order books partially influ-enced demand for oceangoing engines. Sales of electric powerengines dropped 18 percent, primarily due to reduced demandin China for generator sets to support electricity reliability andavailability.
Financial Products revenues were $622 million, up $97 mil-lion, or 18 percent, from fourth quarter 2004. The increase wasdue primarily to a $43 million favorable impact from continuedgrowth of Earning Assets at Cat Financial and a $33 million impactof higher interest rates on new and existing finance receivablesat Cat Financial. Also, there was a $19 million increase in revenuesat Cat Insurance due primarily to an increase in earned premiums.
MANAGEMENT’S DISCUSSION AND ANALYSIS continued
A-44
OPERATING PROFIT
The chart above graphically illustrates reasons for the change in Consolidated Operating Profit between Fourth Quarter 2004 (at left) and Fourth Quarter 2005(at right). Items favorably impacting operating profit appear as upward stair steps with the corresponding dollar amounts above each bar, while items negativelyimpacting operating profit appear as downward stair steps with dollar amounts reflected in parentheses above each bar. Caterpillar management utilizes thesecharts internally to visually communicate with its Board and employees.
Mill
ions
of $
FourthQuarter
2004Operating
Profit
683
SalesVolume
203
PriceRealization
604
Currency
20
CoreOperating
Costs
(400)
RetirementBenefits
(35)
FinancialProducts
29
ConsolidatingAdjustments
(37)
FourthQuarter
2005Operating
Profit
1,067
Consolidated Operating Profit ComparisonFourth Quarter 2005 vs. Fourth Quarter 2004
0
200
400
600
800
1,000
1,200
1,400
1,600

Caterpillar Inc.
A-45
Fourth-quarter operating profit improved $384 million, or 56 per-cent, over a year ago, driven by higher price realization, salesvolume and the favorable impact of currency.
Partially offsetting the favorable items were $400 million inhigher core operating costs and $35 million of higher retirementbenefits. Manufacturing costs represented $225 million of thetotal increase in core operating costs. Approximately two-thirdsof the manufacturing cost increase was due to an increase inperiod manufacturing costs associated with building our prod-ucts. Period manufacturing costs increased 17 percent, or approx-imately $150 million. The majority of the increase resulted fromcosts incurred to support 12 percent higher sales. These includeitems such as repair and maintenance and factory rearrangement.
The increase also includes costs not directly related to changesin volume, such as depreciation and manufacturing process engi-neering to support new product introduction.
The remainder of the manufacturing cost increase wasattributable to variable cost increases resulting from volume-related inefficiencies due to operating at near capacity levels inmany of our facilities.
Non-manufacturing-related core operating costs were up$175 million — a result of higher SG&A and R&D expenses tosupport product programs and the growth in volume. Also includedin this amount was about $70 million of charges related to changesin our dealer distribution support software and the global tele-handler alliance that was announced in the fourth quarter of 2005.
Operating Profit by Principal Line of Business
Fourth FourthQuarter Quarter Change Change
(Millions of dollars) 2005 2004 $ %
Machinery(1) . . . . . . . . . . . . . . . . . . . . . . . . . . . . . . . . . . . . . . . . . . . . . . . . . . . . . . . . . . . . . . . . . . . . . $ 644 $ 366 $ 278 76%Engines(1). . . . . . . . . . . . . . . . . . . . . . . . . . . . . . . . . . . . . . . . . . . . . . . . . . . . . . . . . . . . . . . . . . . . . . . . . 358 244 114 47%Financial Products . . . . . . . . . . . . . . . . . . . . . . . . . . . . . . . . . . . . . . . . . . . . . . . . . . . . . . . . . . . . . . 142 113 29 26%Consolidating Adjustments . . . . . . . . . . . . . . . . . . . . . . . . . . . . . . . . . . . . . . . . . . . . . . . . . . . . (77) (40) (37)_______ _______ _______Consolidated Operating Profit . . . . . . . . . . . . . . . . . . . . . . . . . . . . . . . . . . . . . . . . . . . . . . . . . $ 1,067 $ 683 $ 384 56%_______ _______ ______________ _______ _______(1) Caterpillar operations are highly integrated; therefore, the company uses a number of allocations to determine lines of business operating profit for Machinery and Engines.
Machinery operating profit of $644 million was up $278 million,or 76 percent, from fourth quarter 2004. The favorable impact ofimproved price realization and higher sales volume was partiallyoffset by higher core operating costs and higher retirement benefits.
Engines operating profit of $358 million was up $114 million,or 47 percent, from fourth quarter 2004. The favorable impact ofimproved price realization and higher sales volume was partiallyoffset by higher core operating costs and higher retirement benefits.
Financial Products operating profit of $142 million was up$29 million, or 26 percent, from fourth quarter 2004. The increasewas primarily due to a $26 million impact from the continuedgrowth of Earning Assets at Cat Financial.
OTHER PROFIT/LOSS ITEMSOther income/expense was income of $99 million comparedwith income of $82 million in fourth quarter 2004. The improve-ment was due to a reserve adjustment related to the terminationof certain capital lease obligations, higher interest income andthe absence of a number of expense items incurred during the
fourth quarter of 2004 that were individually insignificant. Theseitems were partially offset by the unfavorable impact of currency.
The provision for income taxes in the fourth quarter reflectsan estimated annual tax rate of 29.5 percent as compared to a27 percent rate in 2004. The increase is primarily due to a reductionin our Extraterritorial Income Exclusion (ETI) benefits, partiallyattributable to the impact of the American Jobs Creation Act(AJCA) permitting only 80 percent of ETI benefits in 2005 andalso to a change in our geographic mix of profits. A favorableadjustment of $14 million was recorded this quarter related tothe first nine months of 2005 as a result of a decrease in the esti-mated annual tax rate from 30 to 29.5 percent, primarily due tobetter than expected ETI benefits. Our estimated annual tax rateexcludes the impact of the discrete benefits discussed below.
The fourth quarter 2005 provision for income taxes also includesa discrete benefit of $42 million resulting from a $26 millionbenefit from the settlement of several non-U.S. tax issues and a$16 million decrease in our charge for earnings repatriation underthe provisions of the AJCA.

MANAGEMENT’S DISCUSSION AND ANALYSIS continued
A-46
SALES AND REVENUES
The chart above graphically illustrates reasons for the change in Consolidated Sales and Revenues between 2003 (at left) and 2004 (at right). Items favorablyimpacting sales and revenues appear as upward stair steps with the corresponding dollar amounts above each bar. Caterpillar management utilizes these chartsinternally to visually communicate with its Board and employees.
21,000
23,000
25,000
27,000
29,000
31,000
Mill
ions
of $
2003 Sales &Revenues
MachineryVolume
4,465
EnginesVolume
1,796
PriceRealization
512
Currency
515
FinancialProductsRevenues
211
2004 Sales &Revenues
30,306
Consolidated Sales and Revenues Comparison2004 vs. 2003
22,807
Sales and Revenues by Geographic Region
% North % % Latin % Asia/ %(Millions of dollars) Total Change America Change EAME Change America Change Pacific Change
2004Machinery. . . . . . . . . . . . . . $18,844 38% $10,337 41% $ 4,511 25% $ 1,510 63% $ 2,486 35%Engines(1) . . . . . . . . . . . . . . . 9,492 29% 4,184 30% 2,994 27% 862 9% 1,452 45%Financial Products(2) . . . 1,970 12% 1,384 12% 338 8% 118 — 130 43%_______ _______ _______ _______ _______
$30,306 33% $15,905 35% $ 7,843 25% $ 2,490 35% $ 4,068 39%_______ _______ _______ _______ ______________ _______ _______ _______ _______2003Machinery. . . . . . . . . . . . . . $13,678 $ 7,310 $ 3,596 $ 928 $ 1,844Engines(1) . . . . . . . . . . . . . . . 7,370 3,222 2,356 793 999Financial Products(2) . . . 1,759 1,237 313 118 91_______ _______ _______ _______ _______
$22,807 $11,769 $ 6,265 $ 1,839 $ 2,934_______ _______ _______ _______ ______________ _______ _______ _______ _______(1) Does not include internal engine transfers of $1,745 million and $1,358 million in 2004 and 2003, respectively. Internal engines transfers are valued at prices comparable to those for unrelated parties.(2) Does not include revenues earned from Machinery and Engines of $199 million and $194 million in 2004 and 2003, respectively.
2004 COMPARED WITH 2003

Caterpillar Inc.
A-47
Sales and revenues for 2004 were $30.31 billion, $7.50 billionor 33 percent higher than 2003. The increase was due to higherMachinery and Engines volume of $6.26 billion, the favorableimpact of currency on sales of $515 million due primarily to thestrengthening euro and British pound, improved price realiza-tion of $512 million and higher Financial Products revenues of$211 million.
Machinery sales were $18.84 billion in 2004, a $5.17 billion or38 percent increase over 2003. Sales volume, up 33 percent from2003, accounted for most of the gain. Improved price realiza-tion added about 3 percent and the favorable impact of currencyaccounted for the remaining 2 percent. The volume increase wasthe result of a 28 percent increase in dealer deliveries to end usersand an increase in dealer inventories to meet future demand.Dealers carried about the same months of sales in inventory atthe end of 2004 as they did at the end of 2003.
In North America, 2004 sales were 41 percent higher than in2003. Volume increased 37 percent. The rest of the gain resultedfrom improved price realization. Volume benefited from a 33 per-cent increase in dealer deliveries, with sizable gains occurringin most applications. Low interest rates, higher commodity pricesand accelerated depreciation provisions all encouraged users toreplace existing machines and increase fleet sizes. EAME salesrose 25 percent, with about 16 percent coming from more volume,about 7 percent due to the favorable impact of a stronger euro andthe remainder due to improved price realization. Half the volumegrowth occurred in Europe, where low interest rates contributedto some recovery in construction. Volume increased in bothAfrica/Middle East (AME) and the CIS, largely due to highermetals and energy prices. Sales in Latin America increased63 percent, the fastest growth of any region. Volume surgedabout 55 percent, improved price realization contributed about7 percent with the remainder due to currency. Dealers delivered56 percent more machines to end users and built inventories evenfaster to accommodate the steep recovery in activity. The Asia/Pacific region had a 35 percent increase in sales in 2004, pri-marily due to volume. Volume declined in China, but this wasmore than offset by large gains in Australia, Indonesia and India.Dealer deliveries into coal mining, benefiting from higher coalprices, increased sharply in all three countries.
Engines sales were $9.49 billion, an increase of $2.12 billion or29 percent from 2003. Sales volume was up about 24 percent, thefavorable impact of currency accounted for about 3 percent andthe remainder was due to improved price realization.
Engine sales increased substantially in all regions. The NorthAmerica engine sales gain of 30 percent was driven primarilyby a 37 percent increase in sales of on-highway truck engines,as strong freight demand and improved industry financial healthdrove expansion and replacement. Sales of engines to the electricpower sector increased 25 percent compared to 2003, benefiting
from increased demand for quality power, and growth in non-residential construction and business investment. Sales of enginesto the industrial sector rose 62 percent, with strong widespreaddemand from industrial Original Equipment Manufacturer (OEM)products and growing preference for Caterpillar engines. Sales ofmarine engines increased 20 percent primarily from healthy demandfor pleasure craft engines. Sales of petroleum engines remainedabout flat compared to 2003, as strong demand for reciprocatingengines to maximize existing production was slightly more thanoffset by reduced investment in turbines and turbine related ser-vices for pipeline and major infrastructure expansion. Engine salesrose 27 percent in EAME with strong increases in all sectors.Sales of engines into the electric power sector increased 54 percentdue to stronger demand for prime and cogeneration systems,Middle Eastern demand for large engines and power modules,and favorable currency versus euro-based competition. Sales ofengines to the petroleum sector increased 29 percent, with thevast majority of the increase coming from sales of turbines andturbine-related services to support increases in petroleum invest-ment. Sales of engines to the marine sector increased 27 percentdue to increased investment in oceangoing and workboat vessels,driven by higher demand for inland waterway transportation andstrengthening oceangoing vessel lease rates. Sales of engines intothe industrial sector increased 10 percent. Engine sales in LatinAmerica increased 9 percent with gains in most sectors from animproved business investment climate. Sales of petroleum enginesin Latin America increased 16 percent with increased demandfor turbines and turbine related services for pipeline applications.Sales of electric power engines in Latin America decreased 27 per-cent, primarily due to the absence of a large turbine electric powerproject that occurred during 2003. Widespread economic growthin Asia/Pacific contributed to the 45 percent increase in enginesales. Sales of engines into the electric power sector nearly doubledas strong growth drove increased demand for commercial standbyand self-generation, as well as for generator sets to support ongoingdemand from transmission shortages in China. Sales of petroleumengines increased 30 percent as growth in exploration and pro-duction drove strong demand for turbines and turbine relatedservices. Sales of engines to the marine sector increased 48 per-cent due to increased demand for dredge equipment in supportof construction growth, as well as broad increases in demand foroffshore supply boats, pleasure craft and oceangoing vessels.
Financial Products revenues were $1.97 billion, an increase of$211 million or 12 percent from 2003. The increase was due pri-marily to a $228 million favorable impact at Cat Financial fromcontinued growth of Earning Assets, partially offset by a $60 mil-lion impact of lower interest rates on new and existing financereceivables. Also, there was a $19 million increase in earned pre-miums at Cat Insurance and a $14 million increase in electricplant revenue at Cat Power Ventures.

MANAGEMENT’S DISCUSSION AND ANALYSIS continued
A-48
OPERATING PROFIT
The chart above graphically illustrates reasons for the change in Consolidated Operating Profit between 2003 (at left) and 2004 (at right). Items favorably impactingoperating profit appear as upward stair steps with the corresponding dollar amounts above each bar, while items negatively impacting operating profit appear asdownward stair steps with dollar amounts reflected in parenthesis above each bar. Caterpillar management utilizes these charts internally to visually communicatewith its Board and employees.
Mill
ions
of $
2003Operating
Profit
1,670
SalesVolume
1,808
PriceRealization
512
Currency
(232)
CoreOperating
Costs
(1,130)
NCPs
153
RetirementBenefits
(139)
FinancialProducts
77
ConsolidatingAdjustments
(35)
2004Operating
Profit
2,684
Consolidated Operating Profit Comparison2004 vs. 2003
1,000
1,500
2,000
2,500
3,000
3,500
4,000
Higher sales volume in all regions resulted in a favorable operat-ing profit impact of $1.81 billion. Operating profit was alsofavorably impacted by improved price realization of $512 mil-lion, the absence of $153 million of Non-Conformance Penalties(NCPs) that were recorded in 2003 and improved profitability ofFinancial Products of $77 million.
Partially offsetting the favorable items were $1.13 billion inhigher core operating costs, a $232 million unfavorable impactof currency on operating profit due primarily to the weakeningof the dollar compared with the British pound and the Japaneseyen and $139 million of higher retirement benefits.
Our main focus throughout 2004 was to satisfy unprecedentedcustomer demand despite incurring additional core operating costs
to respond to the steep market upturn. The additional core oper-ating costs reflect increases in manufacturing costs and highergeneral support costs to meet demand. These additional manufac-turing costs included higher material costs resulting primarilyfrom steel related and commodity price increases and higher freightand expediting costs to ensure timely delivery of material. Theremainder of the core operating cost increase is largely attrib-utable to higher SG&A expense to support growth and develop-ment programs, planned spending on product development, higherincentive compensation costs as well as increased warrantyexpense. These unfavorable items were partially offset by ongo-ing cost reductions resulting from hundreds of 6 Sigma projects.
Machinery operating profit of $1.76 billion was up $557 mil-lion, or 46 percent, from 2003. The favorable impact of highersales volume and improved price realization was partially offsetby higher core operating costs (as outlined above), the unfavor-able impact of currency and higher retirement benefits.
Engines operating profit of $589 million was up $406 million,or 222 percent, from 2003. The favorable impact of higher salesvolume, the absence of NCPs and improved price realization werepartially offset by higher core operating costs (as outlined above),higher retirement benefits and the unfavorable impact of currency.
Operating Profit by Principal Line of BusinessChange Change
(Millions of dollars) 2004 2003 $ %
Machinery(1) . . . . . . . . . . . . . . . . . . . . . . . . . . . . . . . . . . . . . . . . . . . . . . . . . . . . . . . . . . . . . . . . . . . . . $ 1,756 $ 1,199 $ 557 46%Engines(1). . . . . . . . . . . . . . . . . . . . . . . . . . . . . . . . . . . . . . . . . . . . . . . . . . . . . . . . . . . . . . . . . . . . . . . . . 589 183 406 222%Financial Products . . . . . . . . . . . . . . . . . . . . . . . . . . . . . . . . . . . . . . . . . . . . . . . . . . . . . . . . . . . . . . 470 393 77 20%Consolidating Adjustments . . . . . . . . . . . . . . . . . . . . . . . . . . . . . . . . . . . . . . . . . . . . . . . . . . . . (131) (105) (26)_______ _______ _______Consolidated Operating Profit . . . . . . . . . . . . . . . . . . . . . . . . . . . . . . . . . . . . . . . . . . . . . . . . . $ 2,684 $ 1,670 $ 1,014 61%_______ _______ ______________ _______ _______(1) Caterpillar operations are highly integrated; therefore, the company uses a number of allocations to determine lines of business operating profit for Machinery and Engines.

Caterpillar Inc.
A-49
Financial Products operating profit of $470 million was up$77 million, or 20 percent, from 2003. The increase was primar-ily due to a $105 million impact from the growth of earning assetsand a $45 million increase in underwriting income ($26 milliondue to favorable reserve adjustments resulting from better thananticipated claim experience; remainder due to growth) at CatInsurance. These favorable items were partially offset by a$39 million increase in operating expenses at Cat Financial pri-marily related to increased labor costs to support growth in earn-ing assets and a $34 million impact of lower interest spreads.
OTHER PROFIT/LOSS ITEMSInterest expense excluding Financial Products was $16 mil-lion lower compared to 2003 primarily due to lower average bor-rowing rates.
Other income/expense was income of $253 million comparedwith income of $53 million in 2003 for a favorable impact of$200 million. The change was primarily due to the favorableimpact of Machinery and Engines currency gains of $75 million,the absence of a $55 million bond retirement charge recorded inthe third quarter 2003 and the absence of investment impair-ments at Cat Insurance of $27 million.
The provision for income taxes for both 2003 and 2004 reflects aneffective annual tax rate of 27 percent. A change in our geographicmix of profits was offset by the benefit related to the tax exemptfederal subsidy provided by the Medicare Prescription Drug,Improvement and Modernization Act of 2003 in accordance withFASB Staff Position 106-2.
The equity in profit/loss of unconsolidated affiliated companiesfavorably impacted profit by $39 million over 2003, primarilydriven by increased profitability at Shin Caterpillar MitsubishiLtd. (SCM). The increase in profitability at SCM was drivenlargely by increased exports.
GLOSSARY OF TERMS1. Consolidating Adjustments — Eliminations of transactions
between Machinery and Engines and Financial Products.
2. Core Operating Costs — Machinery and Engines variablemanufacturing cost change adjusted for volume and changein period costs. Excludes the impact of currency and retire-ment benefits for periods comparing 2005 to 2004 and 2004to 2003. For periods comparing 2006 to 2005, excludes theimpact of currency and stock-based compensation.
3. Currency — With respect to sales and revenues, currency rep-resents the translation impact on sales resulting from changesin foreign currency exchange rates versus the U.S. dollar.With respect to operating profit, currency represents the nettranslation impact on sales and operating costs resultingfrom changes in foreign currency exchange rates versus theU.S. dollar. Currency includes the impacts on sales and oper-ating profit for the Machinery and Engines lines of businessonly; currency impacts on Financial Products revenues andoperating profit are included in the Financial Products por-tions of the respective analyses. With respect to other income/expense, currency represents the effects of forward and optioncontracts entered into by the company to reduce the risk offluctuations in exchange rates and the net effect of changes
in foreign currency exchange rates on our foreign currencyassets and liabilities for consolidated results.
4. EAME — Geographic region including Europe, Africa, theMiddle East and the Commonwealth of Independent States(CIS).
5. Earning Assets — These assets consist primarily of totalfinance receivables net of unearned income, plus retainedinterests in securitized trade receivables, plus equipment onoperating leases, less accumulated depreciation at CatFinancial.
6. Engines — A principal line of business including the design,manufacture, marketing and sales of engines for Caterpillarmachinery, electric power generation systems; on-highwayvehicles and locomotives; marine, petroleum, construction,industrial, agricultural and other applications; and relatedparts. Reciprocating engines meet power needs ranging from5 to 21,500 horsepower (4 to over 16 000 kilowatts).Turbines range from 1,600 to 20,500 horsepower (1 200 to15 000 kilowatts).
7. Financial Products — A principal line of business consist-ing primarily of Caterpillar Financial Services Corporation (CatFinancial), Caterpillar Insurance Holdings, Inc. (Cat Insurance),Caterpillar Power Ventures Corporation (Cat Power Ventures)and their respective subsidiaries. Cat Financial provides awide range of financing alternatives to customers and dealersfor Caterpillar machinery and engines, Solar gas turbines, aswell as other equipment and marine vessels. Cat Financialalso extends loans to customers and dealers. Cat Insuranceprovides various forms of insurance to customers and dealersto help support the purchase and lease of our equipment.Cat Power Ventures is an active investor in independent powerprojects using Caterpillar power generation equipment andservices.
8. Latin America — Geographic region including the Centraland South American countries and Mexico.
9. Machinery — A principal line of business which includesthe design, manufacture, marketing and sales of construction,mining and forestry machinery — track and wheel tractors,track and wheel loaders, pipelayers, motor graders, wheeltractor-scrapers, track and wheel excavators, backhoe loaders,log skidders, log loaders, off-highway trucks, articulated trucks,paving products, telehandlers, skid steer loaders and relatedparts. Also includes logistics services for other companies.
10. Machinery and Engines — Due to the highly integratednature of operations, represents the aggregate total of theMachinery and Engines lines of business and includes pri-marily our manufacturing, marketing and parts distributionoperations.
11. Manufacturing Costs — Manufacturing costs representthe volume-adjusted change for variable costs and the abso-lute dollar change for period manufacturing costs. Variablemanufacturing costs are defined as having a direct relation-ship with the volume of production. This includes materialcosts, direct labor and other costs that vary directly with pro-duction volume such as freight, power to operate machines,and supplies that are consumed in the manufacturing pro-cess. Period manufacturing costs support production but are

MANAGEMENT’S DISCUSSION AND ANALYSIS continued
A-50
defined as generally not having a direct relationship to short-term changes in volume. Examples include machine and equip-ment repair, depreciation on manufacturing assets, facilitysupport, procurement, factory scheduling, manufacturingplanning and operations management. Manufacturing costsexclude the impact of currency and retirement benefits forperiods comparing 2005 to 2004 and 2004 to 2003. For periodscomparing 2006 to 2005, excludes the impact of currencyand stock-based compensation.
12. Non-Conformance Penalties (NCP) — Pursuant to a con-sent decree Caterpillar and other engine manufacturers enteredinto with the United States Environmental Protection Agency(EPA), the company was required to meet certain emissionstandards by October 2002 for engines manufactured for on-highway use. Under the consent decree, an engine manufac-turer was required to pay a non-conformance penalty (NCP)to the EPA for each engine manufactured after October 1,2002 that did not meet the standards. The amount of the NCPwas based on how close to meeting the standards the enginecame — the more the engine was out of compliance, the higherthe penalty per engine.
13. Period Costs — Comprised of Machinery and Enginesperiod manufacturing costs, SG&A expense, R&D expenseand other operating costs. Excludes the impact of currencyand retirement benefits for periods comparing 2005 to 2004.For periods comparing 2006 to 2005, excludes the impact ofcurrency and stock-based compensation.
14. Price Realization — The impact of net price changes exclud-ing currency. Includes the impact of changes in the relativeweighting of sales between geographic regions.
15. Retirement Benefits — Cost of defined benefit pensionplans, defined contribution plans and retirement health careand life insurance.
16. Sales Volume — With respect to sales and revenues, salesvolume represents the impact of changes in the quantities soldfor machines, engines and parts. With respect to operatingprofit, sales volume represents the impact of changes in thequantities sold for machines, engines and parts combinedwith the net operating profit impact of changes in the rela-tive weighting of machines, engines and parts sales withrespect to total sales.
17. Stock-Based Compensation — As required by Statement ofFinancial Accounting Standard 123R, we will begin expens-ing stock-based compensation awards in 2006. We will adoptthis new guidance using the modified prospective method.Compensation cost is based on the fair value of the awardon the date of grant.
18. 6 Sigma — On a technical level, 6 Sigma represents a measureof variation that achieves 3.4 defects per million opportunities.At Caterpillar, 6 Sigma represents a much broader culturalphilosophy to drive continuous improvement throughout thevalue chain. It is a fact-based, data-driven methodology thatwe are using to improve processes, enhance quality, cut costs,grow our business and deliver greater value to our customersthrough Black Belt-led project teams. At Caterpillar, 6 Sigmagoes beyond mere process improvement; it has become theway we work as teams to process business information,solve problems and manage our business successfully.
19. 2010 Goals — The Company’s 2010 goals are a part of itsenterprise strategy to achieve its “Vision 2020”, which wasmade public on October 31, 2005. The 2010 goals are groupedunder the “3Ps” of people, performance, and profitable growth.The people goals include a highly engaged workforce and world-class safety. The performance goals are related to quality andmarket leadership and product and service parts availability.Profitable growth goals include the 2010 sales and revenuestarget and a goal for earnings per share growth.
LIQUIDITY AND CAPITAL RESOURCES
Sources of fundsWe generate our capital resources primarily through operationsand, in 2004, through collections of certificated retained interestsin trade receivables. Collections of certificated retained intereststook place when Machinery and Engines sold certain trade receiv-ables to Cat Financial, who would place them into a securitiza-tion trust and then sell a portion to third party purchasers. Forthe receivables retained by the trust, Cat Financial would receivean interest in the trust assets (certificated retained interests).Subsequent collections of these retained interests were reflectedas an investing activity in our Consolidated Statement of CashFlow. From September 2004 through May 2005, the trust wasconsolidated, and in June 2005 the trust was terminated. We there-fore did not have collections of certificated retained interests intrade receivables after August 2004.
In 2005, operating cash flow was $3.11 billion. In 2004, oper-ating cash flow was negative $3.99 billion and collections of cer-tificated retained interests in trade receivables were $5.72 billiontotaling positive $1.73 billion. The increase in the total of thesesources of funds from $1.73 billion in 2004 to $3.11 billion in2005 is the result of higher profitability and lower working cap-ital requirements in 2005. See further discussion underMachinery and Engines and Financial Products. We anticipatethat the majority of future capital resource requirements will befunded by operating cash flow, which is largely sourced fromprofits. See our Outlook on page A-61.
Total debt as of December 31, 2005, was $25.75 billion, anincrease of $2.22 billion from year-end 2004. Debt related toMachinery and Engines increased $166 million, primarily to sup-port the stock repurchase program and the payment of dividends.On September 13, 2005, $116 million of 9.375 percent deben-tures due in 2021 and $117 million of 8.00 percent debenturesdue in 2023 were exchanged for $307 million of 5.30 percentdebentures due in 2035 and $23 million of cash. Additionally,capital lease obligations in the amount of $565 million were paidin the fourth quarter of 2005 and a related security deposit of$530 million was released and reclassified from Other assets toCash and short-term investments in the Consolidated Statementof Financial Position. Debt related to Financial Products increased$2.05 billion due to growth at Cat Financial.
We have three global credit facilities with a syndicate of bankstotaling $5.75 billion available in the aggregate to both Machineryand Engines and Financial Products to support commercial paperprograms. A five-year facility of $1.63 billion expires in 2010, afive-year facility of $2.5 billion expires in 2009 and a 364-day facilityof $1.63 billion expires in September 2006. The facility expiring in

Caterpillar Inc.
A-51
2006 has a provision that allows Caterpillar or Cat Financial toobtain a one-year loan that would mature in September 2007.Based on management’s allocation decision, which can be revisedat any time, the portion of the facility available to Cat Financialat December 31, 2005 was $5.15 billion. As part of the 2005 globalcredit facilities renewal, Cat Financial’s year-end leveragecovenant has been increased to 8.5:1, from the previous level of8:1, which aligns it with the 8.5:1 six-month moving averageleverage covenant. At December 31, 2005, there were no bor-rowings under these lines and Cat Financial was in compliancewith all debt covenants. Our total credit commitments as ofDecember 31, 2005 were:
(Millions of dollars)
Machinery FinancialConsolidated and Engines Products_________ _________ _______
Credit lines available:Global credit facilities. . . . . . . . . . . . $5,750 $ 600 $5,150Other external . . . . . . . . . . . . . . . . . . . . 2,177 911 1,266_____ _____ _____
Total credit lines available . . . . . . . . . 7,927 1,511 6,416Less: Global credit facilities
supporting commercial paper . . . 4,563 328 4,235Less: Utilized credit . . . . . . . . . . . . . . . . 531 143 388_____ _____ _____Available credit . . . . . . . . . . . . . . . . . . . . . $2,833 $1,040 $1,793_____ _____ __________ _____ _____
To maintain an alternative funding source, Cat Financial peri-odically (generally once a year) securitizes retail (customer)installment sale contracts and finance leases. In this process,these finance receivables are sold into a public asset-backed secu-ritization trust. The trusts, bankruptcy remote qualified specialpurpose entities (QSPEs) that are not consolidated in our finan-cial statements, held total assets of $980 million related to thesesecuritizations at year-end 2005. We use QSPEs in a mannerconsistent with conventional practices in the securitization indus-try to isolate these finance receivables, which are secured by newand used equipment, for the benefit of securitization investors.Our sensitivity analysis indicated that the impact of a 20 percentadverse change to all individual assumptions used to calculate thefair value of all our retained interests at December 31, 2005would be $2 million or less.
The use of the QSPEs enables us to access the U.S. securiti-zation market for the sale of these types of financial assets. Theamounts of funding from securitizations reflect such factors ascapital market accessibility, relative costs of funding sources, andassets available for securitization. We had total proceeds frominitial sales of these receivables of $850 million and $659 million,and recognized a pre-tax gain of $12 million and $13 million for2005 and 2004, respectively. Subordinated retained interests inthe public securitizations totaled $72 million and $73 million atDecember 31, 2005 and 2004, respectively.
We do not generate material funding through structured financetransactions.
Machinery and EnginesNet cash provided by operating activities was $2.81 billion com-pared with $1.92 billion for the same period a year ago. Thefavorable change is due to higher profitability. In total, workingcapital requirements in 2005 were about the same as 2004.
Inventories increased throughout 2005 due to higher demand,but at a much lower rate than 2004. Accounts payable reflect
comparable purchase activity year over year; however, 2004operating cash flow was favorably affected by a change ininvoice payment terms that impacted most of our U.S. locations.Additionally, 2005 operating cash flow reflects a higher level ofreceivable sales to Cat Financial and pension contributions of$912 million, $235 million higher than 2004.
Pursuant to the share repurchase program authorized by theBoard of Directors in October 2003, $1.68 billion was spent to pur-chase 34 million shares in 2005. The goal of the share repurchaseprogram, which expires in October 2008, is to reduce the com-pany’s outstanding shares to 640 million. There were 671 millionshares outstanding at the end of 2005.
Capital expenditures, excluding equipment leased to others,during 2005 were $1.16 billion, an increase of $321 million fromthe same period a year ago. The increase is a result of increasedspending to support growth and new product introductions.
Financial ProductsOperating cash flow was $1.08 billion in 2005, compared with$962 million for the same period a year ago. Cash used to pur-chase equipment leased to others was $1.27 billion in 2005, anincrease of $79 million from the same period a year ago. In addi-tion, net cash used for finance receivables and retained interestsin securitized assets was $3.08 billion in 2005, compared with$3.15 billion in 2004.
Financial Products total borrowings were $21.82 billion atDecember 31, 2005, an increase of $2.05 billion from December 31,2004 due to financing a higher amount of assets. Debt repaymentin Financial Products depends primarily on timely repaymentand collectibility of the receivables portfolio. At December 31,2005, finance receivables past due over 30 days were 1.42 per-cent, compared with 1.55 percent at December 31, 2004. Theallowance for credit losses was 1.35 percent of finance receiv-ables, net of unearned income, at December 31, 2005, comparedto 1.38 percent at December 31, 2004. Receivables written offdue to uncollectibility, net of recoveries on receivables previ-ously written off, were $45 million and $72 million for 2005 and2004, respectively.
Dividends paid per common share(1)
Quarter 2005 2004 2003First . . . . . . . . . . . . . . . . . . . . . . . . . . . . . . . $ .205 $ .185 $ .175Second. . . . . . . . . . . . . . . . . . . . . . . . . . . . .205 .185 .175Third. . . . . . . . . . . . . . . . . . . . . . . . . . . . . . .250 .205 .175Fourth . . . . . . . . . . . . . . . . . . . . . . . . . . . . .250 .205 .185______ ______ ______
$ 0.91 $ 0.78 $ 0.71______ ______ ____________ ______ ______(1) Per share data reflects the July 2005 2-for-1 stock split.
CRITICAL ACCOUNTING POLICIESThe preparation of financial statements in conformity with gen-erally accepted accounting principles requires management tomake estimates and assumptions that affect reported amounts.The more significant estimates include: residual values for leasedassets, fair market values for goodwill impairment tests, war-ranty liability, and reserves for product liability and insurancelosses, postretirement benefits, post-sale discounts, credit lossesand income taxes. We have incorporated many years of data into

MANAGEMENT’S DISCUSSION AND ANALYSIS continued
A-52
the determination of each of these estimates and we have nothistorically experienced significant adjustments. These assump-tions are reviewed at least annually with the Audit Committee ofthe Board of Directors. Following are the methods and assump-tions used in determining our estimates and an indication of therisks inherent in each.
Residual values for leased assets — Determined based on theproduct, specifications, application and hours of usage. Eachproduct has its own model for evaluation that includes marketvalue cycles and forecasts. Consideration is also given to theamount of assets that will be returned from lease during a giventime frame. Residual values could decline due to economic fac-tors, obsolescence or other adverse circumstances.
Fair market values for goodwill impairment tests — Determinedfor each reporting unit by discounting projected cash flow forfive years and adding a year-five residual value based upon a mar-ket Earnings Before Interest, Taxes, Depreciation and Amortization(EBITDA) multiple. The estimated fair value could be impactedby changes in interest rates, growth rates, costs, capital expen-ditures and market conditions.
Warranty liability — Determined by applying historical claimrate experience to the current field population and dealer inventory.Historical claim rates are developed using a rolling average ofactual warranty payments. Effective in the third quarter of 2004,we refined our process to utilize more detailed claim rates byproduct. This provides more comprehensive product warrantyinformation for management. This change did not have a mate-rial impact on our financial statements. Warranty payments maydiffer from those estimated if actual claim rates are higher orlower than our historical rates.
Product liability and insurance loss reserve — Determinedbased upon reported claims in process of settlement and actuar-ial estimates for losses incurred but not reported. Loss reserves,including incurred but not reported reserves, are based on esti-mates and ultimate settlements may vary significantly from suchestimates due to increased claims frequency or severity over his-torical levels.
Postretirement benefits — Primary actuarial assumptions weredetermined as follows:
● The U.S. expected long-term rate of return on plan assetsis based on our estimate of long-term passive returns forequities and fixed income securities weighted by the allo-cation of our plan assets. Based on historical performance,we increase the passive returns due to our active manage-ment of the plan assets. A similar process is used to deter-mine the rate for our non-U.S. pension plans. This rate isimpacted by changes in general market conditions, butbecause it represents a long-term rate, it is not significantlyimpacted by short-term market swings. Changes in our allo-cation of plan assets would also impact this rate. For exam-ple, a shift to more fixed income securities would lowerthe rate. A decrease in the rate would increase our expense.
● The assumed discount rate is used to discount future ben-efit obligations back to today’s dollars. The U.S. discountrate is based on the Moody’s Aa bond yield as of ourmeasurement date, November 30, and represents the rateat which our benefit obligations could effectively be settled.To validate the discount rate, a detailed analysis of theindividual plans’ expected cash flows is made annually.This involves analyzing Caterpillar’s projected cash
Contractual obligationsThe company has committed cash outflow related to long-term debt, operating lease agreements, purchase obligations and other con-tractual obligations. Minimum payments for these long-term obligations are:
After(Millions of dollars) 2006 2007 2008 2009 2010 2010 Total_____ _____ _____ _____ _____ ______ ______Long-term debt:
Machinery and Engines . . . . . . . . . . . . . . . . . . . . . . . . . . . . . . . . . . . . . . . . . . . . . . . . . . . . . . . . . . . $ 340 $ 88 $ 25 $ 550 $ 1 $ 1,987 $ 2,991Financial Products . . . . . . . . . . . . . . . . . . . . . . . . . . . . . . . . . . . . . . . . . . . . . . . . . . . . . . . . . . . . . . . . 4,159 3,882 2,731 1,994 2,333 2,020 17,119______ _____ _____ _____ _____ ______ ______
Total long-term debt . . . . . . . . . . . . . . . . . . . . . . . . . . . . . . . . . . . . . . . . . . . . . . . . . . . . . . . . . . . . 4,499 3,970 2,756 2,544 2,334 4,007 20,110Capital leases. . . . . . . . . . . . . . . . . . . . . . . . . . . . . . . . . . . . . . . . . . . . . . . . . . . . . . . . . . . . . . . . . . . . . . . . — 2 2 3 3 56 66Operating leases. . . . . . . . . . . . . . . . . . . . . . . . . . . . . . . . . . . . . . . . . . . . . . . . . . . . . . . . . . . . . . . . . . . . . 213 167 146 113 97 365 1,101Postretirement obligations(1) . . . . . . . . . . . . . . . . . . . . . . . . . . . . . . . . . . . . . . . . . . . . . . . . . . . . . . . . 570 860 1,770 410 405 2,400 6,415Purchase obligations:
Accounts payable(2) . . . . . . . . . . . . . . . . . . . . . . . . . . . . . . . . . . . . . . . . . . . . . . . . . . . . . . . . . . . . . . . . 3,471 — — — — — 3,471Purchase orders(3) . . . . . . . . . . . . . . . . . . . . . . . . . . . . . . . . . . . . . . . . . . . . . . . . . . . . . . . . . . . . . . . . . 4,896 — — — — — 4,896Other contractual obligations(4) . . . . . . . . . . . . . . . . . . . . . . . . . . . . . . . . . . . . . . . . . . . . . . . . . . . 162 122 116 112 110 268 890______ _____ _____ _____ _____ ______ ______
Total purchase obligations . . . . . . . . . . . . . . . . . . . . . . . . . . . . . . . . . . . . . . . . . . . . . . . . . . . . . 8,529 122 116 112 110 268 9,257Other long-term obligations(5). . . . . . . . . . . . . . . . . . . . . . . . . . . . . . . . . . . . . . . . . . . . . . . . . . . . . . . 125 82 62 61 60 3 393Interest on long-term debt(6). . . . . . . . . . . . . . . . . . . . . . . . . . . . . . . . . . . . . . . . . . . . . . . . . . . . . . . . . 779 614 495 380 294 4,358 6,920______ _____ _____ _____ _____ ______ ______Total contractual obligations . . . . . . . . . . . . . . . . . . . . . . . . . . . . . . . . . . . . . . . . . . . . . . . . . . . . . . . $14,715 $ 5,817 $ 5,347 $ 3,623 $ 3,303 $11,457 $44,262______ _____ _____ _____ _____ ______ ____________ _____ _____ _____ _____ ______ ______(1) Amounts represent expected contributions to our pension and other postretirement benefit plans through 2015, offset by expected Medicare Part D subsidy receipts.(2) Amount represents invoices received and recorded as liabilities in 2005, but scheduled for payment in 2006. These represent short-term obligations made in the ordinary course of business.(3) Amount represents contractual obligations for material and services on order at December 31, 2005 but not yet delivered. These represent short-term obligations made in the ordinary course
of business.(4) Amounts represent long-term commitments entered into with key suppliers for minimum purchases quantities.(5) Amounts represent contractual obligations related to software license contracts, IT consulting contracts and outsourcing contracts for benefit plan administration and software system support.(6) Amounts represent estimated contractual interest payments on long-term debt.

Caterpillar Inc.
A-53
flows against a high quality bond yield curve, calculatedusing a wide population of corporate Aa bonds. The mod-eled discount rate that results from matching the aggregateexpected future cash flow from the Caterpillar benefitplans to the yield curve of high quality corporate bondsis consistent with the annualized Moody’s Aa rate. Asimilar process is used to determine the assumed discountrate for our non-U.S. plans. This rate is sensitive to changesin interest rates. A decrease in the discount rate wouldincrease our obligation and expense.
● The expected rate of compensation increase is used todevelop benefit obligations using projected pay at retire-ment. It represents average long-term salary increases.This rate is influenced by our long-term compensationpolicies. An increase in the rate would increase our obli-gation and expense.
● The assumed health care trend rate represents the rate atwhich health care costs are assumed to increase and isbased on historical and expected experience. Changes inour projections of future health care costs due to generaleconomic conditions and those specific to health care(e.g. technology driven cost changes) will impact thistrend rate. An increase in the trend rate would increaseour obligation and expense.
Post-sale discount reserve — The company extends numerousmerchandising programs that provide discounts to dealers as prod-ucts are sold to end users. The reserve is determined based on histor-ical data adjusted for known changes in merchandising programs.Discounts paid may differ from those estimated if actual pro-gram usage is higher or lower than our historical or expected rates.
Credit loss reserve — Management’s ongoing evaluation of theadequacy of the allowance for credit losses considers both impairedand unimpaired finance receivables and takes into considerationpast loss experience, known and inherent risks in the portfolio,adverse situations that may affect the borrower’s ability to repay,estimated value of underlying collateral and current economicconditions. In estimating probable losses we review accounts thatare past due, non-performing, in bankruptcy or otherwise iden-tified as at risk for potential credit loss. Accounts are identifiedas at risk for potential credit loss using information availableabout the customer, such as financial statements, news reports,and published credit ratings as well as general information regard-ing industry trends and the general economic environment.
The allowance for credit losses attributable to specific accountsis based on the most probable source of repayment, which isnormally the liquidation of collateral. In determining collateralvalue we estimate current fair market value of collateral and fac-tor in credit enhancements such as additional collateral and thirdparty guarantees. The allowance for credit losses attributable tothe remaining accounts is a general allowance based upon therisk in the portfolio, primarily using probabilities of default andan estimate of associated losses. In addition qualitative factorsnot able to be fully captured in previous analysis including indus-try trends, macroeconomic factors and model imprecision areconsidered in the evaluation of the adequacy of the allowancefor credit losses. These qualitative factors are subjective andrequire a degree of management judgment.
While management believes it has exercised prudent judg-ment and applied reasonable assumptions which have resulted inan allowance presented in accordance with generally acceptedaccounting principles, there can be no assurance that in the future,changes in economic conditions or other factors might causechanges in the financial health of our customers which couldchange the timing and level of payments received thus necessi-tate a change to our estimated losses.
Income tax reserve — Despite our belief that our tax returnpositions are consistent with applicable tax laws, we believe thatcertain positions are likely to be challenged by taxing authorities.Settlement of any challenge can result in no change, a completedisallowance, or some partial adjustment reached through nego-tiations or litigation. Significant judgment is required in evaluat-ing our tax reserves. Our reserves are adjusted in light of changingfacts and circumstances, such as the progress of our tax audits.Our income tax expense includes the impact of reserve provi-sions and changes to reserves that we consider appropriate, aswell as related interest and penalties. Unfavorable adjustmentsto our tax filing position for issues included in our tax reserveswould require use of our cash. Favorable resolution would berecognized as a reduction to income tax expense at the time ofresolution.
EMPLOYMENTCaterpillar’s worldwide employment was 85,116 in 2005 com-pared with 76,920 in 2004. The increase was primarily due toabout 4,200 hourly labor additions to support higher volume andthe conversion of about 2,000 supplemental employees to full-time employment. In addition, about 2,000 salaried and man-agement employees were added in 2005 to support highervolume, new product introductions and growth of our servicebusinesses.
Full-Time Employees at Year End2005 2004 2003
Inside U.S. . . . . . . . . . . . . . . . . . . . . . . . . 43,878 38,128 35,260Outside U.S. . . . . . . . . . . . . . . . . . . . . . . 41,238 38,792 33,909______ ______ ______
Total. . . . . . . . . . . . . . . . . . . . . . . . . . . . 85,116 76,920 69,169______ ______ ____________ ______ ______By Region:
North America. . . . . . . . . . . . . . . . . 43,933 38,396 35,486EAME.. . . . . . . . . . . . . . . . . . . . . . . . . 23,137 22,169 20,547Latin America . . . . . . . . . . . . . . . . . 11,688 10,733 8,533Asia/Pacific . . . . . . . . . . . . . . . . . . . . 6,358 5,622 4,603______ ______ ______
Total . . . . . . . . . . . . . . . . . . . . . . . . 85,116 76,920 69,169______ ______ ____________ ______ ______
OTHER MATTERS
ENVIRONMENTAL AND LEGAL MATTERSThe company is regulated by federal, state and international envi-ronmental laws governing our use of substances and control ofemissions. In addition to governing our manufacturing and otheroperations, these laws often impact the development of our prod-ucts, including through required compliance with air emissionsstandards applicable to internal combustion engines. Compliance

MANAGEMENT’S DISCUSSION AND ANALYSIS continued
A-54
with these existing laws has not had a material impact on ourcapital expenditures, earnings, or competitive position.
We are cleaning up contamination at a number of locations,often with other companies, pursuant to federal and state laws.When it is probable we will pay cleanup costs at a site and thosecosts can be estimated, the costs are charged against our earnings.In formulating that estimate, we do not consider amounts expectedto be recovered from insurance companies or others.
The amount recorded for environmental cleanup is not mate-rial and is included in “Accrued expenses” in Statement 2.
We cannot estimate costs on sites in the very early stages ofcleanup. Currently, we have several sites in the very early stagesof cleanup, and there is no more than a remote chance that amaterial amount for cleanup at any individual site or at all sitesin the aggregate will be required.
Pursuant to a consent decree Caterpillar entered with theUnited States Environmental Protection Agency (EPA), the com-pany was required to meet certain emission standards by October2002. The decree provides that if engine manufacturers were unableto meet the standards at that time, they would be required to paya Non-Conformance Penalty (NCP) on each engine sold that did notmeet the standard. The amount of the NCP would be based onhow close to meeting the standard the engine came — the moreout of compliance the higher the penalty. The company beganintroduction of fully compliant ACERT engines in 2003 and bythe end of 2003 Caterpillar was only producing fully compliantengine models. As a result, NCPs were not payable for anyengines built in 2004. NCPs of $153 million were paid in 2003.
In addition, the consent decree required Caterpillar to pay a fineof $25 million, which was expensed in 1998, and to make invest-ments totaling $35 million in environmental-related products byJuly 7, 2007. During the first quarter of 2005, Caterpillar madequalifying investments of $3 million surpassing its investmentrequirement in environmental-related products with an accu-mulated investment of $38 million. A future benefit is expectedto be realized from these environmental projects related toCaterpillar’s ability to capitalize on the technologies it devel-oped in complying with its environmental project obligations.In short, Caterpillar expects to receive a positive net return on theenvironmental projects by being able to market the technologyit developed.
We have disclosed certain individual legal proceedings in thisfiling. Additionally, we are involved in other unresolved legalactions that arise in the normal course of business. The mostprevalent of these unresolved actions involve disputes related toproduct design, manufacture and performance liability (includ-ing claimed asbestos and welding fumes exposure), contracts,employment issues and intellectual property rights. Although itis not possible to predict with certainty the outcome of theseunresolved legal actions or the range of probable loss, we believethat these unresolved legal actions will not individually or in theaggregate have a material impact on our consolidated financialposition, liquidity or results of operations.
On January 16, 2002, Caterpillar commenced an action in theCircuit Court of the Tenth Judicial Circuit of Illinois in Peoria,Illinois, against Navistar International Transportation Corporationand International Truck and Engine Corporation (collectively
Navistar). The lawsuit arises out of a long-term purchase contractbetween Caterpillar and Navistar effective May 31, 1988, asamended from time to time (the Purchase Agreement). The pend-ing complaint alleges, among other things, that Navistar breachedits contractual obligations by: (i) paying Caterpillar $8.08 lessper fuel injector than the agreed upon price for new unit injec-tors delivered by Caterpillar; (ii) refusing to pay contractuallyagreed upon surcharges owed as a result of Navistar orderingless than planned volumes of replacement unit injectors; and (iii)refusing to pay contractually agreed upon interest stemming fromNavistar’s late payments. As of December 31, 2005, the net pastdue receivable from Navistar regarding the foregoing and includedin “Long-term receivables — trade and other” in Statement 2 totaled$139 million. The pending complaint also has claims allegingthat Newstream Enterprises and Navistar, collectively and indi-vidually, failed to pay the applicable price to Caterpillar for ship-ments of unit injectors to Newstream. As of December 31, 2005,the net past due receivables for the foregoing, included in “Long-term receivables — trade and other” in Statement 2 totaled$12 million. The pending complaint further alleges that SturmanIndustries, Inc. and Sturman Engine Systems, Inc. colluded withNavistar to utilize technology that Sturman Industries, Inc. mis-appropriated from Caterpillar to help Navistar develop its G2fuel system, and tortiously interfered with the Purchase Agree-ment and Caterpillar’s prospective economic relationship withNavistar. The pending complaint further alleges that the two par-ties’ collusion led Navistar to select Sturman Engine Systems,Inc. and another company, instead of Caterpillar, to develop andmanufacture the G2 fuel system.
On September 30, 2005, International Truck and EngineCorporation (International) commenced an action againstCaterpillar in the Circuit Court of the Tenth Judicial Circuit ofIllinois in Peoria, Illinois. The lawsuit states that it arises out ofthe May 31, 1988 Purchase Agreement described above. TheComplaint alleges, among other things, that Caterpillar procuredthe May 31, 1988 Purchase Agreement by fraudulently misrep-resenting or concealing information related to the business ofselling fuel injectors to International, and that Caterpillar breachedthe Purchase Agreement. International’s Complaint does notspecify the amount of damages being sought. Caterpillar intendsto defend itself vigorously in this case.
On May 7, 2002, International commenced an action againstCaterpillar in the Circuit Court of DuPage County, Illinois regardinga long-term agreement term sheet (“term sheet”) (the “first law-suit”). In its sixth amended complaint in the first lawsuit, Interna-tional alleged that the term sheet constitutes a legally bindingcontract for the sale of heavy-duty engines at specified pricesthrough the end of 2006, alleged that Caterpillar breached theterm sheet by, among other things, raising certain prices effec-tive October 1, 2002, and also alleged that Caterpillar breachedan obligation to negotiate a comprehensive long-term agreementreferenced in the term sheet. International sought declaratoryand injunctive relief as well as damages in an amount to be deter-mined at trial. Caterpillar denied International’s claims and hasfiled a counterclaim seeking a declaration that the term sheet hasbeen effectively terminated. Caterpillar also asserted that pur-suant to a subsequent agreement International released Caterpillarfrom certain of its claims. On September 24, 2003, the Appellate

Caterpillar Inc.
A-55
Court of Illinois, ruling on an interlocutory appeal, issued an orderconsistent with Caterpillar’s position that, even if the court sub-sequently determines that the term sheet is a binding contract, itis indefinite in duration and was therefore terminable at will byCaterpillar upon reasonable notice. On April 12, 2005 Internationalcommenced a second, related action against Caterpillar in theCircuit Court of DuPage County, Illinois (the “second lawsuit”).The second lawsuit contained allegations similar to the allega-tions contained in the first lawsuit. International also alleged inthe second lawsuit that Caterpillar materially breached the sub-sequent agreement. On June 15, 2005 International voluntarilydismissed its complaint in the first lawsuit. The second lawsuithas been consolidated with Caterpillar’s counterclaims from thefirst lawsuit. Trial is currently scheduled to begin during the thirdquarter of 2006. This case is not related to the breach of contractaction brought by Caterpillar against Navistar which is currentlypending in the Circuit Court of Peoria County, Illinois.
In a letter dated November 15, 2004, the EPA proposed a civilpenalty of $641,392 to Caterpillar for the alleged failure to com-ply with certain requirements of the Federal Clean Air Act. TheEPA alleges that Caterpillar constructed a facility in Emporia,Kansas and failed to comply with Section 112(g)(2)(B) of theClean Air Act. Caterpillar sold the Emporia facility in December2002. We are seeking a settlement of this matter with all con-cerned parties and, in the opinion of our management, the ulti-mate disposition of these matters will not have a material adverseeffect on our consolidated financial position, liquidity or resultsof operations.
During the second quarter of 2005, the Internal RevenueService (IRS) completed its field examination of our 1995 through1999 U.S. tax returns. In connection with this examination, wereceived notices of certain adjustments proposed by the IRS, pri-marily related to foreign sales corporation (FSC) commissions,foreign tax credit calculations and R&D credits. We disagreewith these proposed adjustments and are vigorously disputingthis matter through applicable IRS and judicial procedures, asappropriate. Although the final resolution of the proposed adjust-ments is uncertain, in the opinion of our management, the ulti-mate disposition of these matters will not have a material adverseeffect on our consolidated financial position, liquidity or resultsof operations.
RETIREMENT BENEFITSWe recognized pension expense of $366 million in 2005 as com-pared to $274 million in 2004. The increase in expense wasprimarily a result of both the amortization of actuarial losses result-ing largely from a declining discount rate and plan changes fromthe new UAW labor agreement (discussed below), partially off-set by the impact of expected asset returns on plan assets. SFAS87, “Employers’ Accounting for Pensions” requires companiesto discount future benefit obligations back to today’s dollarsusing a discount rate that is based on high-quality fixed-incomeinvestments. A decrease in the discount rate increases the pensionbenefit obligation. This increase is amortized into earnings as anactuarial loss. SFAS 87 also requires companies to use anexpected long-term rate of return on plan assets for computingcurrent year pension expense. Differences between the actualand expected asset returns are also amortized into earnings asactuarial gains and losses. At the end of 2005, total unrecognized
actuarial losses were $3.82 billion, as compared to $3.28 billionin 2004. The majority of the unrecognized actuarial losses aredue to declining discount rates in recent years. The $538 millionincrease during 2005 was mainly the result of a lower discountrate and changes to certain demographic assumptions, slightlyoffset by better than expected asset returns.
In 2005, we recognized other postretirement benefit expenseof $347 million compared to $256 million in 2004. The increasein expense is primarily the result of plan changes from the newUAW labor agreement, the amortization of actuarial lossesresulting from an increase in expected health care inflation anda declining discount rate, partially offset by changes to the U.S.salaried and management other postretirement benefit plan (dis-cussed below). Unrecognized actuarial losses for other postretire-ment benefit plans were $1.60 billion at the end of 2005. Theselosses mainly reflect a declining discount rate and an increasein expected health care inflation. The unrecognized losses were$363 million higher than at the end of 2004 due to the unfavor-able impact of an increase in expected health care inflation, alower discount rate and changes to certain demographic assump-tions, slightly offset by better than expected asset returns.
The unrecognized actuarial losses for both pensions and otherpostretirement benefits will be impacted in future periods by actualasset returns, actual health care inflation, discount rate changes,actual demographic experience and other factors that impactthese expenses. These losses will be amortized on a straight-linebasis over the average remaining service period of active employ-ees expected to receive benefits under the benefit plans. At theend of 2005, the average remaining service period of activeemployees was 11 years for our U.S. pension plans, 12 years forour non-U.S. pension plans and 8 years for other postretirementbenefit plans. We expect our amortization of net actuarial lossesto increase approximately $70 million in 2006 as compared to2005, primarily because of a decrease in the discount rate.
For our U.S. pension plans, our current asset allocation is72 percent equity securities and 28 percent debt securities, andour target allocation for 2006 is 70 percent equity securities and30 percent debt securities. The current asset allocation for ournon-U.S. pension plans is 63 percent equity securities, 30 percentdebt securities, 5 percent real estate and 2 percent other. The targetallocation for 2006 for our non-U.S. pension plans is 64 percentequity securities, 29 percent debt securities, 6 percent real estateand 1 percent other. Our target asset allocations reflect our invest-ment strategy of maximizing the rate of return on plan assets andthe resulting funded status, within an appropriate level of risk.The U.S. plans are rebalanced to plus or minus five percentagepoints of the target asset allocation ranges on a monthly basis.The frequency of rebalancing for the non-U.S. plans varies depend-ing on the plan.
SFAS 87 requires the recognition of an Additional MinimumLiability if the market value of plan assets is less than the accu-mulated benefit obligation at the end of the measurement date.Based on these values, the company’s Additional MinimumLiability was decreased in the fourth quarter 2005 by $233 mil-lion, which offset the first quarter 2005 increase due to the planchanges from the new UAW labor agreement (see below). The neteffect of these adjustments resulted in a decrease in AccumulatedOther Comprehensive Income (a component of Shareholder’s

MANAGEMENT’S DISCUSSION AND ANALYSIS continued
A-56
Equity on the Consolidated Financial Position) of $96 millionafter tax. The fourth quarter decrease differed from our third-quarter 2005 estimate primarily because of higher than expectedfourth quarter cash contributions to one of our U.S. pension plans.This resulted in plan assets being greater than the accumulatedbenefit obligation and thus no additional minimum pension lia-bility was required. Future changes to the Additional MinimumLiability will be dependent on several factors including ourassumed discount rate, actual returns on our pension plan assets,company contributions and benefit plan changes. During 2005, wemade cash contributions of $543 million to our U.S. defined benefitpension plans and $369 million to our non-U.S. pension plans.
The agreement reached with the UAW in January 2005included changes to both pension and other postretirement ben-efits. Pension plan changes included increases in basic benefitpayments, increases in the allowance provided to employees whoretire before age 62 as well as annual lump-sum payments toretirees during the first three years of the contract. Other postre-tirement benefit changes included several changes to our retireemedical plan design that resulted in a net increase in companycost sharing with retirees.
Changes to the pension plan resulted in an increase in the pen-sion obligation of approximately $230 million. This reflects adiscount rate of 5.8 percent. The increase will be amortized intoearnings on a straight-line basis over 10 years, the averageremaining service period of active employees impacted by theplan change. In addition, there will be an ongoing increase inexpense as a result of the benefit changes. In total, full year 2005pension expense (and annual expense until the plan change isfully amortized) increased $29 million. In addition to the increasein pension expense, the plan changes increased the AdditionalMinimum Pension Liability by $233 million.
Changes to the other postretirement plan resulted in anincrease in the benefit obligation of approximately $620 million.This also reflects a discount rate of 5.8 percent. The increase willbe amortized into earnings on a straight-line basis over 16 years,the average remaining life expectancy of plan participants thatare fully eligible for benefits (as they comprise almost all of theplan). In addition, there will be an ongoing increase in expenseas a result of the benefit changes. In total, full year 2005 otherpostretirement benefit expense (and annual expense until theplan change is fully amortized) increased $69 million.
In April 2005, amendments were made to our U.S. salariedand management other postretirement benefit plan that increaseemployee cost sharing and resulted in a decrease in the benefit obli-gation of approximately $190 million. This reflects a discountrate of 5.7 percent. The decrease will be amortized into earningson a straight-line basis over nine years, the average remainingservice period of active employees impacted by the plan change.In addition, there will be an ongoing decrease in expense as aresult of the benefit changes. 2005 other postretirement benefitexpense decreased $18 million. After 2005, the annual expense(until the plan change is fully amortized) will decrease approxi-mately $24 million.
Although we have no ERISA funding requirements in 2006,we expect to make approximately $10 million of contributionsto our U.S. pension plans and $30 million of contributions to our
non-U.S. pension plans during the year. We have adequate liq-uidity resources to fund both U.S. and non-U.S. pension plans.Also during 2006, in addition to our funding of ongoing cashbenefit payments of approximately $350 million, we expect tomake an additional contribution of $200 million to our otherpostretirement benefit plans.
Actuarial assumptions have a significant impact on both pen-sion and other postretirement benefit expenses. The effects of aone percentage point change in our primary actuarial assump-tions on 2005 benefit costs and year-end obligations are includedin the table on page A-57.
SENSITIVITY
Foreign Exchange Rate SensitivityMachinery and Engines use foreign currency forward and optioncontracts to manage unmatched foreign currency cash inflowand outflow. Our objective is to minimize the risk of exchangerate movements that would reduce the U.S. dollar value of ourforeign currency cash flow. Our policy allows for managinganticipated foreign currency cash flow for up to four years. Basedon the anticipated and firmly committed cash inflow and out-flow for our Machinery and Engines operations for the next12 months and the foreign currency derivative instruments inplace at year end, a hypothetical 10 percent weakening of theU.S. dollar relative to all other currencies would adversely affectour expected 2006 cash flow for our Machinery and Enginesoperations by approximately $178 million. Last year similarassumptions and calculations yielded a potential $200 millionadverse impact on 2005 cash flow. We determine our net expo-sures by calculating the difference in cash inflow and outflowby currency and adding or subtracting outstanding foreign cur-rency derivative instruments. We multiply these net amounts by10 percent to determine the sensitivity.
Since our policy for Financial Products operations is to hedgethe foreign exchange risk when the currency of our debt portfoliodoes not match the currency of our receivable portfolio, a 10 per-cent change in the value of the U.S. dollar relative to all other cur-rencies would not have a material effect on our ConsolidatedFinancial Position, results of operations or cash flow. Neitherour policy nor the effect of a 10 percent change in the value of theU.S. dollar has changed from that reported at the end of last year.
The effect of the hypothetical change in exchange rates ignoresthe effect this movement may have on other variables, includingcompetitive risk. If it were possible to quantify this competitiveimpact, the results would probably be different from the sensitivityeffects shown above. In addition, it is unlikely that all currencieswould uniformly strengthen or weaken relative to the U.S. dollar.In reality, some currencies may weaken while others may strengthen.Our primary exposure (excluding competitive risk) is to exchangerate movements in the British pound and Japanese yen.
Interest Rate SensitivityFor our Machinery and Engines operations, we have the optionto use interest rate swaps to lower the cost of borrowed funds byattaching fixed-to-floating interest rate swaps to fixed-rate debt.A hypothetical 100 basis point adverse move (increase) in inter-est rates along the entire interest rate yield curve would adverselyaffect 2006 pretax earnings of Machinery and Engines by

Caterpillar Inc.
A-57
$15 million. Last year, similar assumptions and calculationsyielded a potential $5 million adverse impact on 2005 pretaxearnings. This effect is caused by the interest rate fluctuationson our short-term debt.
For our Financial Products operations, we use interest rate deriva-tive instruments primarily to meet our match funding objectivesand strategies. We have a match funding policy whereby theinterest rate profile (fixed or floating rate) of our debt portfoliois matched to the interest rate profile of our earning asset port-folio (finance receivables and operating leases) within certainparameters. In connection with that policy, we use interest rateswap agreements to modify the debt structure. Match fundingassists us in maintaining our interest rate spreads, regardless ofthe direction interest rates move.
In order to properly manage our sensitivity to changes in inter-est rates, we measure the potential impact of different interestrate assumptions on pretax earnings. All on-balance sheet posi-tions, including derivative financial instruments, are included in
the analysis. The primary assumptions included in the analysisare that there are no new fixed rate assets or liabilities, the pro-portion of fixed rate debt to fixed rate assets remains unchangedand the level of floating rate assets and debt remain constant.Based on the December 31, 2005 balance sheet under theseassumptions, the analysis estimates the impact of a 100 basispoint immediate and sustained parallel rise in interest rates to be a$9 million decrease to pretax earnings for 2006. In 2005, changeswere made to specific assumptions related to certain short-termassets and liabilities and the treatment of equity that we feel providea more realistic estimate of the impact of changes in interestrates. Based on these revised assumptions, the estimated impactfor 2005 was a $20 million decrease in pretax earnings versus the$13 million decrease in 2005 pretax earnings reported in 2004.
This analysis does not necessarily represent our current outlookof future market interest rate movement, nor does it consider anyactions management could undertake in response to changes ininterest rates. Accordingly, no assurance can be given that actualresults would be consistent with the results of our estimate.
Postretirement Benefit Plan Actuarial Assumptions SensitivityFollowing are the effects of a one percentage-point change in our primary pension and other postretirement benefit actuarial assump-tions (included in the following table) on 2005 pension and other postretirement benefits costs and obligations:
2005 Benefit Cost Year-end Benefit ObligationOne percentage- One percentage- One percentage- One percentage-
(Millions of dollars) point increase point decrease point increase point decreasePension benefits:
Assumed discount rate. . . . . . . . . . . . . . . . . . . . . . . . $ (120) $ 126 $(1,465) $1,661Expected rate of compensation increase . . . . 56 (51) 213 (207)Expected long-term rate of return
on plan assets . . . . . . . . . . . . . . . . . . . . . . . . . . . . . . (95) 95 — —Other postretirement benefits:
Assumed discount rate. . . . . . . . . . . . . . . . . . . . . . . . (31) 62 (573) 637Expected rate of compensation increase . . . . 1 (1) 3 (3)Expected long-term rate of return
on plan assets . . . . . . . . . . . . . . . . . . . . . . . . . . . . . . (8) 8 — —Assumed health care cost trend rate . . . . . . . . . 77 (52) 418 (364)
Primary Actuarial Assumptions
U.S. Pension Non-U.S. Pension Other PostretirementBenefits Benefits Benefits
2005 2004 2003 2005 2004 2003 2005 2004 2003
Weighted-average assumptions used todetermine benefit obligations, end of year:
Discount rate . . . . . . . . . . . . . . . . . . . . . . . . . . . . . . . . . . 5.6% 5.9% 6.2% 4.6% 5.2% 5.1% 5.6% 5.9% 6.1%Rate of compensation increase . . . . . . . . . . . . . . 4.0% 4.0% 4.0% 3.7% 3.5% 3.2% 4.0% 4.0% 4.0%
Weighted-average assumptions used todetermine net cost:
Discount rate . . . . . . . . . . . . . . . . . . . . . . . . . . . . . . . . . . 5.9% 6.2% 7.0% 5.2% 5.1% 5.4% 5.8% 6.1% 7.0%Expected return on plan assets . . . . . . . . . . . . . . 9.0% 9.0% 9.0% 7.1% 7.4% 7.1% 9.0% 9.0% 9.0%Rate of compensation increase . . . . . . . . . . . . . . 4.0% 4.0% 4.0% 3.5% 3.2% 3.3% 4.0% 4.0% 4.0%
Health care cost trend rates at year end:Health care trend rate assumed for next year. . . . . . . . . . . . . . . . . . . . . . . . . . . . . . . . . . . . . . . . . . . . . . . . . . . . . . . . . . . . . . . . . . 8.5% 8.4% 8.5%Rate that the cost trend rate gradually declines to . . . . . . . . . . . . . . . . . . . . . . . . . . . . . . . . . . . . . . . . . . . . . . . . . . . . . . . . . . . . 5.0% 5.0% 4.5%Year that the cost trend rate reaches ultimate rate . . . . . . . . . . . . . . . . . . . . . . . . . . . . . . . . . . . . . . . . . . . . . . . . . . . . . . . . . . . . 2013 2012 2009

MANAGEMENT’S DISCUSSION AND ANALYSIS continued
A-58
SUPPLEMENTAL CONSOLIDATING DATAWe are providing supplemental consolidating data for the purposeof additional analysis. The data has been grouped as follows:
Consolidated — Caterpillar Inc. and its subsidiaries.Machinery and Engines — The Machinery and Engines data
contained in the schedules on pages A-58 to A-60 are “non-GAAPfinancial measures” as defined by the Securities and ExchangeCommission in Regulation G. These non-GAAP financial mea-sures have no standardized meaning prescribed by U.S. GAAP,and therefore, are unlikely to be comparable with the calcula-tion of similar measures for other companies. Management doesnot intend these items to be considered in isolation or as a substi-tute for the related GAAP measures. Caterpillar defines Machineryand Engines as it is presented in the supplemental data asCaterpillar Inc. and its subsidiaries with Financial Productsaccounted for on the equity basis. Machinery and Engines infor-mation relates to our design, manufacturing, marketing and parts
distribution operations. Financial Products information relatesto the financing to customers and dealers for the purchase andlease of Caterpillar and other equipment. The nature of thesebusinesses is different, especially with regard to the financialposition and cash flow items. Caterpillar management utilizesthis presentation internally to highlight these differences. Wealso believe this presentation will assist readers in understand-ing our business.
Financial Products — our finance and insurance subsidiaries,primarily Cat Financial and Cat Insurance.
Consolidating Adjustments — eliminations of transactionsbetween Machinery and Engines and Financial Products.
Pages A-58 to A-60 reconcile Machinery and Engines withFinancial Products on the Equity Basis to Caterpillar Inc. Consol-idated financial information.
Supplemental Data for Results of OperationsFor The Years Ended December 31(Millions of dollars)
Supplemental consolidating data___________________________________________________________________________Machinery Consolidating
Consolidated and Engines(1) Financial Products Adjustments_________________________ _________________________ _________________________ _________________________2005 2004 2003 2005 2004 2003 2005 2004 2003 2005 2004 2003_______ ______ ______ _______ ______ ______ _______ ______ ______ _______ ______ ______
Sales and revenues:Sales of Machinery and Engines. . . . . . . . . . . $ 34,006 $ 28,336 $ 21,048 $ 34,006 $ 28,336 $ 21,048 $ — $ — $ — $ — $ — $ —Revenues of Financial Products . . . . . . . . . . . 2,333 1,970 1,759 — — — 2,650 2,169 1,953 (317)(2) (199)(2) (194)(2)
_______ ______ ______ _______ ______ ______ _______ ______ ______ _______ ______ ______Total sales and revenues . . . . . . . . . . . . . . 36,339 30,306 22,807 34,006 28,336 21,048 2,650 2,169 1,953 (317) (199) (194)
Operating costs:Cost of goods sold . . . . . . . . . . . . . . . . . . . . . . . . . 26,558 22,497 16,997 26,558 22,497 16,997 — — — — — —Selling, general and administrative
expenses . . . . . . . . . . . . . . . . . . . . . . . . . . . . . . . 3,190 2,926 2,322 2,786 2,548 2,009 446 441 382 (42)(3) (63)(3) (69)(3)
Research and development expenses . . . . . 1,084 928 669 1,084 928 669 — — — — — —Interest expense of Financial Products . . . . 768 524 474 — — — 786 536 486 (18)(4) (12)(4) (12)(4)
Other operating expenses . . . . . . . . . . . . . . . . . . 955 747 675 76 18 (9) 887 722 692 (8)(3) 7)(3) (8)(3)_______ ______ ______ _______ ______ ______ _______ ______ ______ _______ ______ ______
Total operating costs . . . . . . . . . . . . . . . . . . 32,555 27,622 21,137 30,504 25,991 19,666 2,119 1,699 1,560 (68) (68) (89)_______ ______ ______ _______ ______ ______ _______ ______ ______ _______ ______ ______
Operating profit . . . . . . . . . . . . . . . . . . . . . . . . . . . . . . . 3,784 2,684 1,670 3,502 2,345 1,382 531 470 393 (249) (131) (105)
Interest expense excludingFinancial Products. . . . . . . . . . . . . . . . . . . . . 260 230 246 266 235 259 — — — (6)(4) (5)(4) (13)(4)
Other income (expense) . . . . . . . . . . . . . . . . . . . . 377 253 53 85 92 (17) 49 35 (22) 243)(5) 126)(5) 92)(5)_______ ______ ______ _______ ______ ______ _______ ______ ______ _______ ______ ______
Consolidated profit before taxes. . . . . . . . . . 3,901 2,707 1,477 3,321 2,202 1,106 580 505 371 — — —Provision for income taxes. . . . . . . . . . . . . . . . . 1,120 731 398 926 566 286 194 165 112 — — —_______ ______ ______ _______ ______ ______ _______ ______ ______ _______ ______ ______Profit of consolidated companies. . . . . . . . . . 2,781 1,976 1,079 2,395 1,636 820 386 340 259 — — —
Equity in profit (loss) of unconsolidatedaffiliated companies . . . . . . . . . . . . . . . . . . . 73 59 20 64 56 16 9 3 4 — — —
Equity in profit of Financial Products’subsidiaries . . . . . . . . . . . . . . . . . . . . . . . . . . . . — — — 395 343 263 — — — (395)(6) (343)(6) (263)(6)
_______ ______ ______ _______ ______ ______ _______ ______ ______ _______ ______ ______Profit . . . . . . . . . . . . . . . . . . . . . . . . . . . . . . . . . . . . . . . . . . . . $ 2,854 $ 2,035 $ 1,099 $ 2,854 $ 2,035 $ 1,099 $ 395 $ 343 $ 263 $ (395) $ (343) $ (263)_______ ______ ______ _______ ______ ______ _______ ______ ______ _______ ______ _____________ ______ ______ _______ ______ ______ _______ ______ ______ _______ ______ ______
(1) Represents Caterpillar Inc. and its subsidiaries with Financial Products accounted for on the equity basis.(2) Elimination of Financial Products revenues earned from Machinery and Engines.(3) Elimination of net expenses recorded by Machinery and Engines paid to Financial Products.(4) Elimination of interest expense recorded between Financial Products and Machinery and Engines.(5) Elimination of discount recorded by Machinery and Engines on receivables sold to Financial Products and of interest earned between Machinery and Engines and Financial Products.(6) Elimination of Financial Products profit due to equity method of accounting.

Caterpillar Inc.
A-59
Supplemental Data for Financial PositionAt December 31(Millions of dollars)
Supplemental consolidating data__________________________________________________Machinery Consolidating
Consolidated and Engines(1) Financial Products Adjustments________________ ________________ ________________ ________________2005 2004 2005 2004 2005 2004 2005 2004_______ ______ _______ ______ _______ ______ _______ ______
AssetsCurrent assets:
Cash and short-term investments . . . . . . . . . . . . . . . . . . . . . . . . . . . . . . . . . . . . . . . . . . . . . . . . . . . . . . . . . . . . $ 1,108 $ 445 $ 951 $ 270 $ 157 $ 175 $ — $ —Receivables — trade and other . . . . . . . . . . . . . . . . . . . . . . . . . . . . . . . . . . . . . . . . . . . . . . . . . . . . . . . . . . . . . . . 7,526 7,463 2,833 3,276 419 465 4,274)(2)(3) 3,722)(2)(3)
Receivables — finance . . . . . . . . . . . . . . . . . . . . . . . . . . . . . . . . . . . . . . . . . . . . . . . . . . . . . . . . . . . . . . . . . . . . . . . 6,442 5,182 — — 11,058 9,325 (4,616)(3) (4,143)(3)
Deferred and refundable income taxes . . . . . . . . . . . . . . . . . . . . . . . . . . . . . . . . . . . . . . . . . . . . . . . . . . . . . . . 344 398 276 333 68 65 — —Prepaid expenses. . . . . . . . . . . . . . . . . . . . . . . . . . . . . . . . . . . . . . . . . . . . . . . . . . . . . . . . . . . . . . . . . . . . . . . . . . . . . . 2,146 1,369 2,139 1,367 26 16 (19)(4) (14)(4)
Inventories . . . . . . . . . . . . . . . . . . . . . . . . . . . . . . . . . . . . . . . . . . . . . . . . . . . . . . . . . . . . . . . . . . . . . . . . . . . . . . . . . . . . . 5,224 4,675 5,224 4,675 — — — —_______ ______ _______ ______ _______ ______ _______ ______Total current assets . . . . . . . . . . . . . . . . . . . . . . . . . . . . . . . . . . . . . . . . . . . . . . . . . . . . . . . . . . . . . . . . . . . . . . . . . . . . . . . . . 22,790 19,532 11,423 9,921 11,728 10,046 (361) (435)
Property, plant and equipment — net. . . . . . . . . . . . . . . . . . . . . . . . . . . . . . . . . . . . . . . . . . . . . . . . . . . . . . . . . . . . . 7,988 7,682 5,067 4,820 2,921 2,862 — —Long-term receivables — trade and other . . . . . . . . . . . . . . . . . . . . . . . . . . . . . . . . . . . . . . . . . . . . . . . . . . . . . . . . 1,037 764 301 255 36 37 700)(2)(3) 472)(2)(3)
Long-term receivables — finance. . . . . . . . . . . . . . . . . . . . . . . . . . . . . . . . . . . . . . . . . . . . . . . . . . . . . . . . . . . . . . . . . 10,301 9,903 — — 11,036 10,410 (735)(3) (507)(3)
Investments in unconsolidated affiliated companies . . . . . . . . . . . . . . . . . . . . . . . . . . . . . . . . . . . . . . . . . . . . . 565 517 526 479 39 39 — (1)(5)
Investments in Financial Products subsidiaries . . . . . . . . . . . . . . . . . . . . . . . . . . . . . . . . . . . . . . . . . . . . . . . . . . — — 3,253 3,012 — — (3,253)(6) (3,012)(6)
Deferred income taxes. . . . . . . . . . . . . . . . . . . . . . . . . . . . . . . . . . . . . . . . . . . . . . . . . . . . . . . . . . . . . . . . . . . . . . . . . . . . . . 768 674 1,057 950 32 27 (321)(7) (303)(7)
Intangible assets. . . . . . . . . . . . . . . . . . . . . . . . . . . . . . . . . . . . . . . . . . . . . . . . . . . . . . . . . . . . . . . . . . . . . . . . . . . . . . . . . . . . 424 315 418 307 6 8 — —Goodwill . . . . . . . . . . . . . . . . . . . . . . . . . . . . . . . . . . . . . . . . . . . . . . . . . . . . . . . . . . . . . . . . . . . . . . . . . . . . . . . . . . . . . . . . . . . . 1,451 1,450 1,451 1,450 — — — —Other assets. . . . . . . . . . . . . . . . . . . . . . . . . . . . . . . . . . . . . . . . . . . . . . . . . . . . . . . . . . . . . . . . . . . . . . . . . . . . . . . . . . . . . . . . . 1,745 2,258 491 1,075 1,254 1,183 — —_______ ______ _______ ______ _______ ______ _______ ______
Total assets. . . . . . . . . . . . . . . . . . . . . . . . . . . . . . . . . . . . . . . . . . . . . . . . . . . . . . . . . . . . . . . . . . . . . . . . . . . . . . . . . . . . . . . . . . . . $ 47,069 $ 43,095 $ 23,987 $ 22,269 $ 27,052 $ 24,612 $ (3,970) $(3,786)_______ ______ _______ ______ _______ ______ _______ _____________ ______ _______ ______ _______ ______ _______ ______
LiabilitiesCurrent liabilities:
Short-term borrowings. . . . . . . . . . . . . . . . . . . . . . . . . . . . . . . . . . . . . . . . . . . . . . . . . . . . . . . . . . . . . . . . . . . . . . . . $ 5,569 $ 4,157 $ 871 $ 93 $ 4,897 $ 4,396 $ (199)(8) $ (332)(8)
Accounts payable. . . . . . . . . . . . . . . . . . . . . . . . . . . . . . . . . . . . . . . . . . . . . . . . . . . . . . . . . . . . . . . . . . . . . . . . . . . . . . 3,471 3,580 3,347 3,459 261 205 (137)(9) (84)(9)
Accrued expenses . . . . . . . . . . . . . . . . . . . . . . . . . . . . . . . . . . . . . . . . . . . . . . . . . . . . . . . . . . . . . . . . . . . . . . . . . . . . . 2,617 2,261 1,605 1,426 1,038 855 (26)(10) (20)(10)
Accrued wages, salaries and employee benefits . . . . . . . . . . . . . . . . . . . . . . . . . . . . . . . . . . . . . . . . . . . . . 1,845 1,730 1,826 1,716 19 14 — —Customer advances . . . . . . . . . . . . . . . . . . . . . . . . . . . . . . . . . . . . . . . . . . . . . . . . . . . . . . . . . . . . . . . . . . . . . . . . . . . 395 447 395 447 — — — —Dividends payable. . . . . . . . . . . . . . . . . . . . . . . . . . . . . . . . . . . . . . . . . . . . . . . . . . . . . . . . . . . . . . . . . . . . . . . . . . . . . 168 141 168 141 — — — —Deferred and current income taxes payable . . . . . . . . . . . . . . . . . . . . . . . . . . . . . . . . . . . . . . . . . . . . . . . . . . 528 259 448 212 84 47 (4)(7) —Long-term debt due within one year . . . . . . . . . . . . . . . . . . . . . . . . . . . . . . . . . . . . . . . . . . . . . . . . . . . . . . . . . 4,499 3,531 340 6 4,159 3,525 — —_______ ______ _______ ______ _______ ______ _______ ______
Total current liabilities. . . . . . . . . . . . . . . . . . . . . . . . . . . . . . . . . . . . . . . . . . . . . . . . . . . . . . . . . . . . . . . . . . . . . . . . . . . . . . 19,092 16,106 9,000 7,500 10,458 9,042 (366) (436)
Long-term debt due after one year. . . . . . . . . . . . . . . . . . . . . . . . . . . . . . . . . . . . . . . . . . . . . . . . . . . . . . . . . . . . . . . . . 15,677 15,837 2,752 3,697 12,960 12,175 (35)(8) (35)(8)
Liability for postemployment benefits . . . . . . . . . . . . . . . . . . . . . . . . . . . . . . . . . . . . . . . . . . . . . . . . . . . . . . . . . . . . . 2,991 2,986 2,991 2,986 — — — —Deferred income taxes and other liabilities . . . . . . . . . . . . . . . . . . . . . . . . . . . . . . . . . . . . . . . . . . . . . . . . . . . . . . . . 877 699 812 619 381 383 (316)(7) (303)(7)
_______ ______ _______ ______ _______ ______ _______ ______Total liabilities. . . . . . . . . . . . . . . . . . . . . . . . . . . . . . . . . . . . . . . . . . . . . . . . . . . . . . . . . . . . . . . . . . . . . . . . . . . . . . . . . . . . . . . . 38,637 35,628 15,555 14,802 23,799 21,600 (717) (774)_______ ______ _______ ______ _______ ______ _______ ______
Stockholders’ equityCommon stock . . . . . . . . . . . . . . . . . . . . . . . . . . . . . . . . . . . . . . . . . . . . . . . . . . . . . . . . . . . . . . . . . . . . . . . . . . . . . . . . . . . . . 1,859 1,231 1,859 1,231 875 888 (875)(6) (888)(6)
Treasury stock . . . . . . . . . . . . . . . . . . . . . . . . . . . . . . . . . . . . . . . . . . . . . . . . . . . . . . . . . . . . . . . . . . . . . . . . . . . . . . . . . . . . . . (4,637) (3,277) (4,637) (3,277) — — — —Profit employed in the business . . . . . . . . . . . . . . . . . . . . . . . . . . . . . . . . . . . . . . . . . . . . . . . . . . . . . . . . . . . . . . . . . . . 11,808 9,937 11,808 9,937 2,197 1,824 (2,197)(6) (1,824)(6)
Accumulated other comprehensive income . . . . . . . . . . . . . . . . . . . . . . . . . . . . . . . . . . . . . . . . . . . . . . . . . . . . . . . (598) (424) (598) (424) 181 300 (181)(6) (300)(6)_______ ______ _______ ______ _______ ______ _______ ______
Total stockholders’ equity. . . . . . . . . . . . . . . . . . . . . . . . . . . . . . . . . . . . . . . . . . . . . . . . . . . . . . . . . . . . . . . . . . . . . . . . . . 8,432 7,467 8,432 7,467 3,253 3,012 (3,253) (3,012)_______ ______ _______ ______ _______ ______ _______ ______
Total liabilities and stockholders’ equity . . . . . . . . . . . . . . . . . . . . . . . . . . . . . . . . . . . . . . . . . . . . . . . . . . . . . . . $ 47,069 $ 43,095 $ 23,987 $ 22,269 $ 27,052 $ 24,612 $ (3,970) $ (3,786)_______ ______ _______ ______ _______ ______ _______ _____________ ______ _______ ______ _______ ______ _______ ______
(1) Represents Caterpillar Inc. and its subsidiaries with Financial Products accounted for on the equity basis.(2) Elimination of receivables between Machinery and Engines and Financial Products.(3) Reclassification of Machinery and Engines trade receivables purchased by Cat Financial and Cat Financial’s wholesale inventory receivables.(4) Elimination of Machinery and Engines insurance premiums that are prepaid to Financial Products.(5) Elimination of Machinery and Engines investment in Financial Products subsidiary.(6) Elimination of Financial Products equity which is accounted for on Machinery and Engines on the equity basis.(7) Reclassification reflecting required netting of deferred tax assets/liabilities by taxing jurisdiction.(8) Elimination of debt between Machinery and Engines and Financial Products.(9) Elimination of payables between Machinery and Engines and Financial Products.
(10) Elimination of prepaid insurance in Financial Products’ accrued expenses.
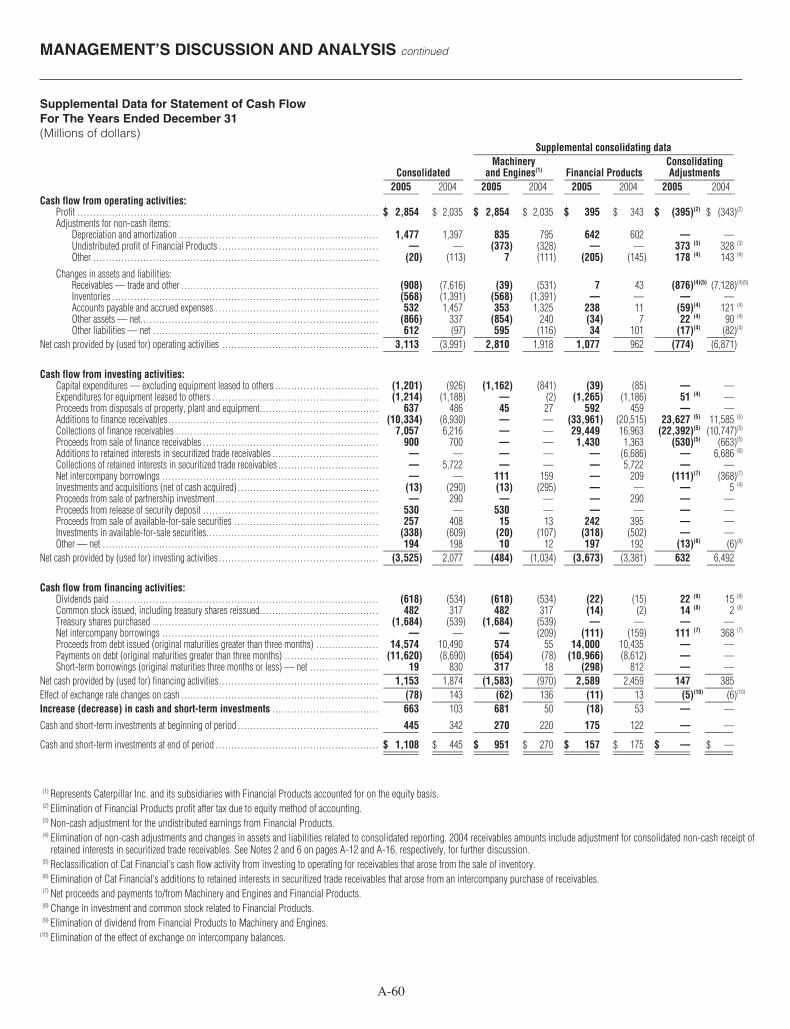
A-60
MANAGEMENT’S DISCUSSION AND ANALYSIS continued
Supplemental Data for Statement of Cash FlowFor The Years Ended December 31(Millions of dollars)
Supplemental consolidating data__________________________________________________Machinery Consolidating
Consolidated and Engines(1) Financial Products Adjustments________________ ________________ ________________ ________________2005 2004 2005 2004 2005 2004 2005 2004_______ ______ _______ ______ _______ ______ _______ ______
Cash flow from operating activities:Profit . . . . . . . . . . . . . . . . . . . . . . . . . . . . . . . . . . . . . . . . . . . . . . . . . . . . . . . . . . . . . . . . . . . . . . . . . . . . . . . . . . . . . . . . . . . . . . . . $ 2,854 $ 2,035 $ 2,854 $ 2,035 $ 395 $ 343 $ (395)(2) $ (343)(2)
Adjustments for non-cash items:Depreciation and amortization . . . . . . . . . . . . . . . . . . . . . . . . . . . . . . . . . . . . . . . . . . . . . . . . . . . . . . . . . . . . . . . . 1,477 1,397 835 795 642 602 — —Undistributed profit of Financial Products . . . . . . . . . . . . . . . . . . . . . . . . . . . . . . . . . . . . . . . . . . . . . . . . . . . — — (373) (328) — — 373)(3) 328)(3)
Other . . . . . . . . . . . . . . . . . . . . . . . . . . . . . . . . . . . . . . . . . . . . . . . . . . . . . . . . . . . . . . . . . . . . . . . . . . . . . . . . . . . . . . . . . . . (20) (113) 7 (111) (205) (145) 178)(4) 143)(4)
Changes in assets and liabilities:Receivables — trade and other . . . . . . . . . . . . . . . . . . . . . . . . . . . . . . . . . . . . . . . . . . . . . . . . . . . . . . . . . . . . . . . (908) (7,616) (39) (531) 7 43 (876)(4)(5) (7,128)(4)(5)
Inventories . . . . . . . . . . . . . . . . . . . . . . . . . . . . . . . . . . . . . . . . . . . . . . . . . . . . . . . . . . . . . . . . . . . . . . . . . . . . . . . . . . . . . (568) (1,391) (568) (1,391) — — — —Accounts payable and accrued expenses . . . . . . . . . . . . . . . . . . . . . . . . . . . . . . . . . . . . . . . . . . . . . . . . . . . . 532 1,457 353 1,325 238 11 (59)(4) 121)(4)
Other assets — net. . . . . . . . . . . . . . . . . . . . . . . . . . . . . . . . . . . . . . . . . . . . . . . . . . . . . . . . . . . . . . . . . . . . . . . . . . . . (866) 337 (854) 240 (34) 7 22)(4) 90)(4)
Other liabilities — net . . . . . . . . . . . . . . . . . . . . . . . . . . . . . . . . . . . . . . . . . . . . . . . . . . . . . . . . . . . . . . . . . . . . . . . . 612 (97) 595 (116) 34 101 (17)(4) (82)(4)_______ ______ _______ ______ _______ ______ _______ ______
Net cash provided by (used for) operating activities . . . . . . . . . . . . . . . . . . . . . . . . . . . . . . . . . . . . . . . . . . . . . . . . . . 3,113 (3,991) 2,810 1,918 1,077 962 (774) (6,871)_______ ______ _______ ______ _______ ______ _______ ______
Cash flow from investing activities:Capital expenditures — excluding equipment leased to others . . . . . . . . . . . . . . . . . . . . . . . . . . . . . . . . . (1,201) (926) (1,162) (841) (39) (85) — —Expenditures for equipment leased to others . . . . . . . . . . . . . . . . . . . . . . . . . . . . . . . . . . . . . . . . . . . . . . . . . . . . . (1,214) (1,188) — (2) (1,265) (1,186) 51)(4) —Proceeds from disposals of property, plant and equipment. . . . . . . . . . . . . . . . . . . . . . . . . . . . . . . . . . . . . . 637 486 45 27 592 459 — —Additions to finance receivables . . . . . . . . . . . . . . . . . . . . . . . . . . . . . . . . . . . . . . . . . . . . . . . . . . . . . . . . . . . . . . . . . . . (10,334) (8,930) — — (33,961) (20,515) 23,627)(5) 11,585)(5)
Collections of finance receivables . . . . . . . . . . . . . . . . . . . . . . . . . . . . . . . . . . . . . . . . . . . . . . . . . . . . . . . . . . . . . . . . . 7,057 6,216 — — 29,449 16,963 (22,392)(5) (10,747)(5)
Proceeds from sale of finance receivables . . . . . . . . . . . . . . . . . . . . . . . . . . . . . . . . . . . . . . . . . . . . . . . . . . . . . . . . 900 700 — — 1,430 1,363 (530)(5) (663)(5)
Additions to retained interests in securitized trade receivables . . . . . . . . . . . . . . . . . . . . . . . . . . . . . . . . . . — — — — — (6,686) — 6,686)(6)
Collections of retained interests in securitized trade receivables . . . . . . . . . . . . . . . . . . . . . . . . . . . . . . . . — 5,722 — — — 5,722 — —Net intercompany borrowings . . . . . . . . . . . . . . . . . . . . . . . . . . . . . . . . . . . . . . . . . . . . . . . . . . . . . . . . . . . . . . . . . . . . . — — 111 159 — 209 (111)(7) (368)(7)
Investments and acquisitions (net of cash acquired) . . . . . . . . . . . . . . . . . . . . . . . . . . . . . . . . . . . . . . . . . . . . . (13) (290) (13) (295) — — — 5)(4)
Proceeds from sale of partnership investment . . . . . . . . . . . . . . . . . . . . . . . . . . . . . . . . . . . . . . . . . . . . . . . . . . . . — 290 — — — 290 — —Proceeds from release of security deposit . . . . . . . . . . . . . . . . . . . . . . . . . . . . . . . . . . . . . . . . . . . . . . . . . . . . . . . . 530 — 530 — — — — —Proceeds from sale of available-for-sale securities . . . . . . . . . . . . . . . . . . . . . . . . . . . . . . . . . . . . . . . . . . . . . . 257 408 15 13 242 395 — —Investments in available-for-sale securities. . . . . . . . . . . . . . . . . . . . . . . . . . . . . . . . . . . . . . . . . . . . . . . . . . . . . . . (338) (609) (20) (107) (318) (502) — —Other — net . . . . . . . . . . . . . . . . . . . . . . . . . . . . . . . . . . . . . . . . . . . . . . . . . . . . . . . . . . . . . . . . . . . . . . . . . . . . . . . . . . . . . . . . 194 198 10 12 197 192 (13)(8) (6)(8)
_______ ______ _______ ______ _______ ______ _______ ______Net cash provided by (used for) investing activities . . . . . . . . . . . . . . . . . . . . . . . . . . . . . . . . . . . . . . . . . . . . . . . . . . . (3,525) 2,077 (484) (1,034) (3,673) (3,381) 632 6,492_______ ______ _______ ______ _______ ______ _______ ______
Cash flow from financing activities:Dividends paid. . . . . . . . . . . . . . . . . . . . . . . . . . . . . . . . . . . . . . . . . . . . . . . . . . . . . . . . . . . . . . . . . . . . . . . . . . . . . . . . . . . . . . (618) (534) (618) (534) (22) (15) 22)(9) 15)(9)
Common stock issued, including treasury shares reissued. . . . . . . . . . . . . . . . . . . . . . . . . . . . . . . . . . . . . . 482 317 482 317 (14) (2) 14)(8) 2)(8)
Treasury shares purchased . . . . . . . . . . . . . . . . . . . . . . . . . . . . . . . . . . . . . . . . . . . . . . . . . . . . . . . . . . . . . . . . . . . . . . . . (1,684) (539) (1,684) (539) — — — —Net intercompany borrowings . . . . . . . . . . . . . . . . . . . . . . . . . . . . . . . . . . . . . . . . . . . . . . . . . . . . . . . . . . . . . . . . . . . . . — — — (209) (111) (159) 111)(7) 368)(7)
Proceeds from debt issued (original maturities greater than three months) . . . . . . . . . . . . . . . . . . . . 14,574 10,490 574 55 14,000 10,435 — —Payments on debt (original maturities greater than three months) . . . . . . . . . . . . . . . . . . . . . . . . . . . . . . (11,620) (8,690) (654) (78) (10,966) (8,612) — —Short-term borrowings (original maturities three months or less) — net . . . . . . . . . . . . . . . . . . . . . . 19 830 317 18 (298) 812 — —_______ ______ _______ ______ _______ ______ _______ ______
Net cash provided by (used for) financing activities. . . . . . . . . . . . . . . . . . . . . . . . . . . . . . . . . . . . . . . . . . . . . . . . . . . 1,153 1,874 (1,583) (970) 2,589 2,459 147 385_______ ______ _______ ______ _______ ______ _______ ______Effect of exchange rate changes on cash . . . . . . . . . . . . . . . . . . . . . . . . . . . . . . . . . . . . . . . . . . . . . . . . . . . . . . . . . . . . . . . (78) 143 (62) 136 (11) 13 (5)(10) (6)(10)
_______ ______ _______ ______ _______ ______ _______ ______Increase (decrease) in cash and short-term investments . . . . . . . . . . . . . . . . . . . . . . . . . . . . . . . . . . 663 103 681 50 (18) 53 — —
Cash and short-term investments at beginning of period . . . . . . . . . . . . . . . . . . . . . . . . . . . . . . . . . . . . . . . . . . . . . 445 342 270 220 175 122 — —_______ ______ _______ ______ _______ ______ _______ ______
Cash and short-term investments at end of period . . . . . . . . . . . . . . . . . . . . . . . . . . . . . . . . . . . . . . . . . . . . . . . . . . . . $ 1,108 $ 445 $ 951 $ 270 $ 157 $ 175 $ — $ —_______ ______ _______ ______ _______ ______ _______ _____________ ______ _______ ______ _______ ______ _______ ______
(1) Represents Caterpillar Inc. and its subsidiaries with Financial Products accounted for on the equity basis.(2) Elimination of Financial Products profit after tax due to equity method of accounting.(3) Non-cash adjustment for the undistributed earnings from Financial Products.(4) Elimination of non-cash adjustments and changes in assets and liabilities related to consolidated reporting. 2004 receivables amounts include adjustment for consolidated non-cash receipt of
retained interests in securitized trade receivables. See Notes 2 and 6 on pages A-12 and A-16, respectively, for further discussion.(5) Reclassification of Cat Financial’s cash flow activity from investing to operating for receivables that arose from the sale of inventory.(6) Elimination of Cat Financial’s additions to retained interests in securitized trade receivables that arose from an intercompany purchase of receivables.(7) Net proceeds and payments to/from Machinery and Engines and Financial Products.(8) Change in investment and common stock related to Financial Products.(9) Elimination of dividend from Financial Products to Machinery and Engines.
(10) Elimination of the effect of exchange on intercompany balances.

Caterpillar Inc.
A-61
OUTLOOK
SALES AND REVENUES OUTLOOKSales and revenues are expected to increase about 10 percent in2006, which would set a new record of about $40 billion. Of the10 percent increase, about 7 percent is from higher Machineryand Engines volume and Financial Products revenues and about3 percent from improved price realization.
Inflation remains low in most countries, which should encour-age central banks to continue to be cautious in raising interestrates. We expect short-term and long-term interest rates in mostcountries will remain attractive for business investment.
Relatively low inflation and a low interest rate environmentshould support continued growth in the world economy. We fore-cast worldwide economic growth of around 3.5 percent in 2006,about the same as in 2005. Somewhat faster growth in Europe andJapan should offset slower growth in the United States. Relativelyhigh commodity prices have contributed to strong growth indeveloping countries over the past three years, and we expectthat trend to continue in 2006.
Worldwide consumption of most base metals exceeded pro-duction in 2005, driving inventories relative to consumption tothe lowest level in many years. As a result, metals prices reachednew highs in early 2006, resulting in the longest price upturnsince the late 1970s. With mine production difficulties continu-ing, we expect metals prices will remain very favorable for newinvestments this year.
Energy industries should provide attractive sales opportuni-ties for machines, reciprocating engines and gas turbines in 2006.The world has little surplus production capacity, and we expectboth oil and gas prices to trade at or above 2005 averages. Thoseprice levels should encourage further growth in exploration,drilling and pipeline expenditures.
Construction spending, as well as investments in standby elec-tric power, should increase further in 2006 to support growingeconomies. Investments in nonresidential structures should ben-efit from low long-term interest rates, good corporate profits andhigher office rental rates. We expect governments in the com-modity-exporting countries will use earnings from high pricesto further increase infrastructure spending.
Existing orders for oceangoing vessels should have shipyardsproducing near capacity in 2006. Deliveries of feeder containerships, port service vessels and oil and gas offshore supply ves-sels should increase in 2006.
North America (United States and Canada)Machinery and Engines sales are expected to increase about 12 per-cent in 2006.
We believe the U.S. Federal Reserve will not raise interest ratessignificantly in 2006, suggesting a peak Federal Funds rate ofless than 5 percent this year. Economic growth slowed in 2005,and we project a further slowing to a little over 3 percent in 2006.Some consumer-related industries likely will continue to struggledue to modest growth in personal incomes and rising imports.But factors supporting business investment — low interest ratesand high corporate profits — should continue.
U.S. housing starts exceeded 2 million units in 2005, the bestyear since 1972. Although opinions on housing are overwhelm-ingly negative, a collapse in activity seems unlikely. Mortgagerates, while up some from 2005 lows, are well below those ratesthat prevailed in the last housing cycle. Most of the other fac-tors that recently benefited housing construction — rising homeprices, household formations, demand for second homes and ashift away from mobile homes — remained in place at the startof 2006. We expect housing starts in 2006 to be moderately below2005 levels.
Commercial and industrial lending and architectural billings— past leading indicators of nonresidential construction — haveincreased. With corporate profits near a record share of nationalincome, we expect businesses to increase investments in struc-tures at least 5 percent in 2006, roughly matching the recoverypattern of the upturn in the 1990s.
We expect highway contracting to increase about 7 percent in2006 as a result of increased federal funding and further improve-ment in state and local government budgets.
Coal production declined slightly in 2005, driving coal stocksin months of consumption to a record low. Continued high coalprices, resolution of some transportation bottlenecks and arebuilding of coal stocks should drive a 4 percent increase incoal production in 2006.
Natural gas production has not fully recovered from the impactof Hurricane Katrina, and prices in early January were up morethan 30 percent from a year earlier. Those high prices shouldencourage further investment in exploration and development,which should boost engine sales.
North American production of large on-highway trucks shouldbe near capacity in 2006 and about even with 2005 levels. Positivesinclude strong freight movements, high trucking company profitsand accelerated ordering in advance of stricter 2007 emissionstandards.
The Bank of Canada raised interest rates three times in 2005,but inflation is below the middle of the central bank’s targetrange. We expect interest rates, which are below those in theUnited States, to remain low enough to allow slightly better eco-nomic growth in 2006. Mining, energy and nonresidential con-struction should do well.
EAMEMachinery and Engines sales are expected to increase about 5 per-cent in 2006.
Economic indicators suggest economic growth improved inthe last half of 2005 in several Eurozone economies, due largelyto a recovery in manufacturing. Leading indicators and businesssurveys indicate this positive momentum is continuing into 2006.
The European Central Bank’s (ECB) decision to raise interestrates last December was controversial, and the bank subsequentlyindicated a less aggressive policy on rate increases. However,inflation is above the ECB’s target, so we expect at least one morerate increase this year. The Bank of England, which cut interestrates once in 2005, probably will hold rates steady throughout2006 since economic growth appears to be rebounding.
With economic growth improving and interest rates remain-ing low, the European economy should grow slightly more than

MANAGEMENT’S DISCUSSION AND ANALYSIS continued
A-62
2 percent in 2006. The Central European and Nordic economiesshould continue to outperform the Eurozone.
Eurozone housing permits increased more than 7 percentyearly over the past three years, and home prices are increasingin many European countries. With continued low interest ratesand rising personal incomes, we expect housing construction toimprove further in 2006. Construction surveys suggest othertypes of construction spending should recover, benefiting fromlow long-term interest rates and rising corporate profits.
We project economic growth in AME will exceed 5 percentin 2006, the fourth consecutive year of good growth. The currentperiod is the best for sustained growth since the 1970s. Highenergy and metals prices are boosting investment in those sectorsas well as providing governments the funds to increase infras-tructure investment. Good economic growth should encouragemore investment in standby electrical power.
In the CIS, we project economic growth will slow to around6 percent, the fourth straight year of strong growth. Recoveriesin energy and metals prices contributed significantly to bettereconomic growth. We do not anticipate that recent disputes overnatural gas prices will impact energy investments in Russiathis year.
Latin AmericaMachinery and Engines sales are expected to increase about 6 per-cent in 2006.
Interest rate trends within the region will likely diverge in2006. Brazil, which started cutting interest rates last year in responseto some slowing in manufacturing, is forecast to further reduceinterest rates this year. Mexico is also expected to cut interestrates due to slowing inflation and moderate economic growth.
Most other countries should raise interest rates slightly, but fromsome of the lowest rates in years.
We expect economic growth in the region will slow to slightlyless than 4 percent in 2006. Economic growth in all key countriesshould remain strong enough to support growth in construction.Mine production is increasing in most countries, which, along withhigh metals prices, should encourage more investment in mining.
Asia/PacificMachinery and Engines sales are expected to increase about 11 per-cent in 2006.
We project the regional economy will again be the fastest grow-ing in the world, with 2006 growth continuing slightly above6 percent. Low interest rates, competitive exchange rates andincreased international trade should support the regional econ-omy. Faster economic growth in Australia and developing Asiashould offset a modest slowing in China’s economic growth rate.
Steaming coal prices softened in late 2005 but remained aboveprices that would discourage new investments. We expect con-tract prices for iron ore to increase again in April and coking coalprices to hold much of the increases negotiated in 2005. Invest-ments in new mine capacity and supporting infrastructure shouldincrease further in 2006.
We expect construction spending to increase as well. Growingpopulations and higher home prices should boost housing con-struction, and rapid economic growth will likely require busi-nesses to invest more in structures.
Financial Products RevenuesWe expect continued growth in Financial Products for 2006.Revenues are expected to increase approximately 18 percent ver-sus 2005, primarily due to higher average earning assets in 2006.
Sales and Revenues Outlook
2005 2006 %(Millions of dollars) Actual Outlook Change
Machinery and EnginesNorth America . . . . . . . . . . . . . . . . . . . . . . . . . . . . . . . . . . . . . . . . . . . . . . . . . . . . . . . . . . . . . . . . . . . . . . . . . . . . . . . . $ 17,709 $ 19,850 12%EAME .. . . . . . . . . . . . . . . . . . . . . . . . . . . . . . . . . . . . . . . . . . . . . . . . . . . . . . . . . . . . . . . . . . . . . . . . . . . . . . . . . . . . . . . . 8,860 9,300 5%Latin America. . . . . . . . . . . . . . . . . . . . . . . . . . . . . . . . . . . . . . . . . . . . . . . . . . . . . . . . . . . . . . . . . . . . . . . . . . . . . . . . . 3,024 3,200 6%Asia/Pacific . . . . . . . . . . . . . . . . . . . . . . . . . . . . . . . . . . . . . . . . . . . . . . . . . . . . . . . . . . . . . . . . . . . . . . . . . . . . . . . . . . . 4,413 4,900 11%_______ _______
Total Machinery and Engines. . . . . . . . . . . . . . . . . . . . . . . . . . . . . . . . . . . . . . . . . . . . . . . . . . . . . . . . . . . . . . . . . . . 34,006 37,250 10%_______ ______Financial Products(1). . . . . . . . . . . . . . . . . . . . . . . . . . . . . . . . . . . . . . . . . . . . . . . . . . . . . . . . . . . . . . . . . . . . . . . . . . . . . . 2,333 2,750 18%_______ _______Total. . . . . . . . . . . . . . . . . . . . . . . . . . . . . . . . . . . . . . . . . . . . . . . . . . . . . . . . . . . . . . . . . . . . . . . . . . . . . . . . . . . . . . . . . . . . . . . $ 36,339 $ 40,000 10%_______ ______________ _______(1) Does not include revenues earned from Machinery and Engines of $350 million and $317 million in 2006 and 2005, respectively.

Caterpillar Inc.
A-63
PROFIT OUTLOOKWe expect profit per share to be in the range of $4.65 to $5.00,up 15 percent to 24 percent from 2005. The year is expected tobenefit from improved price realization and higher sales volumepartially offset by core operating costs and stock-based compen-sation expense.
About half of the expected core operating cost increase is frommanufacturing costs and about half from SG&A and R&D.Manufacturing costs are expected to be higher due to an increasein material costs of about 1 percent and an increase in manufac-turing period costs to support higher volume.
SG&A expense is expected to increase — a result of laborinflation and developmental programs to support the growthenvisioned by Caterpillar’s enterprise strategy. However, weexpect SG&A as a percent of sales to be flat with 2005. R&Dexpense is expected to increase to comply with emissions require-ments, introduce new products and support future growth.
Incentive compensation expense at the midpoint of our outlookrange for 2006 is expected to be about $50 to $75 million, or 10 to15 percent lower than 2005. This expense includes both a short-termand long-term component. In addition, we will begin expensing
stock-based compensation in accordance with SFAS 123R in2006. We estimate our 2006 stock-based compensation expensewill be approximately $125 million. We expect 2006 retirementbenefits to be the same as 2005.
In 2005, we recognized $90 million of gains from Machineryand Engines long-term hedges in Other Income/Expense. Thesehedges expired at the end of 2005, and we do not expect similargains in 2006.
Excluding discrete items, we expect our effective tax rate for2006 will increase approximately one percentage point from the2005 rate due to the continued phase-out of ETI. The AmericanJobs Creation Act provides for the phase-out of ETI with 80 per-cent of benefit in 2005, 60 percent of benefit in 2006 and com-plete phase-out in 2007.
* * *
The information included in the Outlook section is forward lookingand involves risks and uncertainties that could significantly affectexpected results. A discussion of these risks and uncertainties iscontained in Item 7 of this Form 10-K.
MANAGEMENT’S DISCUSSION AND ANALYSIS ■
(1) The PPS outlook is between $4.65 and $5.00. The above chart illustrates operating profit at the midpoint of this profit range. Each of the stair steps in the chartmay individually vary within the outlook range.
(2) Other includes the impact of currency, consolidating adjustments and the effects of rounding.
Mill
ions
of $
2005Operating
Profit
3,784
SalesVolume
750
PriceRealization
1,100 (750)
CoreOperating
Costs
(125)
Stock-BasedCompensation
FinancialProducts
75
Other(2)
(34)
2006Operating
Profit
4,800
Consolidated Operating Profit Comparison(1)
2006 vs. 2005
3,000
3,500
4,000
4,500
5,000
5,500
6,000

A-64
SUPPLEMENTAL STOCKHOLDER INFORMATION
Shareholder Services:
Stock Transfer AgentMellon Investor ServicesP.O. Box 3315South Hackensack, NJ 07606-3315phone: (866) 203-6622 (U.S. and Canada)
(201) 680-6578 (Outside U.S. and Canada)hearing impaired:
(800) 231-5469 (U.S. and Canada)(201) 680-6610 (Outside U.S. and Canada)
Internet home page: www.melloninvestor.com
Caterpillar Assistant SecretaryLaurie J. HuxtableAssistant SecretaryCaterpillar Inc.100 N.E. Adams StreetPeoria, IL 61629-7310phone: (309) 675-4619fax: (309) 675-6620e-mail: [email protected]
Stock Purchase Plan:Current shareholders and other interested investors may purchaseCaterpillar Inc. common stock directly through the Investor Ser-vices Program sponsored and administered by our TransferAgent. Current shareholders can get more information on theprogram from our Transfer Agent using the contact informationprovided above. Non-shareholders can request program materialsby calling: (800) 842-7629 (U.S. and Canada) or (201) 329-8660(outside the U.S. and Canada). The Investor Services Programmaterials are available on-line from Mellon’s website or linkedfrom www.CAT.com/dspp.
Investor Relations:Institutional analysts, portfolio managers, and representatives offinancial institutions seeking additional information about theCompany should contact:
Director of Investor RelationsMike DeWaltCaterpillar Inc.100 N.E. Adams Street, Peoria, IL 61629-5310phone: (309) 675-4549fax: (309) 675-4457e-mail: [email protected] website: www.CAT.com/investor
Common Stock (NYSE: CAT)Listing Information: Caterpillar common stock is listed on theNew York, Pacific and Chicago stock exchanges in the United States,and on stock exchanges in Belgium, France, Germany, Great Britainand Switzerland.
Compliance: Caterpillar files Annual CEO Certifications in com-pliance with New York and Pacific stock exchange rules andcertifications in compliance with Sections 302 and 906 of theSarbanes-Oxley Act of 2002. These certifications are included asexhibits to our Form 10-K filing for the relevant fiscal year.
Price Ranges: Quarterly price ranges of Caterpillar commonstock on the New York Stock Exchange, the principal market inwhich the stock is traded, were:
2005(1) 2004(1)_______________ _______________
Quarter High Low High Low______ ____ ____ ____ ____First . . . . . . . . . . . . . . . . . $ 49.98 $43.20 $42.85 $36.26Second . . . . . . . . . . . . . . $ 51.49 $41.31 $42.38 $36.01Third . . . . . . . . . . . . . . . . $ 59.88 $47.43 $40.65 $34.25Fourth . . . . . . . . . . . . . . . $ 59.84 $48.25 $49.36 $38.38(1) Price ranges reflect July 2005 2-for-1 stock split.
Number of Stockholders: Stockholders of record at year-endtotaled 38,329, compared with 37,639 at the end of 2004.Approximately 68 percent of our issued shares are held by insti-tutions and banks, 26 percent by individuals, and 6 percent byemployees through company investment plans.
Caterpillar qualified investment plans held 40,601,400 sharesat year-end, including 3,789,649 shares acquired during 2005.Non-U.S. employee stock purchase plans held an additional5,024,633 shares at year-end, including 1,002,151 shares acquiredduring 2005.
Company Information:Current information:
● phone our Information Hotline — (800) 228-7717 (U.S.and Canada) or (858) 244-2080 (outside U.S. and Canada)to request company publications by mail, listen to a sum-mary of Caterpillar’s latest financial results and currentoutlook, or to request a copy of results by fax or mail
● request, view, or download materials on-line or register foremail alerts by visiting www.CAT.com/materialsrequest
Historical information:
● view/download on-line at www.CAT.com/historical
Annual Meeting:On Wednesday, June 14, 2006, at 1:30 p.m., Central Time, theannual meeting of stockholders will be held at the Northern TrustCorporation building in Chicago, Illinois. Proxy materials are beingsent to stockholders with this report on or about April 28, 2006.
Internet:Visit us on the Internet at www.CAT.com.
Information contained on our website is not incorporated by ref-erence into this document.

A-65
Note: All director/officer information is as of December 31, 2005, except as noted.1Retired effective January 1, 2006.
OFFICERSJames W. Owens Chairman and CEOStuart L. Levenick Group PresidentDouglas R. Oberhelman Group PresidentGerald L. Shaheen Group PresidentGérard R. Vittecoq Group PresidentSteven H. Wunning Group PresidentKent M. Adams Vice PresidentAli M. Bahaj Vice PresidentSidney C. Banwart Vice PresidentMichael J. Baunton Vice PresidentRodney C. Beeler Vice PresidentMary H. Bell Vice PresidentJames B. Buda Vice President,
General Counsel and SecretaryDavid B. Burritt Vice President,
Chief Financial OfficerRodney L. Bussell Vice PresidentChristopher C. Curfman Vice PresidentPaolo Fellin Vice PresidentSteven L. Fisher Vice PresidentThomas A. Gales Vice PresidentStephen A. Gosselin Vice President
Hans A. Haefeli Vice PresidentJohn S. Heller Vice PresidentRichard P. Lavin Vice PresidentRobert R. Macier1 Vice PresidentWilliam D. Mayo Vice PresidentDaniel M. Murphy Vice PresidentGerald Palmer Vice PresidentJames J. Parker Vice PresidentMark R. Pflederer Vice PresidentEdward J. Rapp Vice PresidentWilliam J. Rohner Vice PresidentChristiano V. Schena Vice PresidentWilliam F. Springer Vice PresidentGary A. Stroup Vice PresidentJames D. Waters Vice PresidentDonald G. Western Vice PresidentRobert T. Williams Vice PresidentBradley M. Halverson ControllerKevin E. Colgan TreasurerRobin D. Beran Assistant TreasurerTinkie E. Demmin Assistant SecretaryLaurie J. Huxtable Assistant Secretary
Directors/Committee Membership(as of December 31, 2005)
Audit Compensation Governance Public PolicyW. Frank Blount ✔ ✔
John R. Brazil ✔ *✔*John T. Dillon ✔ *✔*Eugene V. Fife *✔*Gail D. Fosler ✔ ✔
Juan Gallardo ✔ ✔
David R. Goode ✔ ✔
Peter A. Magowan ✔ ✔
William A. Osborn *✔*Gordon R. Parker ✔ ✔
Charles D. Powell ✔ ✔
Edward B. Rust, Jr. ✔ ✔
Joshua I. Smith ✔ ✔
* Chairman of Committee
DIRECTORS AND OFFICERS

®
YELA0801