
3.1: Mode, Median, and Mean 3 iPad Notes_1.pdfTo Obtain the Median: 1) Put data into order from...
57
3.1: Mode, Median, and Mean ____________ – the value or property that occurs most frequently in the data. 1. there can be more than 1 mode or no mode at all 2. only should be used if you are interested in the most common value ____________ – central value of an ordered distribution. 1. uses the position rather than the specific value of each data entry. ____________ – average that uses the exact value of each entry. 2. most important, but can be affected by ___________________. Mode – value or property that occurs ______________________ in the data, but it is not the most stable way of looking at the data. Example: 4, 6, 6, 7, 8, 9 Example: 2, 3, 4, 5, 6, 7 To Obtain the Median: 1) Put data into order from least to greatest. 2) Choose the middle value. **If there is not one single middle value use the formula:
Transcript of 3.1: Mode, Median, and Mean 3 iPad Notes_1.pdfTo Obtain the Median: 1) Put data into order from...

3.1: Mode, Median, and Mean
____________ – the value or property that occurs most frequently in the data.
1. there can be more than 1 mode or no mode at all
2. only should be used if you are interested in the most common value
____________ – central value of an ordered distribution.
1. uses the position rather than the specific value of each data entry.
____________ – average that uses the exact value of each entry.
2. most important, but can be affected by ___________________.
Mode – value or property that occurs ______________________ in the data, but
it is not the most stable way of looking at the data.
Example: 4, 6, 6, 7, 8, 9
Example: 2, 3, 4, 5, 6, 7
To Obtain the Median:
1) Put data into order from least to greatest.
2) Choose the middle value.
**If there is not one single middle value use the formula:

*** If there are an odd number of values in your distribution, the central value
____the median.
Ex. 12, 13, 16, 17, 19, 22, 35, 44, 59
*** If there is an even number of values in your distribution, obtain the median by
taking the _____________________ of the two central values.
Ex. 27, 35, 44, 56, 67, 78, 89
To Obtain the Mean:
1) Find the __________ of all data values.
2) ________________ by the total number of data entries.
There is a common notation that indicates a sum is the Greek letter ____________
If you were to see _________, you would read that has the sum of all given x
values. __________ is the total number of entries.
Mean – average that uses the ________________ of each entry.
- can be affected by _________________.
Ex. 113, 116, 125, 135, 110, 109, 100
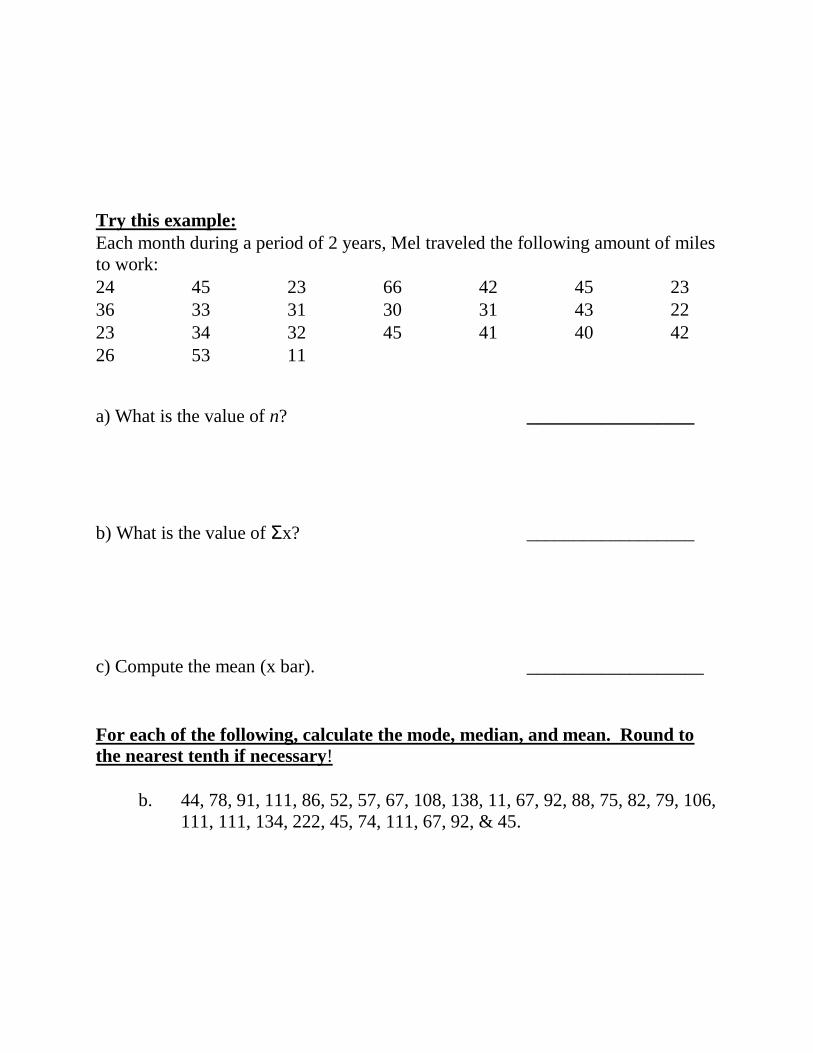
Try this example:
Each month during a period of 2 years, Mel traveled the following amount of miles
to work:
24 45 23 66 42 45 23
36 33 31 30 31 43 22
23 34 32 45 41 40 42
26 53 11
a) What is the value of n? __________________
b) What is the value of Σx? __________________
c) Compute the mean (x bar). ___________________
For each of the following, calculate the mode, median, and mean. Round to
the nearest tenth if necessary!
b. 44, 78, 91, 111, 86, 52, 57, 67, 108, 138, 11, 67, 92, 88, 75, 82, 79, 106,
111, 111, 134, 222, 45, 74, 111, 67, 92, & 45.

c. 567, 671, 670, 733, 563, 563, 672, 777, 782, 645, 375, 226, 973, 567,
711, 896, 678, 722, 917, 888, 777, 666, 335, 762, & 937.
d. 256, 102, 673, 834, 883, 991, 202, 907, 563, 444, 167, 783, 927, 863,
723, 829, 283, 923, 829, 839, 903, 920, 526, 673, 738, 672, 721, 452, &
233.
e. 1024, 1089, 8923, 6745, 6723, 7745, 8930, 4567, 8934, 8374, 8738,
8397, 7378, 9374, 7837, 8922, 2222, 7838, 7836, 7384, 7384, 7384,
7238, 2893, 2678, 2893, 8298, 7872, 2737, 1102, & 2233.
e. 4444, 2891, 1727, 2828, 4949, 2780, 2834, 4544, 4564. 1371, 7383,
2767, 2893, 8928, 2839, 7278, 2829, 9239, 8289, 2892, 8928, 1561 &
3330.


Resistant Measures – one that is ________________________ by extremely high
or low data values.
1) The mean is _________ a resistant measure of center because we can make the
mean as large as we want by increasing the size of only one data value.
2) The median is ____________ resistant; it is not sensitive to the specific size of a
data value.
Trimmed Mean – a measure of center that is ______________________ than the
mean but still sensitive to specific data values.
1) Eliminates the influence of unusually small or large data values.
To Compute a 5% Trimmed Mean:
1) __________ the data from smallest to largest.
2) __________ the bottom 5% of the data and the top 5% of the data.
3) __________ the mean of the remaining 90% of the data.
*** We will also be looking at 10% trimmed means
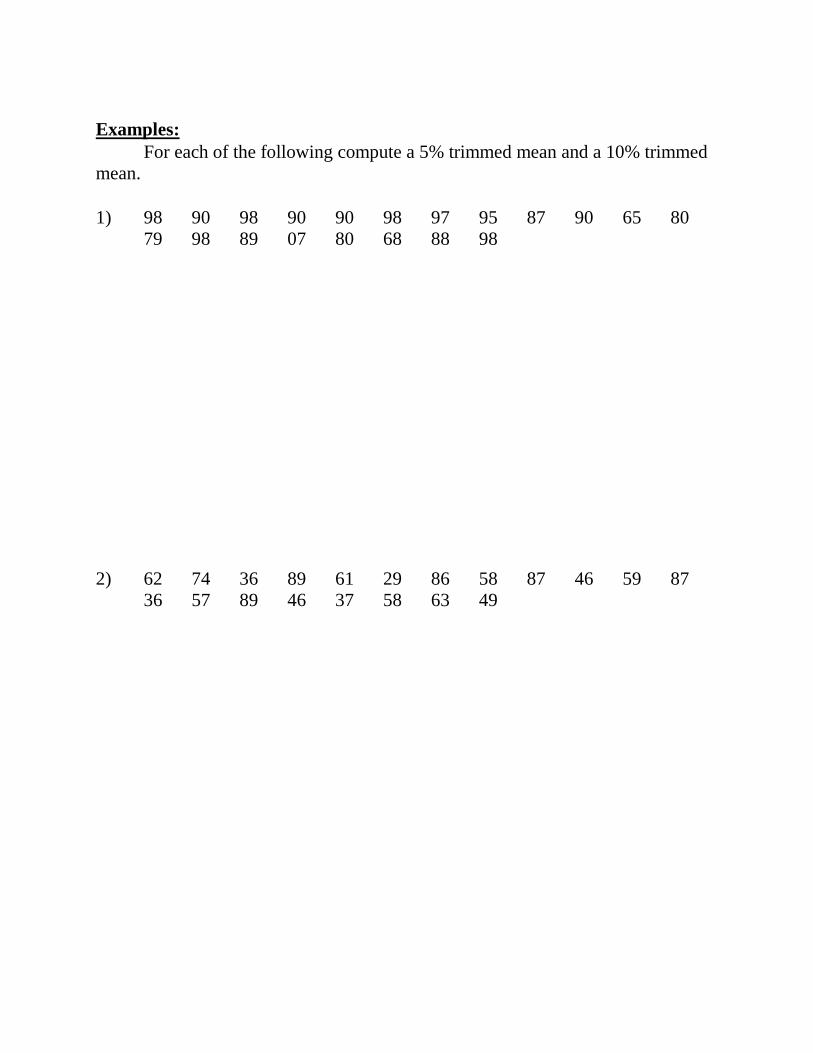
Examples:
For each of the following compute a 5% trimmed mean and a 10% trimmed
mean.
1) 98 90 98 90 90 98 97 95 87 90 65 80
79 98 89 07 80 68 88 98
2) 62 74 36 89 61 29 86 58 87 46 59 87
36 57 89 46 37 58 63 49

3) 67 65 98 61 23 56 43 69 85 23 85 63
82 65 98 32 65 89 43 65
4) 128 927 127 972 972 981 271 279 872 987 297 198
271 982 789 172 819 279 879 217
5) 930 249 923 904 923 940 929 909 930 990 994 919
974 929 932 984 939 983 967 947
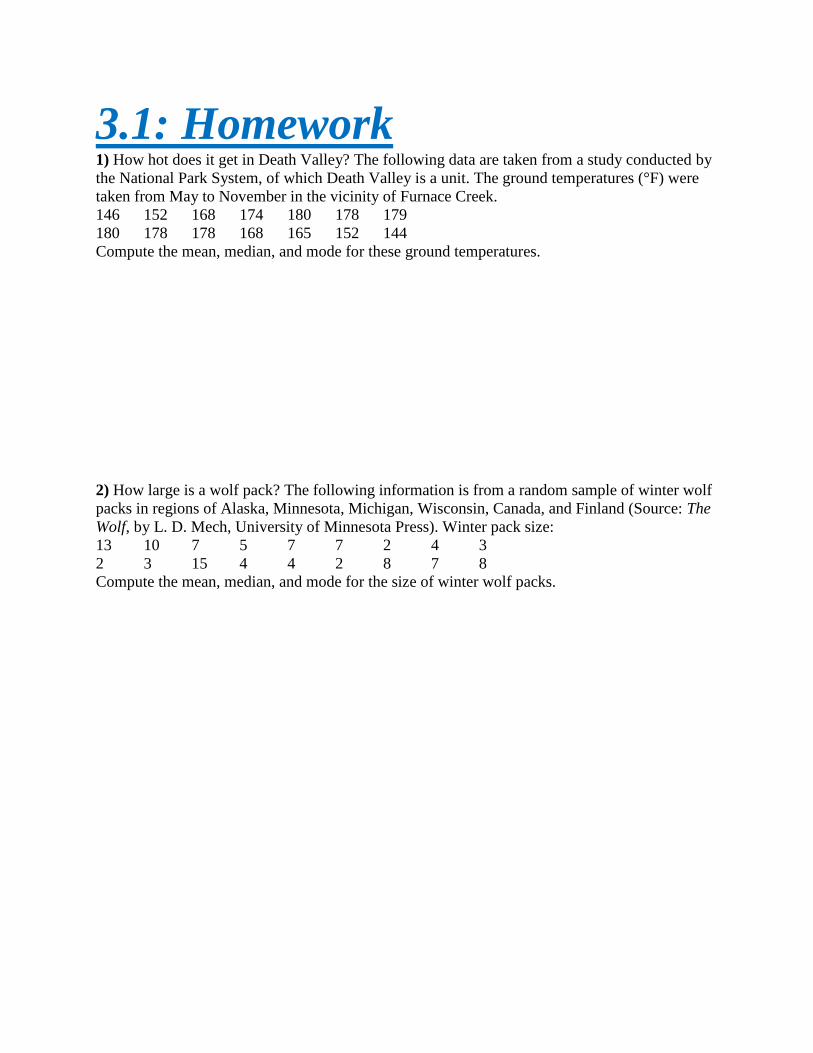
3.1: Homework 1) How hot does it get in Death Valley? The following data are taken from a study conducted by
the National Park System, of which Death Valley is a unit. The ground temperatures (°F) were
taken from May to November in the vicinity of Furnace Creek.
146 152 168 174 180 178 179
180 178 178 168 165 152 144
Compute the mean, median, and mode for these ground temperatures.
2) How large is a wolf pack? The following information is from a random sample of winter wolf
packs in regions of Alaska, Minnesota, Michigan, Wisconsin, Canada, and Finland (Source: The
Wolf, by L. D. Mech, University of Minnesota Press). Winter pack size:
13 10 7 5 7 7 2 4 3
2 3 15 4 4 2 8 7 8
Compute the mean, median, and mode for the size of winter wolf packs.
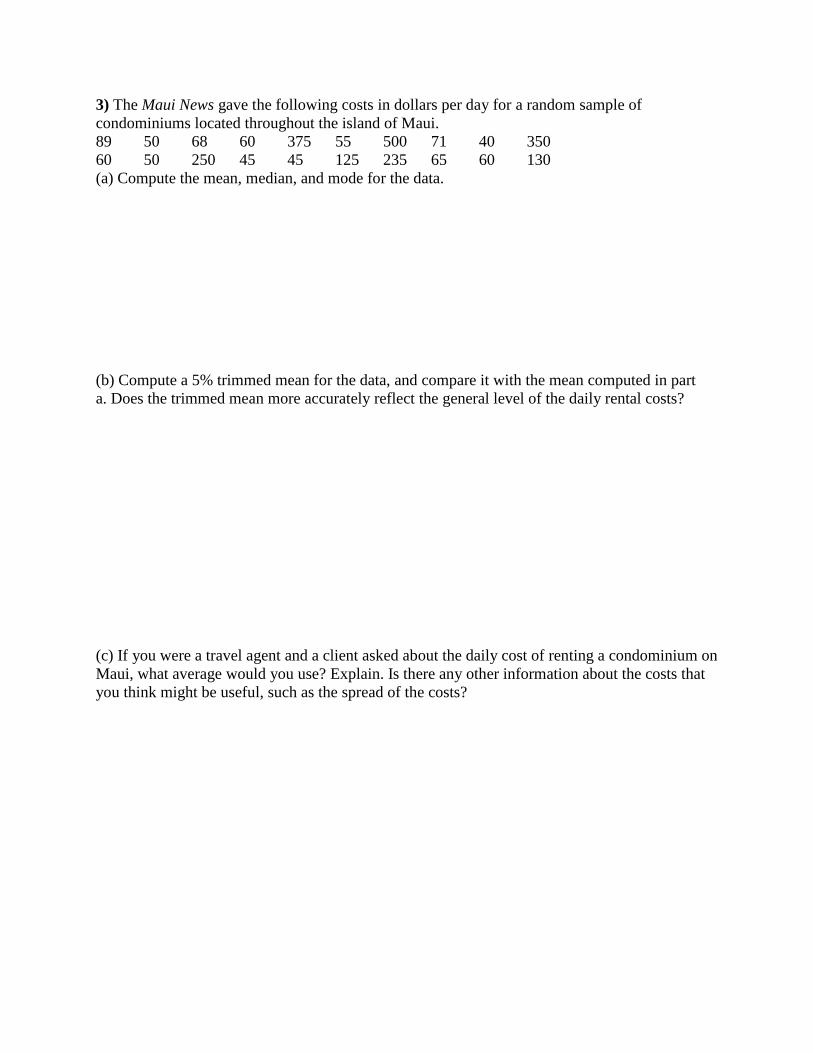
3) The Maui News gave the following costs in dollars per day for a random sample of
condominiums located throughout the island of Maui.
89 50 68 60 375 55 500 71 40 350
60 50 250 45 45 125 235 65 60 130
(a) Compute the mean, median, and mode for the data.
(b) Compute a 5% trimmed mean for the data, and compare it with the mean computed in part
a. Does the trimmed mean more accurately reflect the general level of the daily rental costs?
(c) If you were a travel agent and a client asked about the daily cost of renting a condominium on
Maui, what average would you use? Explain. Is there any other information about the costs that
you think might be useful, such as the spread of the costs?
3.2: Measures of Variation
____________________ – spread of the data.
Measures of Variance:
_________________ – the difference between the largest and smallest values of a
distribution.
**does not tell us how much other values vary from one another.
______________________________ – is a measurement that will give you a
better idea of how the data entries differ from the mean.
****formula differs depending on whether you are using an entire population or
just a sample.
- x is any entry in the distribution, x bar is the mean, and n is the number of entries.
*** Notice that the standard deviation uses the difference between each entry x and
the mean x bar. The quantity (x – x bar) will be _____________ if the mean is
greater than the entry. If you take the sum Σ (x – x bar) then the negative values

will _________________ the positive values, leaving you with a variation measure
of 0 even if some entries vary greatly from the mean. Once the quantities become
___________________, the possibility of having some negative values in the sum
is eliminated.
To Solve a Standard Deviation Problem:
1. Calculate n, the number of entries.
2. Calculate x bar, the mean, by using
3. Create a table using three columns, x, x – x bar, and (x – x bar)2.
4. Add all of the values in the (x – x bar)2 column.
5. To obtain the variance, _________________ the sum from step 4 by n – 1.
6. Use your calculator to take the _____________ of the variance.
A random sample of seven New York plays gave the following information about
how long each play ran on Broadway (in days):
12 45 36 118 50 7 20
a. Find the range.
b. Find the sample mean.
c. Find the sample standard deviation.
Solution:
Part A is rather simple, we know our largest value is 118 and our smallest value is
7. If we substitute that in our range formula we arrive at:
Part B is just asking for the sample mean. We add up all of our entries and divide
by the total number of entries. We then arrive at a sample mean of 41.14 days.

Part C is where it gets a little tricky. Let’s create a chart that breaks down the
standard deviation formula.
After we have completed this chart, we need to take care of the denominator of our
formula, by figure out what n is equal to.
n = ______ therefore n – 1 = ______
We will now take our Σ(x – x bar) 2 = ______ and divide that by n – 1 = ______.
What is the result? ________
If we think about it, this answer only gives us a sample variance. What do you
think we should do to the result above to come up with the sample standard
deviation? Why?
s = ________

Petroleum pollution in oceans is known to increase the growth of a certain bacteria.
Brian did a project for his ecology class for which he made a bacteria count (per
100 milliliters in nine random samples of sea water. His counts gave the following
readings:
17 23 18 19 21
16 12 15 18
a. Find the range.
b. Find the sample mean.
c. Find the sample standard deviation.

In the process of tuna fishing, porpoises are sometimes accidentally caught and
killed. A U.S. oceanographic institute wants to study the number of porpoises
killed. Records from eight commercial tuna fishing fleets gave the following
information about the number of porpoises killed in a three-month period:
6 18 9 0
15 3 10 2
a. Find the range.
b. Find the sample mean.
c. Find the sample standard deviation.

Black Hole Pizza Parlor instructs its cooks to put a “handful” of cheese on each
large pizza. Random samples of six such handfuls were weighed. The weights to
the nearest ounce were:
3 2 3 4 3 5
a. Find the mode, median, and mean weight of the handfuls of cheese.
b. Find the range and standard deviation of the weights.
c. A new cook used to play football and has large hands. His handful of cheese
weighs 6 ounce. Replace the 2 ounce data value by 6 ounces. Recalculate the
mode, median, and mean. Which average changed the most? Comment on the
changes!

Population Mean and Standard Deviation:
Until this point, we have mainly been working with random samples. However,
we can work with the entire population, by computing the __________________
(μ, Greek letter mu) and the ______________________ (σ, Greek letter sigma).
Formulas:
Population Mean:
Population Standard Deviation:
Where N is the number of data values in the population, x represents the individual
data values of the population, μ is the same formula as x bar (sample mean), σ is
the same as the formula for s (sample standard deviation).
To compute these two formulas by hand we will once again construct a
computation table to guide us along the way. Our table will look like this:

Bill has been training for the upcoming track season. He has been running the mile
daily for the past week. His times were as follows (in minutes):
8.7 8.9 7.4 6 8.9 10 12.2
a. Calculate the population mean and population standard deviation.

The recent prices of SFP stock are indicated:
54.3 56.2 57.2 49.5 55.5 56.0 59.9
a) Calculate the range, mode, and median
1. Calculate the sample mean and sample standard deviation.
2. Calculate the population mean and population standard deviation.

On a recent exam, 10 students received the following scores:
86 77 99 100 86 86 82 95 99 100
1. Calculate the range, mode, and median.
2. Calculate the sample mean and standard deviation.
3. Calculate the population mean and population standard deviation.

Coefficient of Variation:
It is often difficult to use our standard deviation formula to compare measurements
from different populations. Due to this fact, statisticians produced the
_______________________________________.
The coefficient of variation expresses the standard deviation as
___________________ of what is being measured relative to the sample or
population mean.
If x bar and s represent the sample mean and the sample standard deviation, then
the coefficient of variation (CV) is defined to be:
If μ and σ represent the population mean and standard deviation, then the
coefficient of variation CV is defined to be:
*** Notice that the numerator and denominator in the definition of CV have the
same units, so CV itself has no units of measurement. This gives us the advantage
of being able to directly compare the variability of 2 different populations using the
coefficient of variation.

To Solve a CV Problem:
1. Calculate the ___________________.
2. Calculate the ____________________________________.
3. Use the formulas above to calculate the coefficient of variation (CV).
During April of 1999, the daily closing of the ABCD, WXY, and Z-corp, gave the
following information:
ABCD WXYZ Z-corp.
Mean values for April 1999 134.4 179.5 98.6
Standard deviation for July 1999 2.6 3.77 3.72
a. For each stock, compute the coefficient of variation.
b. Comment on the results of each stock.

Terrier and SFP are two stocks traded on the New York Stock Exchange. For the
past few weeks you recorded the Friday closing price (dollars per share):
Terrier: 32 35 34 36 31 39
SFP: 51 55 56 52 55 52
a. Compute the mode, median, and mean for Terrier.
b. Compute the mode, median, and mean for SFP.
c. Compute the range, sample standard deviation, and sample variance for Terrier.
d. Compute the range, sample standard deviation, and sample variance for SFP.
e. Compute the coefficient of variation for both Terrier and SFP. Compare the
results and explain the meaning of these numbers.

One of the responsibilities of John’s job in the antique shop is to keep track of the
closing price of a certain portrait. His recorded over the past ten weeks are as
follows (in dollars):
89 94 99 95 96
95 88 96 96 96
a. Compute the mode, median, and mean.
b. Compute the range, sample standard deviation, and sample variance.
c. Compute the coefficient of variation.
The park ranger has been keeping track of the number of endangered species in the
park each month. His ten month data is as follows:
56 55 53 51 50
49 47 45 45 44
a. Compute the mode, median, and mean.
b. Compute the range, sample standard deviation, and sample variance.
c. Compute the coefficient of variation.
d. What do you notice about the numbers?

Chebyshev’s Theorem:
P.L. Chebyshev – Russian Mathematician who lives from 1821 – 1894. He was a
professor at the University of St. Petersburg, where he did a great deal of important
work in both pure and applied mathematics. The most surprising aspect of
Chebyshev’s theorem is that it applies to any and all distributions of data values.
_____________________________________: For any set of data (either
population or sample) and for any constant k __________________ than 1, the
proportion of the data that must lie within k standard deviations on either side of
the mean is at least
In ordinary words, Chebyshev’s Theorem says the following about sample or
population data:
1. Start at the __________________.
2. Back off k standard deviations ____________ the mean and then advance k
standard deviations _________________ the mean.
3. The fractional part of the data in the interval described will be at least 1 – 1/k2
(we assume k > 1).
Minimal Percentage of Data Falling within k Standard Deviations of the
Mean:
k 2 3 4 5 10
*** Take k2 and multiply it by the standard deviation. Add the result to and
subtract the result from the mean to give you the interval.
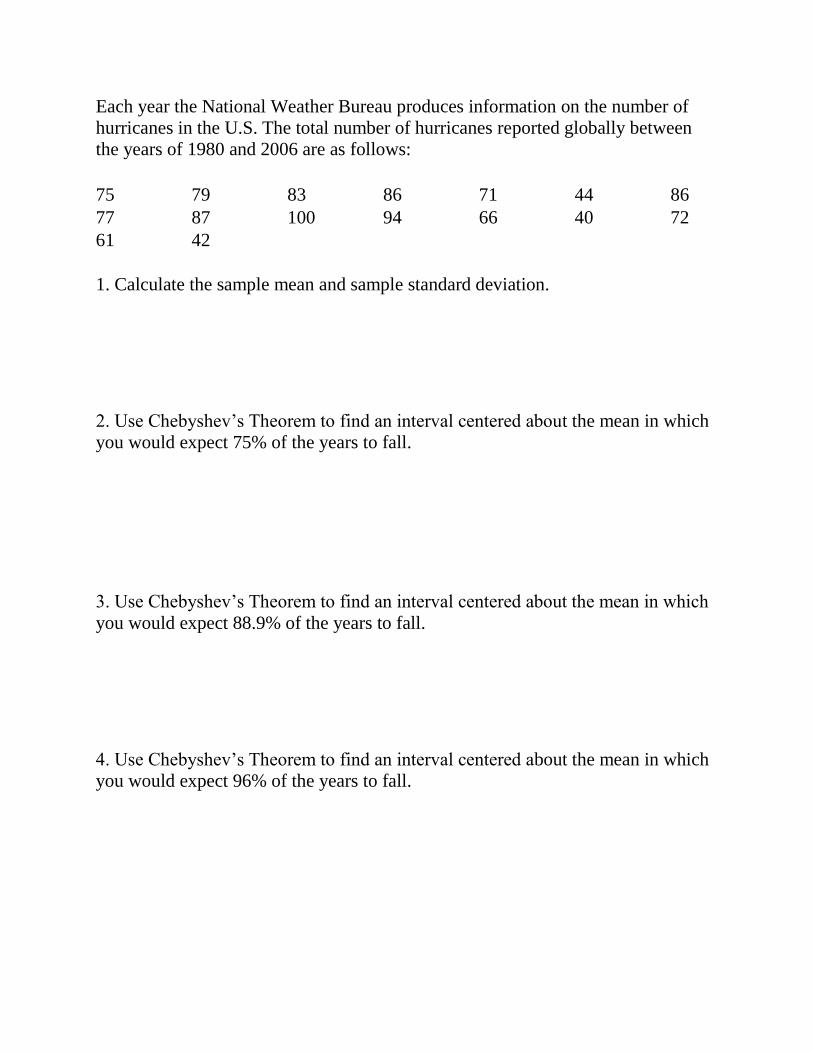
Each year the National Weather Bureau produces information on the number of
hurricanes in the U.S. The total number of hurricanes reported globally between
the years of 1980 and 2006 are as follows:
75 79 83 86 71 44 86
77 87 100 94 66 40 72
61 42
1. Calculate the sample mean and sample standard deviation.
2. Use Chebyshev’s Theorem to find an interval centered about the mean in which
you would expect 75% of the years to fall.
3. Use Chebyshev’s Theorem to find an interval centered about the mean in which
you would expect 88.9% of the years to fall.
4. Use Chebyshev’s Theorem to find an interval centered about the mean in which
you would expect 96% of the years to fall.

Based on the following data, answer the questions below:
89 47 90 82 37 48 92 37 40 72
34 57 43 89 75 30 98 24 75 80
97 58 90 75 98 04 75 89 03 72
58 90 74 07 54 38 97 58 93 47
09 57 48 75 39 82
1. Calculate the sample mean and sample standard deviation.
2. Use Chebyshev’s Theorem to find an interval centered about the mean in which
you would expect 75% of the years to fall.
3. Use Chebyshev’s Theorem to find an interval centered about the mean in which
you would expect 88.9% of the years to fall.
4. Use Chebyshev’s Theorem to find an interval centered about the mean in which
you would expect 96% of the years to fall.

Over the last decade, Amazon.com has sold the following number of books (in
millions):
103 106 114 177 111
162 148 119 120 144
1. Calculate the sample mean and sample standard deviation.
2. Use Chebyshev’s Theorem to find an interval centered about the mean in which
you would expect 75% of the years to fall.
3. Use Chebyshev’s Theorem to find an interval centered about the mean in which
you would expect 93.8% of the years to fall.
4. Use Chebyshev’s Theorem to find an interval centered about the mean in which
you would expect 99% of the years to fall.

3.2: Homework
1) In this problem, we explore the effect on the standard deviation of adding the
same constant to each data value in a data set. Consider the data set 5, 9, 10, 11,
15.
(a) Use a table, or a calculator to compute sx.
(b) Add 5 to each data value to get the new data set 10, 14, 15, 16, 20. Compute sx.
(c) Compare the results of parts (a) and (b). In general, how do you think the
standard deviation of a data set changes if the same constant is added to each data
value?
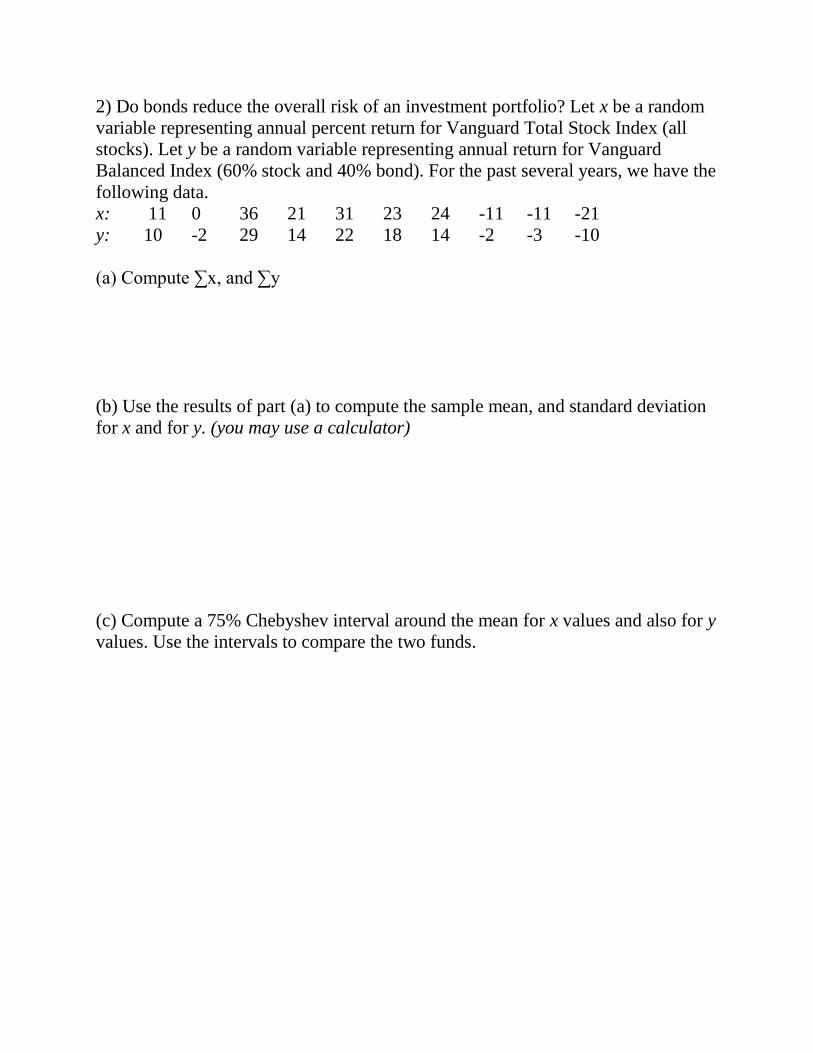
2) Do bonds reduce the overall risk of an investment portfolio? Let x be a random
variable representing annual percent return for Vanguard Total Stock Index (all
stocks). Let y be a random variable representing annual return for Vanguard
Balanced Index (60% stock and 40% bond). For the past several years, we have the
following data.
x: 11 0 36 21 31 23 24 -11 -11 -21
y: 10 -2 29 14 22 18 14 -2 -3 -10
(a) Compute ∑x, and ∑y
(b) Use the results of part (a) to compute the sample mean, and standard deviation
for x and for y. (you may use a calculator)
(c) Compute a 75% Chebyshev interval around the mean for x values and also for y
values. Use the intervals to compare the two funds.
(d) Compute the coefficient of variation for each fund. Use the coefficients of
variation to compare the two funds. If s represents risks and represents expected
return, then can be thought of as a measure of risk per unit of expected return. In
this case, why is a smaller CV better? Explain.
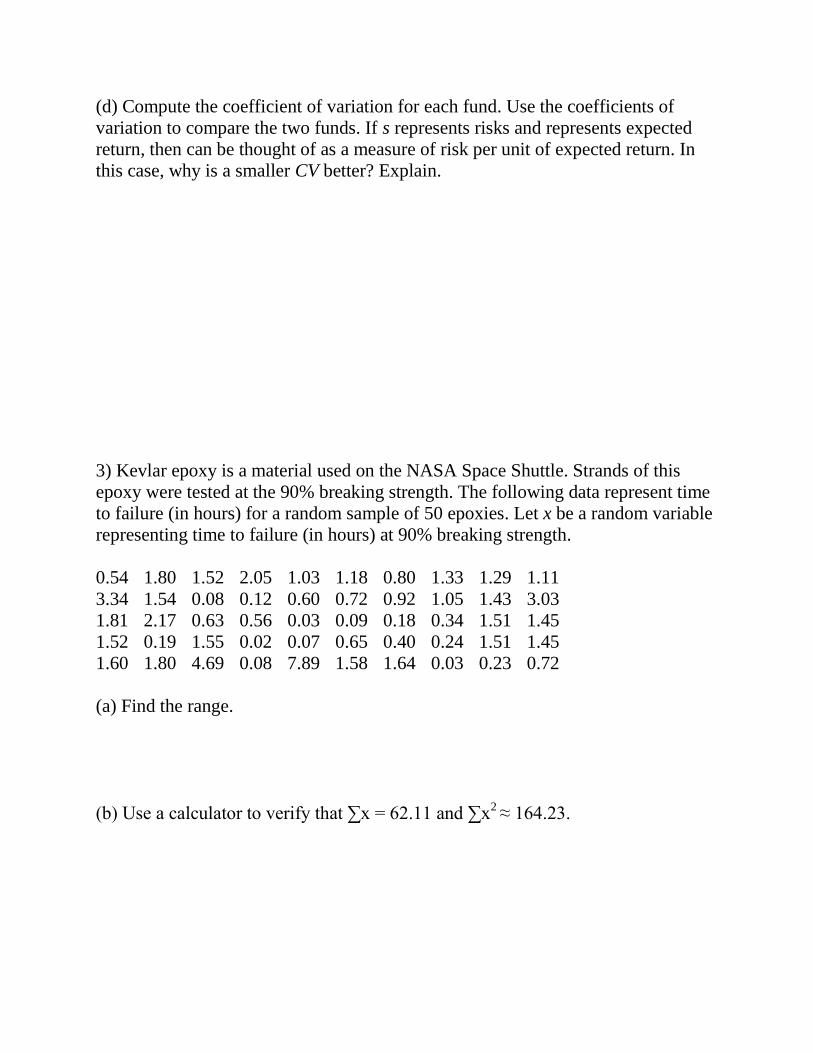
3) Kevlar epoxy is a material used on the NASA Space Shuttle. Strands of this
epoxy were tested at the 90% breaking strength. The following data represent time
to failure (in hours) for a random sample of 50 epoxies. Let x be a random variable
representing time to failure (in hours) at 90% breaking strength.
0.54 1.80 1.52 2.05 1.03 1.18 0.80 1.33 1.29 1.11
3.34 1.54 0.08 0.12 0.60 0.72 0.92 1.05 1.43 3.03
1.81 2.17 0.63 0.56 0.03 0.09 0.18 0.34 1.51 1.45
1.52 0.19 1.55 0.02 0.07 0.65 0.40 0.24 1.51 1.45
1.60 1.80 4.69 0.08 7.89 1.58 1.64 0.03 0.23 0.72
(a) Find the range.
(b) Use a calculator to verify that ∑x = 62.11 and ∑x2 ≈ 164.23.

(c) Use the results of part (b) to compute the sample mean, and sample standard
deviation for the time to failure. (you may use a calculator)
(d) Use the results of part (c) to compute the coefficient of variation. What does
this number say about time to failure? Why does a small CV indicate more
consistent data, whereas a larger CV indicates less consistent data? Explain.
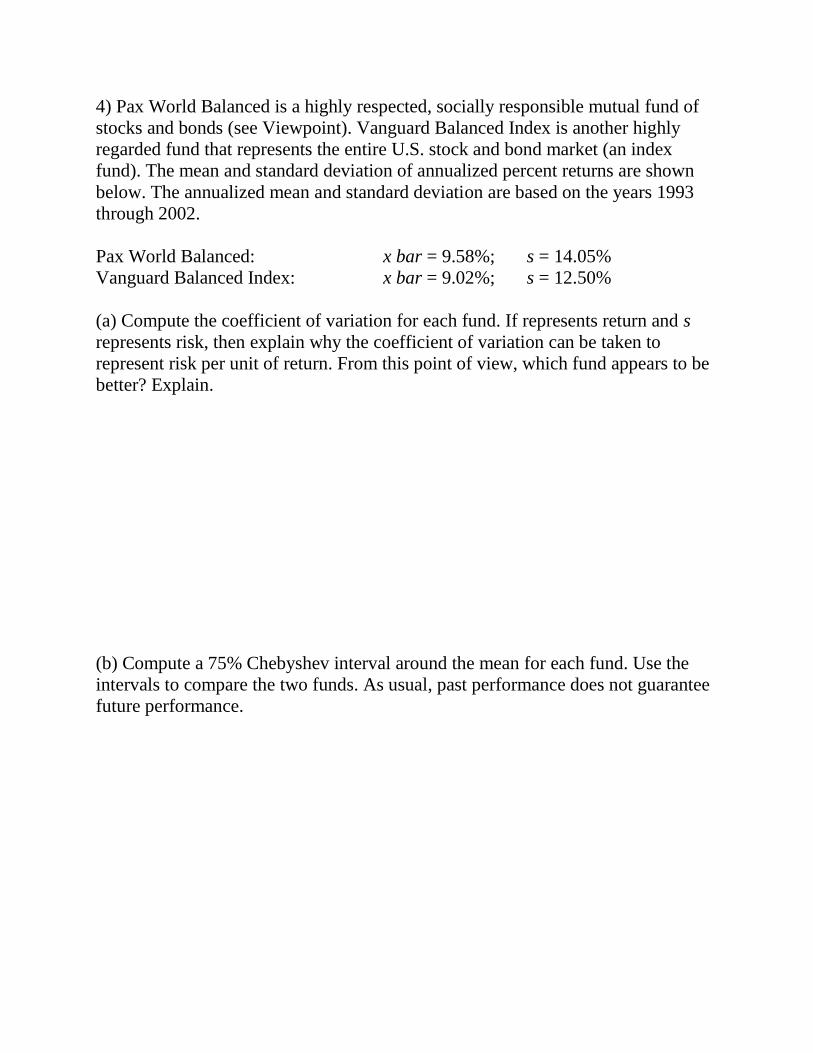
4) Pax World Balanced is a highly respected, socially responsible mutual fund of
stocks and bonds (see Viewpoint). Vanguard Balanced Index is another highly
regarded fund that represents the entire U.S. stock and bond market (an index
fund). The mean and standard deviation of annualized percent returns are shown
below. The annualized mean and standard deviation are based on the years 1993
through 2002.
Pax World Balanced: x bar = 9.58%; s = 14.05%
Vanguard Balanced Index: x bar = 9.02%; s = 12.50%
(a) Compute the coefficient of variation for each fund. If represents return and s
represents risk, then explain why the coefficient of variation can be taken to
represent risk per unit of return. From this point of view, which fund appears to be
better? Explain.
(b) Compute a 75% Chebyshev interval around the mean for each fund. Use the
intervals to compare the two funds. As usual, past performance does not guarantee
future performance.

3.3: Mean and Standard
Deviation of Grouped Data
If you have many data values, it can be very time consuming to compute the mean
and standard deviation. This includes when you are able to use the calculator,
since you still have to put your data values into a list. In many cases a close
approximation to the mean and standard deviation is all that is needed. It is not
difficult to approximate these two values from a ________________________.
Procedure:
1) Make a frequency table corresponding to the histogram.
2) Compute the ____________________ for each class and call it x.
3) Count the number of ______________ in each class and denote the number by f.
4) ________________ the number of entries from each class together to find the
total number of entries n in the sample distribution.
Sample Mean for a Frequency Distribution
,where x is the midpoint of a class, f is the number of entries in that class, n is the
total number of entries in the distribution, and the summation Σ is over all classes
in the distribution.
Sample Standard Deviation for a Frequency Distribution:


Weighted Average:
There are instances where we would like to take an average of data, but assign
more importance _______________________ to some of these numbers.
If we view the weight of a measurement as “frequency” then we discover that the
formula for the mean of a frequency distribution gives us the weighted average.
where w is the weight of the data value x.

Suppose you were being evaluated in a speech competition. The following criteria
will be evaluated: punctuality, performance, delivery, length, and pronunciation.
You are being evaluated on a scale of 1 – 10 with certain weights being assigned to
each category as follows:
If the minimum score to advance to the next round is 5, will you advance?

Your grade in a certain class will be based on the following with the weights
shown: tests (45%), quizzes (20%), homework (15%), attendance (15%), and class
participation (5%). You receive the following grades in each category: tests – 80,
quizzes – 95, homework – 90, attendance – 78, and class participation – 100. What
is your grade?
On the first day of college your bio-molecular physics professor hands you a rubric
on how you will be graded. You notice that attendance, projects, presentations,
and a final exam will be evaluated. The weights assigned to each of these are:
attendance (5%), tests (20%), projects (30%), presentations (30%), and final exam
(15%). You have been given the following grades in each area: attendance – 100,
tests – 87, projects – 95, presentations – 91, and final exam – 89. You are
currently on scholarship and need to receive an A in every class. In this class an A
can be obtained by getting a 91 or above. Do you maintain your scholarship for
the following semester?

Two stocks are being evaluated by an investor. He will select the stock that has a
higher average in all of the following categories: dividend (20%), security (50%),
and growth (30%). He studies ESPN and FSNY and gives the following ratings on
a scale of 1 – 20:
Which stock the investor select and why?
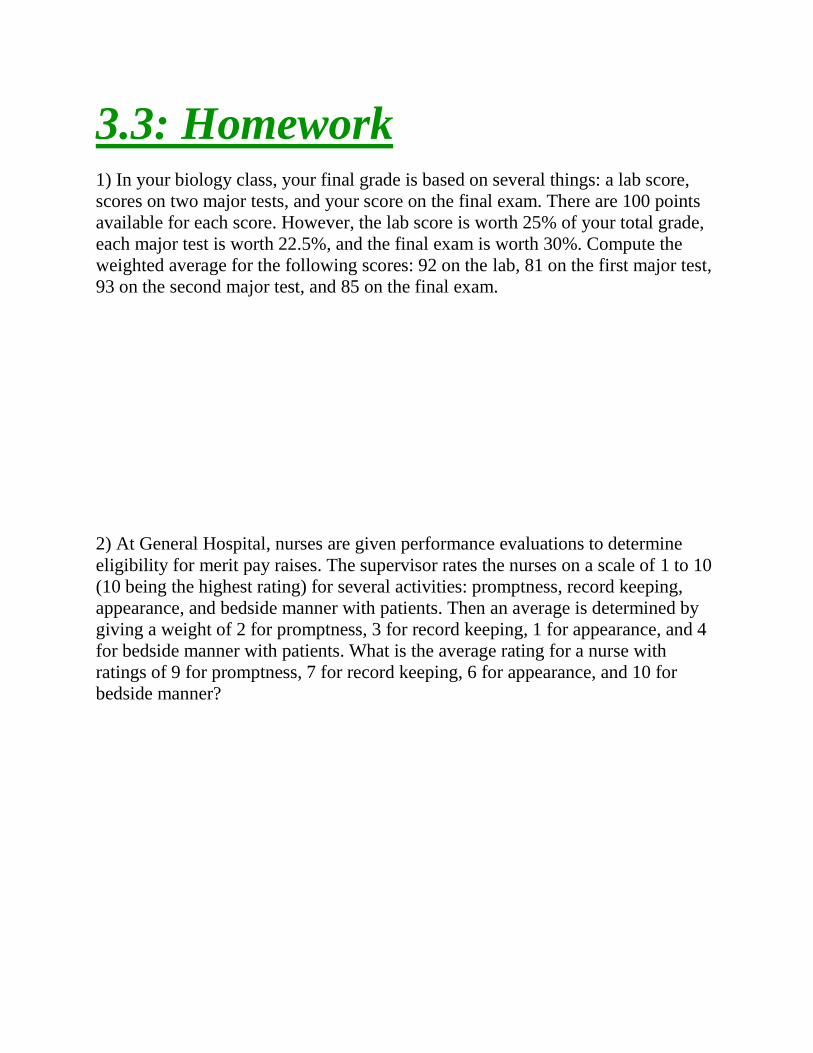
3.3: Homework
1) In your biology class, your final grade is based on several things: a lab score,
scores on two major tests, and your score on the final exam. There are 100 points
available for each score. However, the lab score is worth 25% of your total grade,
each major test is worth 22.5%, and the final exam is worth 30%. Compute the
weighted average for the following scores: 92 on the lab, 81 on the first major test,
93 on the second major test, and 85 on the final exam.
2) At General Hospital, nurses are given performance evaluations to determine
eligibility for merit pay raises. The supervisor rates the nurses on a scale of 1 to 10
(10 being the highest rating) for several activities: promptness, record keeping,
appearance, and bedside manner with patients. Then an average is determined by
giving a weight of 2 for promptness, 3 for record keeping, 1 for appearance, and 4
for bedside manner with patients. What is the average rating for a nurse with
ratings of 9 for promptness, 7 for record keeping, 6 for appearance, and 10 for
bedside manner?

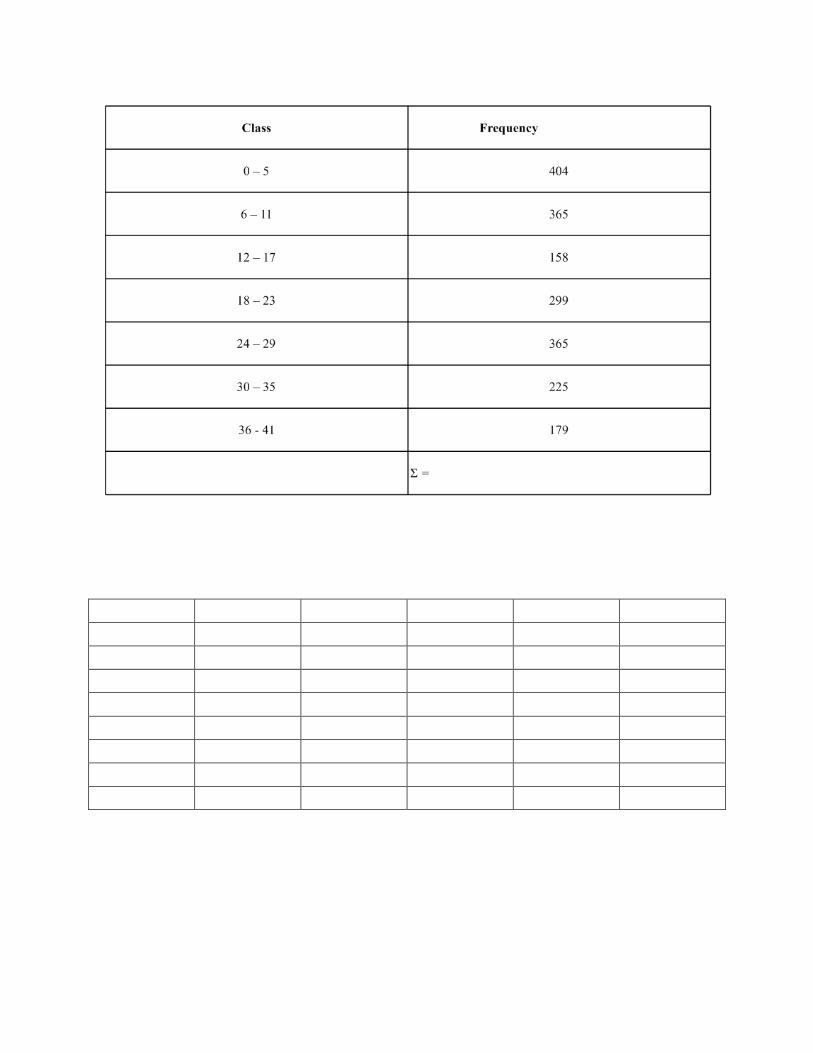
3) What are the big corporations doing with their wealth? One way to answer this question is to
examine profits as percentage of assets. A random sample of 50 Fortune 500 companies gave the
following information.
Estimate the sample mean and sample standard deviation for profit as percentage of assets.
3.4: Percentiles and Box-and-
Whisker Plots
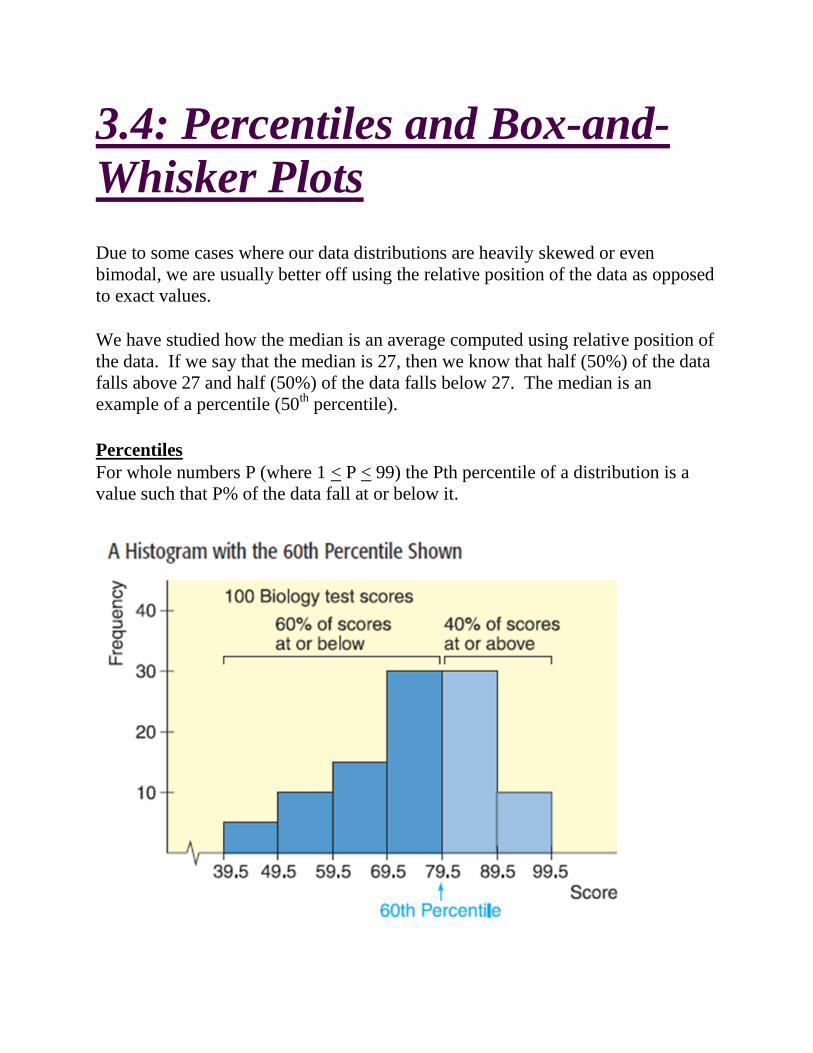
Due to some cases where our data distributions are heavily skewed or even
bimodal, we are usually better off using the relative position of the data as opposed
to exact values.
We have studied how the median is an average computed using relative position of
the data. If we say that the median is 27, then we know that half (50%) of the data
falls above 27 and half (50%) of the data falls below 27. The median is an
example of a percentile (50th percentile).
Percentiles
For whole numbers P (where 1 < P < 99) the Pth percentile of a distribution is a
value such that P% of the data fall at or below it.

_________________________ are the summary measures that divide a ranked
data set into 100 equal parts. Each (ranked) data set has 99 percentiles that divide
it into 100 equal parts. The data set should be ranked in increasing order to
compute percentiles. The kth percentile is denoted Pk, where k is an integer in the
range 1 to 99. For instance, the 25th
percentile is denoted by P25.
The kth percentile, Pk, can be defined as a value in a data set such that about k% of
the measurements are smaller than the value of Pk and about (100 – k)% of the
measurements are greater than the value of Pk.
Calculating Percentiles:
The approximate value of the kth percentile, denoted by Pk is:
Pk = Value of the (kn ÷ 100)th term in a ranked data set
where k denotes the number of the _______________ and n represents the
___________________
Example:
Use the following data values:
284 586 987 412 256 541 312 251 444 695
Find the position of the
1) 42nd
percentile
2) 53rd
percentile
3)88th percentile

Finding Percentile Rank of a Value:
We can also calculate the ____________________ for a particular value x1 of a
data set by using the formula given below. The percentile rank of x1 gives the
percentage of values in the data set that are less than x1.
Example:
Use the data set from above to find the following
1) the percentile rank of 312
2) the percentile rank of 444
3) the percentile rank of 586

Quartiles – percentiles which divide the data into _____________.
Example:
1st quartile = 25
th percentile
2nd
quartile = median
3rd
quartile = 75th percentile
Interquartile Range:
A useful measure of data spread utilizing relative position is the interquartile range
(IQR). This is the difference between the 3rd
and 1st quartiles.
This range tells us the spread of the ___________________ of the data.
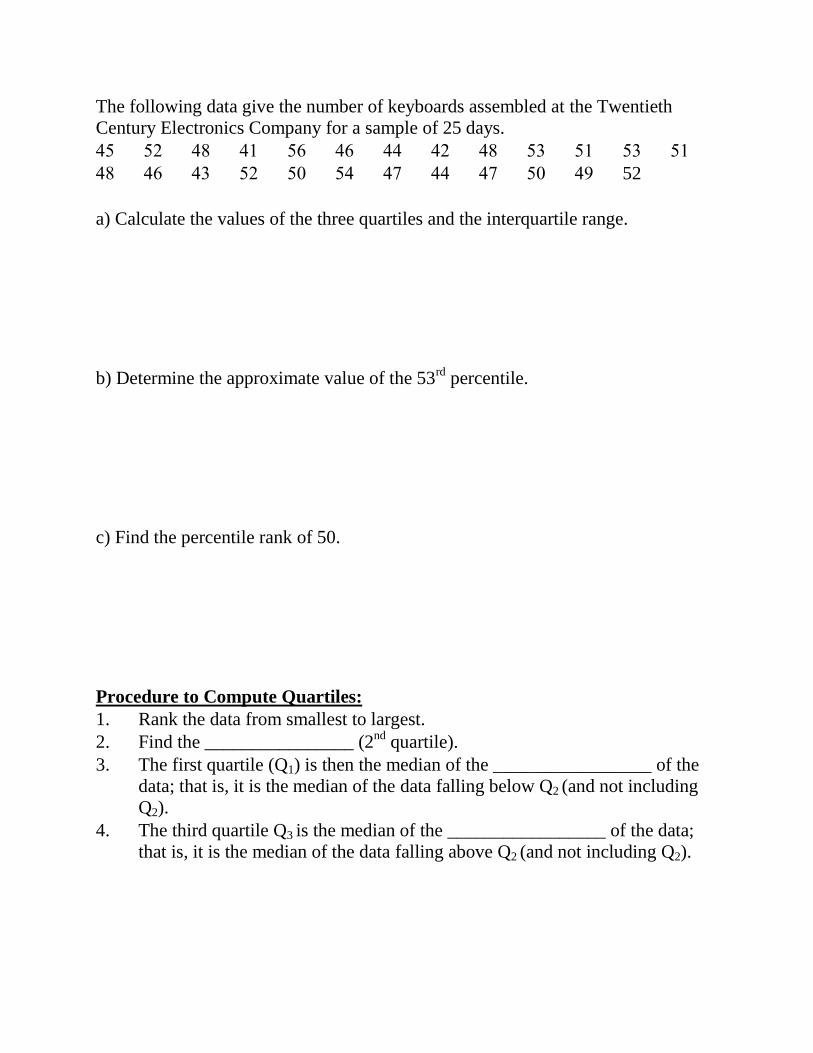
The following data give the number of keyboards assembled at the Twentieth
Century Electronics Company for a sample of 25 days.
45 52 48 41 56 46 44 42 48 53 51 53 51
48 46 43 52 50 54 47 44 47 50 49 52
a) Calculate the values of the three quartiles and the interquartile range.
b) Determine the approximate value of the 53rd
percentile.
c) Find the percentile rank of 50.
Procedure to Compute Quartiles:
1. Rank the data from smallest to largest.
2. Find the ________________ (2nd
quartile).
3. The first quartile (Q1) is then the median of the _________________ of the
data; that is, it is the median of the data falling below Q2 (and not including
Q2).
4. The third quartile Q3 is the median of the _________________ of the data;
that is, it is the median of the data falling above Q2 (and not including Q2).

For each of the following data sets, calculate the median rank, median, 1st quartile,
3rd
quartile, and interquartile range:
1) 100 97 106 87 94 102 101 99 86 78 96 56
80 106 111 87 88 80 96 98 96 91
2) 78 89 56 67 45 67 89 78 55 44 78 55
34 90 66 54 78 97 67 89 76 78 89 88
3) 67 215 56 81 96 200 197 196 133 145 99 100
154 167 166 189 177 189 199 222 221 67 71 98
87 78
4) 333 456 399 345 390 411 400 405 415 388 327
378 345 377 389 378 322 267 400 409 467 422

Box-and-Whisker Plots:
The quartiles, together with the low and high data values give us a very useful
________________________________________
Five Number Summary:
1) Lowest Value
2) Q1
3) Median
4) Q2
5) Highest Value
We use all five numbers to create a graphical sketch of the data called a
________________________________. These plots are a useful way to describe
data for exploratory data analysis (EDA).
To Construct a Box-and-Whisker Plot:
1) Draw a horizontal scale to include the highest and lowest data values.
2) To the right of the scale draw a box from Q1 to Q3.
3) Include a solid line through the box at the median level.
4) Draw solid lines, called whiskers, from Q1 to the lowest value and from Q3 to
the highest value.
1) 45 67 34 78 29 68 32 64 78 96 54 05
54 97 65 94 86 09 05 46 79 05 69 80
76 09 76 98 07 69

2) 64 39 75 86 34 57 64 37 60 38 92 14
83 74 97 29 37 43 97 98 72 49 87 39
84 79 82 37 49 83 74 98 32 74 74 93
3) 65 74 86 39 86 57 89 36 58 73 65 34
65 83 65 89 26 59 29 27 50 92 17 34
90 75 98 37


Try these examples using the Calculator:
1) 62 39 86 43 82 65 78 23 46
58 47 83 26 57 34 65 62 53
64 56 43 65 76 34 56 38 26
59 36 54 62 58 29 64 53 57
23 58 43 26 96 26 66 57 63
45 23 65
2) 768 296 587 964 969 483 654 658 569
236 534 693 653 298 659 465 326 590
912 078 993 218 075 098 570 397 597
947 598 753 275 107 074 309 874 594
738 787 937 210 710 710 674 896 037
280 763 073 534 523 563 535 635 436
535 435 433 533 334 535 634 535 435
635 634 652
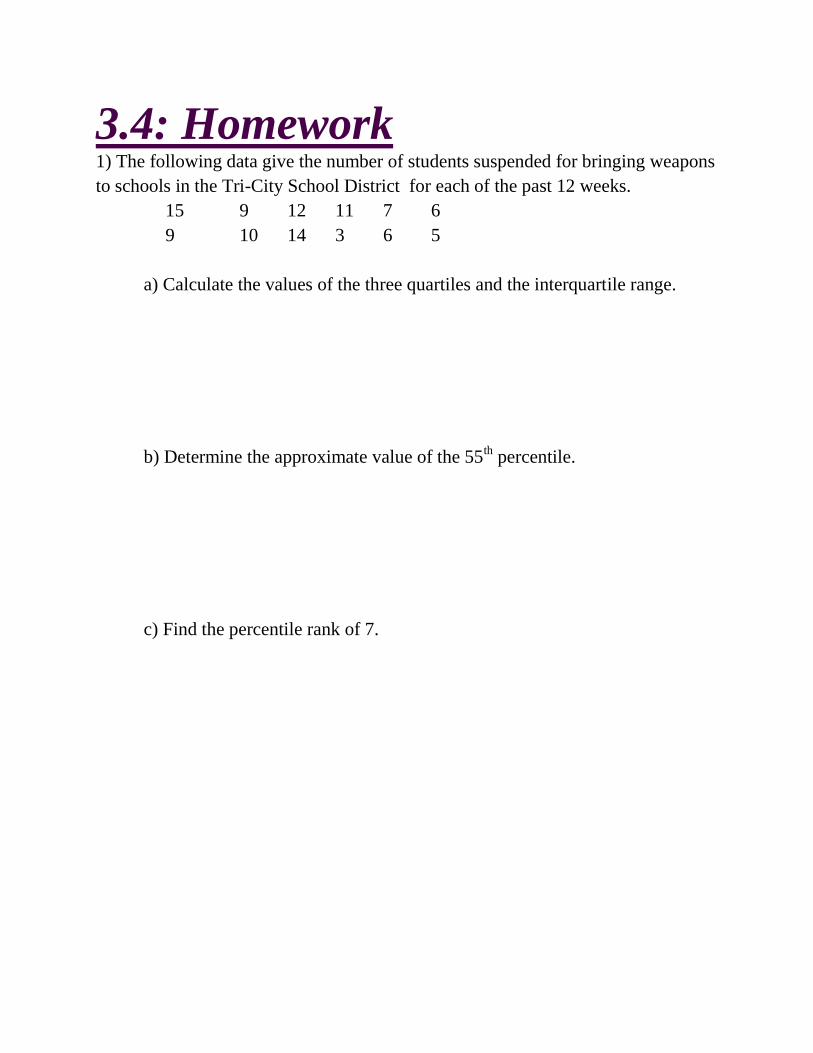
3.4: Homework 1) The following data give the number of students suspended for bringing weapons
to schools in the Tri-City School District for each of the past 12 weeks.
15 9 12 11 7 6
9 10 14 3 6 5
a) Calculate the values of the three quartiles and the interquartile range.
b) Determine the approximate value of the 55th percentile.
c) Find the percentile rank of 7.
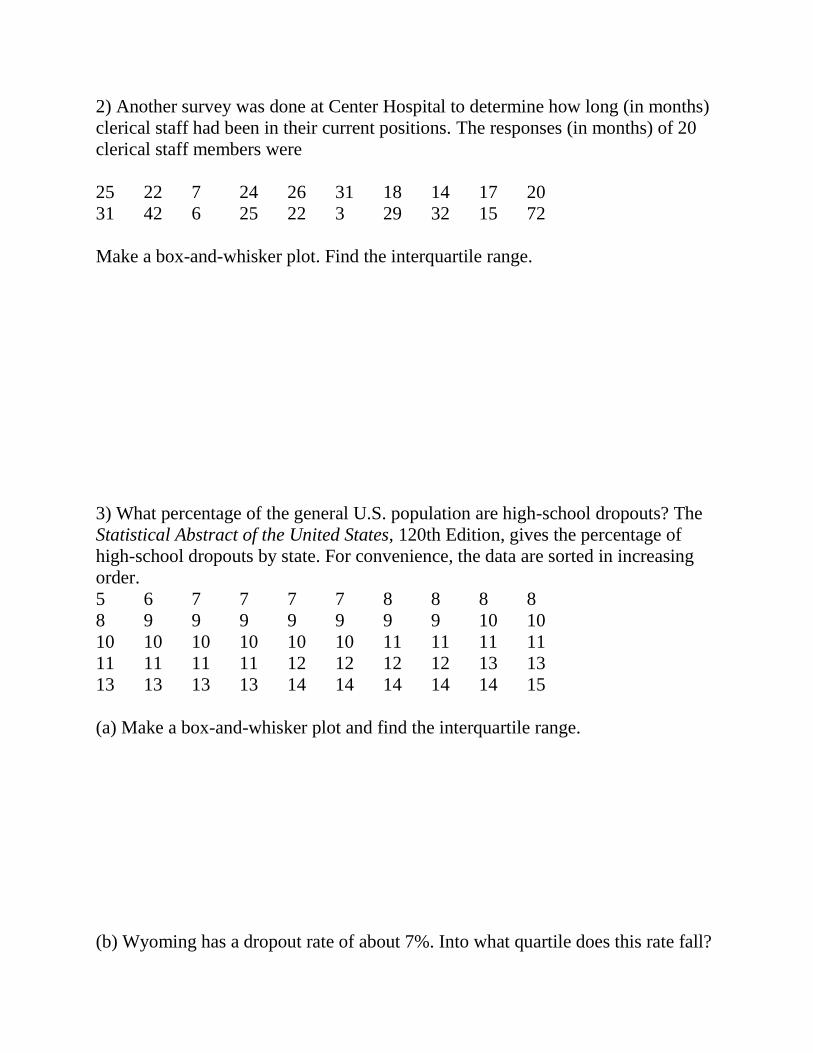
2) Another survey was done at Center Hospital to determine how long (in months)
clerical staff had been in their current positions. The responses (in months) of 20
clerical staff members were
25 22 7 24 26 31 18 14 17 20
31 42 6 25 22 3 29 32 15 72
Make a box-and-whisker plot. Find the interquartile range.
3) What percentage of the general U.S. population are high-school dropouts? The
Statistical Abstract of the United States, 120th Edition, gives the percentage of
high-school dropouts by state. For convenience, the data are sorted in increasing
order.
5 6 7 7 7 7 8 8 8 8
8 9 9 9 9 9 9 9 10 10
10 10 10 10 10 10 11 11 11 11
11 11 11 11 12 12 12 12 13 13
13 13 13 13 14 14 14 14 14 15
(a) Make a box-and-whisker plot and find the interquartile range.
(b) Wyoming has a dropout rate of about 7%. Into what quartile does this rate fall?

4) Consumer Reports rated automobile insurance companies and gave annual
premiums for top-rated companies in several states. The figure shows box plots for
annual premiums for urban customers (married couple with one 17-year-old son) in
three states. The box plots in the figure were all drawn using the same scale on a
TI-84Plus/TI-83Plus calculator.
a) Texas b) Pennsylvania c) California
(a) Which state has the lowest premium? Which state has the highest premium?
(b) Which state has the highest median premium?
(c) Which state has the smallest range of premiums? Which state has the smallest
interquartile range?


![Mean, Mode, Median[1]](https://static.fdocuments.in/doc/165x107/54625097af7959aa3d8b540f/mean-mode-median1-5584ae32b6452.jpg)


![Mean, Mode, Median[1]](https://static.fdocuments.in/doc/165x107/5462509daf7959fe1b8b57b8/mean-mode-median1-5584ae32b3357.jpg)
