31 January 2018 2017 Earnings Presentation - Santander€¦ · 2017 Earnings Presentation 31...
101
2017 Earnings Presentation 31 January 2018 Ana Botín, Group Executive Chairman José Antonio Álvarez, Group CEO
Transcript of 31 January 2018 2017 Earnings Presentation - Santander€¦ · 2017 Earnings Presentation 31...

2017 Earnings Presentation31 January 2018
Ana Botín, Group Executive ChairmanJosé Antonio Álvarez, Group CEO
2
Banco Santander, S.A. ("Santander") cautions that this presentation contains statements that constitute “forward-looking statements” within the meaning of the U.S. Private Securities LitigationReform Act of 1995. Forward-looking statements may be identified by words such as “expect”, “project”, “anticipate”, “should”, “intend”, “probability”, “risk”, “VaR”, “RORAC”, “RoRWA”, “TNAV”,“target”, “goal”, “objective”, “estimate”, “future” and similar expressions. These forward-looking statements are found in various places throughout this presentation and include, without limitation,statements concerning our future business development and economic performance and our shareholder remuneration policy. While these forward-looking statements represent our judgment andfuture expectations concerning the development of our business, a number of risks, uncertainties and other important factors could cause actual developments and results to differ materially from ourexpectations. These factors include, but are not limited to: (1) general market, macro-economic, industry, governmental and regulatory trends; (2) movements in local and international securitiesmarkets, currency exchange rates and interest rates; (3) competitive pressures; (4) technological developments; and (5) changes in the financial position or credit worthiness of our customers, obligorsand counterparties. Numerous factors, including those reflected in the Annual Report on Form 20-F filed with the Securities and Exchange Commission of the United States of America (the “SEC”) –under “Key Information-Risk Factors”- and in the Documento de Registro de Acciones filed with the Spanish Securities Market Commission (the “CNMV”) –under “Factores de Riesgo”- could affect thefuture results of Santander and could result in other results deviating materially from those anticipated in the forward-looking statements. Other unknown or unpredictable factors could cause actualresults to differ materially from those in the forward-looking statements.
Forward-looking statements speak only as of the date of this presentation and are based on the knowledge, information available and views taken on such date; such knowledge, information and viewsmay change at any time. Santander does not undertake any obligation to update or revise any forward-looking statement, whether as a result of new information, future events or otherwise.
The information contained in this presentation is subject to, and must be read in conjunction with, all other publicly available information, including, where relevant any fuller disclosure documentpublished by Santander. Any person at any time acquiring securities must do so only on the basis of such person's own judgment as to the merits or the suitability of the securities for its purpose andonly on such information as is contained in such public information having taken all such professional or other advice as it considers necessary or appropriate in the circumstances and not in reliance onthe information contained in the presentation. No investment activity should be undertaken on the basis of the information contained in this presentation. In making this presentation available,Santander gives no advice and makes no recommendation to buy, sell or otherwise deal in shares in Santander or in any other securities or investments whatsoever.
Neither this presentation nor any of the information contained therein constitutes an offer to sell or the solicitation of an offer to buy any securities. No offering of securities shall be made in theUnited States except pursuant to registration under the U.S. Securities Act of 1933, as amended, or an exemption therefrom. Nothing contained in this presentation is intended to constitute aninvitation or inducement to engage in investment activity for the purposes of the prohibition on financial promotion in the U.K. Financial Services and Markets Act 2000.
Note: Statements as to historical performance or financial accretion are not intended to mean that future performance, share price or future earnings (including earnings per share) for any period willnecessarily match or exceed those of any prior year. Nothing in this presentation should be construed as a profit forecast.
The businesses included in each of our geographic segments and the accounting principles under which their results are presented here may differ from the included businesses and local applicableaccounting principles of our public subsidiaries in such geographies. Accordingly, the results of operations and trends shown for our geographic segments may differ materially from those of suchsubsidiaries.
Important Information

3
Important Information
In addition to the financial information prepared under International Financial Reporting Standards (“IFRS”), this presentation includes certain alternative performance measures as definedin the Guidelines on Alternative Performance Measures issued by the European Securities and Markets Authority on 5 October 2015 (ESMA/2015/1415es) as well as Non-IFRS measures. TheAPMs and Non-IFRS Measures are performance measures that have been calculated using the financial information from the Santander Group but that are not defined or detailed in theapplicable financial information framework and therefore have neither been audited nor are capable of being completely audited. These APMs and Non-IFRS Measures are been used toallow for a better understanding of the financial performance of the Santander Group but should be considered only as additional information and in no case as a replacement of thefinancial information prepared under IFRS. Moreover, the way the Santander Group defines and calculates these APMs and Non-IFRS Measures may differ to the way these are calculated byother companies that use similar measures, and therefore they may not be comparable. For further details of the APMs and Non-IFRS Measures used, including its definition or areconciliation between any applicable management indicators and the financial data presented in the consolidated financial statements prepared under IFR, see Section 26 of theDocumento de Registro de Acciones for Banco Santander filed with the CNMV on July 4, 2017 (available on the Web page of the CNMV -www.cnmv.es- and at Banco Santander -www.santander.com), Item 3A of the Annual Report on Form 20-F for the year ended December 31, 2016, filed with the U.S. Securities and Exchange Commission on March 31, 2017 (the“Form 20-F”) and section Alternative Performance Measures of the Financial Report 4th Quarter 2017 (available at Banco Santander –www.santander.com). For a discussion of the accountingprinciples used in translation of foreign currency-denominated assets and liabilities to euros, see note 2(a) to our consolidated financial statements on Form 20-F and to our consolidatedfinancial statements available on the CNMV’s website (www.cnmv.es) and on Banco Santander’s website (www.santander.com).

4
Delivering ahead of plan1Group and business areas review22018 Strategic priorities3Key takeaways4Appendix5

5
2017 key achievements
Growth
Loyal customers
17Mn (+13%)
Customer revenues
€45,892Mn (+11%)
Underlying RoTE
c.12% (+70 bps)
Profitability
Cost-to-income
c.47% (-70 bps)
FL CET1
10.84% (+29 bps)
Strength
NPL ratio
4.08% (+15 bps)
5Note: All metrics include Popular, except ´loyal customers´

6
Growth: Underlying PBT +20% YoY and attributable profit +7% YoY
Net interest income
Net fees
Customer revenues
Other income
Gross income
Operating expenses
Net operating income
Net loan-loss provisions
Underlying PBT
Attributable profit
Change2017 2016
+10%
+14%
+11%
-3%
+10%
+9%
+12%
-4%
+20%
+7%
€Mn34,296
11,597
45,892
2,499
48,392
-22,918
25,473
-9,111
13,550
6,619
31,089
10,180
41,268
2,585
43,853
-21,088
22,766
-9,518
11,288
6,204
Allfunds +297
Integration processes -385
Goodwill -603
Other -206
Total -897
Net capital gains & provisions

7
Growth: Building loyalty & deeper relationships
Note: Customer metrics exclude Popular
Loyal customers
17.3Mn
+13%YoY growth
Digital customers
25.4Mn
+21%YoY growth
Net fees
€11.6Bn
+14%YoY growth

8
Underlying RoTE
c.12%9%
Source: Company data and BloombergNote: RoTE as of 9M´17 for peers. Global Peers included in the average are Wells Fargo, JP Morgan, Bank of America, UBS, BBVA, ING, BNP Paribas, HSBC, Unicredit, Lloyds, Citibank, Intesa Sanpaolo, Société Générale, Standard Chartered, and Deutsche Bank. Santander vs peers average based on ROTEs in local criteria
Profitability: RoTE improves +70bps YoY to c.12%
Global Peers
Europe
8%
Local peers avg.
12%
Americas
17%17%
(+1pp)
(+2pp)
(YoY)
Local peers avg.
(YoY)

9
Cost-to-income
Profitability: Our cost-to-income improves by 70bps YoY to c.47%
Note: Local criteria (1) Brazil local peers include only private banks
Source: Cost to income company data and Bloomberg. Note: Cost-to-income as of 9M´17 for peers. Peers included for average are Wells Fargo, JP Morgan, Bank of America, UBS, BBVA, ING, BNP Paribas, HSBC, Unicredit, Lloyds, Citibank, Intesa Sanpaolo, Société Générale, Standard Chartered, Deutsche Bank and Barclays
c.47%64%
Top 3 in customer satisfaction
Global Peers

10
Strength: Focused on profitable growth & disciplined capital allocation
c.12%1.5%
RoTE
RoRWA
Organic growth
ArgentinaPoland
Acquisitions
Real Estate
2017
(1) Underlying, including PSA operations
1
1
Inorganic growth
Disposals
c.11%1.4%
2016CET1 FL (YoY)
10.84%
2016
10.55%
2017
+53 bps(organic)
-19 bps(perimeter)
-5 bps(other)
+29 bps

11
Key challenges addressed in thefirst 60 days…
Strength: Priority for SAN Spain/Popular is responsible and profitable growth
51% Popular Real estate disposal
Loyalty bond acceptance
deposits mkt share (Jun/Oct)
revenues (YoY)*
to RoTE (YoY)*
* Excluding Popular.
from
…while managing integration …
Customer satisfaction
…in a responsible way
Wages

12
2017 Targets2017
Loyal customers (Mn) 1717
Digital customers (Mn) 2525
Fee income Increase13%
Cost of credit risk Improve1.07%
Cost-to-income Broadly stable47.4%
EPS (€) Increase0.40
DPS (€) Increase0.22
FL CET1 +40bps+53bps
RoTE Increase11.8%
1
2
3
Delivered all strategic targets ahead of plan…
Note: Customer metrics exclude Popular (1) % change (constant euros) (2) Total dividends charged to 2017 earnings are subject to the Board and AGM approval (3) Underlying
(organic per year)

13
…and growing the underlying EPS by 8%€/share 20172016
Note: 2016 metrics have been re-stated to reflect the capital increase
Underlying EPS 0.4290.463+8%
Cash DPS 0.170.19+11%
4.15 4.15TNAV/ share

14
Embedding our common culture in the day to day of all our teams
Rewarding people for “doing things right”
Making solid progress in the Santander Way
Becoming the best place to work
c.100k employees evaluated with new
methodology
60%What?
40%How?
SIMPLE | PERSONAL | FAIR
81% (+9pp) employees agree “we behave in a SPF way”
Top 3 in 5 countries (+2 YoY)
2018 target achieved 1 year ahead

15
Fulfilling our purpose of helping people and businesses prosper
Promoting social and financial inclusion
Supporting entrepreneurship
Santander Universities
Santander invests in numerous social programs to support communities Microcredits
> 200K micro-entrepreneurs supported
Santander, the world's largest corporate contributor to education
Santander The biggest university entrepreneurship ecosystem in the world
Supporting education
2015 2016 2017E1.2Mn
1.7Mn1.9MnPeople helped

16
Delivering ahead of plan1Group and business areas review22018 Strategic priorities3Key takeaways4Appendix5

17
FL CET1
10.84% (+29 bps)
Underlying PBT
€13,550Mn (+20%)
2017 Key achievements
Growth Profitability Strength
Customer revenues
€45,892Mn (+11%)
Cost of credit
1.07% (-11 bps)
NPL ratio
4.08% (+15 bps)
Underlying RoTE
c.12% (+70 bps)
Loans1
+12% (+2% ex-Pop)
(1) % change in constant euros
EPS
€0.404 (+1%)
Customer funds1
+17% (+8% ex-Pop)
17

18Note: Contribution to the SRF (net of tax) recorded in 2Q’16 (-€120Mn) and 2Q’17 (-€146Mn). Contribution to the DGF (net of tax) in 4Q’6 (-€131Mn) and 4Q’17 (-€186Mn)
Excellent quality and strong top-line growth with performance sustained QoQ
Underlying attributable profitConstant €Mn
Excluding Popular
1,6381,523
1,6791,734
1,7901,711
2,0221,993
1,700
1,8541,909
1Q'16 2Q 3Q 4Q 1Q'17 2Q 3Q 4Q
Net interest income 34,296 10 10
Net fees 11,597 14 13
Customer revenues 45,892 11 11
Other income 2,499 -3 -2
Gross income 48,392 10 10
Operating expenses -22,918 9 9
Net operating income 25,473 12 11
Net loan-loss provisions -9,111 -4 -6
Underlying PBT 13,550 20 21
Underlying attrib. profit 7,516 14 14
Net capital gains and provisions -897 115 117
Attributable Profit 6,619 7 7
€Mn Constant euros
Euros
2017 % vs. 2016
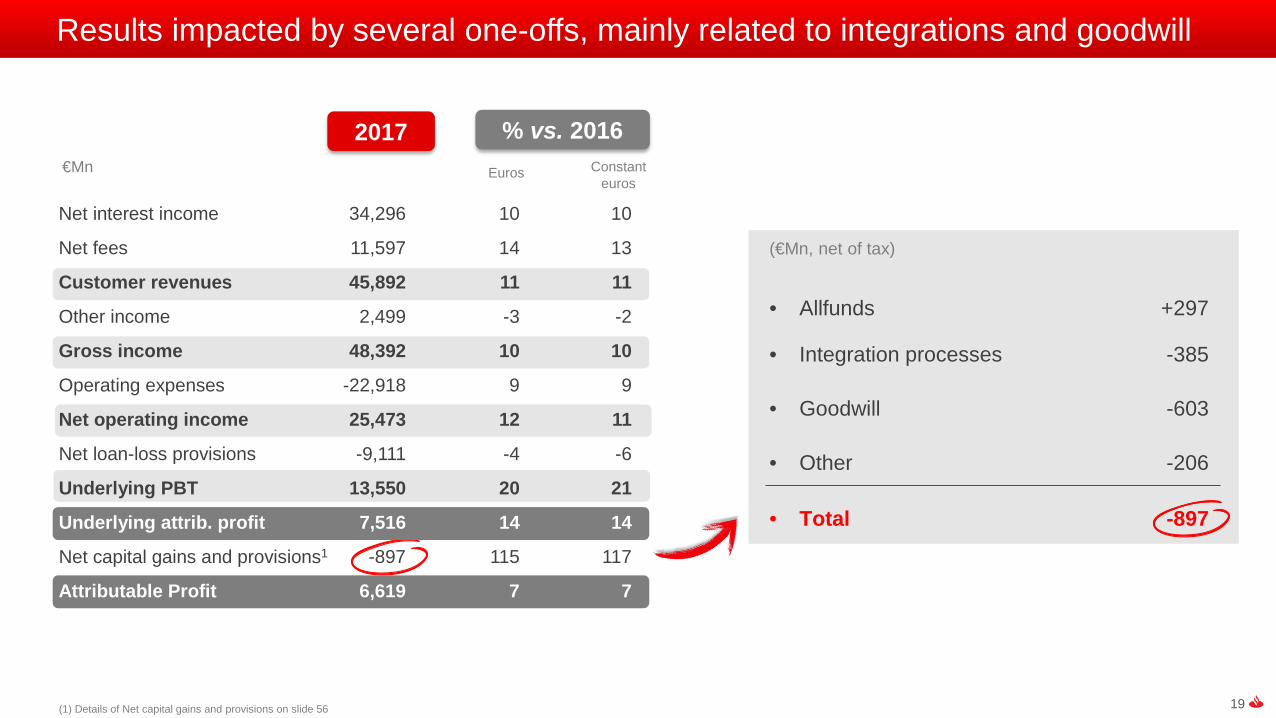
19(1) Details of Net capital gains and provisions on slide 56
Results impacted by several one-offs, mainly related to integrations and goodwill
(€Mn, net of tax)
• Allfunds +297
• Integration processes -385
• Goodwill -603
• Other -206
• Total -897
Net interest income 34,296 10 10
Net fees 11,597 14 13
Customer revenues 45,892 11 11
Other income 2,499 -3 -2
Gross income 48,392 10 10
Operating expenses -22,918 9 9
Net operating income 25,473 12 11
Net loan-loss provisions -9,111 -4 -6
Underlying PBT 13,550 20 21
Underlying attrib. profit 7,516 14 14
Net capital gains and provisions1 -897 115 117
Attributable Profit 6,619 7 7
€Mn Constant euros
Euros
2017 % vs. 2016

20Note: Constant euros. (1) Other income includes gains on financial transactions, income from the equity accounted method, dividends and other operating results. Contribution to the SRF recorded in 2Q'16 and 2Q'17. Contribution to the DGF in 4Q’16 and 4Q’17
…driven by strong recurring customer revenues
635 535 519 560
1Q'16 2Q 3Q 4Q 1Q'17 2Q 3Q 4Q
2,582 2,6082,836 2,913
7,6327,969
8,342 8,458Net interest income
Fee income
Other income1
€Mn excluding Popular
Revenues: sustained growth QoQ…
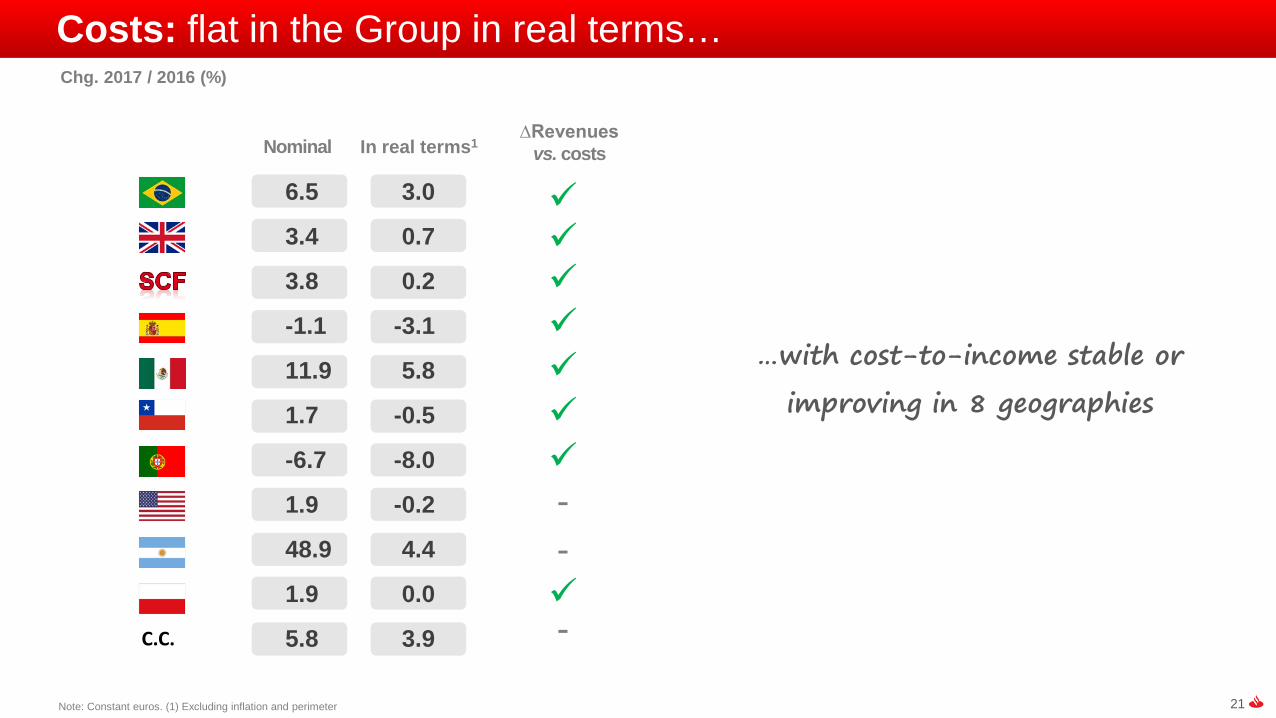
21Note: Constant euros. (1) Excluding inflation and perimeter
…with cost-to-income stable or
improving in 8 geographies
Costs: flat in the Group in real terms…
∆Revenues vs. costs
-
--
Nominal In real terms1
C.C.
Chg. 2017 / 2016 (%)
6.5 3.0
3.4 0.7
3.8 0.2
-1.1 -3.1
11.9 5.8
1.7 -0.5
-6.7 -8.0
1.9 -0.2
48.9 4.4
1.9 0.0
5.8 3.9

22
Loan-loss provisions: lower even though the loan portfolio increased
Better cost of credit at Group level…
2016 2017
…and in most geographies
Cost of credit (%)
1.18
1.07

23
3.93 3.74 3.55 3.51 3.38
5.374.24 4.08
D'16 M'17 J'17 S'17 D'17
Including Popular
NPL ratio: The Group's ratio improved YoY for the 4th straight year (ex-Popular)
Group NPL ratio improving YoY… …backed by 8 geographies
NPL ratio (%)
24
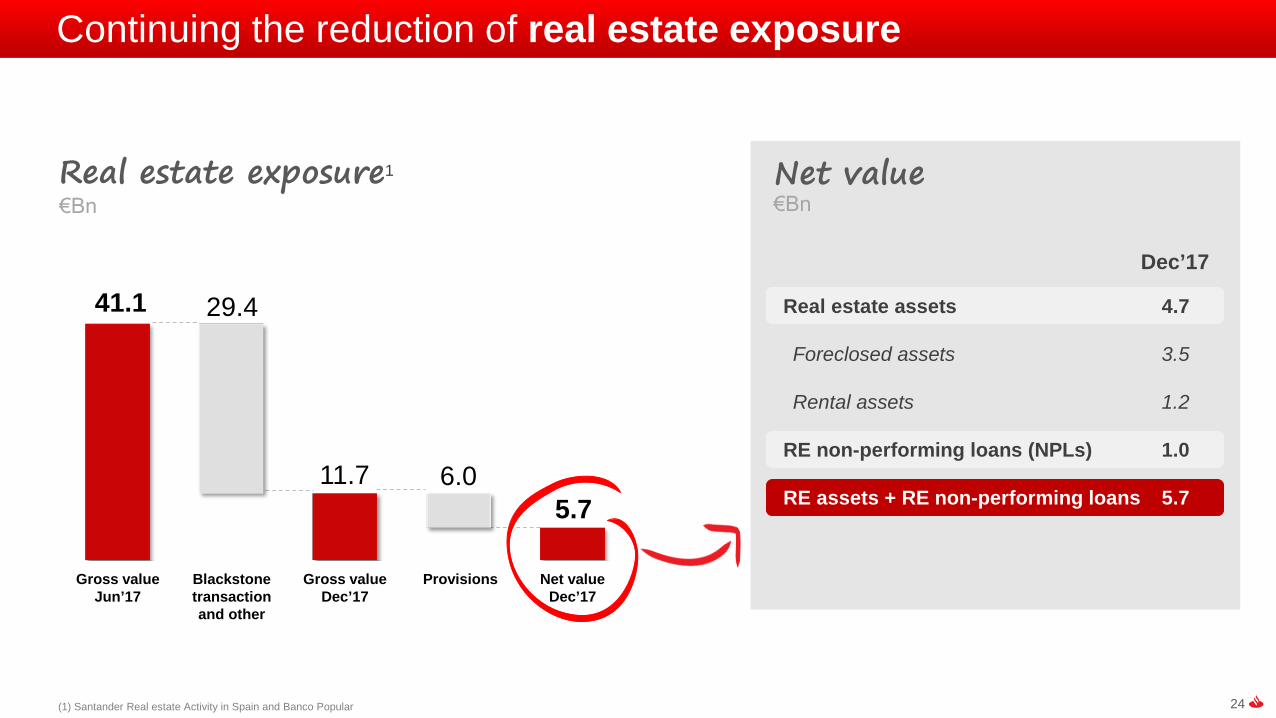
41.1
11.75.7
29.4
6.0
Gross valueJun’17
Blackstone transaction and other
Gross value Dec’17
Provisions Net valueDec’17
Real estate exposure1
(1) Santander Real estate Activity in Spain and Banco Popular
€Bn
Continuing the reduction of real estate exposure
Net value€Bn
Dec’17
Real estate assets 4.7
Foreclosed assets 3.5
Rental assets 1.2
RE non-performing loans (NPLs) 1.0
RE assets + RE non-performing loans 5.7

25(1) Including SAM+ Allfunds (-10 bps) and SCUSA settlement (-5 bps)
FL CET1 (%)
10.55 10.80 10.84+0.27
-0.15 -0.08
CET1 D’16
CET1 S’17
Organic Other
Progress in reaching our target of fully-loaded CET1 >11% in 2018
…reaching an organic annual growth of 53 bps (+29 bps net of perimeter and other)
In the quarter, high organic capital generation…
YoYchange
Leverage ratio 5.0% stable
FL Total capital ratio 14.48% +61 bps
FL Tier 1 capital ratio 12.11% +58 bps
Expected to organically generatec.40 bps in FL CET1 per year after
paying dividends and growing loans
Dec’17
Perimeter1 CET1 D’17

26
Funding plan focused on TLAC-eligible instruments: Parent Bank and rest of units met 2017 plan
Senior Non preferred
Senior preferred
Hyb
rids AT1
T2
Total
12-14
-
2-3
14-17
(€Bn)
9.9
0.7
1.7
1.1
13.5
Issuances Target
Santander in line with MREL requirements
Parent Bank funding plan 2017
Issuances 2017:
€27Bn (c.€19Bn TLAC-eligible)
Diversified issuers:
Parent bank, SCF, UK and USA
Diversified currencies:
EUR, USD, GBP
Popular: Additional need for €750Mn AT1 and €1Bn T2
(1) Based on current available information
1

27
Breakdown by geographies
28(*) Excluding Corporate Centre and Real Estate Activity Spain(1) Popular included (3%)
Solid profit growth across the board with results well diversified by geography
52%
UK, 16%
Spain1; 15%
SCF, 13%
Portugal, 5%Poland, 3%
USA, 4%
Mexico, 7%
Brazil, 26%
Chile, 6%Argentina, 4%
Other Latam, 1%
EuropeAmericas
48%
Underlying attributable profit in core geographies€Mn and % chg. / 2016 in constant euros
2,544
1,498
1,254
1,180
710
586
440
408
359
300
263 n.a.
+34%
+15%
+16%
+12%
+10%
+5%
+14%
+8%
-4%
+15%
2017 Underlying attributable profit

29
NII 2,530 2.9 10,078 17.3 Fee income 929 9.3 3,640 16.2 Gross income 3,512 1.8 14,273 18.3 Operating expenses -1,289 6.1 -5,080 6.5 LLPs -814 2.0 -3,395 -5.7 PBT 1,198 1.8 4,612 56.1 Underlying att. profit 642 0.2 2,544 33.7 Non-recurring 0 — 0 —Attributable profit 642 0.2 2,544 33.7
16.63% 17.08% 16.74% 16.20% 15.66%
8.86% 8.19%6.83% 6.43% 5.64%
4Q'16 1Q'17 2Q 3Q 4Q
BRAZIL
(1) €Mn and % change in constant euros
P&L1 4Q'17 %3Q'17 2017 %2016
ACTIVITY
Cost of deposits
Yield on loans
KEY DATA 2016 2017
Loyal customers (million) 3.7 4.2
Digital customers (million) 6.4 8.6
NPL ratio (%) 5.90 5.29
Cost of credit (%) 4.89 4.36
Efficiency ratio (%) 39.5 35.6
RoTE (%) 13.8 16.9
Volumes in €Bn
Note: % change in constant euros. Loans excluding repos. Funds: deposits excluding repos + marketed mutual funds
Business expanded, with greater operational efficiency, driving top-line growth, well above the average of our competitors (RoTE: 17%)
Strong growth in revenues: NII supported by higher volumes and management of spreads; fee income driven by greater loyalty and customer activity
Consistent improvement in efficiency ratio reflected higher productivity
Market share gain in loans while improving cost of credit
74
107
Loans Funds
+4%QoQ
+7%YoY
0%QoQ
+24%YoY

30
NII 1,048 -3.3 4,363 6.2 Fee income 243 -2.3 1,003 4.3 Gross income 1,344 -4.9 5,716 5.4 Operating expenses -721 2.6 -2,861 3.4 LLPs -81 22.4 -205 276.7 PBT 441 -20.2 2,184 -4.5 Underlying att. profit 297 -22.0 1,498 -4.4 Non-recurring2 0 — 0 -100.0 Attributable profit 297 -22.0 1,498 -2.7
3.08% 3.01% 2.91% 2.83% 2.78%
0.87% 0.69% 0.66% 0.62% 0.63%
4Q'16 1Q'17 2Q 3Q 4Q
UNITED KINGDOM
Loyal customers (million) 4.0 4.2
Digital customers (million) 4.6 5.0
NPL ratio (%) 1.41 1.33
Cost of credit (%) 0.02 0.08
Efficiency ratio (%) 51.0 50.1
RoTE (%) 10.6 10.3
ACTIVITY
Cost of deposits
Yield on loans
Volumes in €Bn
Note: % change in constant euros. Loans excluding repos. Funds: deposits excluding repos + marketed mutual funds. Underlying RoTE in 2016
(1) €Mn and % change in constant euros(2) 2016 profit included -€30Mn related to capital gains from the disposal of the stake in VISA Europe,
restructuring costs and PPI
KEY DATA 2016 2017 P&L1 4Q'17 %3Q'17 2017 %2016
Growth in retail c/a balances, mortgages and with UK companies excluding CRE
Revenues up driven by retail liability margin improvement and fee income
Digitalisation supports operational efficiency and improved customer experience
Credit quality remains solid, excluding single name exposure
QoQ: asset margin pressure in NII and single name charge in LLPs
236 210
Loans Funds
+1%QoQ
+1%YoY
+2%QoQ
+3%YoY

31
NII 906 1.3 3,571 5.2 Fee income 204 -8.6 878 1.8 Gross income 1,132 0.1 4,484 5.1 Operating expenses -506 4.9 -1,978 3.8 LLPs -58 -34.7 -266 -31.5 PBT 512 -3.3 2,083 15.4 Underlying att. profit 311 1.0 1,254 14.6 Non-recurring2 -0 -99.7 -85 —Attributable profit 311 39.1 1,168 4.4
SANTANDER CONSUMER FINANCE
Active customers (million) 17.9 19.9
NPL ratio (%) 2.68 2.50
Cost of credit (%) 0.47 0.30
Efficiency ratio (%) 44.7 44.1
RoTE (%) 14.8 16.4
ACTIVITY
Yield on loans
Note: % change in constant euros. Loans excluding repos. Underlying RoTEExcluding Santander Consumer UK profit, recorded in Santander UK results. Including it, 2017 underlying attributable profit: €1,373Mn (+12% vs. 2016); 4Q’17: €343Mn (+1% vs. 3Q’17)
5.33% 5.32% 5.23% 5.21% 5.16%
4Q'16 1Q'17 2Q 3Q 4Q
Volumes in €Bn
(1) €Mn and % change in constant euros(2) 2016 profit included €25Mn related to capital gains from the disposal of the stake in VISA Europe
and 2017 profit included -€85Mn related to integration costs
P&L1 4Q'17 %3Q'17 2017 %2016KEY DATA 2016 2017
High diversification and leadership in Europe
Increased new lending: auto loans (+11%) and credit cards (+9%)
Best-in-class profitability: underlying profit up, boosted by higher NII and historically low NPLs and cost of credit
Main contribution to underlying profit: Germany (€364Mn), Nordic countries (€318Mn) and Spain (€241Mn)
40
New lending2017
92
Loans
+4%QoQ
+6%YoY
+4%QoQ
+9%YoY

32
NII 686 -5.5 2,909 -5.5 Fee income 562 10.3 2,067 16.1 Gross income 1,368 -4.7 5,694 1.5 Operating expenses -841 3.2 -3,259 -1.1 LLPs -110 5.8 -513 -12.3 PBT 395 -14.3 1,714 17.5 Underlying att. profit 265 -14.8 1,180 15.4 Non-recurring2 0 — 0 -100.0 Attributable profit 265 -14.8 1,180 46.4
2.10% 2.04% 2.04% 1.96% 1.96%
0.47% 0.46% 0.46% 0.46% 0.48%
4Q'16 1Q'17 2Q 3Q 4Q
SPAIN – excl. Popular
Loyal customers (million) 1.3 1.9
Digital customers (million) 2.7 3.2
NPL ratio (%) 5.41 4.72
Cost of credit (%) 0.37 0.33
Efficiency ratio (%) 58.8 57.2
RoTE (%) 8.9 10.1
ACTIVITY
Cost of deposits
Yield on loans
Volumes in €Bn
Note: Loans excluding repos. Funds: deposits excluding repos + marketed mutual funds. Underlying RoTE in 2016
(1) €Mn(2) 2016 profit included -€216Mn related to capital gains from the disposal of the stake in VISA Europe
and restructuring costs
P&L1 4Q'17 %3Q'17 2017 %2016KEY DATA 2016 2017
Building lasting relations with customers and ongoing digital transformation
Market share gain in mortgages and corporates. Leaders in mobile payments and GCB
Profit backed by fee income (more than offsets pressure on NII), cost control and LLPs. NII + Fee income:+2.4%
QoQ impacted by DGF and higher costs (POS integration perimeter and hardware depreciation)
149
251
Loans Funds
-2%YoY
+12%YoY
0%QoQ
+5%QoQ
33
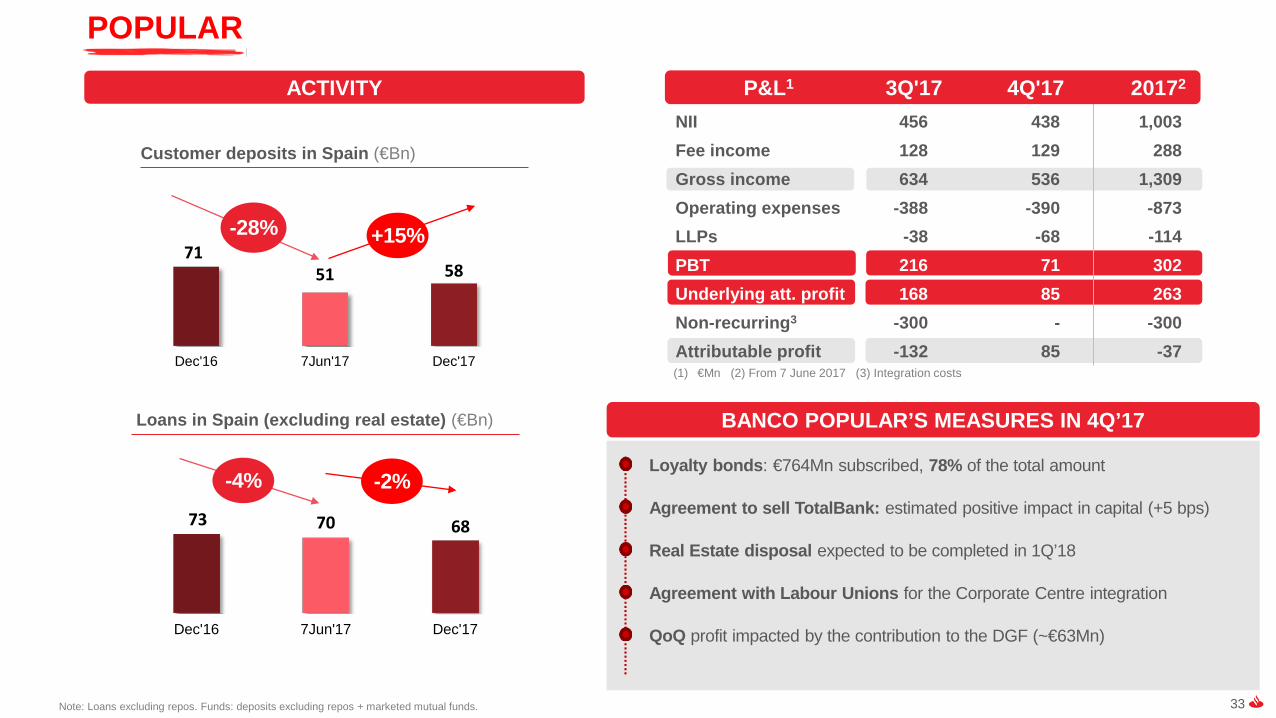
NII 456 438 1,003 Fee income 128 129 288 Gross income 634 536 1,309 Operating expenses -388 -390 -873 LLPs -38 -68 -114 PBT 216 71 302 Underlying att. profit 168 85 263 Non-recurring3 -300 - -300 Attributable profit -132 85 -37
Loans in Spain (excluding real estate) (€Bn)
73 70 68
Dec'16 7Jun'17 Dec'17
-2%
POPULAR
Note: Loans excluding repos. Funds: deposits excluding repos + marketed mutual funds.
(1) €Mn (2) From 7 June 2017 (3) Integration costs
P&L1 3Q'17 4Q'17 20172
7151 58
Dec'16 7Jun'17 Dec'17
Customer deposits in Spain (€Bn)
-28%
ACTIVITY
-4%
+15%
BANCO POPULAR’S MEASURES IN 4Q’17
Loyalty bonds: €764Mn subscribed, 78% of the total amount
Agreement to sell TotalBank: estimated positive impact in capital (+5 bps)
Real Estate disposal expected to be completed in 1Q’18
Agreement with Labour Unions for the Corporate Centre integration
QoQ profit impacted by the contribution to the DGF (~€63Mn)

34
Good performance in other markets: larger customer base, higher profits and better credit quality UNDERLYING ATTRIBUTABLE PROFIT (DETAIL BY MARKETS IN THE APPENDIX)
Mexico ■ Significant investment in multichannel, digitalisation and commercial initiatives■ Profit up driven by NII and fee income, resulting in a 400 bps higher RoTE. Solid credit quality
Chile ■ Focus on customer satisfaction, loyalty and digital initiatives■ Profit up driven by commercial revenues, cost control and lower cost of credit
€710Mn; +16%
€586Mn; +12%
Note: % change over 2016 in constant euros. (1) Excl. Popular (2) By domestic assets and loans
Argentina ■ Integration of Citibank's retail business completed in August (in 5 months)■ Market share gains and profit driven by customer revenues, absorbing integration charges €359Mn; +14%
Portugal1■ The commercial transformation programme continues to boost loyal and digital customers■ Profit up due to lower costs and LLPs. Strong improvement in asset quality■ After Popular acquisition Santander Totta is the leading2 privately owned bank
€440Mn; +10%
Poland ■ Agreement for the acquisition of the retail and private banking businesses of Deutsche Bank Polska■ PBT spurred by NII, fee income, LLPs and cost control. Profit affected by regulatory impacts€300Mn; +8%
US1■ SBNA: increasing profitability by improving NIM and cost control ■ SC USA: good profitability (RoTE: 13%). Focus on enhancing the loan mix and reduce the cost of funding■ Additionally, 4Q'17 profit impacted by hurricanes, the SC USA settlement and tax reform
€408Mn; +5%

35
CORPORATE CENTRE
P&L
€Mn
Higher losses in NII due to increased issuances (TLAC)
Negative gains on financial transactions due to cost of hedging, offset by the positive FX impact in the business areas
Operating expenses account for just 2% of Group’s total costs
2016 2017
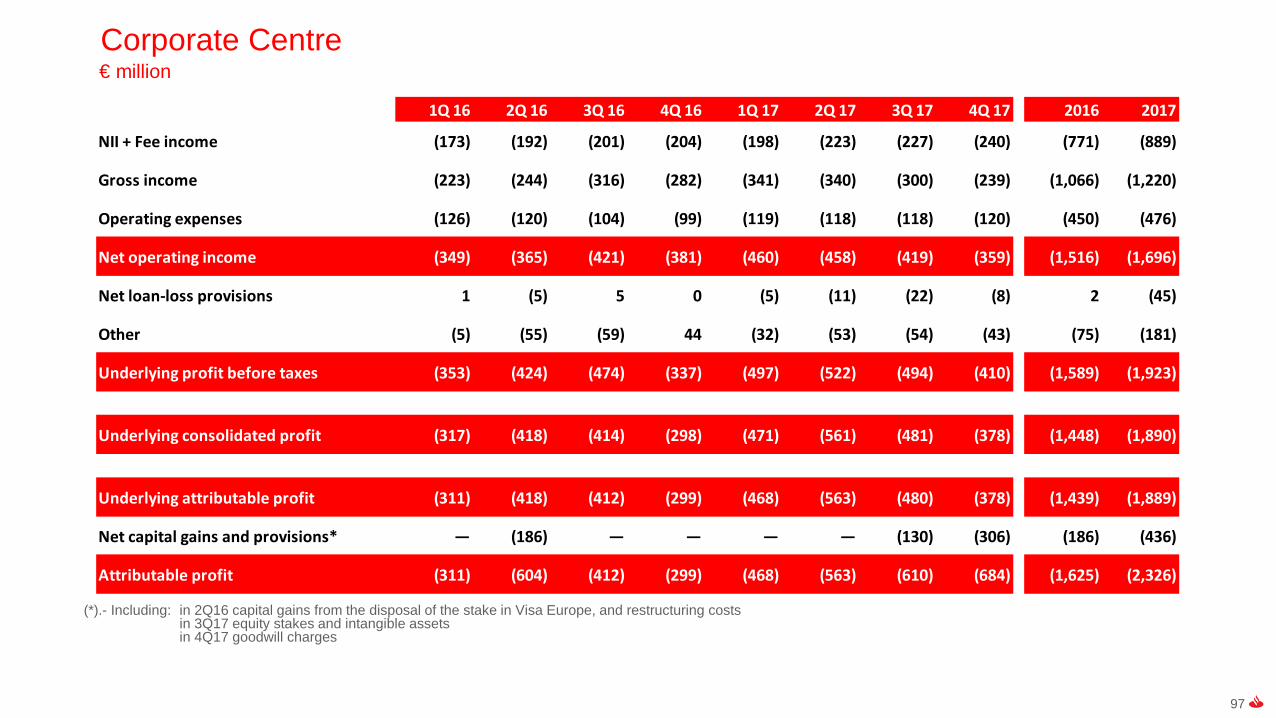
NII -739 -851 Gains/Losses on FT -243 -227 Operating expenses -450 -476 Provisions -73 -227 Tax and minority interests 149 33 Underlying attrib. Profit -1,439 -1,889 Non-recurring1 -186 -436 Attributable profit -1,625 -2,326
(1) 2017 including a charge for equity stakes and intangible assets, goodwill and a positive impact of Allfunds gains. 2016 includes restructuring costs.

36
Delivering ahead of plan1Group and business areas review22018 Strategic priorities3Key takeaways4Appendix5

37
Our aim
A bank that is…SIMPLE | PERSONAL | FAIR
Our purposeTo help people and businesses prosper
To be the best opendigital financial services platform,earning the lasting loyalty of our people, customers, shareholders and communities
Our vision

38
Scale Predictable growth
Innovation
Our key assets support the path to long-term success
38

39
Ranking in loans market share
133MnTotal customers
17MnLoyal customers
1,000Mn Total population
Scale: We have in-market scale and have proven we can deliver profitable organic growth
25MnDigital customers
#1
#3 #5
3%3
Latest available dataNote*: Santander’s market share for the respective countries are: Mexico (13%), Chile (19%), Argentina (10%), Brazil (9%), Portugal (16%, including Popular), UK (10%), Spain (18%, including Popular), SCF (10% in new car loans, including PSA operations and not considering brand’s financial captive) and Poland (10%) Note**: Customer metrics exclude Popular (1) Only private banks for Portugal, Argentina and Brazil(2) UK mortgages (excluding Social Housing), Consumer credit and commercial loans (excluding Financial Institutions) (3) SBNA 3% market share in the states where the Group operates. SCUSA 3% market share.
2
1

40
Predictable growth: Diversified business across Europe & Americas
Note: % change in constant euros(1) Mature markets include Portugal, UK, Spain, SCF and US. (2) Emerging markets include Mexico, Brazil, Argentina, Chile and Poland (3) Excluding Popular.
Mature markets
Emerging markets
Loans +14% +7%
Customerrevenues +7% +16%
Loyal customers +13%3 +14%
Loan portfolio by businessYoY Growth
ConsumerSMEs
Corporate
Other individualsGlobal
Corporate Banking
2
Total customers +4% 3 +10%
Mortgages
1
40
Funds +18% +14%(0%)3
(+5%)3
(+1%)3

41
711%
358%
128% 113% 92% 78% 52% 46% 44% 32% 9%
Predictable growth: Over the last 20 years earnings have increased 4x with the lowest volatility amongst peers
Source: Bloomberg; Note: GAAP criteria Note: Standard deviation of the quarterly EPS starting from the first available data since Jan’99
Quarterly reported EPS volatility (Jan’99-9M´17)
1x -9x -1x 1x 5x 2x 3x 2x 1x 6x 4xNet income increase 1999-2016

42
Predictable growth: Cash DPS & customer revenues grew in 2017 by 11% and CET1 by €3.5Bn
Pay dividends
Financebusiness growth
+11% Cash dividend per share (2017 vs. 2016)
+11% customer revenues(2017 vs. 2016)
Accumulate capital
+29bps10.84% FL CET1
(2017 vs. 2016)
Top tier profitability allows us to equally:

43
PaymentsPlatforms & Services
Data & A.I
Innovation: Our priority is to improve customer experience efficiently
Distributed ledger technology

44
Innovation: Same day mobile international payments in “3 clicks & 40 seconds” for our retail customers using distributed ledger technology
Personal Finance Manager
Digital wallet
P2P payments
Same day international Payments
Going live in 4 countries 1Q´2018
Full transparency on fees and FX upfront
We expect to be one of the first global banks to roll
out Distributed Ledger Technology based
payments for individuals
Initial investment in September 2015
€10Bn target market for international retail payments1
(1) International retail payments volume (ex-interbank) in Santander’s natural markets (Western Europe, Latam, North America and Eastern Europe

45
Innovation: Unique customer insights deliver better experience & bottom line
Operational excellence
Increasing both:GLOBAL MACHINE LEARNING
PLATFORM
Open source platform and a team of >100 data scientists
Learning from >5Bn transactions
Results obtained on >10Mn customers
15-30% lower acquisition costs
10-30% increase in loyalty10-60% lower churn
Customer loyalty
46
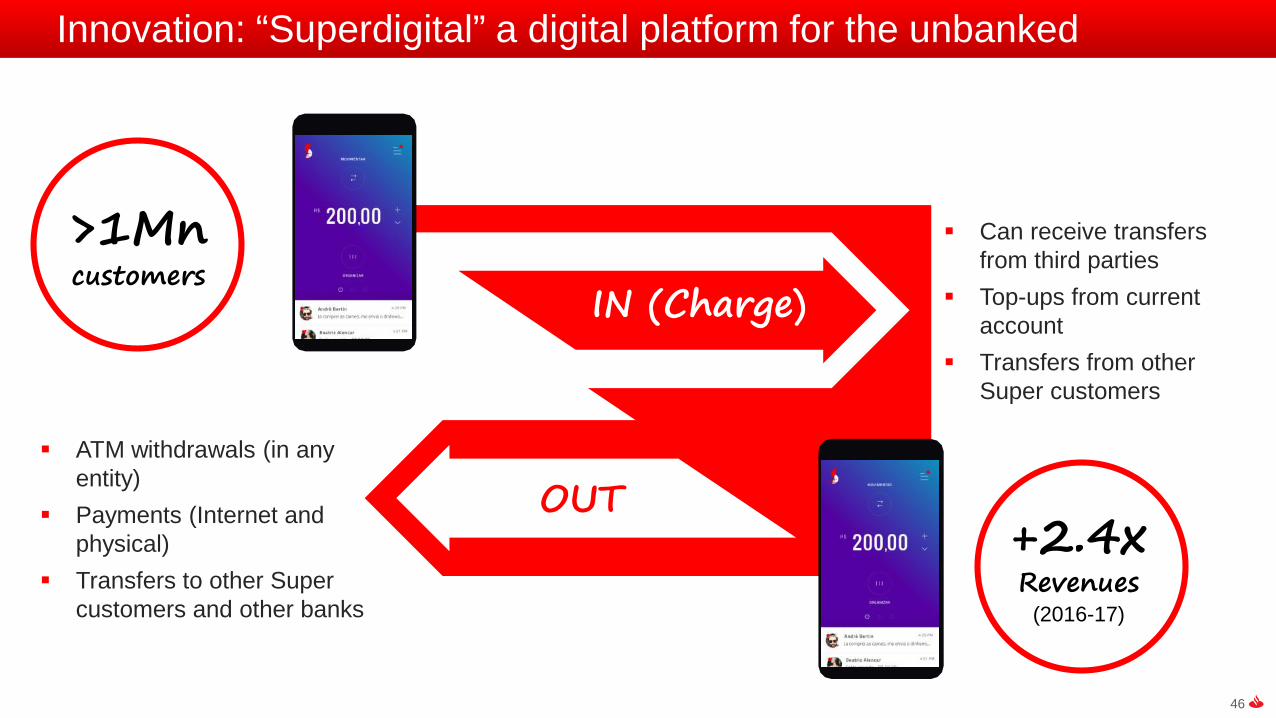
Innovation: “Superdigital” a digital platform for the unbanked
IN (Charge)
OUT
Can receive transfers from third parties
Top-ups from current account
Transfers from other Super customers
ATM withdrawals (in any entity)
Payments (Internet and physical)
Transfers to other Super customers and other banks
>1Mn customers
+2.4x Revenues
(2016-17)

47
Innovation: Openbank and Santander Cash Nexus
Openbank 100% Digital
+20% Deposits growth
+26% Loyal customers
Santander Cash Nexus Global Treasury Services for
multinationalsSingle entry point
Up to 75% workload reduction
€4.1Bn monthly payments value2016 2017123
47
-27% Deposits costNumber of multinationals
+25%154
(YoY)

48
Innovation: New simple and personal solutions
Growing our digital customer base…
c.41% of our active customers
c.2x more profitable
…being where our customers are in the digital world
Speak directly or set up a meeting with your banker from your App
Santander App
Real time assistant through Facebook Messenger
Facebook ChatBot
First bank to offer smart watch Payments
Smart watch Pay

49
4,050Mn
2015 2016 2017
Innovation: Growing the number of digital contacts per customer while reducing our cost per transaction
Note: Average of monthly digital transactions (web and mobile) within the Group´s 10 core geographies
+7%
+155%
# digital transactions
31%
-22%
Digital sales share Over total volume of sales (Dec´17)
Costs per transactionTransaction costs for every 1,000 transactions (2016-17)
3,791Mn
10,326Mn
49

50
Delivering ahead of plan1Group and business areas review22018 Strategic priorities3Key takeaways4Appendix5
51
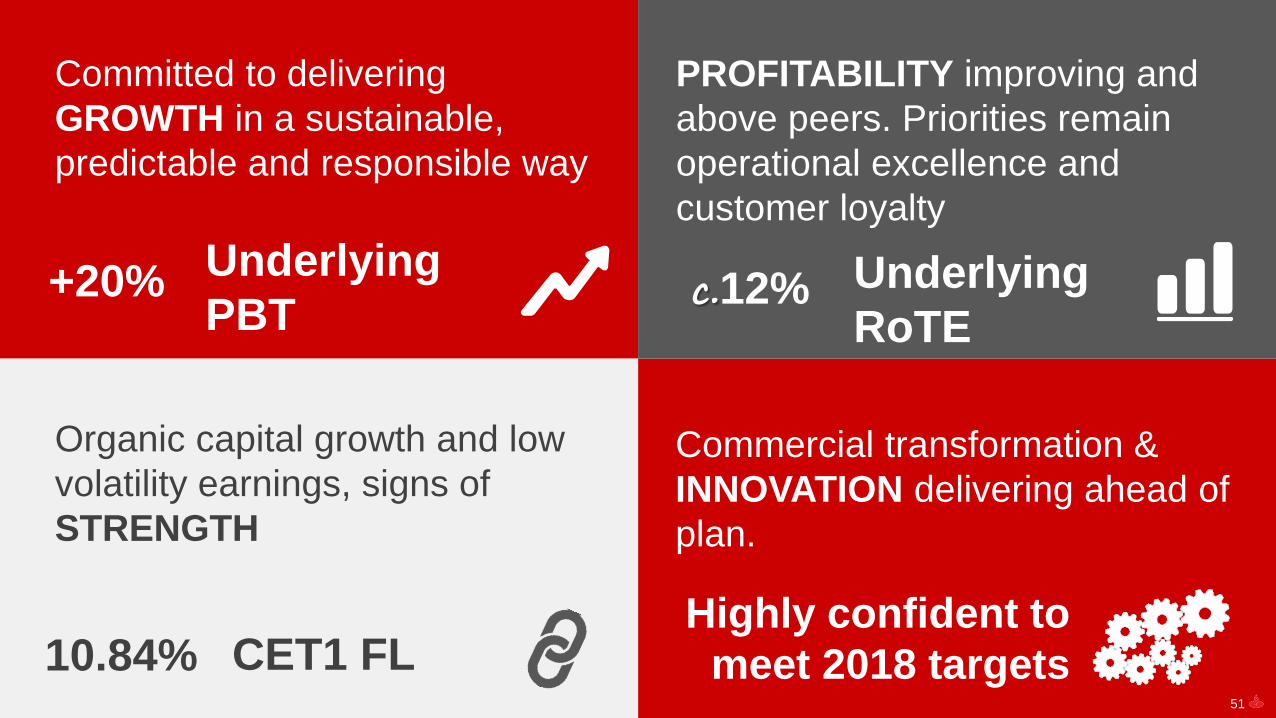
Committed to delivering GROWTH in a sustainable, predictable and responsible way
Organic capital growth and low volatility earnings, signs of STRENGTH
Commercial transformation & INNOVATION delivering ahead of plan.
PROFITABILITY improving and above peers. Priorities remain operational excellence and customer loyalty
+20% Underlying PBT c.12% Underlying
RoTE
10.84% CET1 FLHighly confident to
meet 2018 targets51

52
Delivering ahead of plan1Group and business areas review2
2018 Strategic priorities3
Key takeaways4Appendix5

53
Global segments results
Appendix
Quarterly income statements
NPL and coverage ratios, and cost of credit
Liquidity
Other geographies’ results
Santander Group (with and w/o Popular) and non-recurring items detail
Glossary

54
Santander Group (with and w/o Popular) and
non-recurring items detail

55
2017 P&L – P&L breakdown
Excellent quality and strong top-line growth, with and without Popular
Net interest income 33,293 7 7
Net fees 11,308 11 11
Customer revenues 44,601 8 8
Other income 2,481 -4 -3
Gross income 47,082 7 7
Operating expenses -22,045 5 5
Net operating income 25,038 10 10
Net loan-loss provisions -8,997 -5 -7
Underlying PBT 13,248 17 18
Underlying attrib. profit 7,253 10 10
Net capital gains and provisions -597 43 44
Attributable Profit 6,656 7 8
€Mn Constant euros
Euros
2017 % vs. 2016Total Group
excl. Popular
Net interest income 34,296 10 10
Net fees 11,597 14 13
Customer revenues 45,892 11 11
Other income 2,499 -3 -2
Gross income 48,392 10 10
Operating expenses -22,918 9 9
Net operating income 25,473 12 11
Net loan-loss provisions -9,111 -4 -6
Underlying PBT 13,550 20 21
Underlying attrib. profit 7,516 14 14
Net capital gains and provisions -897 115 117
Attributable Profit 6,619 7 7
€Mn Constant euros
Euros
2017 % vs. 2016

56
Non-recurringpositive results
Non-recurringnegative results
475
13732
227
-644
Restructuring costs
VISA Europe capital gains
Non-recurringpositive results
Non-recurringnegative results
297
60373
149
300
85130
370
-1,267
Popular integration costs
Equity stakes and intangible assets
SC USA Restatement
€Mn net of tax
2016
PPI
Germany integration costs
2017
Allfundscapital gains
USA (hurricanes + increased stake in SC USA + other)
Goodwill (SC USA and other)
4Q’17 3Q’17
P&L – Net capital gains and provisions
2016 and 2017 profit impacted by several non-recurring items
€Mn net of tax
-417
-897
USA tax reform

57
Individuals demand deposits, 38%
Individuals time deposits, 13%
Individuals mutual funds, 14%Consumer, 4%
SMEs, 9%
Corporates, 13%
GCB, 9%
Mature markets
Customer funds: growth in 8 core units
Dec’17 €Bn YoY change
Other individuals, 11%
Home mortgages, 36%
Consumer, 18%
SMEs, 9%
Corporates, 15%
GCB, 11%
Loan portfolio by businesses
Customer funds by businesses
Spain 149 -2%UK 236 1%USA 75 -4%SCF 92 6%Portugal 31 8%
Dec’17 €Bn YoY change
Developing markets
Poland 23 5%Brazil 74 7%Mexico 27 5%Chile 38 3%Argentina 8 44%
Mature markets
Dec’17 €Bn YoY change
Spain 251 12%UK 210 3%USA 59 -9%SCF 35 2%Portugal 32 2%
Dec’17 €Bn YoY change
Developing markets
Poland 28 2%Brazil 107 24%Mexico 36 6%Chile 33 0%Argentina 13 53%
Note: Loans excluding repos. Customer funds: deposits excluding repos + marketed mutual funds. % change in constant euros
2017 BALANCE SHEET – Volumes’ performance excluding Popular
Highly diversified balance sheet, by geography and product
Loan portfolio: growth supported by developing markets

58
Other geographies’results

59
NII 630 -1.8 2,601 12.5 Fee income 181 -1.5 749 8.7 Gross income 830 -0.9 3,460 11.5 Operating expenses -345 3.0 -1,382 11.9 LLPs -187 -16.2 -905 12.3 PBT 274 -0.2 1,134 9.7 Underlying att. profit 178 4.1 710 16.5 Non-recurring 0 — 0 —Attributable profit 178 4.1 710 16.5
Significant investment in multichannel, digitalisation and commercial initiatives2
Efforts made to retain customers (customer churn: -52%), attract payrolls (market share: +83 bps YoY) and increase in digital customers (+52%)
Profit up due to strong NII and fee income, resulting in a 400 bps higher RoTE
Solid credit quality: NPL ratio improved, coverage ratio ~100% and cost of credit around 3%
10.67% 11.28% 11.79% 12.02% 12.02%
2.30% 2.67% 3.04% 3.37% 3.39%
4Q'16 1Q'17 2Q 3Q 4Q
MEXICO
Loyal customers (thousands) 1,608 1,993
Digital customers (thousands) 1,282 1,948
NPL ratio (%) 2.76 2.69
Cost of credit (%) 2.86 3.08
Efficiency ratio (%) 39.8 39.9
RoTE (%) 15.5 19.5
ACTIVITY
Cost of deposits
Yield on loans
Volumes in €Bn
Note: % change in constant euros. Loans excluding repos. Funds: deposits excluding repos + marketed mutual funds. (2) Santander Plus, Santander-Aeromexico, Super Connect, Super Digital among others
(1) €Mn and % change in constant euros
P&L1 4Q'17 %3Q'17 2017 %2016KEY DATA 2016 2017
27
36
Loans Funds
+1%QoQ
+5%YoY
+1%QoQ
+6%YoY
60
NII 492 10.0 1,907 0.1 Fee income 91 -3.4 391 8.6 Gross income 630 2.9 2,523 2.0 Operating expenses -248 -3.3 -1,025 1.7 LLPs -110 0.5 -462 -12.0 PBT 276 6.9 1,059 15.9 Underlying att. profit 146 1.2 586 11.7 Non-recurring 0 — 0 —Attributable profit 146 1.2 586 11.7
Santander is the main privately owned bank in Chile by assets and customers
Focus on customer satisfaction, loyalty and digital initiatives: launch of Digital Onboarding and Santander Life (new model for mass market)
Profit up driven by commercial revenues, cost control and lower cost of credit
QoQ profit impacted by volatile local environment
7.51% 7.53% 7.95% 7.33% 7.33%
2.21% 2.10% 1.94% 1.81% 1.87%
4Q'16 1Q'17 2Q 3Q 4Q
CHILE
Loyal customers (thousands) 604 622
Digital customers (thousands) 959 1,012
NPL ratio (%) 5.05 4.96
Cost of credit (%) 1.43 1.21
Efficiency ratio (%) 40.7 40.6
RoTE (%) 17.2 17.9
ACTIVITY
Cost of deposits
Yield on loans
Note: % change in constant euros. Loans excluding repos. Funds: deposits excluding repos + marketed mutual funds.
(1) €Mn and % change in constant euros
P&L1 4Q'17 %3Q'17 2017 %2016KEY DATA 2016 2017
38 33
Loans Funds
0%QoQ
+3%YoY
-3%QoQ
0%YoY
Volumes in €Bn
61
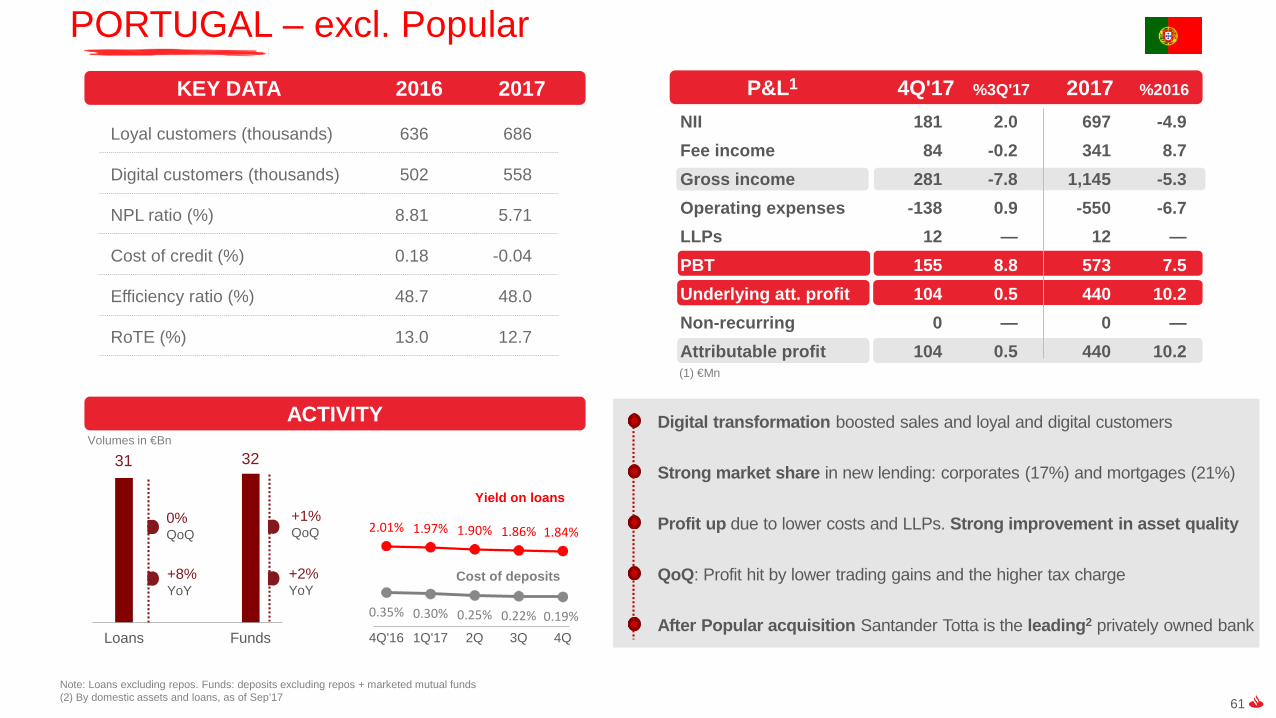
NII 181 2.0 697 -4.9 Fee income 84 -0.2 341 8.7 Gross income 281 -7.8 1,145 -5.3 Operating expenses -138 0.9 -550 -6.7 LLPs 12 — 12 —PBT 155 8.8 573 7.5 Underlying att. profit 104 0.5 440 10.2 Non-recurring 0 — 0 —Attributable profit 104 0.5 440 10.2
Digital transformation boosted sales and loyal and digital customers
Strong market share in new lending: corporates (17%) and mortgages (21%)
Profit up due to lower costs and LLPs. Strong improvement in asset quality
QoQ: Profit hit by lower trading gains and the higher tax charge
After Popular acquisition Santander Totta is the leading2 privately owned bank
2.01% 1.97% 1.90% 1.86% 1.84%
0.35% 0.30% 0.25% 0.22% 0.19%4Q'16 1Q'17 2Q 3Q 4Q
PORTUGAL – excl. Popular
Loyal customers (thousands) 636 686
Digital customers (thousands) 502 558
NPL ratio (%) 8.81 5.71
Cost of credit (%) 0.18 -0.04
Efficiency ratio (%) 48.7 48.0
RoTE (%) 13.0 12.7
ACTIVITY
Cost of deposits
Yield on loans
Note: Loans excluding repos. Funds: deposits excluding repos + marketed mutual funds(2) By domestic assets and loans, as of Sep’17
P&L 4Q'17 %3Q'17 2017 %2016KEY DATA 2016 2017
31 32
Loans Funds
+8%YoY
+2%YoY
0%QoQ
+1%QoQ
Volumes in €Bn
(1) €Mn
1
62
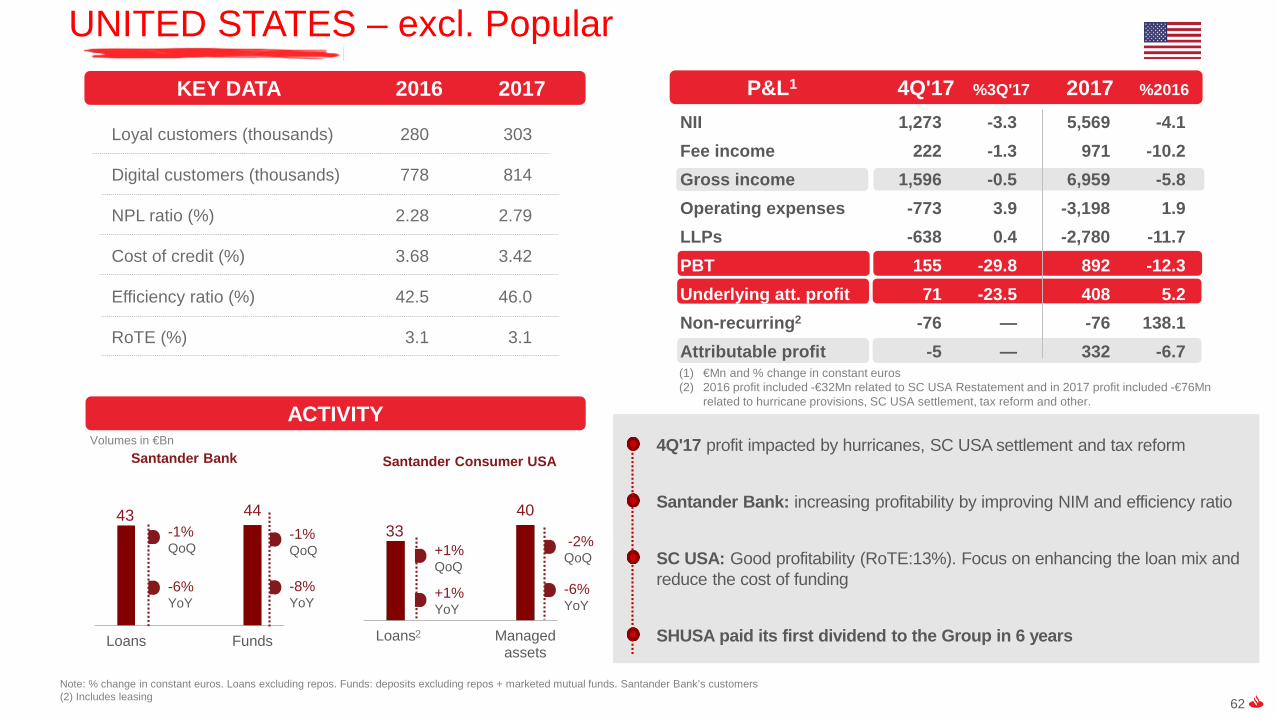
NII 1,273 -3.3 5,569 -4.1 Fee income 222 -1.3 971 -10.2 Gross income 1,596 -0.5 6,959 -5.8 Operating expenses -773 3.9 -3,198 1.9 LLPs -638 0.4 -2,780 -11.7 PBT 155 -29.8 892 -12.3 Underlying att. profit 71 -23.5 408 5.2 Non-recurring2 -76 — -76 138.1 Attributable profit -5 — 332 -6.7
4Q'17 profit impacted by hurricanes, SC USA settlement and tax reform
Santander Bank: increasing profitability by improving NIM and efficiency ratio
SC USA: Good profitability (RoTE:13%). Focus on enhancing the loan mix and reduce the cost of funding
SHUSA paid its first dividend to the Group in 6 years
UNITED STATES – excl. Popular
Loyal customers (thousands) 280 303
Digital customers (thousands) 778 814
NPL ratio (%) 2.28 2.79
Cost of credit (%) 3.68 3.42
Efficiency ratio (%) 42.5 46.0
RoTE (%) 3.1 3.1
ACTIVITYVolumes in €Bn
Note: % change in constant euros. Loans excluding repos. Funds: deposits excluding repos + marketed mutual funds. Santander Bank’s customers (2) Includes leasing
(1) €Mn and % change in constant euros(2) 2016 profit included -€32Mn related to SC USA Restatement and in 2017 profit included -€76Mn
related to hurricane provisions, SC USA settlement, tax reform and other.
P&L1 4Q'17 %3Q'17 2017 %2016KEY DATA 2016 2017
43 44
Loans Funds
Santander Bank
-1%QoQ
-6%YoY
-1%QoQ
-8%YoY
Santander Consumer USA
33 40
Loans Managedassets
+1%QoQ
+1%YoY
-2%QoQ
-6%YoY
2
63
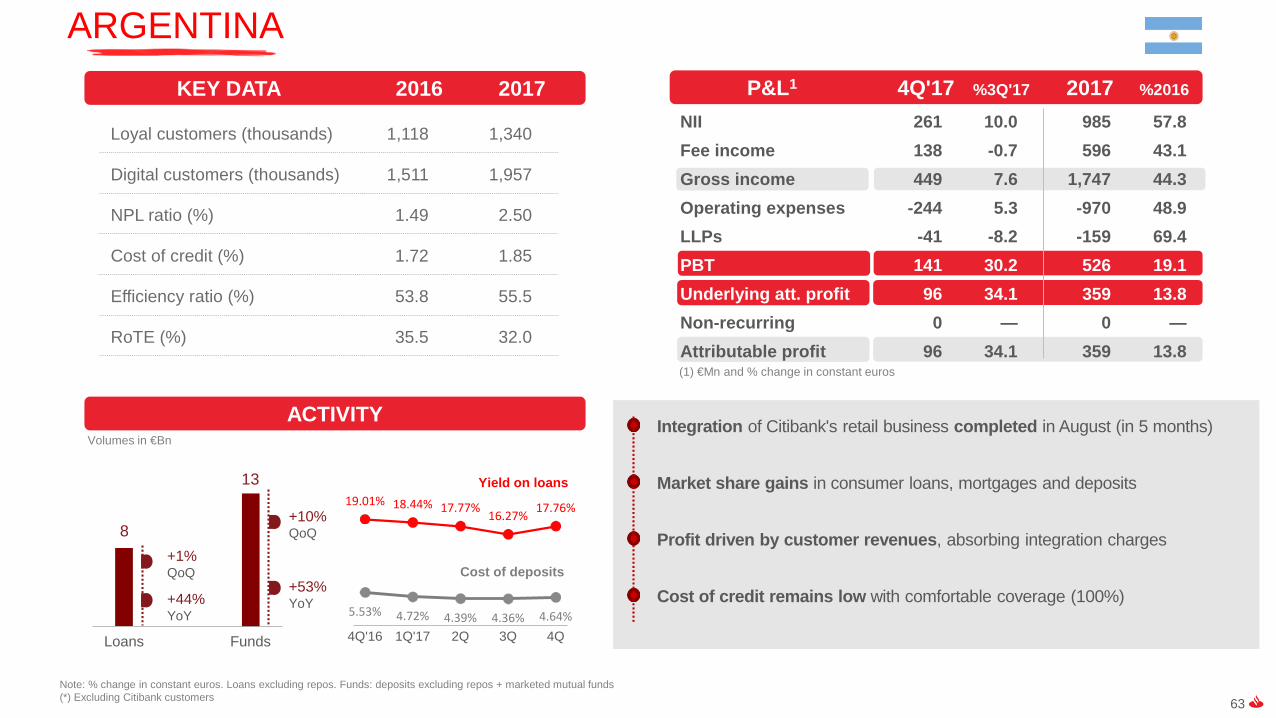
NII 261 10.0 985 57.8 Fee income 138 -0.7 596 43.1 Gross income 449 7.6 1,747 44.3 Operating expenses -244 5.3 -970 48.9 LLPs -41 -8.2 -159 69.4 PBT 141 30.2 526 19.1 Underlying att. profit 96 34.1 359 13.8 Non-recurring 0 — 0 —Attributable profit 96 34.1 359 13.8
Integration of Citibank's retail business completed in August (in 5 months)
Market share gains in consumer loans, mortgages and deposits
Profit driven by customer revenues, absorbing integration charges
Cost of credit remains low with comfortable coverage (100%)
19.01% 18.44% 17.77% 16.27% 17.76%
5.53% 4.72% 4.39% 4.36% 4.64%4Q'16 1Q'17 2Q 3Q 4Q
ARGENTINA
Loyal customers (thousands) 1,118 1,340
Digital customers (thousands) 1,511 1,957
NPL ratio (%) 1.49 2.50
Cost of credit (%) 1.72 1.85
Efficiency ratio (%) 53.8 55.5
RoTE (%) 35.5 32.0
ACTIVITY
Cost of deposits
Yield on loans
Volumes in €Bn
Note: % change in constant euros. Loans excluding repos. Funds: deposits excluding repos + marketed mutual funds(*) Excluding Citibank customers
(1) €Mn and % change in constant euros
P&L1 4Q'17 %3Q'17 2017 %2016KEY DATA 2016 2017
8
13
Loans Funds
+1%QoQ
+44%YoY
+10%QoQ
+53%YoY

64
NII 243 2.6 928 8.6 Fee income 116 1.3 443 8.1 Gross income 378 4.9 1,419 5.4 Operating expenses -160 6.2 -605 1.9 LLPs -40 10.4 -137 -7.5 PBT 159 9.7 581 11.6 Underlying att. profit 81 6.1 300 7.7 Non-recurring2 0 — 0 -100.0 Attributable profit 81 6.1 300 -2.8
4.02% 4.06% 4.12% 4.14% 4.15%
0.83% 0.80% 0.81% 0.78% 0.72%
4Q'16 1Q'17 2Q 3Q 4Q
Agreement for the acquisition of the retail and private banking businesses of Deutsche Bank Polska, S.A.
Loan growth fuelled by corporates and individuals. Deposit base stable with significant growth in demand and saving accounts
PBT spurred by NII, fee income, LLPs and cost control. Profit affected by regulatory impacts3
Strong credit quality improvement: lower NPL ratio and better cost of credit
POLAND
Note: % change in constant euros. Loans excluding repos. Funds: deposits excluding repos + marketed mutual funds. Underlying RoTE in 2016(3) Tax on assets, contribution to BFG and new consideration of BFG as non-tax deductible
Loyal customers (thousands) 1,350 1,387
Digital customers (thousands) 1,979 2,089
NPL ratio (%) 5.42 4.57
Cost of credit (%) 0.70 0.62
Efficiency ratio (%) 44.1 42.6
RoTE (%) 11.6 11.6
ACTIVITY
Cost of deposits
Yield on loansVolumes in €Bn
(1) €Mn and % change in constant euros(2) 2016 profit included €29Mn related to capital gains from the disposal of the stake in VISA
Europe and restructuring costs
P&L1 4Q'17 %3Q'17 2017 %2016KEY DATA 2016 2017
23 28
Loans Funds
0%QoQ
+5%YoY
+1%QoQ
+2%YoY

65
OTHER LATIN AMERICAN COUNTRIES
Constant € million
Attributable profit
Uruguay Peru
3840
2016 2017
86103
2016 2017
+19% +7%
Focusing on loyalty, transactions and target segments
Uruguay’s profit driven by higher revenues and cost control
Peru’s profit driven by higher revenues and release of provisions
66
Global segmentsresults
67
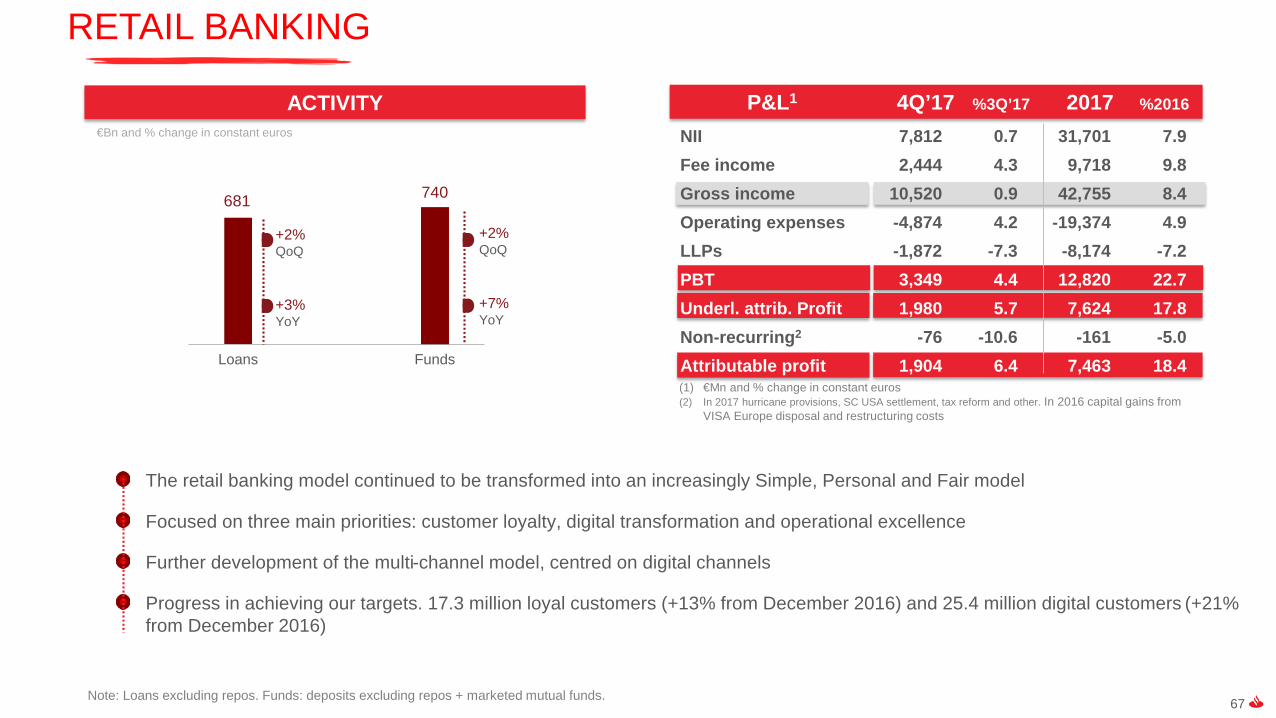
RETAIL BANKING
681 740
Loans Funds
ACTIVITY
+2%QoQ
+3%YoY
Note: Loans excluding repos. Funds: deposits excluding repos + marketed mutual funds.
+2%QoQ
+7%YoY
The retail banking model continued to be transformed into an increasingly Simple, Personal and Fair model
Focused on three main priorities: customer loyalty, digital transformation and operational excellence
Further development of the multi-channel model, centred on digital channels
Progress in achieving our targets. 17.3 million loyal customers (+13% from December 2016) and 25.4 million digital customers (+21% from December 2016)
€Bn and % change in constant euros
(1) €Mn and % change in constant euros(2) In 2017 hurricane provisions, SC USA settlement, tax reform and other. In 2016 capital gains from
VISA Europe disposal and restructuring costs
P&L1 4Q’17 %3Q’17 2017 %2016
NII 7,812 0.7 31,701 7.9 Fee income 2,444 4.3 9,718 9.8 Gross income 10,520 0.9 42,755 8.4 Operating expenses -4,874 4.2 -19,374 4.9 LLPs -1,872 -7.3 -8,174 -7.2 PBT 3,349 4.4 12,820 22.7 Underl. attrib. Profit 1,980 5.7 7,624 17.8 Non-recurring2 -76 -10.6 -161 -5.0Attributable profit 1,904 6.4 7,463 18.4

68
1,820 1,832
1,297 1,383
1,715 1,721
655 6175,486 5,552
2016 2017
GLOBAL CORPORATE BANKING
GROSS INCOME
Improved quality of customer revenues, driven by value-added business and higher fee income that offset lower use of the balance sheet
Better positioning in value-added businesses. Drive in low capital consumption businesses (export finance, agent finance and trade finance)
Continued improvement in services to retail network customers through digitalisation and tailored products
Attributable profit up 1% and accounting 20% of the operating areas
Constant €Mn
+1%
+1%
0%
-6%TOTAL
Global TransactionBanking
Global Markets
Capital & Other
+7%Customers
+2%Financing
Solutions & Advisory
(1) €Mn and % change in constant euros(2) In 2016 restructuring costs
P&L1 4Q’17 %3Q’17 2017 %2016
NII 587 -2.0 2,478 -2.5 Fee income 393 0.1 1,627 15.9 Gross income 1,239 -8.4 5,552 1.2 Operating expenses -519 6.0 -1,988 4.8 LLPs -207 81.8 -690 0.8 PBT 484 -32.9 2,804 -0.9 Underl. attrib. Profit 320 -30.8 1,821 -2.4 Non-recurring2 0 — 0 -100.0 Attributable profit 320 -30.8 1,821 0.8

69
Liquidity
70
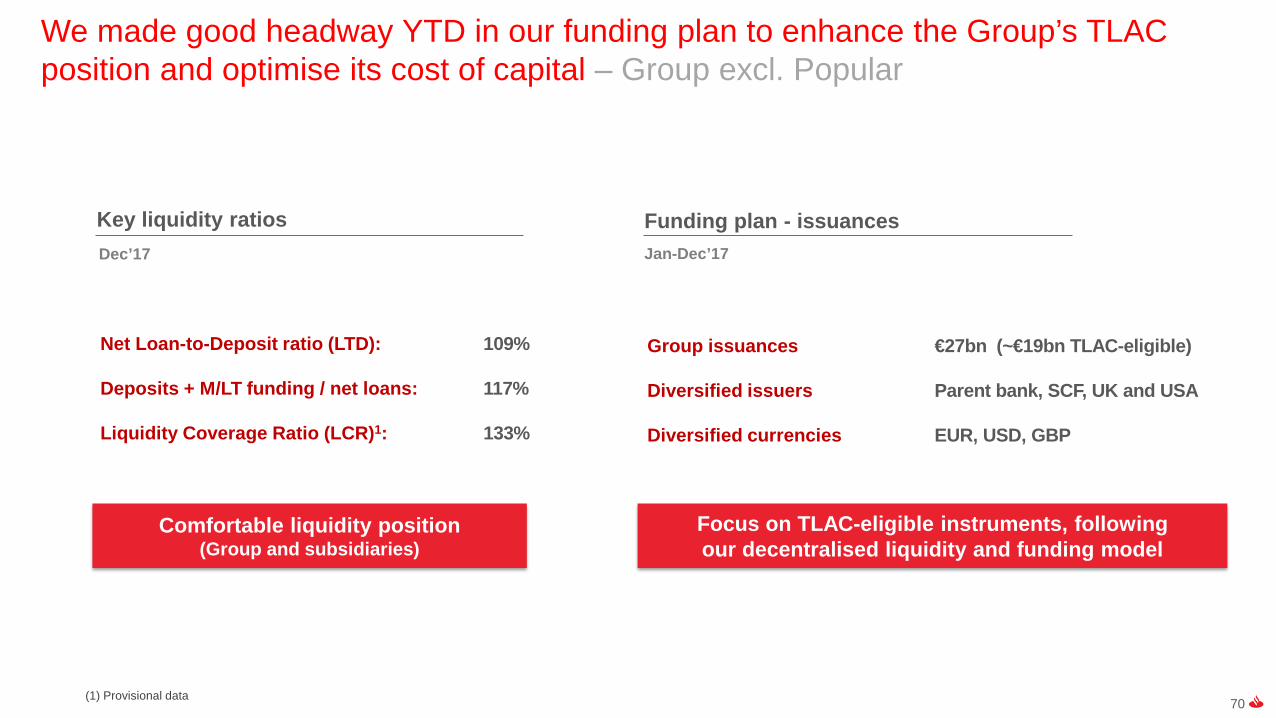
We made good headway YTD in our funding plan to enhance the Group’s TLAC position and optimise its cost of capital – Group excl. Popular
Dec’17
Net Loan-to-Deposit ratio (LTD): 109%
Deposits + M/LT funding / net loans: 117%
Liquidity Coverage Ratio (LCR)1: 133%
Focus on TLAC-eligible instruments, following our decentralised liquidity and funding model
Comfortable liquidity position(Group and subsidiaries)
(1) Provisional data
Jan-Dec’17
Group issuances €27bn (~€19bn TLAC-eligible)
Diversified issuers Parent bank, SCF, UK and USA
Diversified currencies EUR, USD, GBP
Key liquidity ratios Funding plan - issuances

71
NPL, coverage ratios and cost of credit

72
NPL ratio%
31.03.16 30.06.16 30.09.16 31.12.16 31.03.17 30.06.17 30.09.17 31.12.17
Continental Europe 7.08 6.84 6.43 5.92 5.62 5.11 4.95 4.50
Spain 6.36 6.06 5.82 5.41 5.22 4.99 4.99 4.72
Santander Consumer Finance 3.28 2.95 2.86 2.68 2.62 2.61 2.60 2.50
Poland 5.93 5.84 5.71 5.42 5.20 4.66 4.70 4.57
Portugal 8.55 10.46 9.40 8.81 8.47 7.67 6.93 5.71United Kingdom 1.49 1.47 1.47 1.41 1.31 1.23 1.32 1.33
Latin America 4.88 4.98 4.94 4.81 4.50 4.44 4.45 4.50
Brazil 5.93 6.11 6.12 5.90 5.36 5.36 5.32 5.29
Mexico 3.06 3.01 2.95 2.76 2.77 2.58 2.56 2.69
Chile 5.45 5.28 5.12 5.05 4.93 5.00 4.95 4.96USA 2.19 2.24 2.24 2.28 2.43 2.64 2.56 2.79
Operating Areas 4.36 4.32 4.19 3.95 3.77 3.57 3.53 3.39
Total Group 4.33 4.29 4.15 3.93 3.74 3.55 3.51 3.38
NOTE. Total Group including Popular: 5.37% in Jun 2017 ; 4.24% in Sep 2017 ; 4.08% in Dec 2017

73
Coverage ratio%
31.03.16 30.06.16 30.09.16 31.12.16 31.03.17 30.06.17 30.09.17 31.12.17
Continental Europe 65.4 61.3 61.3 60.0 60.6 58.7 58.1 58.0
Spain 50.2 47.6 47.6 48.3 49.1 46.0 45.2 45.9
Santander Consumer Finance 111.9 110.6 110.7 109.1 108.9 106.5 104.3 101.4
Poland 67.0 65.8 68.9 61.0 61.2 67.5 67.6 68.2
Portugal 87.7 61.9 57.8 63.7 61.7 59.8 60.4 59.1United Kingdom 36.5 36.5 36.0 32.9 33.8 32.6 31.5 32.0
Latin America 79.7 81.4 84.5 87.3 90.5 89.1 89.9 84.8
Brazil 83.7 85.3 89.3 93.1 98.1 95.5 97.6 92.6
Mexico 97.5 102.3 101.9 103.8 104.8 113.8 110.3 97.5
Chile 54.6 55.5 58.1 59.1 58.9 58.2 58.5 58.2USA 221.1 220.6 216.2 214.4 202.4 183.1 187.5 170.2
Operating Areas 73.3 72.0 72.8 73.5 74.6 72.6 72.1 70.7
Total Group 74.0 72.5 72.7 73.8 74.6 72.7 72.3 70.8
NOTE. Total Group including Popular: 67.7% in Jun 2017 ; 65.8% in Sep 2017 ; 65.2% in Dec 2017

74Percentage over Group's total(*) Excluding SCF UK
Spain, 19%
SCF*, 12%
Poland, 4%
Portugal, 6%
UK, 5%Brazil, 20%
Mexico, 4%
Chile, 6%
USA, 18%
Other, 6%
Spain, 29%
SCF*, 8%
Poland, 4%Portugal,
7%UK, 12%
Brazil, 16%
Mexico, 3%
Chile, 7%
USA, 8%
Other, 6%
100%: €28,104Mn 100%: €19,906Mn
Non-performing loans Loan-loss allowances
Non-performing loans and loan-loss allowances. December 2017 – Group excl. Popular

75
Cost of credit%
31.03.16 30.06.16 30.09.16 31.12.16 31.03.17 30.06.17 30.09.17 31.12.17
Continental Europe 0.60 0.51 0.46 0.44 0.38 0.37 0.34 0.32
Spain 0.54 0.45 0.41 0.37 0.33 0.33 0.31 0.33
Santander Consumer Finance 0.64 0.55 0.49 0.47 0.39 0.37 0.34 0.30
Poland 0.82 0.75 0.76 0.70 0.66 0.65 0.61 0.62
Portugal 0.28 0.21 0.17 0.18 0.07 0.03 0.03 (0.04)United Kingdom 0.01 0.03 0.05 0.02 0.03 0.02 0.03 0.08
Latin America 3.39 3.41 3.42 3.37 3.36 3.37 3.27 3.17
Brazil 4.63 4.71 4.87 4.89 4.84 4.79 4.55 4.36
Mexico 2.95 2.96 2.86 2.86 2.94 3.01 3.14 3.08
Chile 1.58 1.59 1.55 1.43 1.42 1.37 1.27 1.21USA 3.85 3.77 3.80 3.68 3.63 3.65 3.57 3.42
Operating Areas 1.24 1.20 1.20 1.19 1.18 1.19 1.15 1.12
Total Group 1.22 1.19 1.19 1.18 1.17 1.19 1.15 1.12
NOTE. Total Group including Popular: 1.17% in Jun 2017 ; 1.12% in Set 2017 ; 1.07% in Dec 2017

76
Quarterly income statements

77
(*).- Including: in 2Q16 capital gains from the disposal of the stake in Visa Europe, and restructuring costs in 4Q16 PPI and restatement Santander Consumer USAin 3Q17 charges for integration costs and equity stakes and intangible assetsin 4Q17 Allfunds capital gains, USA fiscal reform, goodwill charges and in the US, provisions for hurricanes, increased stake in Santander Consumer USA and other
Grupo Santander (with Popular)€ million
1Q 16 2Q 16 3Q 16 4Q 16 1Q 17 2Q 17 3Q 17 4Q 17 2016 2017
NII + Fee income 10,021 10,119 10,395 10,734 11,246 11,522 11,569 11,556 41,268 45,892
Gross income 10,730 10,755 11,080 11,288 12,029 12,049 12,252 12,062 43,853 48,392
Operating expenses (5,158) (5,227) (5,250) (5,453) (5,543) (5,648) (5,766) (5,961) (21,088) (22,918)
Net operating income 5,572 5,528 5,831 5,835 6,486 6,401 6,486 6,101 22,766 25,473
Net loan-loss provisions (2,408) (2,205) (2,499) (2,406) (2,400) (2,280) (2,250) (2,181) (9,518) (9,111)
Other (433) (544) (392) (591) (775) (848) (645) (544) (1,960) (2,812)
Underlying profit before taxes 2,732 2,779 2,940 2,838 3,311 3,273 3,591 3,375 11,288 13,550
Underlying consolidated profit 1,922 1,864 2,036 2,072 2,186 2,144 2,347 2,285 7,893 8,963
Underlying attributable profit 1,633 1,526 1,695 1,766 1,867 1,749 1,976 1,924 6,621 7,516
Net capital gains and provisions* — (248) — (169) — — (515) (382) (417) (897)
Attributable profit 1,633 1,278 1,695 1,598 1,867 1,749 1,461 1,542 6,204 6,619

78
Grupo Santander (with Popular)Constant € million
1Q 16 2Q 16 3Q 16 4Q 16 1Q 17 2Q 17 3Q 17 4Q 17 2016 2017
NII + Fee income 10,227 10,214 10,330 10,577 10,820 11,318 11,817 11,938 41,349 45,892
Gross income 10,921 10,849 11,014 11,111 11,570 11,836 12,519 12,466 43,897 48,392
Operating expenses (5,204) (5,235) (5,214) (5,381) (5,357) (5,555) (5,880) (6,126) (21,034) (22,918)
Net operating income 5,717 5,614 5,800 5,731 6,213 6,281 6,639 6,340 22,862 25,473
Net loan-loss provisions (2,520) (2,271) (2,501) (2,362) (2,285) (2,236) (2,311) (2,279) (9,655) (9,111)
Other (459) (556) (381) (585) (747) (834) (663) (568) (1,980) (2,812)
Underlying profit before taxes 2,739 2,787 2,918 2,784 3,181 3,211 3,665 3,494 11,228 13,550
Underlying consolidated profit 1,932 1,867 2,019 2,036 2,099 2,099 2,399 2,366 7,854 8,963
Underlying attributable profit 1,638 1,523 1,679 1,734 1,790 1,711 2,022 1,993 6,574 7,516
Net capital gains and provisions* — (259) 3 (157) — — (515) (382) (414) (897)
Attributable profit 1,638 1,264 1,682 1,577 1,790 1,711 1,507 1,611 6,161 6,619
(*).- Including: in 2Q16 capital gains from the disposal of the stake in Visa Europe, and restructuring costs in 4Q16 PPI and restatement Santander Consumer USAin 3Q17 charges for integration costs and equity stakes and intangible assetsin 4Q17 Allfunds capital gains, USA fiscal reform, goodwill charges and in the US, provisions for hurricanes, increased stake in Santander Consumer USA and other

79
Grupo Santander (w/o Popular)€ million
1Q 16 2Q 16 3Q 16 4Q 16 1Q 17 2Q 17 3Q 17 4Q 17 2016 2017
NII + Fee income 10,021 10,119 10,395 10,734 11,246 11,382 10,984 10,989 41,268 44,601
Gross income 10,730 10,755 11,080 11,288 12,029 11,910 11,617 11,526 43,853 47,082
Operating expenses (5,158) (5,227) (5,250) (5,453) (5,543) (5,552) (5,379) (5,571) (21,088) (22,045)
Net operating income 5,572 5,528 5,831 5,835 6,486 6,358 6,239 5,955 22,766 25,038
Net loan-loss provisions (2,408) (2,205) (2,499) (2,406) (2,400) (2,272) (2,212) (2,114) (9,518) (8,997)
Other (433) (544) (392) (591) (775) (828) (652) (537) (1,960) (2,792)
Underlying profit before taxes 2,732 2,779 2,940 2,838 3,311 3,258 3,375 3,305 11,288 13,248
Underlying consolidated profit 1,922 1,864 2,036 2,072 2,186 2,133 2,180 2,200 7,893 8,700
Underlying attributable profit 1,633 1,526 1,695 1,766 1,867 1,738 1,809 1,839 6,621 7,253
Net capital gains and provisions* — (248) — (169) — — (215) (382) (417) (597)
Attributable profit (Ex-Popular) 1,633 1,278 1,695 1,598 1,867 1,738 1,594 1,457 6,204 6,656
(*).- Including: in 2Q16 capital gains from the disposal of the stake in Visa Europe, and restructuring costs in 4Q16 PPI and restatement Santander Consumer USAin 3Q17 charges for integration costs and equity stakes and intangible assetsin 4Q17 Allfunds capital gains, USA fiscal reform, goodwill charges and in the US, provisions for hurricanes, increased stake in Santander Consumer USA and other

80
Grupo Santander (w/o Popular)Constant € million
1Q 16 2Q 16 3Q 16 4Q 16 1Q 17 2Q 17 3Q 17 4Q 17 2016 2017
NII + Fee income 10,227 10,214 10,330 10,577 10,820 11,178 11,232 11,371 41,349 44,601
Gross income 10,921 10,849 11,014 11,111 11,570 11,697 11,885 11,931 43,897 47,082
Operating expenses (5,204) (5,235) (5,214) (5,381) (5,357) (5,459) (5,493) (5,736) (21,034) (22,045)
Net operating income 5,717 5,614 5,800 5,731 6,213 6,238 6,392 6,194 22,862 25,038
Net loan-loss provisions (2,520) (2,271) (2,501) (2,362) (2,285) (2,228) (2,273) (2,211) (9,655) (8,997)
Other (459) (556) (381) (585) (747) (814) (670) (560) (1,980) (2,792)
Underlying profit before taxes 2,739 2,787 2,918 2,784 3,181 3,196 3,449 3,423 11,228 13,248
Underlying consolidated profit 1,932 1,867 2,019 2,036 2,099 2,089 2,232 2,281 7,854 8,700
Underlying attributable profit 1,638 1,523 1,679 1,734 1,790 1,700 1,854 1,909 6,574 7,253
Net capital gains and provisions* — (259) 3 (157) — — (215) (382) (414) (597)
Attributable profit (Ex-Popular) 1,638 1,264 1,682 1,577 1,790 1,700 1,639 1,526 6,161 6,656
(*).- Including: in 2Q16 capital gains from the disposal of the stake in Visa Europe, and restructuring costs in 4Q16 PPI and restatement Santander Consumer USAin 3Q17 charges for integration costs and equity stakes and intangible assetsin 4Q17 Allfunds capital gains, USA fiscal reform, goodwill charges and in the US, provisions for hurricanes, increased stake in Santander Consumer USA and other

81
Spain (w/o Popular)€ million
1Q 16 2Q 16 3Q 16 4Q 16 1Q 17 2Q 17 3Q 17 4Q 17 2016 2017
NII + Fee income 1,243 1,232 1,185 1,198 1,206 1,287 1,235 1,248 4,858 4,976
Gross income 1,543 1,343 1,398 1,324 1,539 1,351 1,435 1,368 5,608 5,694
Operating expenses (837) (834) (824) (802) (798) (806) (815) (841) (3,297) (3,259)
Net operating income 706 509 574 522 741 545 621 528 2,311 2,434
Net loan-loss provisions (231) (129) (140) (85) (163) (137) (104) (110) (585) (513)
Other (37) (82) (51) (97) (64) (64) (55) (23) (267) (207)
Underlying profit before taxes 438 298 382 340 514 344 461 395 1,459 1,714
Underlying consolidated profit 312 213 274 243 367 246 316 267 1,043 1,197
Underlying attributable profit 307 208 270 237 362 241 311 265 1,022 1,180
Net capital gains and provisions* — (216) — — — — — — (216) —
Attributable profit 307 (8) 270 237 362 241 311 265 806 1,180
(*).- Including: in 2Q16 capital gains from the disposal of the stake in Visa Europe, and restructuring costs

82
Santander Consumer Finance€ million
1Q 16 2Q 16 3Q 16 4Q 16 1Q 17 2Q 17 3Q 17 4Q 17 2016 2017
NII + Fee income 1,041 1,061 1,099 1,052 1,121 1,096 1,121 1,110 4,253 4,449
Gross income 1,045 1,051 1,106 1,060 1,118 1,099 1,135 1,132 4,262 4,484
Operating expenses (483) (468) (467) (486) (502) (485) (484) (506) (1,904) (1,978)
Net operating income 562 583 639 574 616 614 650 625 2,357 2,506
Net loan-loss provisions (114) (70) (116) (87) (61) (57) (90) (58) (387) (266)
Other (39) (41) (36) (52) (37) (35) (30) (55) (168) (157)
Underlying profit before taxes 410 472 487 434 518 522 531 512 1,803 2,083
Underlying consolidated profit 293 324 346 319 370 382 370 373 1,282 1,495
Underlying attributable profit 251 282 291 269 314 319 309 311 1,093 1,254
Net capital gains and provisions* — 25 — — — — (85) (0) 25 (85)
Attributable profit 251 307 291 269 314 319 224 311 1,119 1,168
(*).- Including: in 2Q16 capital gains from the disposal of the stake in Visa Europein 3Q17 charges for integration costs

83
Santander Consumer FinanceConstant € million
1Q 16 2Q 16 3Q 16 4Q 16 1Q 17 2Q 17 3Q 17 4Q 17 2016 2017
NII + Fee income 1,047 1,063 1,100 1,049 1,116 1,096 1,122 1,114 4,258 4,449
Gross income 1,051 1,053 1,106 1,057 1,113 1,099 1,136 1,136 4,267 4,484
Operating expenses (485) (469) (467) (485) (500) (485) (485) (508) (1,906) (1,978)
Net operating income 565 584 639 572 613 614 651 628 2,360 2,506
Net loan-loss provisions (115) (70) (116) (87) (60) (57) (89) (58) (388) (266)
Other (39) (42) (36) (52) (37) (35) (30) (55) (168) (157)
Underlying profit before taxes 412 472 487 433 515 522 532 514 1,804 2,083
Underlying consolidated profit 295 325 345 318 368 381 371 375 1,283 1,495
Underlying attributable profit 253 282 291 268 312 319 310 313 1,094 1,254
Net capital gains and provisions* — 26 (0) (0) — — (85) (0) 25 (85)
Attributable profit 253 308 291 268 312 319 225 313 1,119 1,168
(*).- Including: in 2Q16 capital gains from the disposal of the stake in Visa Europein 3Q17 charges for integration costs
84
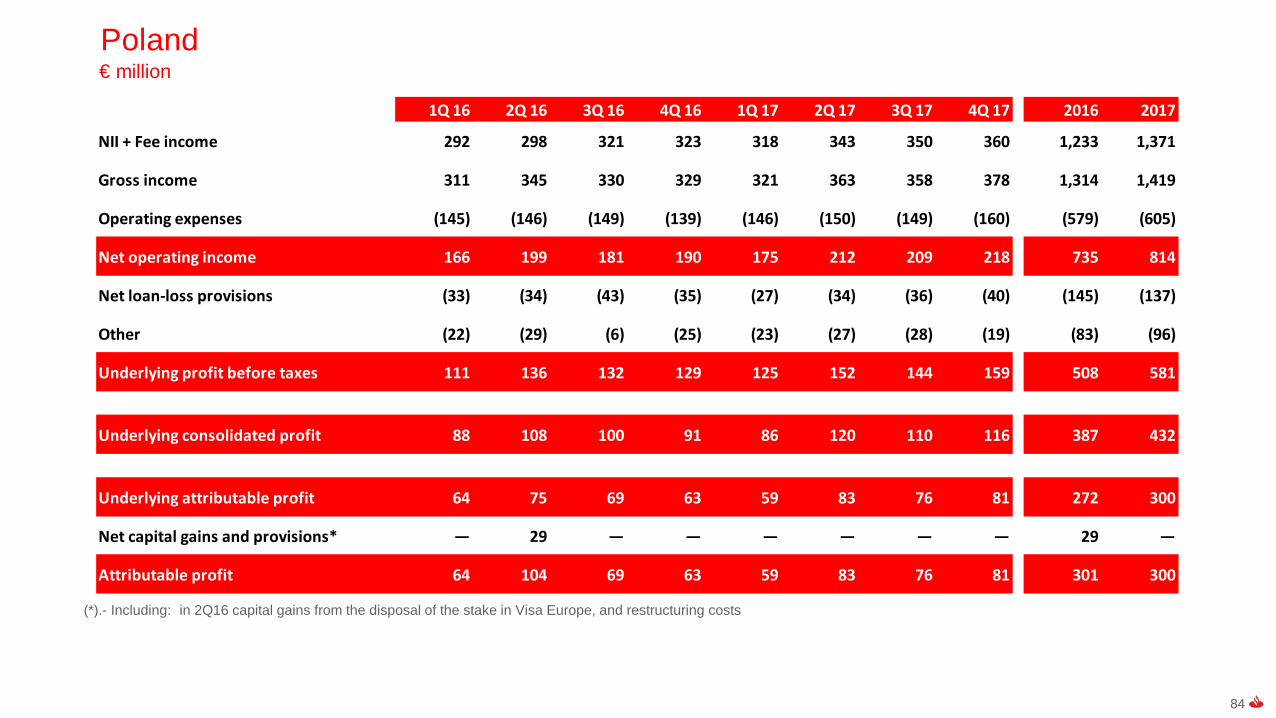
Poland€ million
1Q 16 2Q 16 3Q 16 4Q 16 1Q 17 2Q 17 3Q 17 4Q 17 2016 2017
NII + Fee income 292 298 321 323 318 343 350 360 1,233 1,371
Gross income 311 345 330 329 321 363 358 378 1,314 1,419
Operating expenses (145) (146) (149) (139) (146) (150) (149) (160) (579) (605)
Net operating income 166 199 181 190 175 212 209 218 735 814
Net loan-loss provisions (33) (34) (43) (35) (27) (34) (36) (40) (145) (137)
Other (22) (29) (6) (25) (23) (27) (28) (19) (83) (96)
Underlying profit before taxes 111 136 132 129 125 152 144 159 508 581
Underlying consolidated profit 88 108 100 91 86 120 110 116 387 432
Underlying attributable profit 64 75 69 63 59 83 76 81 272 300
Net capital gains and provisions* — 29 — — — — — — 29 —
Attributable profit 64 104 69 63 59 83 76 81 301 300
(*).- Including: in 2Q16 capital gains from the disposal of the stake in Visa Europe, and restructuring costs

85
PolandPLN million
1Q 16 2Q 16 3Q 16 4Q 16 1Q 17 2Q 17 3Q 17 4Q 17 2016 2017
NII + Fee income 1,275 1,301 1,391 1,412 1,374 1,449 1,489 1,522 5,379 5,835
Gross income 1,357 1,507 1,430 1,440 1,386 1,532 1,525 1,599 5,733 6,041
Operating expenses (632) (638) (647) (609) (630) (634) (636) (675) (2,527) (2,576)
Net operating income 724 869 783 831 756 898 889 924 3,207 3,465
Net loan-loss provisions (144) (149) (186) (153) (116) (142) (155) (171) (632) (585)
Other (97) (126) (25) (111) (100) (112) (119) (78) (360) (410)
Underlying profit before taxes 483 593 573 566 539 644 614 674 2,215 2,471
Underlying consolidated profit 384 471 434 399 372 506 470 492 1,688 1,840
Underlying attributable profit 281 327 300 277 257 351 324 344 1,185 1,276
Net capital gains and provisions* — 128 (0) 0 — — — — 128 —
Attributable profit 281 455 300 277 257 351 324 344 1,313 1,276
(*).- Including: in 2Q16 capital gains from the disposal of the stake in Visa Europe, and restructuring costs
86
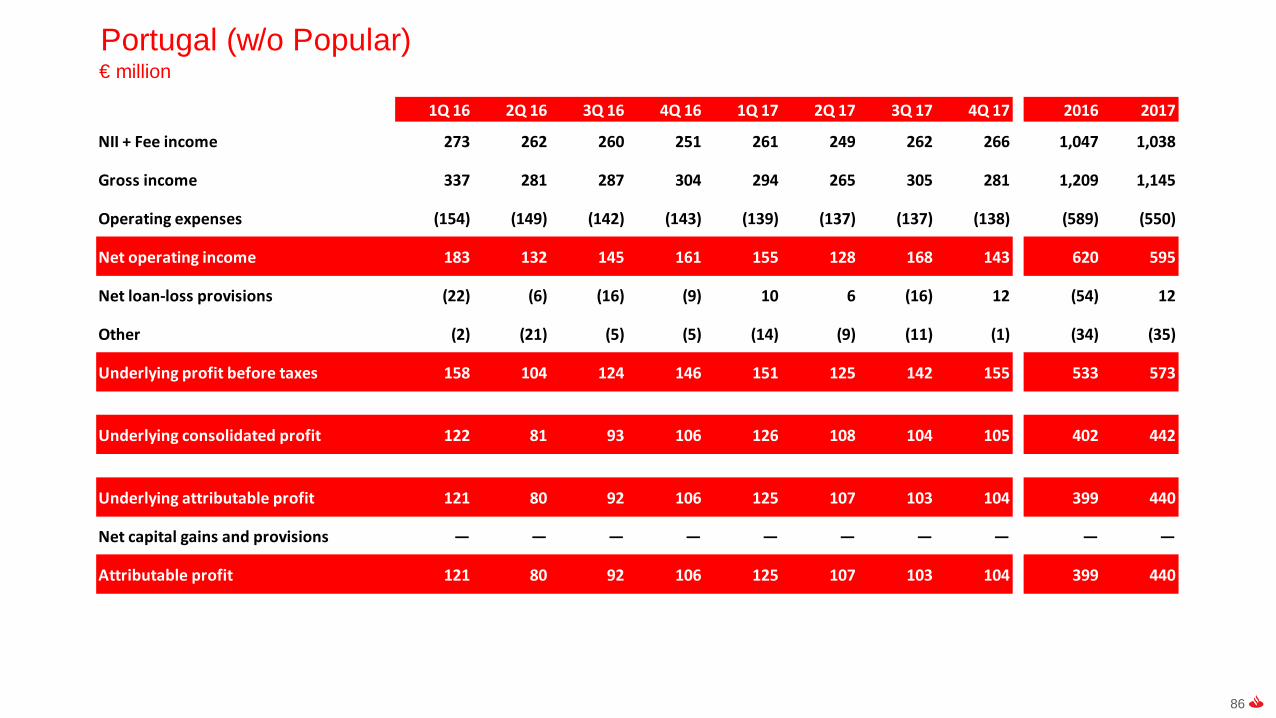
Portugal (w/o Popular)€ million
1Q 16 2Q 16 3Q 16 4Q 16 1Q 17 2Q 17 3Q 17 4Q 17 2016 2017
NII + Fee income 273 262 260 251 261 249 262 266 1,047 1,038
Gross income 337 281 287 304 294 265 305 281 1,209 1,145
Operating expenses (154) (149) (142) (143) (139) (137) (137) (138) (589) (550)
Net operating income 183 132 145 161 155 128 168 143 620 595
Net loan-loss provisions (22) (6) (16) (9) 10 6 (16) 12 (54) 12
Other (2) (21) (5) (5) (14) (9) (11) (1) (34) (35)
Underlying profit before taxes 158 104 124 146 151 125 142 155 533 573
Underlying consolidated profit 122 81 93 106 126 108 104 105 402 442
Underlying attributable profit 121 80 92 106 125 107 103 104 399 440
Net capital gains and provisions — — — — — — — — — —
Attributable profit 121 80 92 106 125 107 103 104 399 440

87
United Kingdom€ million
1Q 16 2Q 16 3Q 16 4Q 16 1Q 17 2Q 17 3Q 17 4Q 17 2016 2017
NII + Fee income 1,434 1,393 1,302 1,307 1,349 1,409 1,317 1,291 5,436 5,366
Gross income 1,513 1,501 1,377 1,425 1,432 1,544 1,397 1,344 5,816 5,716
Operating expenses (794) (788) (703) (683) (723) (723) (694) (721) (2,967) (2,861)
Net operating income 719 713 675 742 709 821 703 623 2,850 2,855
Net loan-loss provisions (7) (68) (44) 61 (15) (42) (66) (81) (58) (205)
Other (59) (71) (85) (124) (105) (171) (89) (101) (339) (466)
Underlying profit before taxes 654 574 545 679 588 608 547 441 2,452 2,184
Underlying consolidated profit 462 401 370 483 423 414 382 304 1,716 1,523
Underlying attributable profit 453 390 364 474 416 408 377 297 1,681 1,498
Net capital gains and provisions* — 107 — (137) — — — — (30) —
Attributable profit 453 497 364 338 416 408 377 297 1,651 1,498
(*).- Including: in 2Q16 capital gains from the disposal of the stake in Visa Europe and restructuring costs in 4Q16 PPI

88
United Kingdom£ million
1Q 16 2Q 16 3Q 16 4Q 16 1Q 17 2Q 17 3Q 17 4Q 17 2016 2017
NII + Fee income 1,105 1,096 1,108 1,133 1,160 1,213 1,183 1,146 4,442 4,702
Gross income 1,166 1,180 1,172 1,234 1,231 1,329 1,255 1,193 4,752 5,008
Operating expenses (611) (619) (599) (594) (622) (622) (623) (639) (2,424) (2,507)
Net operating income 554 561 573 640 609 706 632 554 2,328 2,502
Net loan-loss provisions (5) (53) (37) 48 (13) (36) (59) (72) (48) (179)
Other (45) (56) (71) (104) (90) (147) (81) (90) (277) (408)
Underlying profit before taxes 504 452 465 583 506 524 492 392 2,004 1,914
Underlying consolidated profit 356 316 316 414 364 356 344 270 1,402 1,334
Underlying attributable profit 349 307 311 407 358 351 339 265 1,373 1,313
Net capital gains and provisions* — 83 2 (110) — — — — (24) —
Attributable profit 349 390 313 297 358 351 339 265 1,349 1,313
(*).- Including: in 2Q16 capital gains from the disposal of the stake in Visa Europe and restructuring costs in 4Q16 PPI

89
Brazil€ million
1Q 16 2Q 16 3Q 16 4Q 16 1Q 17 2Q 17 3Q 17 4Q 17 2016 2017
NII + Fee income 2,365 2,583 2,899 3,155 3,455 3,413 3,392 3,458 11,002 13,718
Gross income 2,381 2,703 3,050 3,187 3,717 3,502 3,542 3,512 11,321 14,273
Operating expenses (947) (1,046) (1,177) (1,305) (1,314) (1,233) (1,244) (1,289) (4,475) (5,080)
Net operating income 1,434 1,657 1,873 1,882 2,403 2,269 2,298 2,223 6,845 9,193
Net loan-loss provisions (720) (753) (951) (953) (910) (852) (819) (814) (3,377) (3,395)
Other (177) (193) (134) (193) (358) (349) (268) (211) (696) (1,186)
Underlying profit before taxes 536 711 788 736 1,135 1,068 1,211 1,198 2,772 4,612
Underlying consolidated profit 399 481 544 575 713 689 747 738 1,999 2,887
Underlying attributable profit 359 429 488 510 634 610 659 642 1,786 2,544
Net capital gains and provisions — — — — — — — — — —
Attributable profit 359 429 488 510 634 610 659 642 1,786 2,544

90
BrazilR$ million
1Q 16 2Q 16 3Q 16 4Q 16 1Q 17 2Q 17 3Q 17 4Q 17 2016 2017
NII + Fee income 10,161 10,216 10,500 11,271 11,561 12,036 12,567 13,139 42,147 49,304
Gross income 10,227 10,708 11,067 11,364 12,438 12,367 13,129 13,367 43,366 51,301
Operating expenses (4,068) (4,138) (4,266) (4,671) (4,397) (4,355) (4,613) (4,895) (17,143) (18,259)
Net operating income 6,159 6,570 6,801 6,693 8,041 8,013 8,516 8,472 26,223 33,042
Net loan-loss provisions (3,093) (2,972) (3,473) (3,398) (3,045) (3,008) (3,045) (3,105) (12,937) (12,203)
Other (762) (763) (457) (686) (1,198) (1,231) (1,007) (825) (2,668) (4,261)
Underlying profit before taxes 2,304 2,835 2,870 2,609 3,798 3,773 4,464 4,543 10,619 16,578
Underlying consolidated profit 1,716 1,908 1,979 2,055 2,386 2,431 2,757 2,802 7,658 10,376
Underlying attributable profit 1,540 1,704 1,774 1,821 2,121 2,152 2,432 2,438 6,840 9,143
Net capital gains and provisions — — — — — — — — — —
Attributable profit 1,540 1,704 1,774 1,821 2,121 2,152 2,432 2,438 6,840 9,143

91
Mexico€ million
1Q 16 2Q 16 3Q 16 4Q 16 1Q 17 2Q 17 3Q 17 4Q 17 2016 2017
NII + Fee income 767 768 767 794 804 856 879 811 3,096 3,350
Gross income 792 786 796 828 824 914 892 830 3,203 3,460
Operating expenses (322) (317) (311) (325) (319) (361) (356) (345) (1,274) (1,382)
Net operating income 470 469 486 503 505 553 536 485 1,928 2,078
Net loan-loss provisions (221) (214) (194) (203) (233) (246) (240) (187) (832) (905)
Other (6) (11) (5) (8) (4) (6) (4) (24) (30) (39)
Underlying profit before taxes 243 244 288 293 267 301 292 274 1,067 1,134
Underlying consolidated profit 187 192 223 217 211 238 231 225 820 904
Underlying attributable profit 143 146 172 169 163 187 182 178 629 710
Net capital gains and provisions — — — — — — — — — —
Attributable profit 143 146 172 169 163 187 182 178 629 710

92
MexicoMillion pesos
1Q 16 2Q 16 3Q 16 4Q 16 1Q 17 2Q 17 3Q 17 4Q 17 2016 2017
NII + Fee income 15,253 15,690 16,028 16,922 17,348 17,505 18,399 18,076 63,893 71,327
Gross income 15,745 16,054 16,647 17,645 17,779 18,706 18,677 18,508 66,093 73,671
Operating expenses (6,402) (6,479) (6,497) (6,922) (6,894) (7,386) (7,460) (7,683) (26,300) (29,423)
Net operating income 9,343 9,576 10,151 10,723 10,886 11,320 11,218 10,825 39,792 44,248
Net loan-loss provisions (4,399) (4,364) (4,062) (4,337) (5,032) (5,019) (5,015) (4,201) (17,162) (19,267)
Other (123) (233) (98) (161) (90) (131) (89) (522) (615) (832)
Underlying profit before taxes 4,821 4,979 5,990 6,225 5,764 6,170 6,113 6,102 22,015 24,149
Underlying consolidated profit 3,724 3,919 4,643 4,629 4,548 4,865 4,841 4,996 16,915 19,250
Underlying attributable profit 2,839 2,979 3,577 3,589 3,523 3,829 3,808 3,963 12,983 15,123
Net capital gains and provisions — — — — — — — — — —
Attributable profit 2,839 2,979 3,577 3,589 3,523 3,829 3,808 3,963 12,983 15,123

93
Chile€ million
1Q 16 2Q 16 3Q 16 4Q 16 1Q 17 2Q 17 3Q 17 4Q 17 2016 2017
NII + Fee income 509 534 561 613 592 589 534 583 2,216 2,298
Gross income 556 577 616 672 645 644 604 630 2,422 2,523
Operating expenses (235) (237) (249) (265) (264) (260) (253) (248) (986) (1,025)
Net operating income 321 339 368 407 381 383 351 382 1,435 1,498
Net loan-loss provisions (109) (127) (146) (131) (122) (122) (108) (110) (514) (462)
Other 1 (1) 6 (35) 2 7 11 3 (27) 23
Underlying profit before taxes 213 211 228 241 261 267 255 276 894 1,059
Underlying consolidated profit 173 181 187 195 214 218 209 218 735 859
Underlying attributable profit 122 126 129 137 147 149 143 146 513 586
Net capital gains and provisions — — — — — — — — — —
Attributable profit 122 126 129 137 147 149 143 146 513 586

94
ChileCh$ billion
1Q 16 2Q 16 3Q 16 4Q 16 1Q 17 2Q 17 3Q 17 4Q 17 2016 2017
NII + Fee income 393 409 414 441 413 430 403 434 1,657 1,681
Gross income 430 441 455 484 450 470 456 470 1,810 1,846
Operating expenses (182) (182) (184) (191) (184) (190) (191) (185) (737) (750)
Net operating income 248 260 272 293 266 280 265 285 1,073 1,096
Net loan-loss provisions (84) (98) (108) (94) (85) (89) (81) (82) (384) (338)
Other 1 (0) 5 (26) 1 5 8 2 (20) 17
Underlying profit before taxes 165 162 169 173 182 195 192 205 668 775
Underlying consolidated profit 134 138 138 140 149 159 158 163 550 629
Underlying attributable profit 94 96 95 98 103 109 108 109 384 429
Net capital gains and provisions — — — — — — — — — —
Attributable profit 94 96 95 98 103 109 108 109 384 429

95
United States (w/o Popular)€ million
1Q 16 2Q 16 3Q 16 4Q 16 1Q 17 2Q 17 3Q 17 4Q 17 2016 2017
NII + Fee income 1,831 1,755 1,724 1,708 1,763 1,738 1,545 1,495 7,019 6,540
Gross income 1,968 1,888 1,867 1,809 1,879 1,880 1,604 1,596 7,532 6,959
Operating expenses (777) (774) (784) (864) (837) (845) (743) (773) (3,198) (3,198)
Net operating income 1,191 1,114 1,083 946 1,042 1,035 861 824 4,334 3,761
Net loan-loss provisions (861) (704) (776) (867) (811) (697) (634) (638) (3,208) (2,780)
Other (66) (13) (3) (8) (32) (24) (2) (31) (90) (90)
Underlying profit before taxes 264 397 304 71 199 314 225 155 1,036 892
Underlying consolidated profit 160 253 213 54 138 235 154 109 681 636
Underlying attributable profit 82 159 141 14 95 149 93 71 395 408
Net capital gains and provisions* — — — (32) — — — (76) (32) (76)
Attributable profit 82 159 141 (19) 95 149 93 (5) 363 332
(*).- Including: in 4Q16 restatement Santander Consumer USAin 4Q 17 fiscal reform, provisions for hurricanes, increased stake in Santander Consumer USA and other

96
United States (w/o Popular)$ million
1Q 16 2Q 16 3Q 16 4Q 16 1Q 17 2Q 17 3Q 17 4Q 17 2016 2017
NII + Fee income 2,018 1,983 1,925 1,838 1,877 1,912 1,820 1,765 7,764 7,373
Gross income 2,168 2,133 2,085 1,945 2,001 2,068 1,893 1,884 8,332 7,845
Operating expenses (856) (874) (875) (932) (891) (929) (875) (909) (3,538) (3,605)
Net operating income 1,312 1,259 1,210 1,013 1,109 1,138 1,018 975 4,794 4,240
Net loan-loss provisions (949) (797) (867) (935) (863) (768) (749) (753) (3,548) (3,134)
Other (72) (16) (3) (8) (34) (27) (4) (36) (99) (101)
Underlying profit before taxes 291 446 340 69 212 343 265 186 1,146 1,006
Underlying consolidated profit 177 285 238 54 147 257 182 132 754 717
Underlying attributable profit 90 178 157 12 101 163 111 85 437 460
Net capital gains and provisions* — — — (36) — — — (85) (36) (85)
Attributable profit 90 178 157 (24) 101 163 111 (0) 401 374
(*).- Including: in 4Q16 restatement Santander Consumer USAin 4Q 17 fiscal reform, provisions for hurricanes, increased stake in Santander Consumer USA and other

98
Banco Popular€ million
1Q 16 2Q 16 3Q 16 4Q 16 1Q 17 2Q 17 3Q 17 4Q 17 2016 2017
NII + Fee income 140 584 567 1,291
Gross income 139 634 536 1,309
Operating expenses (96) (388) (390) (873)
Net operating income 43 247 146 436
Net loan-loss provisions (8) (38) (68) (114)
Other (20) 8 (8) (20)
Underlying profit before taxes 15 216 71 302
Underlying consolidated profit 11 167 85 263
Underlying attributable profit 11 168 85 263
Net capital gains and provisions* — (300) — (300)
Attributable profit 11 (132) 85 (37)
(*).- Including: in 3Q17 charges for integration costs
97
Corporate Centre€ million
1Q 16 2Q 16 3Q 16 4Q 16 1Q 17 2Q 17 3Q 17 4Q 17 2016 2017
NII + Fee income (173) (192) (201) (204) (198) (223) (227) (240) (771) (889)
Gross income (223) (244) (316) (282) (341) (340) (300) (239) (1,066) (1,220)
Operating expenses (126) (120) (104) (99) (119) (118) (118) (120) (450) (476)
Net operating income (349) (365) (421) (381) (460) (458) (419) (359) (1,516) (1,696)
Net loan-loss provisions 1 (5) 5 0 (5) (11) (22) (8) 2 (45)
Other (5) (55) (59) 44 (32) (53) (54) (43) (75) (181)
Underlying profit before taxes (353) (424) (474) (337) (497) (522) (494) (410) (1,589) (1,923)
Underlying consolidated profit (317) (418) (414) (298) (471) (561) (481) (378) (1,448) (1,890)
Underlying attributable profit (311) (418) (412) (299) (468) (563) (480) (378) (1,439) (1,889)
Net capital gains and provisions* — (186) — — — — (130) (306) (186) (436)
Attributable profit (311) (604) (412) (299) (468) (563) (610) (684) (1,625) (2,326)
(*).- Including: in 2Q16 capital gains from the disposal of the stake in Visa Europe, and restructuring costsin 3Q17 equity stakes and intangible assetsin 4Q17 goodwill charges

99
Glossary

100
Glossary - Acronyms
AFS: Available for sale
Bn: Billion
CET1: Common equity tier 1
C&I: Commercial and Industrial
DGF: Deposit guarantee fund
FL: Fully-loaded
EPS: Earning per share
GoFT: Gains on financial transactions
LTV: Loan to Value
LLPs: Loan-loss provisions
MXN: Mexican Pesos
NII: Net interest income
NIM: Net interest margin
NPL: Non-performing loans
n.m.: Non meaningful
PBT: Profit before tax
P&L: Profit and loss
RoRWA: Return on risk-weighted assets
RWA: Risk-weighted assets
RoTE: Return on tangible equity
SCF: Santander Consumer Finance
SC USA: Santander Consumer USA
SGCB: Santander Global Corporate Banking
SMEs: Small and Medium Enterprises
SRF: Single Resolution Fund
ST: Short term
SVR: Standard variable rate
TNAV: Tangible net asset value
UF: Unidad de fomento (Chile)
y-o-y: Year on Year
UK: United Kingdom
US: United States

Thank you
Our purpose is to help people and businesses prosper.
Our culture is based on the belief that everything we do should be