303593 Barings Global Investment Funds 2 Layout 1 · 2020-03-09 · 4 Barings Global Investment...
88
Barings Global Investment Funds 2 Plc Annual Report and Audited Financial Statements for the financial year ended 31 December 2018 Registered Number: 529930
Transcript of 303593 Barings Global Investment Funds 2 Layout 1 · 2020-03-09 · 4 Barings Global Investment...
Barings Global Investment Funds 2 Plc
Annual Report and Audited Financial Statementsfor the financial year ended 31 December 2018
Registered Number: 529930

Barings Global Investment Funds 2 Plc
Contents
Page
Directors and Other Information 2
Directors’ Report 3
Statement of Directors’ Responsibilities 8
Custodian’s Report to the Shareholders 9
Independent Auditor’s Report 10
Investment Managers’ Reports 14
Statements of Comprehensive Income 20
Statements of Financial Position 22
Statements of Changes in Net Assets Attributable to Holders of Redeemable Shares 24
Statements of Cash Flows 26
Notes to the Financial Statements 28
Schedule of Investments (Unaudited)Barings Global High Yield Credit Strategies Fund 71Barings Investment Grade CLO Fund 75Global Multi-Credit Strategy Fund 3 80
Significant Changes in Portfolio Composition (Unaudited) 81
Disclosure of Remuneration (Unaudited) 85
Appendix - Total Expense and Performance Data (Unaudited) 86
Barings Global Investment Funds 2 Plc 1

Barings Global Investment Funds 2 Plc
Directors and Other Information
DirectorsMr. Peter Clark (UK resident, UK national)Mr. James Cleary (Irish resident, Irish national)*Mr. Timothy Schulze (US resident, US national)Ms. Barbara Healy (Irish resident, Irish national)*Mr. Julian Swayne (UK resident, UK national)Mr. David Conway (Irish resident, Irish national)*
Registered Office70 Sir John Rogerson’s QuayDublin2D02 R296Ireland
Investment Manager**Barings LLC300 S. Tryon StreetSuite 2500CharlotteNorth Carolina 28202United States
Sub-Investment ManagerBarings (U.K.) Limited20 Old BaileyLondon EC4M 7BFUnited Kingdom
CustodianState Street Custodial Services (Ireland) Limited78 Sir John Rogerson’s QuayDublin 2D02 HD32Ireland
Administrator, Registrar and Transfer AgentState Street Fund Services (Ireland) Limited78 Sir John Rogerson’s QuayDublin 2D02 HD32Ireland
DistributorsBarings (U.K.) Limited20 Old BaileyLondon EC4M 7BFUnited Kingdom
Barings Australia Pty LimitedLevel 22, Grosvenor Place225 George StreetSydney NSW 2000Australia
Barings Securities LLCIndependence Wharf470 Atlantic AvenueBoston, MA 022210United States
Distributors (continued)Baring Asset Management Limited20 Old BaileyLondon EC4M 7BFUnited Kingdom
Baring International Fund Managers (Ireland) Limited70 Sir John Rogerson's QuayDublin 2D02 R296Ireland
Baring SICE (Taiwan) Limited21st Floor, No. 333, Sec. 1 Keelung RoadTaipei 11012, TaiwanRepublic of China
Baring France SAS10, rue des Pyramides75001 ParisFrance
Baring Asset Management GmbHUlmenstraße 37-3960325 Frankfurt am MainGermany
Baring Asset Management Switzerland S.à r.l.Rue du Marché 281204 GenevaSwitzerland
Baring Asset Management (Japan) Limited12/F Sanno Park Tower2-11-1 Nagata-cho, Chiyoka-KuTokyo 100-6166Japan
Baring Asset Management (Asia) Limited35/F Gloucester Tower15 Queen’s Road CentralHong Kong
Independent AuditorKPMGChartered Accountants and Statutory Audit Firm1 Harbourmaster PlaceInternational Financial Services CentreDublin 1D01 F6F5Ireland
Legal AdvisersMatheson70 Sir John Rogerson’s QuayDublin 2D02 R296Ireland
Sponsoring Broker and Company SecretaryMatsack Trust Limited70 Sir John Rogerson’s QuayDublin 2D02 R296Ireland
Barings Global Investment Funds 2 Plc 2
**Independent Directors**Barings Global Investment Funds 2 Plc is not an Authorised Alternative Investment Fund under the Alternative Investment Fund Managers Directive (Directive
2011/01/EU) “AIFMD”.
Barings Global Investment Funds 2 Plc 3
The Directors present to the shareholders their annual report together with the audited financial statements for the financial yearended 31 December 2018.
The Company
Barings Global Investment Funds 2 Plc (the “Company”) is an open-ended investment company with variable capital organisedunder the laws of Ireland as a public limited company pursuant to the Companies Act 2014, (the “Companies Act”). TheCompany was incorporated on 8 July 2013 under registration number 529930. Accordingly, the Company is supervised by theCentral Bank of Ireland (the “Central Bank”).
The Company is structured in the form of an umbrella fund with segregated liability between funds. The Company may offerseparate funds and each fund will have a distinct portfolio of investments. As at 31 December 2018, the Company had threeactive funds, Barings Global High Yield Credit Strategies Fund, Barings Investment Grade CLO Fund and Global Multi-CreditStrategy Fund 3 (together the “Funds”).
The investments (except forward foreign exchange contracts as listed in the Schedule of Investments) of Barings Global HighYield Credit Strategies Fund and Global Multi-Credit Strategy Fund 3 are held through wholly owned subsidiaries, BaringsGlobal High Yield Credit Strategies Limited and Barings Global Multi-Credit Strategy 3 Limited respectively (the “Subsidiary” orthe “Subsidiaries”). The Subsidiaries are incorporated and tax resident in Ireland. Barings Investment Grade CLO Fund holdsits investments directly.
As per the Prospectus, the Company’s financial statements are presented in United States Dollars (“US$”), while the Funds’financial statements are presented in accordance with the functional currencies as set out in the Supplements which are PoundSterling ("GBP") for Global Multi-Credit Strategy Fund 3 and US$ for Barings Global High Yield Credit Strategies Fund and forBarings Investment Grade CLO Fund.
Details of the Company as at 31 December 2018 are as follows:
Functional Active Share
Fund Name Subsidiary Name Currency Class
Barings Global High Yield Credit Strategies Fund Barings Global High Yield Credit Strategies Limited United States Dollar 25*Barings Investment Grade CLO Fund n/a United States Dollar 9*Global Multi-Credit Strategy Fund 3 Barings Global Multi-Credit Strategy 3 Limited Pound Sterling 1
*These share classes were listed on the Global Exchange Market of Euronext Dublin as at 31 December 2018. In March 2018, Euronext completed the purchase of the*Irish Stock Exchange (“ISE”) and renamed the ISE as Euronext Dublin.
Investment objectives
Barings Global High Yield Credit Strategies Fund
The investment objective of the Fund is to achieve current income, and where appropriate, capital appreciation. The Fund willseek to achieve its objective by investing primarily in a portfolio of high yield fixed and floating rate corporate debt instrumentsissued by North American and European companies (including those debt instruments issued by issuing entities based inoffshore centres, such as the Channel Islands, Cayman Islands, Bermuda and other offshore jurisdictions).
Barings Investment Grade CLO Fund
The investment objective of the Fund is to achieve current income, and where appropriate, capital appreciation. The Fund willseek to achieve its objective by investing primarily in a portfolio of debt tranches of cash flow collateralised loan obligations(“CLOs”). CLOs are securitisations issued by bankruptcy-remote, special purpose investment vehicles that are formed toacquire and manage, and are collateralised primarily by, corporate loans that are senior in the underlying obligor’s capitalstructure to other debt issued. The Fund will seek to invest in debt tranches issued by both US and European CLOs. Themajority of the US CLOs have issuers domiciled in the Cayman Islands, with a United States domiciled co-issuer. The majorityof the European CLOs have issues domiciled in EU countries, typically Ireland, Netherlands and Luxembourg.
Global Multi-Credit Strategy Fund 3
The investment objective of the Fund is to achieve current income, and where appropriate, capital appreciation. The Fund willseek to achieve its objective by investing principally in a portfolio of high yield fixed and floating rate corporate debtinstruments, focused on instruments issued by North American and European companies (including those debt instrumentsissued by issuing entities based in offshore centres, such as the Channel Islands, Cayman Islands, Bermuda, and otheroffshore jurisdictions). The Fund will also invest in structured credit products and securitised assets, including debt and equitytranches of collateralised loan obligations and mortgage backed securities, as well as asset backed securities.
Barings Global Investment Funds 2 Plc
Barings Global Investment Funds 2 Plc
Directors’ Reportfor the financial year ended 31 December 2018

Barings Global Investment Funds 2 Plc 4 Barings Global Investment Funds 2 Plc
Business review and future developments
The net assets of the Company attributable to holders of redeemable shares amounted to US$3,607,456,062 (31 December2017: US$3,068,340,409). The Statement of Comprehensive Income is set out on pages 20 and 21. A detailed review of thebusiness and future developments is contained in the Investment Manager’s Report on pages 14 to 19. The Directors do notanticipate any change in the structure or investment objective of the Company.
Brexit
Whilst the medium to long-term consequences of the decision to leave the EU remain uncertain in any scenario, there could beshort-term volatility which could have a negative impact on general economic conditions, business and consumer confidencein both the UK and EU, which may in turn have negative political, economic and market impacts more widely. The longer-termconsequences may be affected by the terms of any future arrangements the UK has with the remaining member states of theEU27. Among other things, the UK's decision to leave the EU could lead to changes in the law and tax treatment of funds,instability in the equity, debt and foreign exchange markets, including volatility in the value of the pound sterling or the euro.
Directors
The Directors who served during the financial year were:Mr. Peter ClarkMr. James ClearyMr. Timothy SchulzeMs. Barbara HealyMr. Julian SwayneMr. David Conway
Company Secretary
Matsack Trust Limited acted as Company Secretary for the financial year.
Directors’ and Secretary’s interest
Neither the Directors nor the Secretary held any shares in the Company.
Mr. Peter Clark and Mr. Julian Swayne are managing directors of the Sub-Investment Manager. Mr. Timothy Schulze is amanaging director of the Investment Manager.
Mr. James Cleary, Ms. Barbara Healy and Mr. David Conway are also Directors of the Subsidiaries.
Risk management objectives and policies
The principal risks and uncertainties facing the Company are market risk, credit risk and liquidity risk. The Company hasmaintained its aim of spreading investment risk.
These are explained in Note 11 of the financial statements along with the risk management framework in place to mitigate theserisks.
Distributions
Barings Global High Yield Credit Strategies Fund declared distributions during the financial year ended 31 December 2018amounting to US$31,807,955 (31 December 2017: US$15,583,905).
Barings Investment Grade CLO Fund declared distributions during the financial year ended 31 December 2018 amounting toUS$6,735,198 (31 December 2017: US$5,746,607).
Global Multi-Credit Strategy Fund 3 declared no distributions during the financial year ended 31 December 2018 (31 December2017: Nil).
Please see Note 14 for further details.
Significant events during the financial year
Please see Note 22.
Significant events after the financial year end
Please see Note 23.
Barings Global Investment Funds 2 Plc
Directors’ Reportfor the financial year ended 31 December 2018 (continued)
Barings Global Investment Funds 2 Plc 5
Barings Global Investment Funds 2 Plc
Directors’ Reportfor the financial year ended 31 December 2018 (continued)
Accounting records
The Directors ensure compliance with the Company’s obligation to maintain adequate accounting records by appointingcompetent persons to be responsible for them. The accounting records are kept by State Street Fund Services (Ireland) Limited,at 78 Sir John Rogerson’s Quay, Dublin D02 HD32, Ireland.
Corporate Governance Statement
General Principles
The Company is subject to compliance with the requirements of the Companies Act. The Irish Funds (“IF”) in consultation withthe Central Bank has published a corporate governance code (the “IF Code”) that may be adopted on a voluntary basis byIrish authorised collective investment schemes. The Directors voluntarily adopted the IF Code. The Board has reviewed andassessed the measures included in the IF Code and considers its corporate governance practices and procedures since theadoption of the IF Code to 31 December 2018, as consistent therewith.
Although there is no specific statutory corporate governance code applicable to Irish collective investment schemes whoseshares are admitted to trading on Euronext Dublin, the Company is subject to corporate governance practices imposed by;
(i) The Companies Act which is available for inspection at the registered office of the Company; and may also be obtained at:-http://www.irishstatutebook.ie/home.html;
(ii) The Articles of Association of the Company which are available for inspection at the registered office of the Company at 70Sir John Rogerson’s Quay, Dublin D02 R296, Ireland and at the Companies Registration Office in Ireland; and
(iii) Euronext Dublin through the Euronext Dublin Code of Listing Requirements and Procedures which can be obtained fromthe Euronext Dublin’s website at: https://www.ise.ie/Products-Services/Investment%20Funds/List-a-Fund/#fundlistingrules
The Company has assessed the measures included in the voluntary Corporate Governance Code for Collective InvestmentSchemes as published by the Irish Funds in December 2011 (the “IF Code”). The Board has adopted the corporate governancepractices and procedures in the IF Code with effect from 1 January 2013. The Board considers that the Company has compliedwith the main provisions contained in the IF Code from the date of adoption to 31 December 2018.
The Company is not subject to the European Communities (Takeover Bids (Directive 2004/25/EC)) Regulations 2006.
Internal Control and Risk Management Systems in Relation to Financial Reporting
The Board is ultimately responsible for establishing and maintaining adequate internal control and risk management systemsof the Company in relation to the financial reporting process. Such systems are designed to manage rather than eliminate therisk of error or fraud in achieving the Company’s financial reporting objectives and can only provide reasonable and notabsolute assurance against material misstatement or loss.
The Board has procedures in place to ensure that all relevant books of account are properly maintained and are readilyavailable; including the production of annual financial statements. The Board has appointed the Administrator (who isindependent from the Board and the Investment Managers) to maintain the books and records of the Company. TheAdministrator is authorised and regulated by the Central Bank and must comply with the rules imposed by the Central Bank.From time to time, the Board examines and evaluates the Administrator’s financial accounting and reporting routines. Theannual financial statements are produced by the Administrator and reviewed by the Investment Managers. They are requiredto be approved by the Board and the annual financial statements are required to be filed with the Central Bank and EuronextDublin.
The financial statements are prepared by the Administrator in compliance with International Financial Reporting Standards(“IFRS”) as adopted in the EU, and the Administrator uses various internal controls and checklists to ensure that the financialstatements include complete and appropriate disclosures required under IFRS and relevant legislation.
The Board was responsible for the review and approval of the annual financial statements as set out in the Statement ofDirectors’ Responsibilities. The statutory financial statements are required to be audited by independent auditors who reportannually to the Board on their findings. The Board evaluates and discusses significant accounting and reporting issues as theneed arises.
Barings Global Investment Funds 2 Plc 6
Barings Global Investment Funds 2 Plc
Directors’ Reportfor the financial year ended 31 December 2018 (continued)
Corporate Governance Statement (continued)
Dealings with shareholders
The convening and conduct of shareholders’ meetings are governed by the Articles of Association of the Company and theCompanies Act. Although the Board may convene an extraordinary general meeting of the Company at any time, the Boardwas required to convene the first annual general meeting of the Company within eighteen months of incorporation and fifteenmonths of the date of the previous annual general meeting thereafter, provided that an annual general meeting is held once ineach year within six months of the end of each accounting period of the Company.
At least twenty-one clear days’ notice of every annual general meeting and any meeting convened for the passing of a specialresolution must be given to shareholders and fourteen days’ notice must be given in the case of any other general meeting.Two shareholders holding voting shares present either in person or by proxy constitutes a quorum at a general meeting. TheIrish Companies Act and the Articles of Association provide that the quorum for a general meeting convened to consider anyalteration to the rights attached to any class of shares, is two or more shareholders present in person or by proxy, holding orrepresenting by proxy at least one third of the issued shares of the relevant class.
Each shareholder is entitled to such number of votes as shall be produced by dividing the aggregate NAV of the shareholder’sshareholding by one. The Subscriber shareholders have one vote for each Subscriber share held. On a poll, every shareholderpresent, in person or by proxy, is entitled to one vote in respect of each share held by him. At any general meeting, a resolutionput to the vote of the meeting is decided on a show of hands unless, a resolution is not passed unanimously on such show ofhands, in which case such resolution shall be decided on a poll.
Board composition and activities
In accordance with the Companies Act and the Articles of Association, unless otherwise determined by an ordinary resolutionof the Company in general meeting, the number of Directors may not be less than two. Currently, the Board is comprised of sixnon-executive Directors, three of whom are independent. Details of the current Directors, including details of the independentDirectors, are set out on page 2.
The business of the Company is managed by the Directors, who exercise all such powers of the Company as are not, by theCompanies Act, 2014 or by the Articles of Association of the Company, required to be exercised by the Company in generalmeeting.
A Director may, and the Company Secretary on the requisition of a Director will, at any time summon a meeting of the Directorsin addition to the four meetings that are convened as required.
In the case of an equality of votes, the Chairman of the meeting at which the show of hands takes place or at which the poll isdemanded shall be entitled to a second or casting vote. The quorum necessary for the transaction of business at a meeting ofthe Directors is two. There were no sub-committees of the Board in operation during the year or at the year end.
Connected persons transactions
The Central Bank of Ireland Non-UCITS Notices, NU 2.10 – ‘Dealings by promoter, manager, partner, custodian, investmentadviser and group companies’ states in paragraph one that any transaction carried out with a collective investment scheme bya promoter, manager, partner custodian, investment adviser and/or associated or group companies of these (“connectedpersons”) must be carried out as if negotiated at arm’s length. Transactions must be in the best interests of the shareholders.
The Board of Directors are satisfied that there are arrangements (evidenced by written procedures) in place, to ensure that theobligations set out in paragraph one of NU 2.10 are applied to all transactions with connected parties; and the Board is satisfiedthat transactions with connected persons entered into during the year complied with the obligations set out in this paragraph.
Independent auditor
The Auditors, KPMG, Chartered Accountants, (the "Auditors"), have expressed their willingness to continue in office inaccordance with Section 383(2) of the Companies Act, 2014.
Relevant audit information
As at the date this Directors' Report was approved and signed (set out below), each Director is satisfied that:(a) there is no relevant audit information of which the Company’s statutory auditors are unaware;(b) she or he has taken all the steps that she or he ought to have taken as a Director in order to make herself or himself aware
of any relevant audit information and to establish that the Company’s statutory auditors are aware of that information; and(c) where “relevant audit information” means information needed by the Company’s statutory auditors in connection with
preparing their report.


Barings Global Investment Funds 2 Plc 10
Barings Global Investment Funds 2 Plc
Independent Auditor’s Report to the Members of Barings Global Investment Fund 2 Plcfor the financial year ended 31 December 2018
Report on the audit of the financial statements
1 Opinion
We have audited the financial statements of Barings Global Investment Funds 2 plc (‘the Company’) for the ended 31 December2018, which comprise the Statements of Comprehensive Income, Statements of Financial Position, Statements of Changes inNet Assets Attributable to Holders of Redeemable Participating Shares, Statements of Cash Flows and the related notes,including the summary of significant accounting policies set out in note 2. The financial reporting framework that has beenapplied in their preparation is Irish Law and International Financial Reporting Standards (IFRS) as adopted by the EuropeanUnion.
In our opinion, the accompanying financial statements:
• give a true and fair view of the assets, liabilities and financial position of the Company as at 31 December 2018 andof its changes in net assets attributable to holders of redeemable participating shares for the year then ended;
• have been properly prepared in accordance with IFRS as adopted by the European Union; and• have been properly prepared in accordance with the requirements of the Companies Act 2014.
Basis for opinion
We conducted our audit in accordance with International Standards on Auditing (Ireland) (ISAs (Ireland)) and applicable law.Our responsibilities under those standards are further described in the Auditor's responsibilities for the audit of the financialstatements section of our report. We are independent of the Company in accordance with ethical requirements that are relevantto our audit of financial statements in Ireland, including the Ethical Standard issued by the Irish Auditing and AccountingSupervisory Authority (IAASA), and we have fulfilled our other ethical responsibilities in accordance with these requirements.
We believe that the audit evidence we have obtained is sufficient and appropriate to provide a basis for our opinion.
2 Key audit matters: our assessment of risks of material misstatement
Key audit matters are those matters that, in our professional judgment, were of most significance in the audit of the financialstatements and include the most significant assessed risks of material misstatement (whether or not due to fraud) identified byus, including those which had the greatest effect on: the overall audit strategy; the allocation of resources in the audit; anddirecting the efforts of the engagement team. These matters were addressed in the context of our audit of the financialstatements as a whole, and in forming our opinion thereon, and we do not provide a separate opinion on these matters.
Barings Global Investment Funds 2 Plc 11
Barings Global Investment Funds 2 Plc
Independent Auditor’s Report to the Members of Barings Global Investment Fund 2 Plcfor the financial year ended 31 December 2018 (continued)
2 Key audit matters: our assessment of risks of material misstatement (continued)
In arriving at our audit opinion above, the key audit matter was as follows:
Valuation of Investments US$3,605,727,545 (2017 - US$3,083,086,998)
Refer to Note 2(d) accounting policy and Note 10 and Note 11 (financial disclosures)
The key audit matter
The Company’s financial instrument portfolio comprises ofinvestments in Subsidiaries, forward currency contracts andinvestments in collective investment schemes (“theInvestments”).
The Company’s investments in Subsidiaries form the majorityof its financial assets at fair value through profit or loss.
The carrying value of the Subsidiaries is calculated byassessing the fair value of the Subsidiaries underlyingportfolio of investments.
The Subsidiaries’ portfolio of investments comprises of loans,CLOs, equities, collective investment schemes, warrants,bonds and derivatives (including both listed and non-listedinvestments) which is the key driver of capital and revenueperformance.
There is a significant risk relating to the valuation of theInvestments given the judgemental nature of the matters thatrequire consideration by the investment manager and Boardof Directors.
How the matter was addressed in our audit
We addressed the key audit matter as follows:
• we obtained and documented our understanding ofthe investment valuation process and assessed thedesign and implementation of controls which includesinspecting the latest report on the administrator’scontrols related to the Company’s investmenttransactions issued by its auditor in accordance withISAE 3402 “Assurance Reports on Controls at aService Organisation”;
• we compared the Company’s investments in itsSubsidiaries against the balances within the auditedfinancial statements of the Subsidiaries;
• we inspected the audited financial statements of theSubsidiaries for indication of any issues that mayimpact the value of the Company’s investments inthose Subsidiaries;
• we engaged our valuation specialist team who agreedthe forward currency contracts at Company level toindependently priced sources;
• we agreed the NAV per share of the investments incollective investment schemes at Company level toindependently obtained confirmations from theadministrator of the collective investment schemes;
• we further engaged our valuation specialists team,who agreed 98.4% of the Subsidiaries’ investmentportfolio to independently sourced prices;
• for the valuation of the remaining 1.6% of theSubsidiaries’ investment portfolio:
• we agreed the NAV per share of 100% of theinvestments in collective investment schemes toindependently obtained confirmations from theadministrator of the collective investment schemes.
• there were certain unquoted investments in theportfolios as at 31 December 2018 over which theInvestment Manager was appointed as a competentperson. These securities are generally illiquid andhard to value due to there being no readily availablemarket prices and are therefore subject to valuationtechniques by the Investment Manager whichincorporate certain assumptions, judgements anduncertainties. For all these positions, we obtained thesupporting documentation from the InvestmentManager to support their pricing judgements and thisdocumentation was reviewed by the pricing specialistfor reasonableness.
• In addition, we considered the appropriateness, inaccordance with relevant accounting standards, ofthe disclosures relating to unquoted investments.
We noted no material exceptions arising from our testing.
Barings Global Investment Funds 2 Plc 12
Barings Global Investment Funds 2 Plc
Independent Auditor’s Report to the Members of Barings Global Investment Fund 2 Plcfor the financial year ended 31 December 2018 (continued)
3 Our application of materiality and an overview of the scope of our audit
Materiality for the Company financial statements as a whole was set at $36m (2017: $31m), determined with reference to abenchmark of Net Assets (of which it represents 1% (2017: 1%)).
We consider Net Assets to be the most appropriate benchmark as it is the most widely used benchmark in the funds industryand is the metric that is most important to investors, who would be one of the key users of the Company’s financial statements.Subscriptions and redemptions in and out of the fund are transacted at net asset value. Potential investors would also judgehow the Company is performing based on its net asset value.
We reported to the Board of Directors any corrected or uncorrected identified misstatements exceeding 5% of materiality ofeach individual sub-fund, in addition to other identified misstatements that warranted reporting on qualitative grounds
4 We have nothing to report on going concern
We are required to report to you if we have concluded that the use of the going concern basis of accounting is inappropriateor there is an undisclosed material uncertainty that may cast significant doubt over the use of that basis for a period of at leasttwelve months from the date of approval of the financial statements. We have nothing to report in these respects.
5 Other information
The directors are responsible for the other information presented in the Annual Report together with the financial statements.The other information comprises the information included in the directors’ report, custodian’s report, investment manager’sreport, schedule of investments, significant changes in portfolio composition and total expense and performance data. Thefinancial statements and our auditor’s report thereon do not comprise part of the other information. Our opinion on the financialstatements does not cover the other information and, accordingly, we do not express an audit opinion or, except as explicitlystated below, any form of assurance conclusion thereon.
Our responsibility is to read the other information and, in doing so, consider whether, based on our financial statements auditwork, the information therein is materially misstated or inconsistent with the financial statements or our audit knowledge. Basedsolely on that work we have not identified material misstatements in the other information.
Based solely on our work on the other information, we report that:
• we have not identified material misstatements in the directors’ report;• in our opinion, the information given in the directors’ report is consistent with the financial statements; and• in our opinion, the directors’ report has been prepared in accordance with the Companies Act 2014.
6 Our opinions on other matters prescribed the Companies Act 2014
We have obtained all the information and explanations which we consider necessary for the purposes of our audit.
In our opinion the accounting records of the Company were sufficient to permit the financial statements to be readily andproperly audited and the financial statements are in agreement with the accounting records.
7 Matters on which we are required to report by exception
The Companies Act 2014 requires us to report to you if, in our opinion, the disclosures of directors’ remuneration andtransactions required by Sections 305 to 312 of the Act are not made. We have nothing to report in this regard.
Barings Global Investment Funds 2 Plc 14
Barings Global Investment Funds 2 Plc
Investment Managers’ Reportfor the financial year ended 31 December 2018
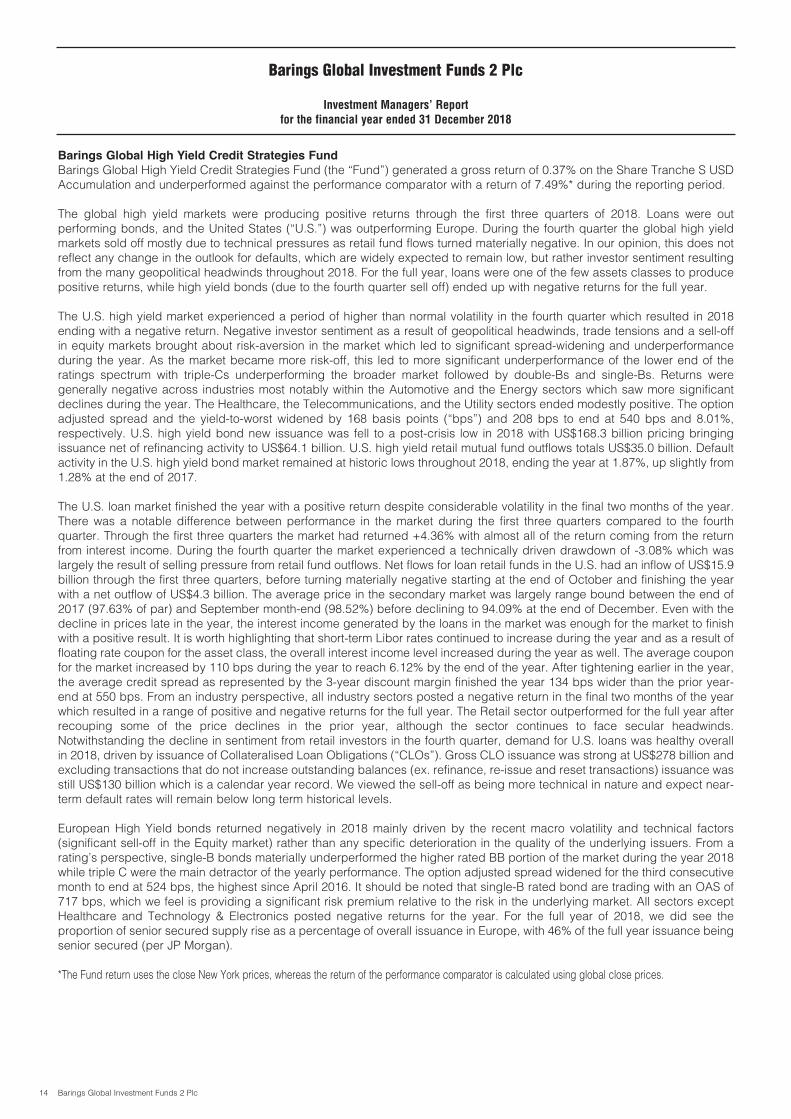
Barings Global High Yield Credit Strategies Fund
Barings Global High Yield Credit Strategies Fund (the “Fund”) generated a gross return of 0.37% on the Share Tranche S USDAccumulation and underperformed against the performance comparator with a return of 7.49%* during the reporting period.
The global high yield markets were producing positive returns through the first three quarters of 2018. Loans were outperforming bonds, and the United States (“U.S.”) was outperforming Europe. During the fourth quarter the global high yieldmarkets sold off mostly due to technical pressures as retail fund flows turned materially negative. In our opinion, this does notreflect any change in the outlook for defaults, which are widely expected to remain low, but rather investor sentiment resultingfrom the many geopolitical headwinds throughout 2018. For the full year, loans were one of the few assets classes to producepositive returns, while high yield bonds (due to the fourth quarter sell off) ended up with negative returns for the full year.
The U.S. high yield market experienced a period of higher than normal volatility in the fourth quarter which resulted in 2018ending with a negative return. Negative investor sentiment as a result of geopolitical headwinds, trade tensions and a sell-offin equity markets brought about risk-aversion in the market which led to significant spread-widening and underperformanceduring the year. As the market became more risk-off, this led to more significant underperformance of the lower end of theratings spectrum with triple-Cs underperforming the broader market followed by double-Bs and single-Bs. Returns weregenerally negative across industries most notably within the Automotive and the Energy sectors which saw more significantdeclines during the year. The Healthcare, the Telecommunications, and the Utility sectors ended modestly positive. The optionadjusted spread and the yield-to-worst widened by 168 basis points (“bps”) and 208 bps to end at 540 bps and 8.01%,respectively. U.S. high yield bond new issuance was fell to a post-crisis low in 2018 with US$168.3 billion pricing bringingissuance net of refinancing activity to US$64.1 billion. U.S. high yield retail mutual fund outflows totals US$35.0 billion. Defaultactivity in the U.S. high yield bond market remained at historic lows throughout 2018, ending the year at 1.87%, up slightly from1.28% at the end of 2017.
The U.S. loan market finished the year with a positive return despite considerable volatility in the final two months of the year.There was a notable difference between performance in the market during the first three quarters compared to the fourthquarter. Through the first three quarters the market had returned +4.36% with almost all of the return coming from the returnfrom interest income. During the fourth quarter the market experienced a technically driven drawdown of -3.08% which waslargely the result of selling pressure from retail fund outflows. Net flows for loan retail funds in the U.S. had an inflow of US$15.9billion through the first three quarters, before turning materially negative starting at the end of October and finishing the yearwith a net outflow of US$4.3 billion. The average price in the secondary market was largely range bound between the end of2017 (97.63% of par) and September month-end (98.52%) before declining to 94.09% at the end of December. Even with thedecline in prices late in the year, the interest income generated by the loans in the market was enough for the market to finishwith a positive result. It is worth highlighting that short-term Libor rates continued to increase during the year and as a result offloating rate coupon for the asset class, the overall interest income level increased during the year as well. The average couponfor the market increased by 110 bps during the year to reach 6.12% by the end of the year. After tightening earlier in the year,the average credit spread as represented by the 3-year discount margin finished the year 134 bps wider than the prior year-end at 550 bps. From an industry perspective, all industry sectors posted a negative return in the final two months of the yearwhich resulted in a range of positive and negative returns for the full year. The Retail sector outperformed for the full year afterrecouping some of the price declines in the prior year, although the sector continues to face secular headwinds.Notwithstanding the decline in sentiment from retail investors in the fourth quarter, demand for U.S. loans was healthy overallin 2018, driven by issuance of Collateralised Loan Obligations (“CLOs”). Gross CLO issuance was strong at US$278 billion andexcluding transactions that do not increase outstanding balances (ex. refinance, re-issue and reset transactions) issuance wasstill US$130 billion which is a calendar year record. We viewed the sell-off as being more technical in nature and expect near-term default rates will remain below long term historical levels.
European High Yield bonds returned negatively in 2018 mainly driven by the recent macro volatility and technical factors(significant sell-off in the Equity market) rather than any specific deterioration in the quality of the underlying issuers. From arating’s perspective, single-B bonds materially underperformed the higher rated BB portion of the market during the year 2018while triple C were the main detractor of the yearly performance. The option adjusted spread widened for the third consecutivemonth to end at 524 bps, the highest since April 2016. It should be noted that single-B rated bond are trading with an OAS of717 bps, which we feel is providing a significant risk premium relative to the risk in the underlying market. All sectors exceptHealthcare and Technology & Electronics posted negative returns for the year. For the full year of 2018, we did see theproportion of senior secured supply rise as a percentage of overall issuance in Europe, with 46% of the full year issuance beingsenior secured (per JP Morgan).
*The Fund return uses the close New York prices, whereas the return of the performance comparator is calculated using global close prices.

Barings Global Investment Funds 2 Plc 15
Barings Global Investment Funds 2 Plc
Investment Managers’ Reportfor the financial year ended 31 December 2018 (continued)
Barings Global High Yield Credit Strategies Fund (continued)
The European loan market held up better than many other risk asset classes in face of broader market volatility in 2018. Withthe majority of risk asset classes producing negative returns in 2018, European loans were one of the few asset classes thatactually generated a positive return over the year. Performance across industries was generally positive while some notablelaggards such as Consumer Durables and Retail detracted the overall return. CLO activity was muted through December, asthe volatility and sell-off across the wider high yield markets also had an impact on structured credit markets. Rapidly wideningCLO liability spreads will most likely result in a temporary pause of new CLO issuance due to challenged arbitrage, albeit overthe medium term we would expect the yields/spreads on both assets and liabilities to stabilise. It is worth noting that volumesdo typically reduce throughout December and it is difficult to infer market movements in the month into longer term trends. Froma sponsor-backed perspective, the activity in the European loan market hit €76.4bn from 157 deals in 2018 versus €78.95bnfrom 205 deals recorded in 2017.
The Fund underperformed its benchmark in 2018. Since its inception in May 2013, the Fund has underperformed itsbenchmark.
Barings LLC
Barings (U.K.) Limited
April 2019

Barings Global Investment Funds 2 Plc 16
Barings Global Investment Funds 2 Plc
Investment Managers’ Reportfor the financial year ended 31 December 2018 (continued)
Barings Investment Grade CLO Fund
Barings Investment Grade CLO Fund (the “Fund”) generated a gross return of 0.82% on the Share Tranche A USD Accumulation.
Markets
The fourth quarter of 2018 will be remembered as a test of credit market liquidity amid a storm of whirling macroeconomicforces. These forces drove a broad sell off in equity and credit markets over the last two months of the year. Monetary policychanges by the US Federal Reserve (the “FED”), international trade confrontations induced by President Trump, increasingBrexit-related risk and fears of recession exacerbated by headlines about loose lending terms in corporate credit markets werethe strongest forces in the storm. The sell-off was most pronounced in December as we came to the close of a very busy year.Despite the steep sell-off across risk assets, most of the fundamental economic data remained strong. Apart from someweakness is US housing, employment and wage numbers were strong, corporate and household balance sheets remainedsolid, loan defaults were at 14 month lows (1.63%) and leading economic indicators still signaled expansion.
Both the Dow Jones Industrial Average (“DJIA”) and S&P 500 index gave back all positive returns for the year and ended 2018in negative territory. The DJIA ended the year at 23,327, down 5.63% for the full year 2018. The S&P 500 ended the year at2,507, down 6.25% for the full year 2018. In the treasury market, yields compressed as investors looked for a port in the storm.The benchmark 10 year treasury began October yielding 3.06% and ended the fourth quarter yielding 2.69%. Finally, 3-monthLibor ended 2018 at 2.81% on the heels of rate hikes, up from 1.69% at the end of 2017.
The BAML High Yield index gapped wider to yield 8.01% at December year end verses 6.15% at the end of 2017. Pricemovements were heightened by outflows of over US$20 billion from high yield bond funds over the last quarter of the year. Afterholding in for most of the fourth quarter, loans prices took a dive over the last few weeks of the year. The S&P Leverage Loan100 Index ended the year at 93.72% with spreads widening to 526.33 bps. The changing expectations for 2019 FED rateincreases as well as late credit cycle risk aversion drove the redemptions primarily from retail mutual funds. Also, manymanagers sold extra loans in early December to fund expected redemptions later in the month, when they knew liquidityconditions would be at their worst, given the holiday period. Indeed, in the first few days of 2019 we have seen stability return.Despite the backdrop of bleeding markets, the U.S. leveraged loan default rate ended the year at 1.63%, down 2.0% to startthe year. Defaults for the 4th quarter were largely concentrated within the retail sector and included: Mattress Firm, DixieElectric, Sears Holdings, Full Beauty Brands, David’s Bridal and Catalina Marketing.
CLO Performance
CLO spreads gapped wider as bank loan prices fell and bid/ask spreads widened as the calendar counted down and manymarket participants stepped back with a few sticking around to prey on any forced sellers. For most of 2018, CLO spreadmovements were largely range-bound and driven by the new issue and refinancing supply calendar. However, the general risk-off sentiment in the markets exacerbated by significant outflows in the loan market during the fourth quarter (and December inparticular) caused CLO spreads to gap wider even as new issue supply fell. According to Nomura, AAA-rated tranche spreadsin the US secondary market widened by 20 bps over the quarter. AA-rated tranches, single-A rated tranches, and BBB-ratedtranches widened by 55 bps, 80 bps and 85 bps, respectively. It is not surprising that BB-rated tranches (which are leveragedexposure to leveraged loans) sold off the most with a widening of 195 bps. The market had not experienced a price movementof this proportion since the energy crisis of 2015 and 2016. Given that the last two weeks of December are perhaps the poorestfor liquidity, given the holidays, we expect prices to bounce back as the market searches for the new clearing levels for newissue CLOs and the new supply calendar builds. Overall, we expect the “buyer’s market” conditions to continue but with morevariety as both the secondary and new issue markets should provide attractive opportunities.
Despite the volatility, the trend of strong new issue and refinanced CLO volumes held through November and the year endedwith a second straight year of record volumes. 56 new CLOs priced in the US and 16 in Europe for a total of US$35.6 billion forthe 4th quarter. Excluding refinancing, true new issuance totaled 243 US CLOs for US$129.7 billion and 65 new EUR CLOs forUS$31.8 billion. These are record volume numbers for both the US and Europe. Further, 106 different US CLO managers (40in Europe) priced transactions during 2018 which is higher than the 99 that came to market in 2017. The CLO managers withthe most issuance according to Creditflux were: GSO, PGIM, CSAM and CIFC.
Given the spread widening experienced at the end of the year, CLOs had their worst quarter of performance in over two years.Most of the negative return contributions came in December and were driven by mezzanine tranches: BBB–rated tranchesreturned -3.91% for the month, BB-rated tranches returned -3.84% and single-B rated tranches returned -5.67%. Even with thenegative performance in the fourth quarter, CLOs outperformed other fixed income sectors for full year 2018. The return on theTotal CLOIE was 1.27% for the year compared to -2.97% for Global Corps, -2.92% for Investment Grade Corps, -3.01% for HYand 0.95% for Securitized according to JP Morgan. CLO performance for the year was led by the single-B tranche at 2.93%,followed by the AAA tranche at 1.66%.

Barings Global Investment Funds 2 Plc 17
Barings Global Investment Funds 2 Plc
Investment Managers’ Reportfor the financial year ended 31 December 2018 (continued)
Barings Investment Grade CLO Fund (continued)
Outlook
Looking ahead, we are expecting a healthy new supply pipeline given the number of CLO transactions delayed until 2019, aswell as the number of new warehouses created to take advantage of lower loan prices. The supply could keep pressure onspreads in the first quarter with the longer term outlook still subject to macroeconomic trends, particularly the FED monetarypolicy changes, stricter US trade policies and Brexit. The direction of the markets will largely be driven by the outcome of theseissues and their impact on global growth.
Barings LLC
Barings (U.K.) Limited
April 2019

Barings Global Investment Funds 2 Plc 18
Barings Global Investment Funds 2 Plc
Investment Managers’ Reportfor the financial year ended 31 December 2018 (continued)
Global Multi-Credit Strategy Fund 3
Global Multi-Credit Strategy Fund 3 (the “Fund”) generated a gross return of -1.77% on the Share Tranche T GBP Accumulationand underperformed against the performance comparator with a return of 5.79%* during the reporting period.
The global high yield markets were producing positive returns through the first three quarters of 2018. Loans were outperforming bonds, and the U.S. was outperforming Europe. During the fourth quarter the global high yield markets sold offmostly due to technical pressures as retail fund flows turned materially negative. In our opinion, this does not reflect any changein the outlook for defaults, which are widely expected to remain low, but rather investor sentiment resulting from the manygeopolitical headwinds throughout 2018. For the full year, loans were one of the few assets classes to produce positive returns,while high yield bonds (due to the fourth quarter sell off) ended up with negative returns for the full year.
The U.S. high yield market experienced a period of higher than normal volatility in the fourth quarter which resulted in 2018ending with a negative return. Negative investor sentiment as a result of geopolitical headwinds, trade tensions and a sell-offin equity markets brought about risk-aversion in the market which led to significant spread-widening and underperformanceduring the year. As the market became more risk-off, this led to more significant underperformance of the lower end of theratings spectrum with triple-Cs underperforming the broader market followed by double-Bs and single-Bs. Returns weregenerally negative across industries most notably within the Automotive and the Energy sectors which saw more significantdeclines during the year. The Healthcare, the Telecommunications, and the Utility sectors ended modestly positive. The optionadjusted spread and the yield-to-worst widened by 168 bps and 208 bps to end at 540 bps and 8.01%, respectively. U.S. highyield bond new issuance fell to a post-crisis low in 2018 with US$168.3 billion pricing bringing issuance net of refinancingactivity to US$64.1 billion. U.S. high yield retail mutual fund outflows totals US$35.0 billion. Default activity in the U.S. high yieldbond market remained at historic lows throughout 2018, ending the year at 1.87%, up slightly from 1.28% at the end of 2017.
The U.S. loan market finished the year with a positive return despite considerable volatility in the final two months of the year.There was a notable difference between performance in the market during the first three quarters compared to the fourthquarter. Through the first three quarters the market had returned +4.36% with almost all of the return coming from the returnfrom interest income. During the fourth quarter the market experienced a technically driven drawdown of -3.08% which waslargely the result of selling pressure from retail fund outflows. Net flows for loan retail funds in the U.S. had an inflow of US$15.9billion through the first three quarters, before turning materially negative starting at the end of October and finishing the yearwith a net outflow of US$4.3 billion. The average price in the secondary market was largely range bound between the end of2017 (97.63% of par) and September month-end (98.52%) before declining to 94.09% at the end of December. Even with thedecline in prices late in the year, the interest income generated by the loans in the market was enough for the market to finishwith a positive result. It is worth highlighting that short-term Libor rates continued to increase during the year and as a result offloating rate coupon for the asset class, the overall interest income level increased during the year as well. The average couponfor the market increased by 110 bps during the year to reach 6.12% by the end of the year. After tightening earlier in the year,the average credit spread as represented by the 3-year discount margin finished the year 134 bps wider than the prior yearend at 550 bps. From an industry perspective, all industry sectors posted a negative return in the final two months of the yearwhich resulted in a range of positive and negative returns for the full year. The Retail sector outperformed for the full year afterrecouping some of the price declines in the prior year, although the sector continues to face secular headwinds.Notwithstanding the decline in sentiment from retail investors in the fourth quarter, demand for U.S. loans was healthy overallin 2018, driven by issuance of CLOs. Gross CLO issuance was strong at US$278 billion and excluding transactions that do notincrease outstanding balances (ex. refinance, re-issue and reset transactions) issuance was still US$130 billion which is acalendar year record. We viewed the sell-off as being more technical in nature and expect near-term default rates will remainbelow long term historical levels.
European High Yield bonds returned negatively in 2018 mainly driven by the recent macro volatility and technical factors(significant sell-off in the Equity market) rather than any specific deterioration in the quality of the underlying issuers. From arating’s perspective, single-B bonds materially underperformed the higher rated BB portion of the market during the year 2018while triple C were the main detractor of the yearly performance. The option adjusted spread widened for the third consecutivemonth to end at 524 bps, the highest since April 2016. It should be noted that single-B rated bond are trading with an OAS of717 bps, which we feel is providing a significant risk premium relative to the risk in the underlying market. All sectors exceptHealthcare and Technology & Electronics posted negative returns for the year. For the full year of 2018, we did see theproportion of senior secured supply rise as a percentage of overall issuance in Europe, with 46% of the full year issuance beingsenior secured (per JP Morgan).
*The Fund return uses the close New York prices, whereas the return of the performance comparator is calculated using global close prices.
Barings Global Investment Funds 2 Plc 19
Global Multi-Credit Strategy Fund 3 (continued)
The European loan market held up better than many other risk asset classes in face of broader market volatility in 2018. Withthe majority of risk asset classes producing negative returns in 2018, European loans were one of the few asset classes thatactually generated a positive return over the year. Performance across industries was generally positive while some notablelaggards such as Consumer Durables and Retail detracted the overall return. CLO activity was muted through December, asthe volatility and sell-off across the wider high yield markets also had an impact on structured credit markets. Rapidly wideningCLO liability spreads will most likely result in a temporary pause of new CLO issuance due to challenged arbitrage, albeit overthe medium term we would expect the yields/spreads on both assets and liabilities to stabilise. It is worth noting that volumesdo typically reduce throughout December and it is difficult to infer market movements in the month into longer term trends. Froma sponsor-backed perspective, the activity in the European loan market hit €76.4bn from 157 deals in 2018 versus €78.95bnfrom 205 deals recorded in 2017.
The Fund underperformed its benchmark in 2018. Since its inception in February 2016, the Fund has outperformed itsbenchmark.
Barings LLC
Barings (U.K.) Limited
April 2019
Barings Global Investment Funds 2 Plc
Investment Managers’ Reportfor the financial year ended 31 December 2018 (continued)
Barings Global Investment Funds 2 Plc 20
Barings Barings Global Barings
Global High Yield Investment Multi-Credit Global
Credit Strategies Grade CLO Strategy Investment
Fund Fund Fund 3 Funds 2 Plc
31 Dec 2018 31 Dec 2018 31 Dec 2018 31 Dec 2018
US$ US$ GBP US$
Note
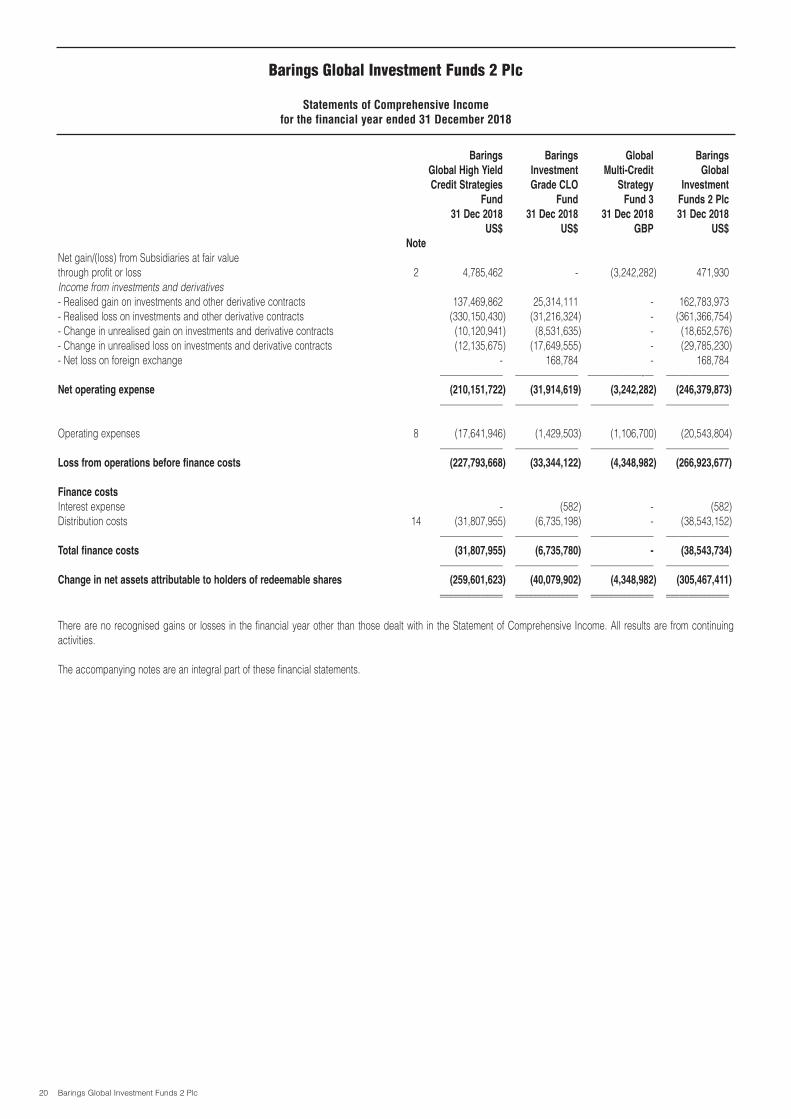
Net gain/(loss) from Subsidiaries at fair value through profit or loss 2 4,785,462 - (3,242,282) 471,930Income from investments and derivatives- Realised gain on investments and other derivative contracts 137,469,862 25,314,111 - 162,783,973- Realised loss on investments and other derivative contracts (330,150,430) (31,216,324) - (361,366,754)- Change in unrealised gain on investments and derivative contracts (10,120,941) (8,531,635) - (18,652,576)- Change in unrealised loss on investments and derivative contracts (12,135,675) (17,649,555) - (29,785,230)- Net loss on foreign exchange - 168,784 - 168,784
–––––––––––––– –––––––––––––– ––––––––––––-–– ––––––––––––––Net operating expense (210,151,722) (31,914,619) (3,242,282) (246,379,873)
–––––––––––––– –––––––––––––– –––––––––––––– ––––––––––––––
Operating expenses 8 (17,641,946) (1,429,503) (1,106,700) (20,543,804)–––––––––––––– –––––––––––––– –––––––––––––– ––––––––––––––
Loss from operations before finance costs (227,793,668) (33,344,122) (4,348,982) (266,923,677)
Finance costs
Interest expense - (582) - (582)Distribution costs 14 (31,807,955) (6,735,198) - (38,543,152)
–––––––––––––– –––––––––––––– –––––––––––––– ––––––––––––––Total finance costs (31,807,955) (6,735,780) - (38,543,734)
–––––––––––––– –––––––––––––– –––––––––––––– ––––––––––––––Change in net assets attributable to holders of redeemable shares (259,601,623) (40,079,902) (4,348,982) (305,467,411)
–––––––––––––– –––––––––––––– –––––––––––––– –––––––––––––––––––––––––––– –––––––––––––– –––––––––––––– ––––––––––––––
There are no recognised gains or losses in the financial year other than those dealt with in the Statement of Comprehensive Income. All results are from continuingactivities.
The accompanying notes are an integral part of these financial statements.
Barings Global Investment Funds 2 Plc
Statements of Comprehensive Incomefor the financial year ended 31 December 2018

Barings Global Investment Funds 2 Plc 21
Barings Barings Global Barings
Global High Yield Investment Multi-Credit Global
Credit Strategies Grade CLO Strategy Investment
Fund Fund Fund 3 Funds 2 Plc
31 Dec 2017 31 Dec 2017 31 Dec 2017 31 Dec 2017
US$ US$ GBP US$
Note
Net gain from Subsidiaries at fair value through profit or loss 2 133,748,422 - 13,400,314 151,192,338Income from investments and derivatives- Realised gain on investments and other derivative contracts 184,756,164 34,121,555 - 218,877,719- Realised loss on investments and other derivative contracts (79,674,848) (3,421,061) - (83,095,909)- Change in unrealised gain on investments and derivative contracts 10,997,071 8,348,536 - 19,345,607- Change in unrealised loss on investments and derivative contracts 24,175,703 6,031,797 - 30,207,500- Net loss on foreign exchange - (190,672) - (190,672)
–––––––––––––– –––––––––––––– ––––––––––––-–– ––––––––––––––Net operating income 274,002,512 44,890,155 13,400,314 336,336,583
–––––––––––––– –––––––––––––– –––––––––––––– ––––––––––––––
Operating expenses 8 (11,538,190) (1,219,274) (960,364) (14,007,622)–––––––––––––– –––––––––––––– –––––––––––––– ––––––––––––––
Profit from operations before finance costs 262,464,322 43,670,881 12,439,950 322,328,961
Finance costs
Interest expense - (3,733) - (3,733)Distribution costs 14 (15,583,905) (5,746,607) - (21,330,512)
–––––––––––––– –––––––––––––– –––––––––––––– ––––––––––––––Total finance costs (15,583,905) (5,750,340) - (21,334,245)
–––––––––––––– –––––––––––––– –––––––––––––– ––––––––––––––Change in net assets attributable to holders of redeemable shares 246,880,417 37,920,541 12,439,950 300,994,716
–––––––––––––– –––––––––––––– –––––––––––––– –––––––––––––––––––––––––––– –––––––––––––– –––––––––––––– ––––––––––––––
There are no recognised gains or losses in the financial year other than those dealt with in the Statement of Comprehensive Income. All results are from continuingactivities.
The accompanying notes are an integral part of these financial statements.
Barings Global Investment Funds 2 Plc
Statements of Comprehensive Incomefor the financial year ended 31 December 2017

Barings Global Investment Funds 2 Plc 23
Barings Global Investment Funds 2 Plc
Statements of Financial Positionas at 31 December 2017
Barings Barings Global Barings
Global High Yield Investment Multi-Credit Global
Credit Strategies Grade CLO Strategy Investment
Fund Fund Fund 3 Funds 2 Plc
31 Dec 2017 31 Dec 2017 31 Dec 2017 31 Dec 2017
US$ US$ GBP US$
Note
Assets
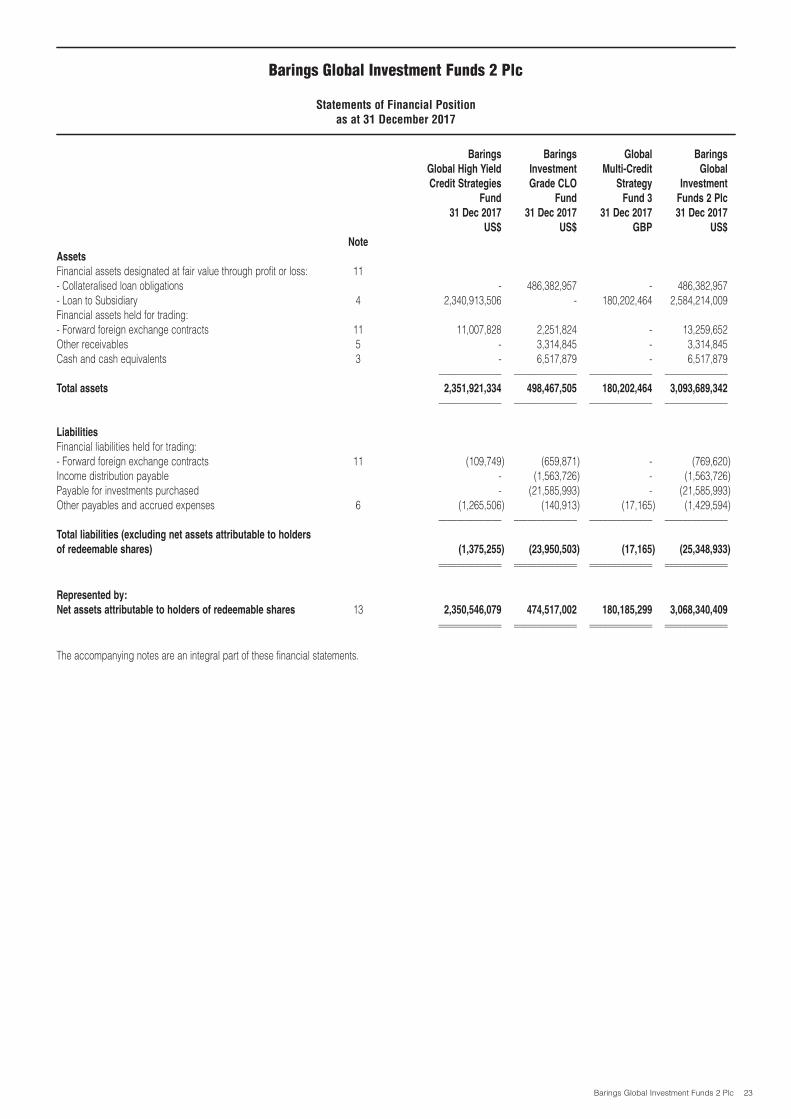
Financial assets designated at fair value through profit or loss: 11- Collateralised loan obligations - 486,382,957 - 486,382,957- Loan to Subsidiary 4 2,340,913,506 - 180,202,464 2,584,214,009Financial assets held for trading:- Forward foreign exchange contracts 11 11,007,828 2,251,824 - 13,259,652Other receivables 5 - 3,314,845 - 3,314,845Cash and cash equivalents 3 - 6,517,879 - 6,517,879
–––––––––––––– –––––––––––––– –––––––––––––– ––––––––––––––Total assets 2,351,921,334 498,467,505 180,202,464 3,093,689,342
–––––––––––––– –––––––––––––– –––––––––––––– ––––––––––––––
Liabilities
Financial liabilities held for trading:- Forward foreign exchange contracts 11 (109,749) (659,871) - (769,620)Income distribution payable - (1,563,726) - (1,563,726)Payable for investments purchased - (21,585,993) - (21,585,993)Other payables and accrued expenses 6 (1,265,506) (140,913) (17,165) (1,429,594)
–––––––––––––– –––––––––––––– –––––––––––––– ––––––––––––––Total liabilities (excluding net assets attributable to holders
of redeemable shares) (1,375,255) (23,950,503) (17,165) (25,348,933)
–––––––––––––– –––––––––––––– –––––––––––––– –––––––––––––––––––––––––––– –––––––––––––– –––––––––––––– ––––––––––––––
Represented by:
Net assets attributable to holders of redeemable shares 13 2,350,546,079 474,517,002 180,185,299 3,068,340,409
–––––––––––––– –––––––––––––– –––––––––––––– –––––––––––––––––––––––––––– –––––––––––––– –––––––––––––– ––––––––––––––
The accompanying notes are an integral part of these financial statements.
Barings Global Investment Funds 2 Plc 24
Barings Global Investment Funds 2 Plc
Statements of Changes in Net Assets Attributable to Holders of Redeemable Sharesfor the financial year ended 31 December 2018
Barings Barings Global Barings
Global High Yield Investment Multi-Credit Global
Credit Strategies Grade CLO Strategy Investment
Fund Fund Fund 3 Funds 2 Plc
31 Dec 2018 31 Dec 2018 31 Dec 2018 31 Dec 2018
US$ US$ GBP US$
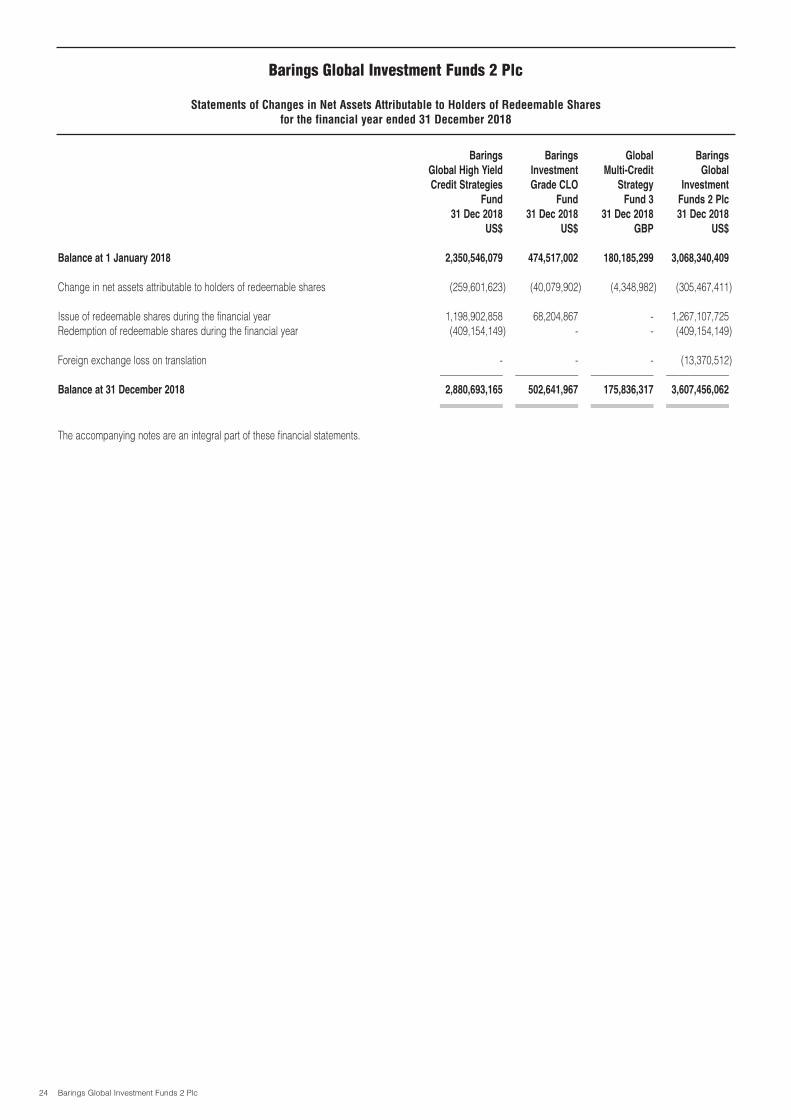
Balance at 1 January 2018 2,350,546,079 474,517,002 180,185,299 3,068,340,409
Change in net assets attributable to holders of redeemable shares (259,601,623) (40,079,902) (4,348,982) (305,467,411)
Issue of redeemable shares during the financial year 1,198,902,858 68,204,867 - 1,267,107,725Redemption of redeemable shares during the financial year (409,154,149) - - (409,154,149)
Foreign exchange loss on translation - - - (13,370,512)–––––––––––––– –––––––––––––– –––––––––––––– ––––––––––––––
Balance at 31 December 2018 2,880,693,165 502,641,967 175,836,317 3,607,456,062
–––––––––––––– –––––––––––––– –––––––––––––– –––––––––––––––––––––––––––– –––––––––––––– –––––––––––––– ––––––––––––––
The accompanying notes are an integral part of these financial statements.
Barings Global Investment Funds 2 Plc 25
Barings Global Investment Funds 2 Plc
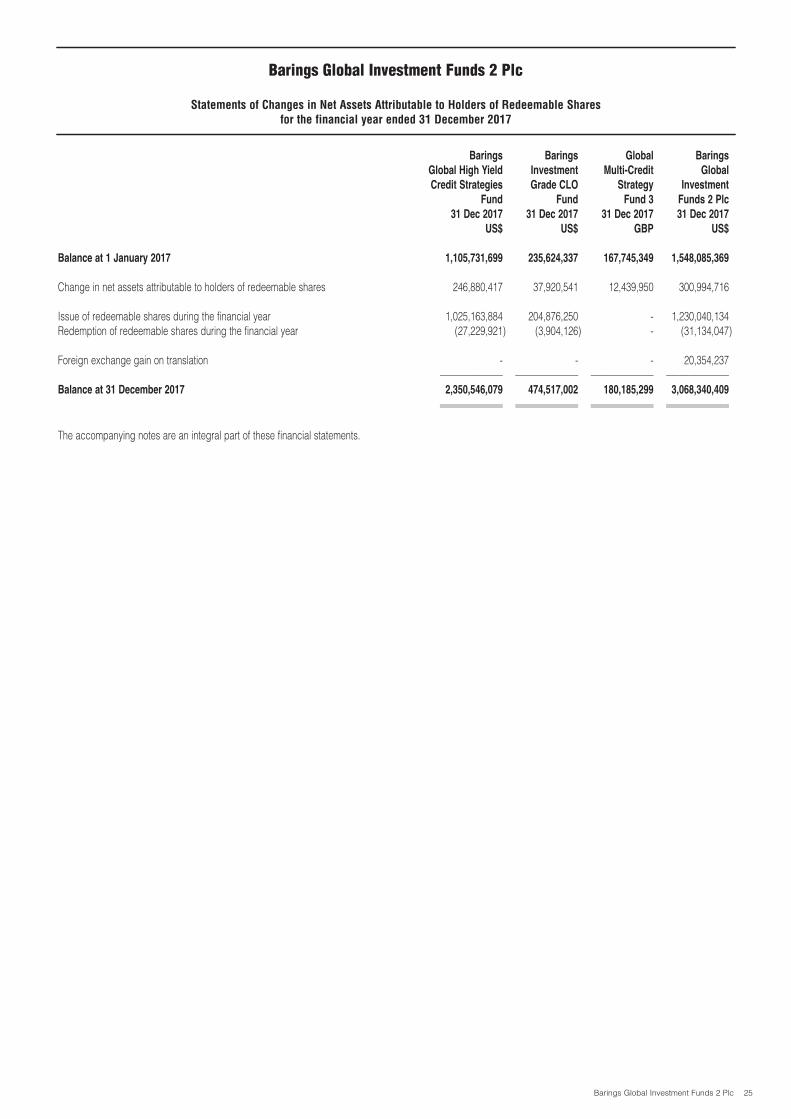
Statements of Changes in Net Assets Attributable to Holders of Redeemable Sharesfor the financial year ended 31 December 2017
Barings Barings Global Barings
Global High Yield Investment Multi-Credit Global
Credit Strategies Grade CLO Strategy Investment
Fund Fund Fund 3 Funds 2 Plc
31 Dec 2017 31 Dec 2017 31 Dec 2017 31 Dec 2017
US$ US$ GBP US$
Balance at 1 January 2017 1,105,731,699 235,624,337 167,745,349 1,548,085,369
Change in net assets attributable to holders of redeemable shares 246,880,417 37,920,541 12,439,950 300,994,716
Issue of redeemable shares during the financial year 1,025,163,884 204,876,250 - 1,230,040,134Redemption of redeemable shares during the financial year (27,229,921) (3,904,126) - (31,134,047)
Foreign exchange gain on translation - - - 20,354,237–––––––––––––– –––––––––––––– –––––––––––––– ––––––––––––––
Balance at 31 December 2017 2,350,546,079 474,517,002 180,185,299 3,068,340,409
–––––––––––––– –––––––––––––– –––––––––––––– –––––––––––––––––––––––––––– –––––––––––––– –––––––––––––– ––––––––––––––
The accompanying notes are an integral part of these financial statements.

Barings Global Investment Funds 2 Plc 26
Barings Global Investment Funds 2 Plc
Statements of Cash Flowsfor the financial year ended 31 December 2018
Barings Barings Global Barings
Global High Yield Investment Multi-Credit Global
Credit Strategies Grade CLO Strategy Investment
Fund Fund Fund 3 Funds 2 Plc
31 Dec 2018 31 Dec 2018 31 Dec 2018 31 Dec 2018
US$ US$ GBP US$
Cash flows from operating activities
Change in net assets attributable to holders of redeemable shares (259,601,623) (40,079,902) (4,348,982) (305,467,411)
Adjustments for:Net movement on financial assets (552,452,990) (37,148,666) 4,273,894 (583,915,667)Unrealised gains on derivatives 22,256,616 4,056,513 - 26,313,129Distributions 31,807,955 6,735,198 - 38,543,153
–––––––––––––– –––––––––––––– –––––––––––––– ––––––––––––––Operating cash outflows before
movements in working capital (757,990,042) (66,436,857) (75,088) (824,526,796)
–––––––––––––– –––––––––––––– –––––––––––––– ––––––––––––––
Movements in receivables - (988,417) - (988,417)Movements in payables 306,316 (2,121) 75,088 404,092
–––––––––––––– –––––––––––––– –––––––––––––– ––––––––––––––Net cash inflows/(outflows) from operating activities 306,316 (990,538) 75,088 (584,325)
–––––––––––––– –––––––––––––– –––––––––––––– ––––––––––––––
Financing activities
Proceeds from subscriptions 1,196,046,027 68,204,867 - 1,264,250,894Payments on redemptions (409,108,453) - - (409,108,453)Distributions paid to shareholders (29,253,848) (6,588,363) - (35,842,211)
–––––––––––––– –––––––––––––– –––––––––––––– ––––––––––––––Net cash inflows from financing activities 757,683,726 61,616,504 - 819,300,230
–––––––––––––– –––––––––––––– –––––––––––––– ––––––––––––––
Net decrease in cash and cash equivalents - (5,810,891) - (5,810,891)
Cash and cash equivalents at 1 January 2018 - 6,517,879 - 6,517,879
–––––––––––––– –––––––––––––– –––––––––––––– ––––––––––––––Cash and cash equivalents at 31 December 2018 - 706,988 - 706,988
–––––––––––––– –––––––––––––– –––––––––––––– –––––––––––––––––––––––––––– –––––––––––––– –––––––––––––– ––––––––––––––
The accompanying notes are an integral part of these financial statements.
Barings Global Investment Funds 2 Plc 27
Barings Global Investment Funds 2 Plc
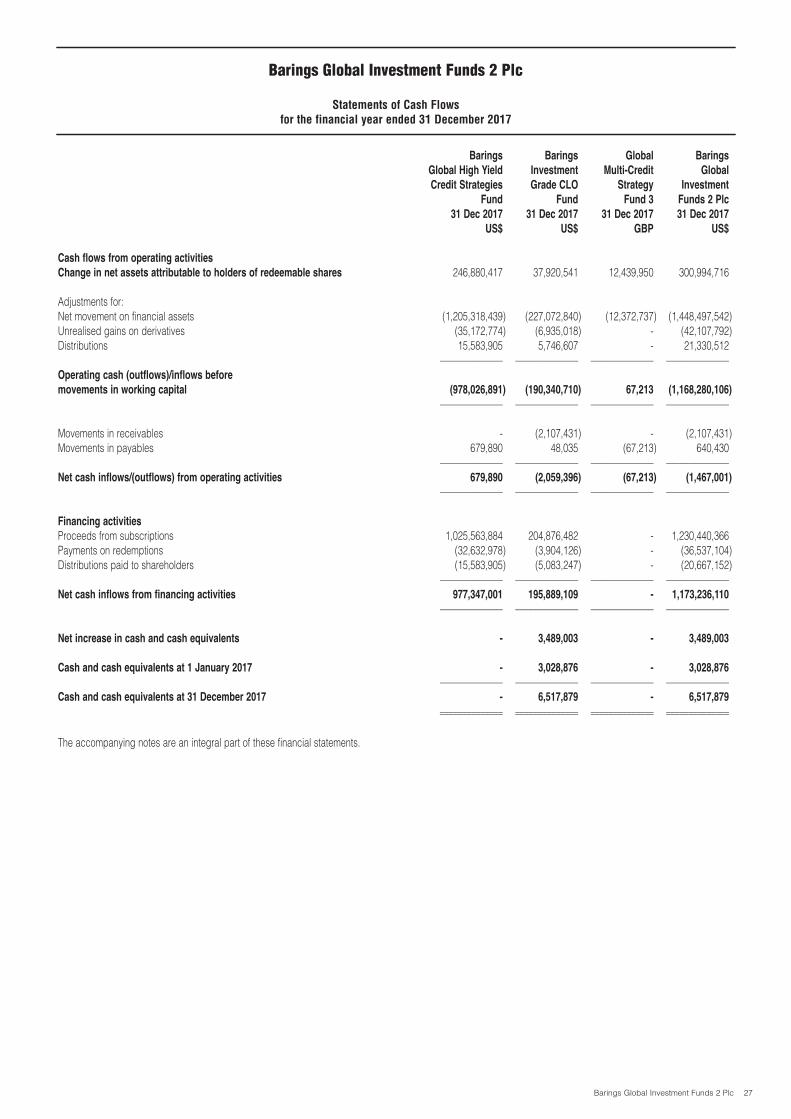
Statements of Cash Flowsfor the financial year ended 31 December 2017
Barings Barings Global Barings
Global High Yield Investment Multi-Credit Global
Credit Strategies Grade CLO Strategy Investment
Fund Fund Fund 3 Funds 2 Plc
31 Dec 2017 31 Dec 2017 31 Dec 2017 31 Dec 2017
US$ US$ GBP US$
Cash flows from operating activities
Change in net assets attributable to holders of redeemable shares 246,880,417 37,920,541 12,439,950 300,994,716
Adjustments for:Net movement on financial assets (1,205,318,439) (227,072,840) (12,372,737) (1,448,497,542)Unrealised gains on derivatives (35,172,774) (6,935,018) - (42,107,792)Distributions 15,583,905 5,746,607 - 21,330,512
–––––––––––––– –––––––––––––– –––––––––––––– ––––––––––––––Operating cash (outflows)/inflows before
movements in working capital (978,026,891) (190,340,710) 67,213 (1,168,280,106)
–––––––––––––– –––––––––––––– –––––––––––––– ––––––––––––––
Movements in receivables - (2,107,431) - (2,107,431)Movements in payables 679,890 48,035 (67,213) 640,430
–––––––––––––– –––––––––––––– –––––––––––––– ––––––––––––––Net cash inflows/(outflows) from operating activities 679,890 (2,059,396) (67,213) (1,467,001)
–––––––––––––– –––––––––––––– –––––––––––––– ––––––––––––––
Financing activities
Proceeds from subscriptions 1,025,563,884 204,876,482 - 1,230,440,366Payments on redemptions (32,632,978) (3,904,126) - (36,537,104)Distributions paid to shareholders (15,583,905) (5,083,247) - (20,667,152)
–––––––––––––– –––––––––––––– –––––––––––––– ––––––––––––––Net cash inflows from financing activities 977,347,001 195,889,109 - 1,173,236,110
–––––––––––––– –––––––––––––– –––––––––––––– ––––––––––––––
Net increase in cash and cash equivalents - 3,489,003 - 3,489,003
Cash and cash equivalents at 1 January 2017 - 3,028,876 - 3,028,876
–––––––––––––– –––––––––––––– –––––––––––––– ––––––––––––––Cash and cash equivalents at 31 December 2017 - 6,517,879 - 6,517,879
–––––––––––––– –––––––––––––– –––––––––––––– –––––––––––––––––––––––––––– –––––––––––––– –––––––––––––– ––––––––––––––
The accompanying notes are an integral part of these financial statements.
Barings Global Investment Funds 2 Plc 28
Barings Global Investment Funds 2 Plc
Notes to the Financial Statementsfor the financial year ended 31 December 2018
1. General information
Barings Global Investment Funds 2 Plc (the “Company”) is an open-ended investment company with variable capitalincorporated under the laws of Ireland as a public limited company pursuant to the Companies Act, 2014. The Company wasincorporated on 8 July 2013 under registration number 529930. Accordingly, the Company is supervised by the Central Bank.
The Company is structured in the form of an umbrella fund with segregated liability between funds. The Company may offerseparate funds, each fund will have a distinct portfolio of investments. As at 31 December 2018, the Company had three activefunds, Barings Global High Yield Credit Strategies Fund, Barings Investment Grade CLO Fund and Global Multi-Credit StrategyFund 3 (together the “Funds”).
The investments of Barings Global High Yield Credit Strategies Fund and Global Multi-Credit Strategy Fund 3 are held throughwholly owned subsidiaries, Barings High Yield Credit Strategies Limited and Barings Global Multi-Credit Strategy 3 Limitedrespectively (the “Subsidiary” or the “Subsidiaries”). The Subsidiaries are incorporated and tax resident in Ireland. BaringsInvestment Grade CLO Fund holds its investments directly.
The Funds are managed by Barings LLC and Barings (U.K.) Limited. The following notes refer to the Investment Managers butdoes not distinguish between them.
2. Statement of compliance and basis of preparation
The financial statements have been prepared in accordance with European Union (“EU”) endorsed International FinancialReporting Standards (“IFRS”) and interpretations adopted by the International Accounting Standards Board (“IASB”) and theCompanies Act, 2014, applicable to companies reporting under IFRS.
The financial statements have been prepared under the historical cost convention, as modified by the revaluation of financialassets, financial liabilities and derivative financial instruments at fair value through profit or loss.
As explained below the Company qualifies as an investment entity and is therefore only required to prepare individual financialstatements under IFRS as adopted by the EU. For the purpose of complying with Irish Company Law’s group financial statementrequirement such financial statements are identical to these financial statements, as the Company is permitted by IFRS (asadopted by the EU) to include its subsidiary at fair value through profit or loss.
This is the first set of the Company’s annual financial statements in which IFRS 9 Financial Instruments has been applied.Changes to significant accounting policies are described in Note 2a.
Details of the Company’s accounting policies are included in Note 2b.
2a. Changes in significant accounting policies
The Company has initially applied IFRS 9 from 1 January 2018. IFRS 15 Revenue from Contracts with Customers is also effectivefrom 1 January 2018 but does not have a material effect on the Company’s financial statements.
As permitted by the transition provisions of IFRS 9, comparative information throughout these financial statements has not beenrestated to reflect the requirements of the standard.
Except for the changes below, the Company has consistently applied the accounting policies as set out in Note 2b to all periodspresented in these financial statements.
IFRS 9 Financial Instruments
IFRS 9 sets out requirements for recognising and measuring financial assets and financial liabilities. This standard replaces IAS39 Financial Instruments: Recognition and Measurement.
As a result of the adoption of IFRS 9, the Company has adopted consequential amendments to IAS 1 Presentation of FinancialStatements, which require:
- Impairment of financial assets to be presented in a separate line item in the statement of comprehensive income. UnderIAS 39, impairment was recognised when losses were incurred. The Company has no such losses to report.

Barings Global Investment Funds 2 Plc 29
Barings Global Investment Funds 2 Plc
Notes to the Financial Statementsfor the financial year ended 31 December 2018 (continued)
2a. Changes in significant accounting policies (continued)
IFRS 9 Financial Instruments (continued)
Additionally, the Company has adopted consequential amendments to IFRS 7 Financial Instruments: Disclosures, which areapplied to disclosures about 2018 but have not generally been applied to comparative information.
The adoption of IFRS 9 had no material impact on the net assets attributable to holders of redeemable shares of the Funds.
(a) Classification and measurement of financial assets and financial liabilities
IFRS 9 contains three principal classification categories for financial assets: measured at amortised cost, fair value throughother comprehensive income (“FVOCI”), and fair value through profit or loss (“FVTPL”). The classification of financial assetsunder IFRS 9 is generally based on the business model in which a financial asset is managed and its contractual cash flowcharacteristics. IFRS 9 eliminates the previous IAS 39 categories of held to maturity, loans and receivables and available forsale. Under IFRS 9, derivatives embedded in contracts where the host is a financial asset in the scope of the standard are neverseparated. Instead, the hybrid financial instrument as a whole is assessed for classification.
IFRS 9 largely retains the existing requirements in IAS 39 for the classification and measurement of financial liabilities.
The adoption of IFRS 9 has not had a significant effect on the Company’s accounting policies related to financial liabilities andderivative financial instruments.
For an explanation of how the Company classifies and measures financial instruments and accounts for related gains andlosses under IFRS 9, see Note 2b.
The following table and the accompanying notes below explain the original measurement categories under IAS 39 and the newmeasurement categories under IFRS 9 for each class of the Company’s financial assets and financial liabilities as at 1 January2018.
Financial assets Original classification under IAS 39 New classification under IFRS 9
Collateralised loan obligations Designated at FVTPL FVTPLLoans to Subsidiaries* Designated at FVTPL FVTPLDerivative financial instruments Held-for-trading Mandatorily at FVTPLReceivable for fund shares sold Loans and receivables Amortised costReceivable for investments sold Loans and receivables Amortised costOther receivables Loans and receivables Amortised costCash and cash equivalents Loans and receivables Amortised cost
*Refer to Note 4 for details regarding the classification of Loans to Subsidiaries at FVTPL under IFRS 10.
Financial liabilities Original classification under IAS 39 New classification under IFRS 9
Derivative financial instruments Held-for-trading Held-for-tradingIncome distribution payable Amortised cost Amortised costPayable for fund shares repurchased Amortised cost Amortised costOther payables and accrued expenses Amortised cost Amortised costNet assets attributable to holders of redeemable shares Amortised cost Amortised cost
(b) Impairment of financial assets
IFRS 9 replaces the ‘incurred loss’ model in IAS 39 with an ‘expected credit loss’ (ECL) model. The new impairment modelapplies to financial assets measured at amortised cost and debt investments at FVOCI, but not investments in equityinstruments. Under IFRS 9, credit losses are recognised earlier than under IAS 39.

Barings Global Investment Funds 2 Plc 30
Barings Global Investment Funds 2 Plc
Notes to the Financial Statementsfor the financial year ended 31 December 2018 (continued)
2a. Changes in significant accounting policies (continued)
(c) Transition
Changes in accounting policies resulting from the adoption of IFRS 9 have been applied retrospectively, except as describedbelow.- Comparative periods have not been restated. Differences in the carrying amounts of financial assets resulting from the
adoption of IFRS 9 are recognised in net assets attributable to holders of redeemable shares as at1 January 2018. Accordingly, the information presented for 2017 does not reflect the requirements of IFRS 9, but ratherthose of IAS 39. There is no material impact to the financial statements as a result of this.
The Company has used the exemption not to restate comparative periods. The amendments made by IFRS 9 to IAS 1introduced the requirement to present ‘interest income calculated using the effective interest method’ as a separate lineitem in the statement of comprehensive income. No reclassifications are required.
- The following assessments have been made on the basis of the facts and circumstances that existed at the date of initialapplication.
• The determination of the business model within which a financial asset is held.• The revocation of previous designations of certain financial assets as measured at FVTPL.
2b. Significant accounting policies
(a) New standards, amendments and interpretations issued but not effective for the financial year beginning 1 January
2018 and not early adopted
IFRS 16 “Leases” was issued in January 2016 and will become effective for period beginning on or after 1 January 2019. Thenew standard is not expected to have any impact on the Company’s financial position, performance or disclosures in itsfinancial statements.
IFRS 17 “Insurance Contracts” was issued in May 2017 and will become effective for accounting periods beginning on or after1 January 2021. It applies to: insurance contracts, including reinsurance contracts, issued by an entity; reinsurance contractsheld by an entity; and investment contracts with discretionary participation features issued by an entity that issues insurancecontracts. An insurance contract is defined as ‘a contract under which one party (the issuer) accepts significant insurance riskfrom another party (the policyholder) by agreeing to compensate the policyholder if a specified uncertain future event (theinsured event) adversely affects the policyholder’. The new standard is not expected to have a significant impact on theCompany’s financial position, performance or disclosures in its financial statements.
There are no other standards, interpretations or amendments to existing standards that are not yet effective that would beexpected to have a significant impact on the Company.
(b) Non-Consolidation and inclusion of Subsidiaries at fair value
The objective of IFRS 10 is to establish principles for the presentation and preparation of consolidated financial statements. Itsets out how to apply the principle of control to identify whether an investor controls an investee and therefore must consolidatethe investee. It also sets out the accounting requirements for the preparation of consolidated financial statements. Theamendments to IFRS 10 define an investment entity and introduce an exemption from the consolidation requirements forinvestment entities. On adoption of IFRS 10, the Company has determined that it meets the definition of an investment entity.
The Company has determined that it meets the definition of an investment entity as it displays the following characteristics:• obtains funds from multiple investors for the purpose of providing those investors with investment management services;• commits to its investors that its business purpose is to invest funds solely for returns from capital appreciation,
investment income, or both; and• measures and evaluates the performance of substantially all of its investments on a fair value basis.

Barings Global Investment Funds 2 Plc 31
Barings Global Investment Funds 2 Plc
Notes to the Financial Statementsfor the financial year ended 31 December 2018 (continued)
2b. Significant accounting policies (continued)
(b) Non-Consolidation and inclusion of Subsidiaries at fair value (continued)
As part of its assessment of IFRS 10, the Company has determined that the Subsidiaries continue to meet the definition of asubsidiary under the provisions of IFRS 10. Subsidiaries are entities under the Company’s control. The Company controls anentity when it is exposed to, or has rights to, variable returns from its involvement with the entity and has the ability to affectthose returns through power over the entity and this is deemed to be the case here.
Investment entity
The Investment Managers of the Company have determined that the Subsidiaries:• do not provide services that relate to the Company’s investment activities; and• have mainly been set up for tax purposes.
As detailed above, the Subsidiaries are accounted for at fair value through profit or loss.
(c) Foreign currency translation
Functional and presentation currency
The functional currency and presentation currency of each Fund is the currency noted in its Supplement to the Prospectus andis relevant to the stated investment strategy and results of each Fund. The functional currencies of the Funds are GBP for GlobalMulti-Credit Strategy Fund 3 and US$ for Barings Global High Yield Credit Strategies Fund and for Barings Investment GradeCLO Fund.
Transactions and balances
Transactions in currencies other than the functional currency are recorded at the rates of exchange prevailing on the dates ofthe transactions. Foreign exchange gains and losses resulting from the settlement of such transactions and from the translationof financial year end/period end exchange rates of monetary items and non-monetary assets and liabilities that aredenominated in foreign currencies are recognised in the Statement of Comprehensive Income in the period in which they arise.Foreign exchange gains and losses on financial assets and liabilities at fair value through profit or loss are recognised togetherwith other changes in fair value. Net foreign exchange gains/(losses) on non-monetary and monetary financial assets andliabilities other than those classified as at fair value through profit or loss are included in the Statement of ComprehensiveIncome.
Combined totals shown in the financial statements
The financial statements of the Company are measured in the currency of the primary economic operating environment in whichthe Company operates. The Company has adopted US$ as the presentation currency of the combined totals shown in thefinancial statements.
For the purposes of producing the combined totals in the Statements of Financial Position, the Statements of Financial Positionof each of the individual Funds are translated to US$ using the exchange rates as at 31 December 2018.
For the purpose of producing the combined totals in the Statements of Comprehensive Income and the Statements of Changesin Net Assets Attributable to Holders of Redeemable Shares from the accounts of the individual Funds, average exchange ratesare used. A translation adjustment arises in the combined totals due to this methodology. This adjustment does not have anyimpact on the Net Asset Value (“NAV”) of any individual Fund. For the financial year ended 31 December 2018, this adjustmentamounted to US$(13,370,512) (31 December 2017: US$20,354,237).
For the purpose of producing the combined totals in the Statements of Cash Flows, the opening exchange rate is used toconvert the Statements of Financial Position balances at 31 December 2017, the average exchange rate is used to convert theStatements of Comprehensive Income amounts for the financial year ended 31 December 2018 and the closing exchange rateis used to convert the Statements of Financial Position balances at 31 December 2018. A translation adjustment arises in thecombined totals due to this methodology. This adjustment does not have any impact on the cash flows of any individual Fund.
Barings Global Investment Funds 2 Plc 32
Barings Global Investment Funds 2 Plc
Notes to the Financial Statementsfor the financial year ended 31 December 2018 (continued)
2b. Significant accounting policies (continued)
(d) Financial assets and liabilities
(i) Recognition and initial measurement
Financial assets and financial liabilities are initially recognised at fair value through profit or loss on the Company’s Statementof Financial Position on the trade date, which is the date on which the Company becomes a party to the contractual provisionsof the instrument. Other financial assets and financial liabilities are recognised at the date they are originated. From this dateany gains and losses arising from changes in fair value of the financial assets or financial liabilities are recorded in theStatement of Comprehensive Income
A financial asset or financial liability is measured initially at fair value plus, for an item not at FVTPL, transaction costs that aredirectly attributable to its acquisition or issue. Transaction costs on financial assets and financial liabilities at fair value throughprofit or loss are expensed immediately, while on other financial instruments they are amortised.
(ii) Classification and subsequent measurement
(a) Classification of financial assets – Policy applicable from 1 January 2018
On initial recognition, the Company classifies financial assets as measured at amortised cost or FVPTL.
A financial asset is measured at amortised cost if it meets both of the following conditions and is not designated at FVPTL:
- It is held within a business model whose objective is to hold assets to collect contractual cash flows; and- Its contractual terms give rise on specified dates to cash flows that are solely payments of principal and interest (SPPI).
All other financial assets of the Company are measured at FVTPL.
Business model assessment
In making an assessment of the objective of the business model in which a financial asset is held the Company considers allof the relevant information about how the business is managed, including:
- The documented investment strategy and the execution of this strategy in practice. This includes whether the investmentstrategy focuses on earning contractual interest income, maintaining a particular interest rate profile, matching theduration of the financial assets to the duration of any related liabilities or expected cash outflows or realising cash flowsthrough the sale of the assets;
- How the performance of the portfolio is evaluated and reported to the Company’s management;- The risks that affect the performance of the business model (and the financial assets held within that business model)
and how those risks are managed;- How the investment manager is compensated: e.g. whether compensation is based on the fair value of the assets
managed or the contractual cash flows collected; and- The frequency, volume and timing of sales of financial assets in prior periods, the reasons for such sales and
expectations about future sales activity.
Transfers of financial assets to third parties in transactions that do not qualify for derecognition are not considered sales for thispurpose, consistent with the Company’s continuing recognition of the assets.
The Company has determined that it has two business models.
- Held-to-collect business model: this includes cash and cash equivalents, receivables for fund shares sold, receivablesfor investments sold and other receivables. These financial assets are held to collect contractual cash flow.
- Other business model: this includes investments in investment funds. These financial assets are managed and theirperformance is evaluated, on a fair value basis, with frequent sales taking place.

Barings Global Investment Funds 2 Plc 33
Barings Global Investment Funds 2 Plc
Notes to the Financial Statementsfor the financial year ended 31 December 2018 (continued)
2b. Significant accounting policies (continued)
(d) Financial assets and liabilities (continued)
(ii) Classification and subsequent measurement (continued)
(a) Classification of financial assets – Policy applicable from 1 January 2018 (continued)
Assessment whether contractual cash flows are SPPI
For the purpose of this assessment, ‘principal’ is defined as the fair value of the financial asset on initial recognition. ‘Interest’is defined as consideration for the time value of money and for the credit risk associated with the principal amount outstandingduring a particular period of time and for other basic lending risks and costs (e.g. liquidity risk and administrative costs), aswell as a profit margin.
In assessing whether the contractual cash flows are SPPI, the Company considers the contractual terms of the instrument. Thisincludes assessing whether the financial asset contains a contractual term that could change the timing or amount ofcontractual cash flows such that it would not meet this condition. In making this assessment, the Company considers:
- Contingent events that would change the amount or timing of cash flows;- Leverage features;- Prepayment and extension features;- Terms that limit the Company’s claim to cash flows from specified assets (e.g. non-recourse features; and - Features that modify consideration of the time value of money (e.g. periodical reset of interest rates).
For a reconciliation of line items in the statement of financial position to the categories of financial instruments, as defined byIFRS 9, see Note 2a.
FVTPL under IFRS 10
As explained further in Note 4, loans to subsidiaries are carried at fair value through profit or loss under IFRS 10.
Reclassifications
Financial assets are not reclassified subsequent to their initial recognition unless the Company were to change its businessmodel for managing financial assets, in which case all affected financial assets would be reclassified on the first day of the firstreporting period following the change in the business model.
(b) Classification of financial assets – Policy applicable before 1 January 2018
The Fund classified financial assets into the following categories.
Financial assets at FVTPL:
- Held for trading: derivative financial instruments- Designated at FVTPL: loans to subsidiaries and collateralised loan obligations.
Financial assets at amortised cost:
- Loans and receivables: cash and cash equivalents, receivables for fund shares sold, receivables for investments soldand other receivables.
A financial asset was classified as held-for-trading if:
- It was acquired or incurred principally for the purpose of selling or repurchasing it in the near term;- On initial recognition, it was part of a portfolio that was managed together and for which there was evidence of a recent
pattern of short-term profit taking; or- It was a derivative, other than a designated and effective hedging instrument.

Barings Global Investment Funds 2 Plc 34
Barings Global Investment Funds 2 Plc
Notes to the Financial Statementsfor the financial year ended 31 December 2018 (continued)
2b. Significant accounting policies (continued)
(d) Financial assets and liabilities (continued)
(ii) Classification and subsequent measurement (continued)
(b) Classification of financial assets – Policy applicable before 1 January 2018 (continued)
The Company designated all investments as at FVTPL on initial recognition because it managed these securities on a fair valuebasis in accordance with its documented investment strategy. Internal reporting and performance measurement of thesesecurities were on a fair value basis.
A non-derivative financial asset with fixed or determinable payments could be classified as a loan and receivable unless it wasquoted in an active market or was an asset for which the holder may not recover substantially all of its initial investment, otherthan because of credit deterioration.
For a reconciliation of line items in the statement of financial position to the categories of financial instruments, as defined byIAS 39, see Note 2a.
(c) Subsequent measurement of financial assets
Financial assets at FVTPLThese assets are subsequently measured at fair value. Net gains and losses and foreign exchange gains and losses arerecognised in profit or loss in ‘Income from investments and derivatives’ in the statement of comprehensive income.
Financial assets at amortised cost (2017: loans and receivables)These assets are subsequently measured at amortised cost using the effective interest method. Foreign exchange gains andlosses are recognised in ‘net gain/loss on foreign exchange’ and impairment would be recognised in ‘impairment losses onfinancial instruments’ in the statement of comprehensive income. Any gain or loss on derecognition is also recognised in profitor loss.
Cash and cash equivalents, receivables for fund shares sold, receivables for investments sold and other receivables areincluded in this category.
(d) Financial liabilities – Classification, subsequent measurement and gains and losses
Financial liabilities are classified as measured at amortised cost or FVTPL.
A financial liability is classified as at FVTPL if it is classified as held-for-trading, it is a derivative or it is designated as such oninitial recognition. Financial liabilities at FVTPL are measured at fair value and net gains and losses, including any interestexpense, are recognised in profit or loss.
Other financial liabilities are subsequently measured at amortised cost using the effective interest method. Interest expenseand foreign exchange gains and losses are recognised in profit or loss. Any gain or loss on derecognition is also recognisedin profit or loss.
Financial liabilities at FVTPL:- Held-for-trading: derivative financial instruments
Financial liabilities at amortised cost:- This includes payable for fund shares repurchased, other payables and accrued expenses, income distribution payable
and redeemable shares.
(iii) Fair value measurement principles‘Fair value’ is the price that would be received to sell an asset or paid to transfer a liability in an orderly transaction betweenmarket participants at the measurement date in the principal or, in its absence, the most advantageous market to which theFunds have access to at that date. The fair value of a liability reflects its non-performance risk.

Barings Global Investment Funds 2 Plc 35
Barings Global Investment Funds 2 Plc
Notes to the Financial Statementsfor the financial year ended 31 December 2018 (continued)
2b. Significant accounting policies (continued)
(d) Financial assets and liabilities (continued)
(iii) Fair value measurement principles (continued)The fair value of financial assets and liabilities traded in active markets (such as publicly traded derivatives and tradingsecurities) are based on quoted market prices at the close of trading on the financial year end date. A market is regarded asactive if transactions for the asset or liability take place with sufficient frequency and volume to provide pricing information onan ongoing basis.
If a quoted price is not available from a recognised market, or is unrepresentative in the opinion of the Directors or theirdelegate, such a security shall be valued, by estimating with care and in good faith the probable realisation value of theinvestment, by the Directors or their delegate or a competent person, which may be the Investment Managers (appointed bythe Directors and each approved for the purpose by the Depositary) or valued at the probable realisation value estimated withcare and in good faith by any other means, provided that the value is approved by the Depositary.
The value of any security, including debt and equity securities which is not normally quoted, listed or traded on or under therules of a recognised exchange will be determined in accordance with the above provisions or obtained from an independentpricing source (if available).
The fair value of derivatives that are not exchange traded is estimated at the amount that the Company would receive or payto terminate the contract at the Statement of Financial Position date taking into account current market conditions (volatility,appropriate yield curve) and the current creditworthiness of the counterparties.
(iv) Amortised cost measurement principlesThe ‘amortised cost’ of a financial asset or financial liability is the amount at which the financial asset or financial liability ismeasured on initial recognition minus the principal repayments, plus or minus the cumulative amortisation using the effectiveinterest method of any difference between that initial amount and the maturity amount and, for financial assets, adjusted for anyloss allowance.
(v) ImpairmentIFRS 9 requires an impairment assessment to be carried out on its financial assets. The Directors have assessed that impairmentdoes not apply to financial assets classified as fair value through profit or loss. The Directors consider the probability of defaultto be close to zero, as these instruments have a low risk of default and the counterparties have a strong capacity to meet theircontractual obligations in the near term. As a result, no loss allowance has been recognised in the financial statements basedon 12-month expected credit losses as any such impairment would be wholly insignificant to the Company.
(vi) DerecognitionThe Company derecognises a financial asset when the contractual rights to the cash flows from the financial asset expire or ittransfers the financial asset and the transfer qualifies for derecognition in accordance with IFRS 9.
A financial liability is derecognised when the obligation specified in the contract is discharged, cancelled or expired.
The Company uses the average cost method to determine realised gains and losses on derecognition.
(vii) Collateralised Loan Obligations (“CLO”)A CLO is a pooled investment vehicle which invests in a diversified group of loan assets. To finance its investments the vehicleissues bonds/notes to investors. The servicing and repayment of these notes is linked directly to the performance of theunderlying assets.
(viii) Forward foreign exchange contractsForward foreign exchange contracts are recognised at fair value on the date on which a derivative contract is entered into andare subsequently re-measured at their fair value. All forward foreign exchange contracts are carried as assets when their fairvalue is positive and as liabilities when their fair value is negative. Any changes in fair value are recognised in the Statementsof Comprehensive Income.
The fair value of forward foreign exchange contracts that are not exchange traded is estimated at the amount that the Companywould receive or pay to terminate the contract at the financial year end date, taking into account current market conditions(volatility, appropriate yield curve) and the current creditworthiness of the counterparties. Specifically, the fair value of a forwardforeign exchange contract is determined as a net present value of estimated future cash flows, discounted at appropriatemarket rates on the valuation date. The unrealised gain or loss on open forward foreign exchange contracts is calculated asthe difference between the contract price and the forward price.

Barings Global Investment Funds 2 Plc 36
Barings Global Investment Funds 2 Plc
Notes to the Financial Statementsfor the financial year ended 31 December 2018 (continued)
2b. Significant accounting policies (continued)
(d) Financial assets and liabilities (continued)
(viii) Forward foreign exchange contracts (continued)The best evidence of fair value of a derivative at initial recognition is the transaction price. Subsequent changes in the fair valueof any derivative instrument are recognised immediately in the Statements of Comprehensive Income.
(ix) Cash and cash equivalentsCash comprises current deposits with banks. Cash equivalents are short-term highly liquid investments that are readilyconvertible to known amounts of cash, are subject to an insignificant risk of changes in value, and are held for the purpose ofmeeting short-term cash commitments rather than for investment or other purposes. Cash and cash equivalents are measuredat amortised cost.
(e) Use of estimates
The preparation of financial statements in conformity with IFRS requires management to make judgements, estimates andassumptions that affect the application of policies and the reported amounts of assets and liabilities, income and expense. Theestimates and associated assumptions are based on historical experience and various other factors that are believed to bereasonable under the circumstances, the results of which form the basis of making the judgements about carrying values ofassets and liabilities that are not readily apparent from other sources. Actual results may differ from these estimates.
The estimates and underlying assumptions are reviewed on an on-going basis. Revisions to accounting estimates arerecognised in the year in which the estimate is revised, if the revision affects only that period or in the period of the revision andfuture periods if the revision affects both current and future periods.
Information on estimates and judgements used by the Directors are disclosed in Note 10 of the financial statements.
(f) Coupon income
Coupon income on financial assets at fair value through profit or loss is included in realised gain on investments in theStatement of Comprehensive Income. Income not yet received is included in Coupon receivable in the Statement of FinancialPosition. Income which suffers a deduction of tax at source is shown gross of withholding tax. Non- recoverable withholding taxis disclosed separately in the Statement of Comprehensive Income.
(g) Interest income and expense
Interest income and expense is recognised in the Statement of Comprehensive Income using the original effective interest rateof the instrument calculated at the acquisition or origination date. Interest income includes the amortisation of any discount orpremium, transaction costs or other differences between the initial carrying amount of an interest-bearing instrument and itsamount at maturity calculated on an effective interest basis.
(h) Expenses
All expenses, including management fees, administration fees and depositary fees, are recognised in the Statements ofComprehensive Income on an accruals basis.
(i) Taxation
Corporation tax is provided on taxable profits at current rates applicable to the Company’s activities.
(j) Redeemable shares
All redeemable shares issued by the Company provide the investors with the right to require redemption for cash at the valueproportionate to the investor’s share in the relevant Fund’s net assets at the redemption date. In accordance with IAS 32, suchinstruments give rise to a financial liability for the present value of the redemption amount on the reporting date.
(k) Dividend policy
The Company may declare dividends out of the net investment income and, at the discretion of the Directors, net realised andunrealised capital gains of the Funds attributable to the distribution classes on or about the last day of each calendar quarter,as detailed, where applicable, in the relevant Supplement to the Prospectus. The dividend distribution on the redeemableshares is recognised as a finance cost in the Statement of Comprehensive Income.
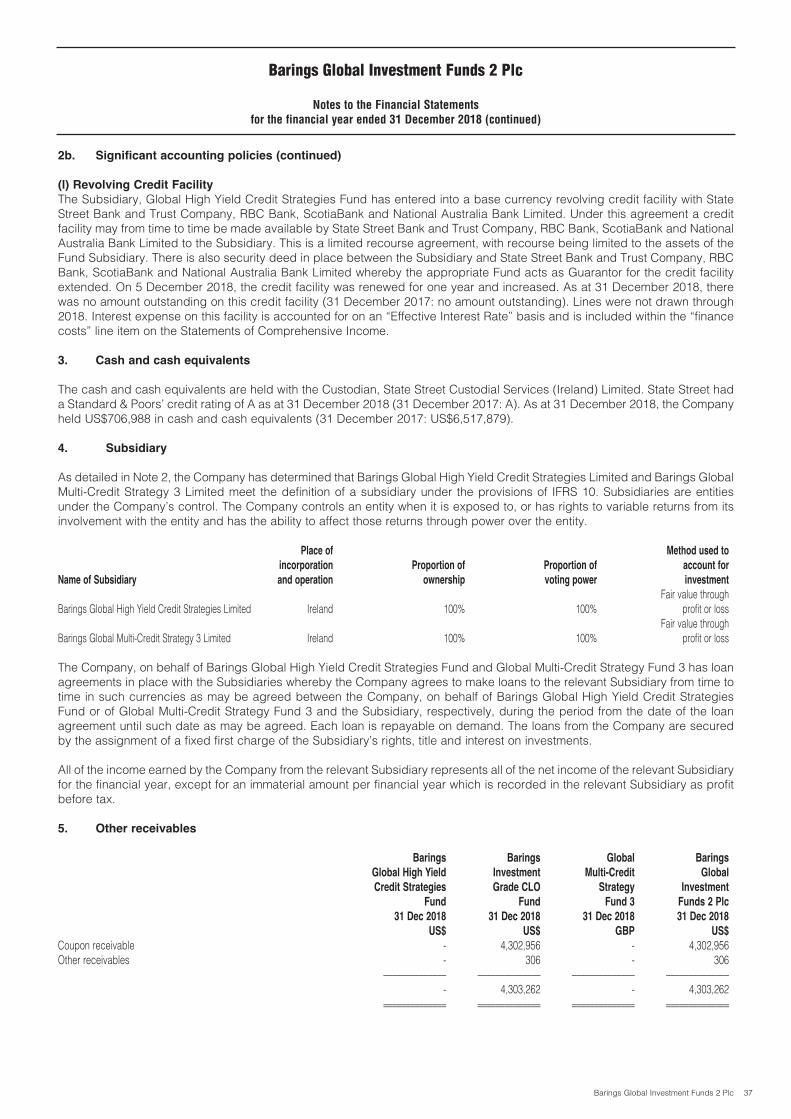
Barings Global Investment Funds 2 Plc 37
Barings Global Investment Funds 2 Plc
Notes to the Financial Statementsfor the financial year ended 31 December 2018 (continued)
2b. Significant accounting policies (continued)
(l) Revolving Credit Facility
The Subsidiary, Global High Yield Credit Strategies Fund has entered into a base currency revolving credit facility with StateStreet Bank and Trust Company, RBC Bank, ScotiaBank and National Australia Bank Limited. Under this agreement a creditfacility may from time to time be made available by State Street Bank and Trust Company, RBC Bank, ScotiaBank and NationalAustralia Bank Limited to the Subsidiary. This is a limited recourse agreement, with recourse being limited to the assets of theFund Subsidiary. There is also security deed in place between the Subsidiary and State Street Bank and Trust Company, RBCBank, ScotiaBank and National Australia Bank Limited whereby the appropriate Fund acts as Guarantor for the credit facilityextended. On 5 December 2018, the credit facility was renewed for one year and increased. As at 31 December 2018, therewas no amount outstanding on this credit facility (31 December 2017: no amount outstanding). Lines were not drawn through2018. Interest expense on this facility is accounted for on an “Effective Interest Rate” basis and is included within the “financecosts” line item on the Statements of Comprehensive Income.
3. Cash and cash equivalents
The cash and cash equivalents are held with the Custodian, State Street Custodial Services (Ireland) Limited. State Street hada Standard & Poors’ credit rating of A as at 31 December 2018 (31 December 2017: A). As at 31 December 2018, the Companyheld US$706,988 in cash and cash equivalents (31 December 2017: US$6,517,879).
4. Subsidiary
As detailed in Note 2, the Company has determined that Barings Global High Yield Credit Strategies Limited and Barings GlobalMulti-Credit Strategy 3 Limited meet the definition of a subsidiary under the provisions of IFRS 10. Subsidiaries are entitiesunder the Company’s control. The Company controls an entity when it is exposed to, or has rights to variable returns from itsinvolvement with the entity and has the ability to affect those returns through power over the entity.
Place of Method used to
incorporation Proportion of Proportion of account for
Name of Subsidiary and operation ownership voting power investment
Fair value throughBarings Global High Yield Credit Strategies Limited Ireland 100% 100% profit or loss
Fair value throughBarings Global Multi-Credit Strategy 3 Limited Ireland 100% 100% profit or loss
The Company, on behalf of Barings Global High Yield Credit Strategies Fund and Global Multi-Credit Strategy Fund 3 has loanagreements in place with the Subsidiaries whereby the Company agrees to make loans to the relevant Subsidiary from time totime in such currencies as may be agreed between the Company, on behalf of Barings Global High Yield Credit StrategiesFund or of Global Multi-Credit Strategy Fund 3 and the Subsidiary, respectively, during the period from the date of the loanagreement until such date as may be agreed. Each loan is repayable on demand. The loans from the Company are securedby the assignment of a fixed first charge of the Subsidiary’s rights, title and interest on investments.
All of the income earned by the Company from the relevant Subsidiary represents all of the net income of the relevant Subsidiaryfor the financial year, except for an immaterial amount per financial year which is recorded in the relevant Subsidiary as profitbefore tax.
5. Other receivables
Barings Barings Global Barings
Global High Yield Investment Multi-Credit Global
Credit Strategies Grade CLO Strategy Investment
Fund Fund Fund 3 Funds 2 Plc
31 Dec 2018 31 Dec 2018 31 Dec 2018 31 Dec 2018
US$ US$ GBP US$
Coupon receivable - 4,302,956 - 4,302,956Other receivables - 306 - 306
–––––––––––––– –––––––––––––– –––––––––––––– ––––––––––––––- 4,303,262 - 4,303,262
–––––––––––––– –––––––––––––– –––––––––––––– –––––––––––––––––––––––––––– –––––––––––––– –––––––––––––– ––––––––––––––

Barings Global Investment Funds 2 Plc 38
Barings Global Investment Funds 2 Plc
Notes to the Financial Statementsfor the financial year ended 31 December 2018 (continued)
5. Other receivables (continued)
Barings Barings Global Barings
Global High Yield Investment Multi-Credit Global
Credit Strategies Grade CLO Strategy Investment
Fund Fund Fund 3 Funds 2 Plc
31 Dec 2017 31 Dec 2017 31 Dec 2017 31 Dec 2017
US$ US$ GBP US$
Coupon receivable - 3,314,845 - 3,314,845–––––––––––––– –––––––––––––– –––––––––––––– ––––––––––––––
- 3,314,845 - 3,314,845–––––––––––––– –––––––––––––– –––––––––––––– –––––––––––––––––––––––––––– –––––––––––––– –––––––––––––– ––––––––––––––
6. Other payables and accrued expenses
Barings Barings Global Barings
Global High Yield Investment Multi-Credit Global
Credit Strategies Grade CLO Strategy Investment
Fund Fund Fund 3 Funds 2 Plc
31 Dec 2018 31 Dec 2018 31 Dec 2018 31 Dec 2018
US$ US$ GBP US$
Investment manager fee payable (1,350,417) (94,046) (76,422) (1,541,870)Administration and custodian fee payable (150,649) (23,545) (5,973) (181,808)Directors' fee payable (278) - - (278)Audit and tax reporting fee payable (5,901) (7,718) (6,430) (21,815)Miscellaneous payable (64,577) (13,483) (3,428) (82,429)
–––––––––––––– –––––––––––––– –––––––––––––– ––––––––––––––(1,571,822) (138,792) (92,253) (1,828,200)
–––––––––––––– –––––––––––––– –––––––––––––– –––––––––––––––––––––––––––– –––––––––––––– –––––––––––––– ––––––––––––––
Barings Barings Global Barings
Global High Yield Investment Multi-Credit Global
Credit Strategies Grade CLO Strategy Investment
Fund Fund Fund 3 Funds 2 Plc
31 Dec 2017 31 Dec 2017 31 Dec 2017 31 Dec 2017
US$ US$ GBP US$
Investment manager fee payable (1,032,458) (86,868) (4,340) (1,125,185)Administration and custodian fee payable (160,953) (35,248) (10,093) (209,828)Directors' fee payable (517) (517) (330) (1,480)Audit and tax reporting fee payable (579) (747) - (1,326)Professional fee payable (2,679) (4,451) (530) (7,846)Miscellaneous payable (68,320) (13,082) (1,872) (83,929)
–––––––––––––– –––––––––––––– –––––––––––––– ––––––––––––––(1,265,506) (140,913) (17,165) (1,429,594)
–––––––––––––– –––––––––––––– –––––––––––––– –––––––––––––––––––––––––––– –––––––––––––– –––––––––––––– ––––––––––––––
7. Subscriber and redeemable shares
Authorised
The authorised share capital of the Company is 500,000,000,000 shares of no par value.
Subscriber shares
Subscriber shares issued amount to US$2, being 2 subscriber shares of US$1 each. These subscriber shares were issued forthe purposes of the incorporation of the Company. Both shares are held by Barings (U.K.) Limited and Barings LLC. Thesubscriber shares entitle the holders to attend and vote at all meetings of the Company but do not entitle the holders toparticipate in the dividends or net assets of any Fund. The subscriber shares do not form part of the NAV of the Company andare thus disclosed in the financial statements by way of this note only.
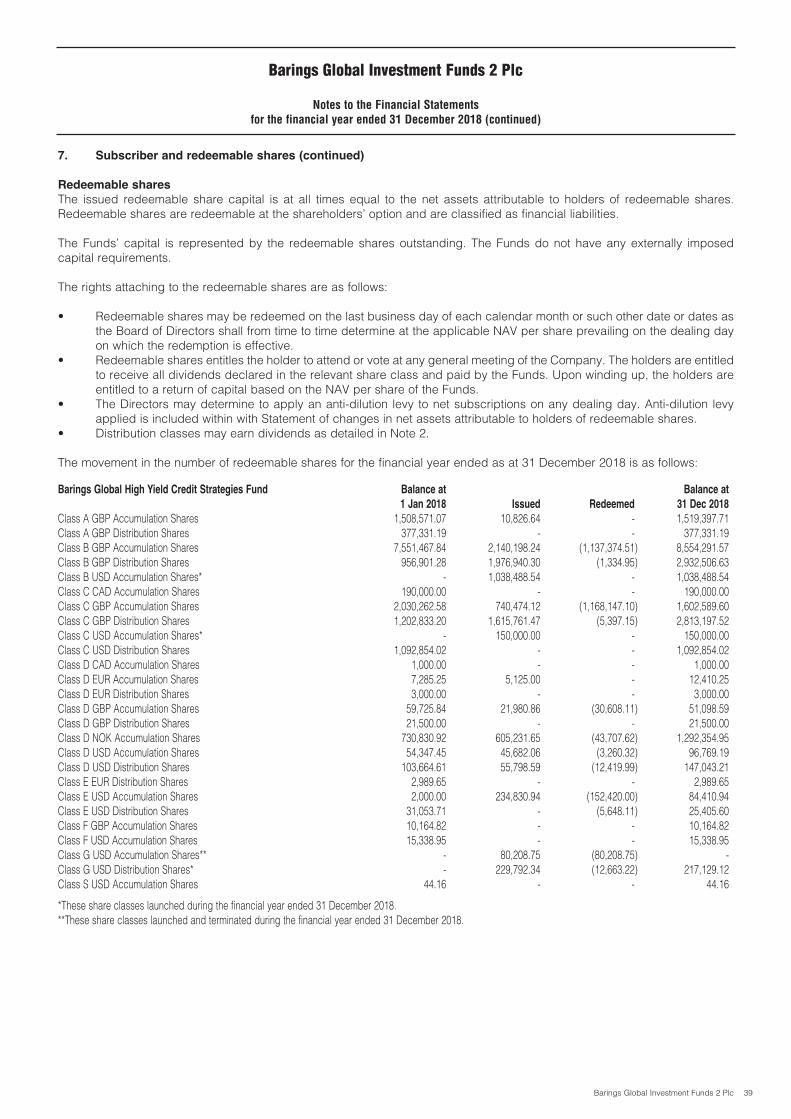
Barings Global Investment Funds 2 Plc 39
Barings Global Investment Funds 2 Plc
Notes to the Financial Statementsfor the financial year ended 31 December 2018 (continued)
7. Subscriber and redeemable shares (continued)
Redeemable shares
The issued redeemable share capital is at all times equal to the net assets attributable to holders of redeemable shares.Redeemable shares are redeemable at the shareholders’ option and are classified as financial liabilities.
The Funds’ capital is represented by the redeemable shares outstanding. The Funds do not have any externally imposedcapital requirements.
The rights attaching to the redeemable shares are as follows:
• Redeemable shares may be redeemed on the last business day of each calendar month or such other date or dates asthe Board of Directors shall from time to time determine at the applicable NAV per share prevailing on the dealing dayon which the redemption is effective.
• Redeemable shares entitles the holder to attend or vote at any general meeting of the Company. The holders are entitledto receive all dividends declared in the relevant share class and paid by the Funds. Upon winding up, the holders areentitled to a return of capital based on the NAV per share of the Funds.
• The Directors may determine to apply an anti-dilution levy to net subscriptions on any dealing day. Anti-dilution levyapplied is included within with Statement of changes in net assets attributable to holders of redeemable shares.
• Distribution classes may earn dividends as detailed in Note 2.
The movement in the number of redeemable shares for the financial year ended as at 31 December 2018 is as follows:
Barings Global High Yield Credit Strategies Fund Balance at Balance at
1 Jan 2018 Issued Redeemed 31 Dec 2018
Class A GBP Accumulation Shares 1,508,571.07 10,826.64 - 1,519,397.71Class A GBP Distribution Shares 377,331.19 - - 377,331.19Class B GBP Accumulation Shares 7,551,467.84 2,140,198.24 (1,137,374.51) 8,554,291.57Class B GBP Distribution Shares 956,901.28 1,976,940.30 (1,334.95) 2,932,506.63Class B USD Accumulation Shares* - 1,038,488.54 - 1,038,488.54Class C CAD Accumulation Shares 190,000.00 - - 190,000.00Class C GBP Accumulation Shares 2,030,262.58 740,474.12 (1,168,147.10) 1,602,589.60Class C GBP Distribution Shares 1,202,833.20 1,615,761.47 (5,397.15) 2,813,197.52Class C USD Accumulation Shares* - 150,000.00 - 150,000.00Class C USD Distribution Shares 1,092,854.02 - - 1,092,854.02Class D CAD Accumulation Shares 1,000.00 - - 1,000.00Class D EUR Accumulation Shares 7,285.25 5,125.00 - 12,410.25Class D EUR Distribution Shares 3,000.00 - - 3,000.00Class D GBP Accumulation Shares 59,725.84 21,980.86 (30,608.11) 51,098.59Class D GBP Distribution Shares 21,500.00 - - 21,500.00Class D NOK Accumulation Shares 730,830.92 605,231.65 (43,707.62) 1,292,354.95Class D USD Accumulation Shares 54,347.45 45,682.06 (3,260.32) 96,769.19Class D USD Distribution Shares 103,664.61 55,798.59 (12,419.99) 147,043.21Class E EUR Distribution Shares 2,989.65 - - 2,989.65Class E USD Accumulation Shares 2,000.00 234,830.94 (152,420.00) 84,410.94Class E USD Distribution Shares 31,053.71 - (5,648.11) 25,405.60Class F GBP Accumulation Shares 10,164.82 - - 10,164.82Class F USD Accumulation Shares 15,338.95 - - 15,338.95Class G USD Accumulation Shares** - 80,208.75 (80,208.75) -Class G USD Distribution Shares* - 229,792.34 (12,663.22) 217,129.12Class S USD Accumulation Shares 44.16 - - 44.16*These share classes launched during the financial year ended 31 December 2018.**These share classes launched and terminated during the financial year ended 31 December 2018.

Barings Global Investment Funds 2 Plc 40
Barings Global Investment Funds 2 Plc
Notes to the Financial Statementsfor the financial year ended 31 December 2018 (continued)
7. Subscriber and redeemable shares (continued)
Redeemable Shares (continued)
Barings Investment Grade CLO Fund Balance at Balance at
1 Jan 2018 Issued Redeemed 31 Dec 2018
Class A GBP Accumulating Shares 1,164,530.30 485,248.45 - 1,649,778.75Class A GBP Distribution Shares 1,936,280.51 - - 1,936,280.51Class A USD Accumulation Shares 4,865.20 10.14 - 4,875.34Class C GBP Distribution Shares 293,500.00 - - 293,500.00Class D CAD Accumulating Shares 2,000.00 - - 2,000.00Class D EUR Accumulating Shares 500.00 - - 500.00Class D NOK Accumulating Shares 27,000.00 - - 27,000.00Class D USD Accumulating Shares 4,695.40 19,111.00 - 23,806.40Class D USD Distribution Shares 59,331.27 13,130.79 - 72,462.06
Global Multi-Credit Strategy Fund 3 Balance at Balance at
1 Jan 2018 Issued Redeemed 31 Dec 2018
Class T GBP Accumulation Shares 1,484,543.08 - - 1,484,543.08
The movement in the number of redeemable shares for the financial year ended as at 31 December 2017 is as follows:
Barings Global High Yield Credit Strategies Fund Balance at Balance at
1 Jan 2017 Issued Redeemed 31 Dec 2017
Class A GBP Accumulation Shares 1,330,290.29 225,672.35 (47,391.57) 1,508,571.07Class A GBP Distribution Shares 320,206.09 57,125.10 - 377,331.19Class B GBP Accumulation Shares 4,449,653.57 3,101,814.27 - 7,551,467.84Class B GBP Distribution Shares 326,997.52 629,903.76 - 956,901.28Class C CAD Accumulation Shares* - 190,000.00 - 190,000.00Class C GBP Accumulation Shares 919,459.16 1,212,182.37 (101,378.95) 2,030,262.58Class C GBP Distribution Shares 101,710.56 1,101,122.64 - 1,202,833.20Class C USD Distribution Shares 515,857.00 595,758.75 (18,761.73) 1,092,854.02Class D CAD Accumulation Shares* - 1,000.00 - 1,000.00Class D EUR Accumulation Shares 11,165.00 532.25 (4,412.00) 7,285.25Class D EUR Distribution Shares* - 3,000.00 - 3,000.00Class D GBP Accumulation Shares 32,545.10 29,117.72 (1,936.98) 59,725.84Class D GBP Distribution Shares 21,500.00 - - 21,500.00Class D NOK Accumulation Shares* - 739,507.29 (8,676.37) 730,830.92Class D USD Accumulation Shares 22,556.36 31,791.09 - 54,347.45Class D USD Distribution Shares 100,070.50 5,094.11 (1,500.00) 103,664.61Class E EUR Distribution Shares* - 2,989.65 - 2,989.65Class E USD Accumulation Shares* - 2,000.00 - 2,000.00Class E USD Distribution Shares 2,000.00 29,053.71 - 31,053.71Class F GBP Accumulation Shares 10,164.82 - - 10,164.82Class F USD Accumulation Shares 12,451.45 2,887.50 - 15,338.95Class S USD Accumulation Shares 44.16 - - 44.16
*These share classes launched during the financial year ended 31 December 2017.

Barings Global Investment Funds 2 Plc 41
7. Subscriber and redeemable shares (continued)
Redeemable Shares (continued)
Barings Investment Grade CLO Fund Balance at Balance at
1 Jan 2017 Issued Redeemed 31 Dec 2017
Class A GBP Accumulation Shares* - 1,164,530.30 - 1,164,530.30Class A GBP Distribution Shares 1,837,251.00 99,029.51 - 1,936,280.51Class A USD Accumulation Shares 4,855.11 10.09 - 4,865.20Class C GBP Distribution Shares* - 293,500.00 - 293,500.00Class D CAD Accumulation Shares* - 2,000.00 - 2,000.00Class D EUR Accumulation Shares* - 500.00 - 500.00Class D GBP Distribution Shares** 30,000.00 - (30,000.00) -Class D NOK Accumulation Shares* - 27,000.00 - 27,000.00Class D USD Accumulation Shares* - 4,695.40 - 4,695.40Class D USD Distribution Shares 42,405.08 16,926.19 - 59,331.27
Global Multi-Credit Strategy Fund 3 Balance at Balance at
1 Jan 2017 Issued Redeemed 31 Dec 2017
Class T GBP Accumulation Shares 1,484,543.08 - - 1,484,543.08
*These share classes launched during the financial year ended 31 December 2017.**This share class terminated during the financial year ended 31 December 2017.
Capital Management
The capital of the Company is represented by the net assets attributable to holders of redeemable participating shares. Theamount of net assets attributable to holders of redeemable participating shares can change significantly on a daily basis, asthe Company is subject to daily subscriptions and redemptions at the discretion of the shareholders.
The ownership of Funds is concentrated, with a small number of investors holding significant shareholdings. As a result, aredemption request by a significant shareholder may have a significant impact on the liquidity of the Company and its abilityto continue as a going concern. See Note 11 Liquidity Risk for details of how this risk is mitigated.
The Company’s objective when managing capital is to safeguard its ability to continue as a going concern in order to achieveits overall objective of long-term capital growth and to maintain a strong capital base to support the development of itsinvestment activities.
The Investment Manager monitors capital on the basis of the value of net assets attributable to holders of redeemableparticipating shares.
8. Operating expenses
Barings Barings Global Barings
Global High Yield Investment Multi-Credit Global
Credit Strategies Grade CLO Strategy Investment
Fund Fund Fund 3 Funds 2 Plc
31 Dec 2018 31 Dec 2018 31 Dec 2018 31 Dec 2018
Note US$ US$ GBP US$
Investment manager fees 9 (15,865,655) (1,057,421) (981,637) (18,229,046)Administration and custodian fees 9 (1,685,273) (279,687) (91,789) (2,087,076)Audit and tax reporting fees (9,844) (37,529) (2,646) (50,893)Professional fees (55,439) (21,387) - (76,826)Directors’ fees (3,956) (3,956) (2,821) (11,665)Other operating expenses (21,779) (29,523) (27,807) (88,298)
–––––––––––––– –––––––––––––– –––––––––––––– ––––––––––––––Gross expenses (17,641,946) (1,429,503) (1,106,700) (20,543,804)
–––––––––––––– –––––––––––––– –––––––––––––– ––––––––––––––Net expenses (17,641,946) (1,429,503) (1,106,700) (20,543,804)
–––––––––––––– –––––––––––––– –––––––––––––– –––––––––––––––––––––––––––– –––––––––––––– –––––––––––––– ––––––––––––––
Barings Global Investment Funds 2 Plc
Notes to the Financial Statementsfor the financial year ended 31 December 2018 (continued)
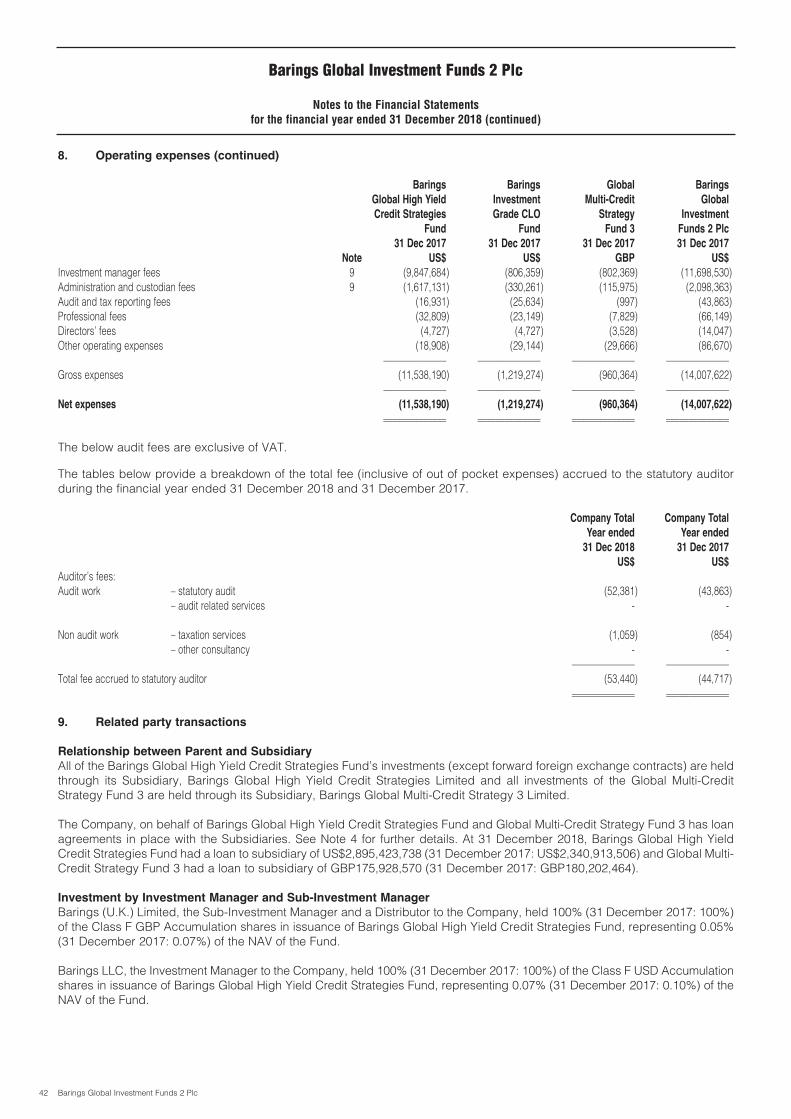
Barings Global Investment Funds 2 Plc 42
8. Operating expenses (continued)
Barings Barings Global Barings
Global High Yield Investment Multi-Credit Global
Credit Strategies Grade CLO Strategy Investment
Fund Fund Fund 3 Funds 2 Plc
31 Dec 2017 31 Dec 2017 31 Dec 2017 31 Dec 2017
Note US$ US$ GBP US$
Investment manager fees 9 (9,847,684) (806,359) (802,369) (11,698,530)Administration and custodian fees 9 (1,617,131) (330,261) (115,975) (2,098,363)Audit and tax reporting fees (16,931) (25,634) (997) (43,863)Professional fees (32,809) (23,149) (7,829) (66,149)Directors’ fees (4,727) (4,727) (3,528) (14,047)Other operating expenses (18,908) (29,144) (29,666) (86,670)
–––––––––––––– –––––––––––––– –––––––––––––– ––––––––––––––Gross expenses (11,538,190) (1,219,274) (960,364) (14,007,622)
–––––––––––––– –––––––––––––– –––––––––––––– ––––––––––––––Net expenses (11,538,190) (1,219,274) (960,364) (14,007,622)
–––––––––––––– –––––––––––––– –––––––––––––– –––––––––––––––––––––––––––– –––––––––––––– –––––––––––––– ––––––––––––––
The below audit fees are exclusive of VAT.
The tables below provide a breakdown of the total fee (inclusive of out of pocket expenses) accrued to the statutory auditorduring the financial year ended 31 December 2018 and 31 December 2017.
Company Total Company Total
Year ended Year ended
31 Dec 2018 31 Dec 2017
US$ US$
Auditor’s fees:Audit work – statutory audit (52,381) (43,863)
– audit related services - -
Non audit work – taxation services (1,059) (854)– other consultancy - -
–––––––––––––– ––––––––––––––Total fee accrued to statutory auditor (53,440) (44,717)
–––––––––––––– –––––––––––––––––––––––––––– ––––––––––––––
9. Related party transactions
Relationship between Parent and Subsidiary
All of the Barings Global High Yield Credit Strategies Fund’s investments (except forward foreign exchange contracts) are heldthrough its Subsidiary, Barings Global High Yield Credit Strategies Limited and all investments of the Global Multi-CreditStrategy Fund 3 are held through its Subsidiary, Barings Global Multi-Credit Strategy 3 Limited.
The Company, on behalf of Barings Global High Yield Credit Strategies Fund and Global Multi-Credit Strategy Fund 3 has loanagreements in place with the Subsidiaries. See Note 4 for further details. At 31 December 2018, Barings Global High YieldCredit Strategies Fund had a loan to subsidiary of US$2,895,423,738 (31 December 2017: US$2,340,913,506) and Global Multi-Credit Strategy Fund 3 had a loan to subsidiary of GBP175,928,570 (31 December 2017: GBP180,202,464).
Investment by Investment Manager and Sub-Investment Manager
Barings (U.K.) Limited, the Sub-Investment Manager and a Distributor to the Company, held 100% (31 December 2017: 100%)of the Class F GBP Accumulation shares in issuance of Barings Global High Yield Credit Strategies Fund, representing 0.05%(31 December 2017: 0.07%) of the NAV of the Fund.
Barings LLC, the Investment Manager to the Company, held 100% (31 December 2017: 100%) of the Class F USD Accumulationshares in issuance of Barings Global High Yield Credit Strategies Fund, representing 0.07% (31 December 2017: 0.10%) of theNAV of the Fund.
Barings Global Investment Funds 2 Plc
Notes to the Financial Statementsfor the financial year ended 31 December 2018 (continued)

Barings Global Investment Funds 2 Plc 43
9. Related party transactions (continued)
Investment by Investment Manager and Sub-Investment Manager (continued)
Barings LLC, the Investment Manager to the Company, held 100% (31 December 2017: 100%) of the Class S USD Accumulationshares in issuance of Barings Global High Yield Credit Strategies Fund, representing 0.00% (31 December 2017: 0.00%) of theNAV of the Fund.
Barings LLC, the Investment Manager to the Company, held 100% (31 December 2017: 100%) of the Class A USD Accumulationshares in issuance of Barings Investment Grade CLO Fund, representing 0.11% (31 December 2017: 0.15%) of the NAV of the Fund.
Investment Manager
To implement the investment strategies as specified in the Prospectus and the Supplements, the Funds have appointed BaringsLLC as Investment Manager. Barings LLC is an investment management company incorporated in the United States and isregistered with the Securities Exchange Commission “SEC” as an investment advisor. Barings LLC is an indirect subsidiary ofMassachusetts Mutual Life Insurance Company and a member of the MassMutual Financial Group.
The Investment Manager is entitled to receive out of the assets of the Funds fees equivalent to a percentage of the relevantshare class as follows:
Investment Management Fee
Barings Global High Yield Credit Strategies Fund % of NAV
Class A Shares 0.45%Class B Shares 0.525%Class C Shares 0.60%Class D Shares 0.70%Class E Shares 1.10%Class F Shares 0.00%Class G Shares 1.60%Class S Shares 0.30%
Barings Investment Grade CLO Fund
Class A Shares 0.21%Class C Shares 0.25%Class D Shares 0.30%
Global Multi-Credit Strategy Fund 3
Class T Shares 0.55%*
*Up to and including GBP150,000,000; 0.50% in excess of GBP150,000,000.
Please refer to Note 8 for details of these fees charged to the Funds.
Administration, Custodian and Operating fees
The aggregate fees and expenses of the Administrator and the Custodian, as defined in the Supplements cannot exceed thefollowing amounts:
Fund
Barings Global High Yield Credit Strategies Fund 0.20% of the NAV per annumBarings Investment Grade CLO Fund 0.15% of the NAV per annumGlobal Multi-Credit Strategy Fund 3 higher of US$ 160,000 or 0.075% of the NAV per annum
In the event that such eligible fees and expenses exceed the stated limit per annum of the NAV of the Funds in respect of anyperiod, the Investment Manager has agreed to waive a portion of its investment management fee as is equal to the excess (fundreimbursement). The Investment Manager at its discretion may, in consideration for agreeing to this waiver, in the event that theamount of such eligible fees and expenses actually incurred during a period is less than the stated limits per annum of the NAVof the Funds, the Funds will pay the Investment Manager the difference between the amount of the fees and expenses actuallyincurred and the stated limits per annum of the NAV of the Funds (administration cap). The Investment Managers fees willaccrue monthly and are payable in arrears. Investment Manager’s fees of US$18,229,046 (31 December 2017: US$11,698,530)have been charged for the financial year ended 31 December 2018, of which US$1,541,870 (31 December 2017:US$1,125,185) was still outstanding as at 31 December 2018.
Administration and Custodian fees of US$2,087,076 (31 December 2017: US$2,098,363) have been charged for the financial yearended 31 December 2018, of which US$181,808 (31 December 2017: US$209,828) was still outstanding as at 31 December 2018.
Barings Global Investment Funds 2 Plc
Notes to the Financial Statementsfor the financial year ended 31 December 2018 (continued)

Barings Global Investment Funds 2 Plc 44
9. Related party transactions (continued)
Directors’ fees
The total Directors’ fees are disclosed in Note 8. All of these fees were emoluments in respect of services to the Company. Thelisting of the members of the Board of Directors is shown on page 2. Mr. Timothy Schulze, Mr. Peter Clark and Mr. Julian Swaynehave agreed to waive their entitlement to be paid a Director’s fee. While these Directors don’t receive fees from the Companydirectly for their role as Directors, they are paid in their role as managing directors for the Investment Manager and Sub-Investment Manager. The Investment Manager receives fees as outlined in Note 9.
Directors’ relationships
Mr. Peter Clark and Mr. Julian Swayne are managing directors of Barings (U.K.) Limited, the Sub-Investment Manager and aDistributor for the Company, and Baring Asset Management Limited, a Distributor for the Company. Mr. Timothy Schulze is amanaging director of Barings LLC, the Investment Manager. Mr. James Cleary, Ms. Barbara Healy and Mr. David Conway arealso Directors of the Subsidiaries.
Employees
There were no direct employees of the Company for the financial year under review.
Transactions
The following related party transactions took place with other funds managed by the Investment Managers whereby the Fundswithin the Company bought assets from other funds managed by the Investment Manager. These transactions were not withinthe umbrella of the Company and therefore they were not eliminated on consolidation.
Trade details during the financial year ended 31 Dec 2018
Purchases Trade Value Sales Trade Value
Barings Global High Yield Credit Strategies Fund 5,850,975 228,909
All related party transactions were made on terms equivalent to those that prevail in arm’s length transactions.
10. Fair value hierarchy
The Company measures fair values using the following fair value hierarchy that reflects the significance of the inputs used inmaking the measurements:
• Level 1 - Quoted market price in an active market for an identical instrument.• Level 2 - Valuation techniques based on observable inputs. This category includes instruments valued using: quoted
market prices in active markets for similar instruments; quoted prices for similar instruments in markets that areconsidered less than active or other valuation techniques where all significant inputs are directly or indirectly observablefrom market data.
• Level 3 - Valuation techniques using significant unobservable inputs. This category includes all instruments where thevaluation technique includes inputs not based on observable data and the unobservable inputs could have a significantimpact on the instrument’s valuation. This category includes instruments that are valued based on quoted prices forsimilar instruments where significant unobservable adjustments or assumptions are required to reflect differencesbetween the instruments.
Valuation Framework
The Company has an established control framework with respect to measurement of fair values. This framework includes aValuations Committee, which is independent of front office management and reports to the Board of Directors, who have overallresponsibility for fair value measurements. Specific controls include:
• Verification of observable pricing inputs;• A review and approval process for changes to pricing models;• Review of unobservable inputs and valuation adjustments; and• Review of independent third party pricing sources.
The level in the fair value hierarchy within which the fair value measurement is categorised in its entirety is determined on thebasis of the lowest level input that is significant to the fair value measurement in its entirety. For this purpose, the significanceof an input is assessed against the fair value measurement in its entirety. If a fair value measurement uses observable inputsthat require significant adjustment based on observable inputs, that measurement is a Level 3 measurement. Assessing thesignificance of a particular input to the fair value measurement in its entirety requires judgement, considering factors specificto the asset or liability.
Barings Global Investment Funds 2 Plc
Notes to the Financial Statementsfor the financial year ended 31 December 2018 (continued)

Barings Global Investment Funds 2 Plc 45
10. Fair value hierarchy (continued)
Valuation Framework (continued)
The determination of what constitutes, observable’ requires significant judgement by the Company. The Company considersobservable data to be that market data that is readily available, regularly distributed or updated, reliable and verifiable, notproprietary and provided by independent sources that are actively involved in the relevant market. The CLO’s fair value havebeen determined using independent broker quotes based on observable inputs and were classified as Level 2. Where thiscannot be verified, the CLO’s would fall into Level 3.
The loans to the Subsidiaries are classified as Level 2, reflecting the observable inputs used in valuing the underlying portfoliosof the unconsolidated Subsidiaries. Please refer to the audited financial statements of each Subsidiary included in the Appendixto these financial statements.
As at 31 December 2018 there were no Level 3 securities held by any of the Funds. Barings Investment Grade CLO Fund wasthe only Fund that held Level 3 securities at 31 December 2017.
If a quoted price is not available from a recognised market, or is unrepresentative in the opinion of the Directors or theirdelegate, such a security shall be valued, by estimating with care and in good faith the probable realisation value of theinvestment, by the Directors or their delegate or a competent person, which may be one of the Investment Managers (appointedby the Directors and each approved for the purpose by the Custodian) or valued at the probable realisation value estimatedwith care and in good faith by any other means provided that the value is approved by the Custodian.
For each class of assets and liabilities not measured at fair value in the Statement of Financial Position but for which fair valueis disclosed, IFRS 13 requires the Company to disclose the level within the fair value hierarchy which the fair value measurementwould be categorised and a description of the valuation technique and inputs used in the technique.
Cash and cash equivalents include deposits held with banks and other short-term investments in an active market and they arecategorised as Level 1.
The puttable value of redeemable shares is calculated based on the net difference between total assets and all other liabilitiesof each Fund within the Company in accordance with the Funds’ offering memorandum. These shares are not traded on anactive market. A demand feature is attached to these shares, as they are redeemable at the holders’ option and can be putback to the Funds at any dealing date for cash/assets equal to a proportionate share of the Fund’s NAV attributable to the shareclass. The fair value is based on the amount payable on demand, discounted from the first date that the amount could berequired to be paid. The impact of discounting in this instance is not material. As such, Level 2 is deemed to be the mostappropriate categorisation for net assets attributable to holders of redeemable shares held.
All forward foreign exchange contracts are classified as Level 2 since they are valued using observable inputs but are notquoted in an active market.
Transfers between levels of the fair value hierarchy are deemed to have occurred at the end of the financial year. There wereno transfers between Level 1 and Level 2 during the financial year (31 December 2017: none).
The following tables analyse within the fair value hierarchy of the Funds’ financial assets and liabilities measured at fair valueat 31 December 2018:
Barings Global High Yield Credit Strategies Fund Total
Level 1 Level 2 Level 3 Fair Value
US$ US$ US$ US$
Financial assets
At fair value through profit or loss:- Loan to subsidiary - 2,893,366,496 - 2,893,366,496- Forward foreign exchange contracts - 886,887 - 886,887
–––––––––––––– –––––––––––––– –––––––––––––– ––––––––––––––Total assets - 2,894,253,383 - 2,894,253,383
–––––––––––––– –––––––––––––– –––––––––––––– –––––––––––––––––––––––––––– –––––––––––––– –––––––––––––– ––––––––––––––
Financial liabilities
At fair value through profit or loss:- Forward foreign exchange contracts - (12,245,424) - (12,245,424)
–––––––––––––– –––––––––––––– –––––––––––––– ––––––––––––––Total liabilities - (12,245,424) - (12,245,424)
–––––––––––––– –––––––––––––– –––––––––––––– –––––––––––––––––––––––––––– –––––––––––––– –––––––––––––– ––––––––––––––
Barings Global Investment Funds 2 Plc
Notes to the Financial Statementsfor the financial year ended 31 December 2018 (continued)

Barings Global Investment Funds 2 Plc 46
10. Fair value hierarchy (continued)
Barings Investment Grade CLO Fund Total
Level 1 Level 2 Level 3 Fair Value
US$ US$ US$ US$
Financial assets
At fair value through profit or loss:- Collateral loan obligations - 501,945,630 - 501,945,630 - Forward foreign exchange contracts - 70,159 - 70,159
–––––––––––––– –––––––––––––– –––––––––––––– ––––––––––––––Total assets - 502,015,789 - 502,015,789
–––––––––––––– –––––––––––––– –––––––––––––– –––––––––––––––––––––––––––– –––––––––––––– –––––––––––––– ––––––––––––––
Financial liabilities
At fair value through profit or loss:- Forward foreign exchange contracts - (2,534,719) - (2,534,719)
–––––––––––––– –––––––––––––– –––––––––––––– ––––––––––––––Total liabilities - (2,534,719) - (2,534,719)
–––––––––––––– –––––––––––––– –––––––––––––– –––––––––––––––––––––––––––– –––––––––––––– –––––––––––––– ––––––––––––––
Global Multi-Credit Strategy Fund 3 Total
Level 1 Level 2 Level 3 Fair Value
GBP GBP GBP GBP
Financial assets
At fair value through profit or loss:- Loan to subsidiary - 175,928,570 - 175,928,570
–––––––––––––– –––––––––––––– –––––––––––––– ––––––––––––––Total assets - 175,928,570 - 175,928,570
–––––––––––––– –––––––––––––– –––––––––––––– –––––––––––––––––––––––––––– –––––––––––––– –––––––––––––– ––––––––––––––
The following tables analyse within the fair value hierarchy of the Funds’ financial assets and liabilities measured at fair valueat 31 December 2017:
Barings Global High Yield Credit Strategies Fund Total
Level 1 Level 2 Level 3 Fair Value
US$ US$ US$ US$
Financial assets
Designated at fair value through profit or loss:- Loan to subsidiary - 2,340,913,506 - 2,340,913,506Held for trading:- Forward foreign exchange contracts - 11,007,828 - 11,007,828
–––––––––––––– –––––––––––––– –––––––––––––– ––––––––––––––Total assets - 2,351,921,334 - 2,351,921,334
–––––––––––––– –––––––––––––– –––––––––––––– –––––––––––––––––––––––––––– –––––––––––––– –––––––––––––– ––––––––––––––
Financial liabilities
Held for trading:- Forward foreign exchange contracts - (109,749) - (109,749)
–––––––––––––– –––––––––––––– –––––––––––––– ––––––––––––––Total liabilities - (109,749) - (109,749)
–––––––––––––– –––––––––––––– –––––––––––––– –––––––––––––––––––––––––––– –––––––––––––– –––––––––––––– ––––––––––––––
Barings Global Investment Funds 2 Plc
Notes to the Financial Statementsfor the financial year ended 31 December 2018 (continued)

Barings Global Investment Funds 2 Plc 47
10. Fair value hierarchy (continued)
Barings Investment Grade CLO Fund Total
Level 1 Level 2 Level 3 Fair Value
US$ US$ US$ US$
Financial assets
Designated at fair value through profit or loss:- Collateral loan obligations - 463,545,457 22,837,500 486,382,957Held for trading:- Forward foreign exchange contracts - 2,251,824 - 2,251,824
–––––––––––––– –––––––––––––– –––––––––––––– ––––––––––––––Total assets - 465,797,281 22,837,500 488,634,781
–––––––––––––– –––––––––––––– –––––––––––––– –––––––––––––––––––––––––––– –––––––––––––– –––––––––––––– ––––––––––––––
Financial liabilities
Held for trading:- Forward foreign exchange contracts - (659,871) - (659,871)
–––––––––––––– –––––––––––––– –––––––––––––– ––––––––––––––Total liabilities - (659,871) - (659,871)
–––––––––––––– –––––––––––––– –––––––––––––– –––––––––––––––––––––––––––– –––––––––––––– –––––––––––––– ––––––––––––––
Global Multi-Credit Strategy Fund 3 Total
Level 1 Level 2 Level 3 Fair Value
GBP GBP GBP GBP
Financial assets
Designated at fair value through profit or loss:- Loan to subsidiary - 180,202,464 - 180,202,464
–––––––––––––– –––––––––––––– –––––––––––––– ––––––––––––––Total assets - 180,202,464 - 180,202,464
–––––––––––––– –––––––––––––– –––––––––––––– –––––––––––––––––––––––––––– –––––––––––––– –––––––––––––– ––––––––––––––
The following table reconciles fair value changes in the Barings Investment Grade CLO Fund’s Level 3 holdings for the yearended 31 December 2018:
31 Dec 2018
US$
Balance 31 December 2017 22,837,500Purchases -Realised gains and losses (10,220) Movement in unrealised gains and losses (745,850) Transfers out of Level 3 (20,691,650)Sales (1,389,780)
––––––––––––––Balance 31 December 2018 -
––––––––––––––––––––––––––––Total unrealised losses recognised in the Statement of Comprehensive Incomefor assets held at the end of the financial year:- Included within unrealised loss on investments -
––––––––––––––––––––––––––––
Barings Global Investment Funds 2 Plc
Notes to the Financial Statementsfor the financial year ended 31 December 2018 (continued)

Barings Global Investment Funds 2 Plc 48
10. Fair value hierarchy (continued)
The following table reconciles fair value changes in the Barings Investment Grade CLO Fund’s Level 3 holdings for the yearended 31 December 2017:
31 Dec 2017
US$
Balance 31 December 2016 26,470,722Purchases 22,837,500Realised gains and losses 278,713Movement in unrealised gains and losses 23,799Transfers out of Level 3 (24,365,421)Sales (2,407,813)
––––––––––––––Balance 31 December 2017 22,837,500
––––––––––––––––––––––––––––Total unrealised losses recognised in the Statement of Comprehensive Incomefor assets held at the end of the financial year:- Included within unrealised loss on investments 23,799
––––––––––––––––––––––––––––
The Company determines the fair value for CLO instruments using independent, unadjusted indicative broker quotes. A brokerquote is generally not a binding offer. The categorisation of CLO instruments is dependent if the broker quotes reflect actualcurrent market conditions, or if they are indicative prices based on brokers’ valuation models, depending on the significanceand observability of the inputs to the model.
For CLO instruments that have been categorised as Level 2, fair value has been determined using independent broker quotesbased on observable inputs. If it could not be verified that the valuation is based significantly on observable inputs, then theinvestments would fall into Level 3.
The Company considers observable data to be that market data that is readily available, regularly distributed or updated,reliable, not proprietary, and provided by independent sources that are actively involved in the relevant market.
At 31 December 2018 no CLOs were categorised as Level 3 (31 December 2017: fair value of US$22,837,500). Thisclassification was given to these securities as a result of decreased liquidity in the market and wider spreads that areconsequently reflected in a broader spectrum of indicative broker quotes, which are factors that indicate that the broker quotesare not based on observable prices.
The table below sets out information about significant unobservable inputs used at 31 December 2017 in measuring financialinstruments categorised as Level 3 in the fair value hierarchy.
Asset Class Fair Value Unobservable Weighted
US$ Inputs Ranges Average
Collateralised Loan Obligations 22,837,500 Broker Quotes 100.00 100.00
Sensitivity of Level 3 assets measured at fair value to changes in assumptionsThe results of using reasonably possible alternative assumptions for valuing the Level 3 assets may result in the fair valueestimate and recoverability of the assets being subject to uncertainty and a range of possible outcomes are likely. Suchdifferences, if any, may have had a material effect on the overall portfolio as at 31 December 2017.
Barings Global Investment Funds 2 Plc
Notes to the Financial Statementsfor the financial year ended 31 December 2018 (continued)
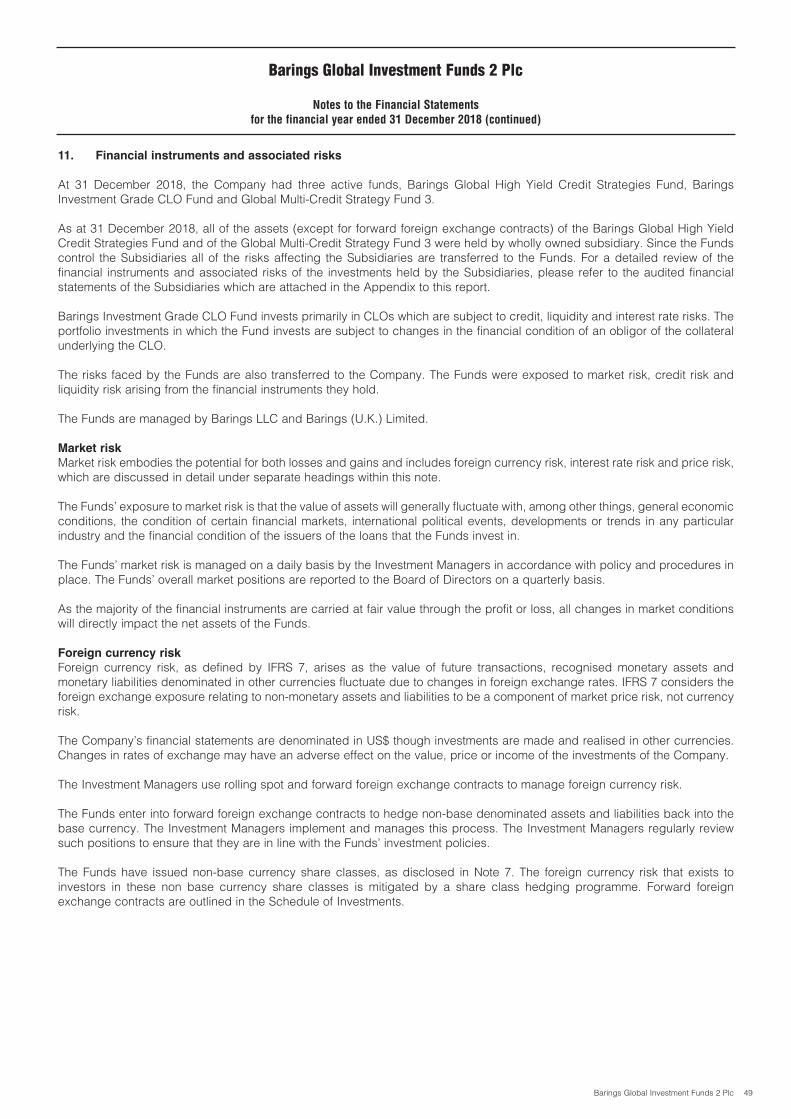
Barings Global Investment Funds 2 Plc 49
11. Financial instruments and associated risks
At 31 December 2018, the Company had three active funds, Barings Global High Yield Credit Strategies Fund, BaringsInvestment Grade CLO Fund and Global Multi-Credit Strategy Fund 3.
As at 31 December 2018, all of the assets (except for forward foreign exchange contracts) of the Barings Global High YieldCredit Strategies Fund and of the Global Multi-Credit Strategy Fund 3 were held by wholly owned subsidiary. Since the Fundscontrol the Subsidiaries all of the risks affecting the Subsidiaries are transferred to the Funds. For a detailed review of thefinancial instruments and associated risks of the investments held by the Subsidiaries, please refer to the audited financialstatements of the Subsidiaries which are attached in the Appendix to this report.
Barings Investment Grade CLO Fund invests primarily in CLOs which are subject to credit, liquidity and interest rate risks. Theportfolio investments in which the Fund invests are subject to changes in the financial condition of an obligor of the collateralunderlying the CLO.
The risks faced by the Funds are also transferred to the Company. The Funds were exposed to market risk, credit risk andliquidity risk arising from the financial instruments they hold.
The Funds are managed by Barings LLC and Barings (U.K.) Limited.
Market risk
Market risk embodies the potential for both losses and gains and includes foreign currency risk, interest rate risk and price risk,which are discussed in detail under separate headings within this note.
The Funds’ exposure to market risk is that the value of assets will generally fluctuate with, among other things, general economicconditions, the condition of certain financial markets, international political events, developments or trends in any particularindustry and the financial condition of the issuers of the loans that the Funds invest in.
The Funds’ market risk is managed on a daily basis by the Investment Managers in accordance with policy and procedures inplace. The Funds’ overall market positions are reported to the Board of Directors on a quarterly basis.
As the majority of the financial instruments are carried at fair value through the profit or loss, all changes in market conditionswill directly impact the net assets of the Funds.
Foreign currency risk
Foreign currency risk, as defined by IFRS 7, arises as the value of future transactions, recognised monetary assets andmonetary liabilities denominated in other currencies fluctuate due to changes in foreign exchange rates. IFRS 7 considers theforeign exchange exposure relating to non-monetary assets and liabilities to be a component of market price risk, not currencyrisk.
The Company’s financial statements are denominated in US$ though investments are made and realised in other currencies.Changes in rates of exchange may have an adverse effect on the value, price or income of the investments of the Company.
The Investment Managers use rolling spot and forward foreign exchange contracts to manage foreign currency risk.
The Funds enter into forward foreign exchange contracts to hedge non-base denominated assets and liabilities back into thebase currency. The Investment Managers implement and manages this process. The Investment Managers regularly reviewsuch positions to ensure that they are in line with the Funds’ investment policies.
The Funds have issued non-base currency share classes, as disclosed in Note 7. The foreign currency risk that exists toinvestors in these non base currency share classes is mitigated by a share class hedging programme. Forward foreignexchange contracts are outlined in the Schedule of Investments.
Barings Global Investment Funds 2 Plc
Notes to the Financial Statementsfor the financial year ended 31 December 2018 (continued)

Barings Global Investment Funds 2 Plc 50
11. Financial instruments and associated risks (continued)
Foreign currency risk (continued)
The following table sets out the shareholders’ total exposure to foreign currency risk and the net exposure to foreign currenciesof the monetary assets and liabilities as at 31 December 2018. Foreign currency risk that exists at a subsidiary level is hedgedby forward foreign exchange contracts eliminating all material foreign currency risk that could impact the fair value of theinvestments.
Barings Global High Yield Credit Strategies Fund
Financial assets and Forward foreign
liabilities at fair value Cash and cash Other assets exchange
through profit or loss equivalents and liabilities* contracts** Net exposure % of
US$ US$ US$ US$ US$ Exposure
CAD - - (13,876,097) 13,912,855 36,758 0.00EUR - - (2,227,314) 2,232,948 5,634 0.00GBP - - (2,566,897,085) 2,572,493,494 5,596,409 0.19NOK - - (15,232,588) 15,269,388 36,800 0.00
Barings Investment Grade CLO Fund
Financial assets and Forward foreign
liabilities at fair value Cash and cash Other assets exchange
through profit or loss equivalents and liabilities* contracts** Net exposure % of
US$ US$ US$ US$ US$ Exposure
CAD - - (148,894) 148,850 (44) (0.00)EUR 76,726,142 225 193,663 (78,255,403) (1,335,373) (0.27)GBP - 1 (491,814,709) 491,642,243 (172,465) (0.03)NOK - - (313,748) 313,615 (133) (0.00)
**Other assets and liabilities is comprised mainly of trade payables, trade receivables and liabilities to holders of Redeemable Shares.**The forward foreign contracts held are for share class hedging purposes.
Global Multi-Credit Strategy Fund 3 is not exposed to material foreign currency risk and the net exposure to foreign currenciesof the monetary assets and liabilities as at 31 December 2018.
The following table sets out the shareholders’ total exposure to foreign currency risk and the net exposure to foreign currenciesof the monetary assets and liabilities as at 31 December 2017. Foreign currency risk that exists at a subsidiary level is hedgedby forward foreign exchange contracts eliminating all material foreign currency risk that could impact the fair value of theinvestments.
Barings Global High Yield Credit Strategies Fund
Financial assets and Forward foreign
liabilities at fair value Cash and cash Other assets exchange
through profit or loss equivalents and liabilities* contracts** Net exposure % of
US$ US$ US$ US$ US$ Exposure
CAD - - (15,226,930) 15,199,874 (27,056) (0.00)EUR - - (1,726,053) 1,719,304 (6,749) (0.00)GBP - - (2,185,975,128) 2,176,326,158 (9,648,970) (0.41)NOK - - (9,241,008) 9,202,886 (38,122) (0.00)
Barings Global Investment Funds 2 Plc
Notes to the Financial Statementsfor the financial year ended 31 December 2018 (continued)

Barings Global Investment Funds 2 Plc 51
11. Financial instruments and associated risks (continued)
Foreign currency risk (continued)
Barings Investment Grade CLO Fund
Financial assets and Forward foreign
liabilities at fair value Cash and cash Other assets exchange
through profit or loss equivalents and liabilities* contracts** Net exposure % of
US$ US$ US$ US$ US$ Exposure
CAD - - (162,210) 161,735 (475) (0.00)EUR 53,724,632 601 (11,904,917) (42,130,294) (309,978) (0.07)GBP - 1 (468,257,951) 466,089,619 (2,168,331) (0.46)NOK - - (333,665) 331,830 (1,835) (0.00)
**Other assets and liabilities is comprised mainly of trade payables, trade receivables and liabilities to holders of Redeemable Shares.**The forward foreign contracts held are for share class hedging purposes.
Global Multi-Credit Strategy Fund 3 is not exposed to material foreign currency risk and the net exposure to foreign currenciesof the monetary assets and liabilities as at 31 December 2017.
Sensitivity analysisThe following currency sensitivity analysis information is a relative estimate of risk and is not intended to be a precise andaccurate number. The calculations are based on historical data. Future rate movements and correlations between currenciescould vary significantly from those experienced in the past.
At 31 December 2018, had the exchange rate increased or decreased by 5% with all other variables held constant, the increaseor decrease respectively in the value of the shareholders’ investments, denominated in currencies other than the base currencyof the relevant Fund, attributable to holders of redeemable shares and the change in net assets attributable to holders ofredeemable shares per the Statement of Comprehensive Income would be as follows:
Barings Barings Barings Barings
Global High Yield Investment Global High Yield Investment
Credit Strategies Grade CLO Credit Strategies Grade CLO
Fund Fund Fund Fund
31 Dec 2018 31 Dec 2018 31 Dec 2017 31 Dec 2017
US$ US$ US$ US$
CAD 1,838 (2) (1,353) (24)EUR 282 (66,769) (337) (15,499)GBP 279,820 (8,623) (482,449) (108,417)NOK 1,840 7 (1,906) (92)
Interest rate risk
The Company is exposed to the risk that the fair value or future cash flows of its financial instruments will fluctuate as a resultof changes in market interest rates. The majority of Barings Global High Yield Credit Strategies Fund investments and of GlobalMulti-Credit Strategy Fund 3 are held by wholly owned Subsidiaries, therefore, the associated risks of the Subsidiaries arecurrently substantially the same as the risks associated with the Funds. For a detailed review of the financial instruments andassociated risks of the investment in the Subsidiaries, please refer to the audited financial statements of the Subsidiaries whichare attached in the Appendix to these financial statements.
Barings Investment Grade CLO Fund is exposed to interest rate risk on the loans held and on a look-through basis to theunderlying assets in the CLOs. The following tables detail the Fund’s exposure to interest rate risks. They include the Fund’sassets and trading liabilities at fair value categorised by maturity date and measured by the carrying value of the assets andliabilities at 31 December 2018 and at 31 December 2017:
Barings Global Investment Funds 2 Plc
Notes to the Financial Statementsfor the financial year ended 31 December 2018 (continued)

Barings Global Investment Funds 2 Plc 52
Barings Global Investment Funds 2 Plc
Notes to the Financial Statementsfor the financial year ended 31 December 2018 (continued)
11. Financial instruments and associated risks (continued)
Interest rate risk (continued)
31 December 2018
Barings Investment Grade CLO Fund Greater than Non-interest
Within 1 year 1-5 years 5 years bearing Total
Assets US$ US$ US$ US$ US$
Financial Assets at fair value through profit or loss- Collateral loan obligations - - 501,945,630 - 501,945,630 - Forward foreign exchange contracts - - - 70,159 70,159 Amortised cost:Receivable for fund investment sold - - - 306 306 Other receivables - - - 4,302,956 4,302,956 Cash and cash equivalents 706,988 - - - 706,988
–––––––––––––– –––––––––––––– –––––––––––––– –––––––––––––– ––––––––––––––Total assets 706,988 - 501,945,630 4,373,421 507,026,039
–––––––––––––– –––––––––––––– –––––––––––––– –––––––––––––– ––––––––––––––Liabilities
Held for trading:- Forward foreign exchange contracts - - - (2,534,719) (2,534,719) Amortised cost:- Payable for fund shares redeemed- Income Distribution Payable - - - (1,710,561) (1,710,561)- Other payables and accrued expenses - - - (138,792) (138,792)
–––––––––––––– –––––––––––––– –––––––––––––– –––––––––––––– ––––––––––––––Total liabilities - - - (4,384,072) (4,384,072)
–––––––––––––– –––––––––––––– –––––––––––––– –––––––––––––– ––––––––––––––Total interest sensitivity gap 706,988 - 501,945,630
–––––––––––––– –––––––––––––– ––––––––––––––
31 December 2017
Barings Investment Grade CLO Fund Greater than Non-interest
Within 1 year 1-5 years 5 years bearing Total
Assets US$ US$ US$ US$ US$
Financial assets at fair value through profit or loss:- Collateral Loan Obligations 20,085,709 - 466,297,248 - 486,382,957Held for trading:- Forward foreign exchange contracts - - - 2,251,824 2,251,824Cash and cash equivalents 6,517,879 - - - 6,517,879Other receivables - - - 3,314,845 3,314,845
–––––––––––––– –––––––––––––– –––––––––––––– –––––––––––––– ––––––––––––––Total assets 26,603,588 - 466,297,248 5,566,669 498,467,505
–––––––––––––– –––––––––––––– –––––––––––––– –––––––––––––– ––––––––––––––Liabilities
Financial liabilities at fair value through profit or loss:Held for trading:- Forward foreign exchange contracts - - - (659,871) (659,871)Income Distribution Payable - - - (1,563,726) (1,563,726)Payable for investments purchased - - - (21,585,993) (21,585,993)Other payables and accrued expenses - - - (140,913) (140,913)
–––––––––––––– –––––––––––––– –––––––––––––– –––––––––––––– ––––––––––––––Total liabilities - - - (23,950,503) (23,950,503)
–––––––––––––– –––––––––––––– –––––––––––––– –––––––––––––– ––––––––––––––Total interest sensitivity gap 26,603,588 - 466,297,248
–––––––––––––– –––––––––––––– ––––––––––––––

Barings Global Investment Funds 2 Plc 53
11. Financial instruments and associated risks (continued)
Interest rate risk (continued)
Interest rate sensitivityThe below interest rate sensitivity analysis information is a relative estimate of risk and is not intended to be a precise andaccurate number. The calculations are based on historical data. Future interest rate movements could vary significantly fromthose experienced in the past.
Interest rate risk sensitivity is only included below for the Barings Investment Grade CLO Fund as Barings Global High YieldCredit Strategies Fund and Global Multi-Credit Fund 3 have subsidiaries and therefore they are not subject to interest rate risk.
Based on the relevant portfolio’s composition as at 31 December 2018, the corresponding increase/(decrease) in change innet assets attributable to holders of redeemable shares, from an increase/(decrease) in average interest rates would be asfollows:
Barings Investment Grade CLO Fund
Interest Interest
rate change % Effect of NAV rate change % Effect of NAV
% 31 Dec 2018 % 31 Dec 2018
-0.50 +0.06 +0.50 (0.06)-0.75 +0.09 +0.75 (0.09)-1.00 +0.13 +1.00 (0.13)
Based on the relevant portfolio’s composition as at 31 December 2017, the corresponding increase/(decrease) in change innet assets attributable to holders of redeemable shares, from an increase/(decrease) in average interest rates would be asfollows:
Barings Investment Grade CLO Fund
Interest Interest
rate change % Effect of NAV rate change % Effect of NAV
% 31 Dec 2017 % 31 Dec 2017
-0.50 +0.06 +0.50 (0.06)-0.75 +0.09 +0.75 (0.09)-1.00 +0.12 +1.00 (0.12)
Price risk
The majority of the Funds’ financial instruments are carried at fair value on the Statement of Financial Position. Usually the fairvalue of the financial instruments can be reliably determined within a reasonable range of estimates. For certain other financialinstruments, including other receivables, accounts payable and accrued expenses, the carrying amounts approximate fairvalue due to the immediate or short-term nature of these financial instruments.
The carrying amounts of all of the Funds’ financial assets and financial liabilities at the financial year end date approximatedtheir fair values.
Fair value estimates are made at a specific point in time, based on market conditions and information about the financialinstrument. These estimates are subjective in nature and involve uncertainties and matters of significant judgement (e.g.,interest rates, volatility, estimated cash flows etc.) and therefore, cannot be determined with precision.
Sensitivity analysisThe below price sensitivity analysis information is a relative estimate of risk and is not intended to be a precise and accuratenumber. The calculations are based on historical data. Future price movements could vary significantly from those experiencedin the past.
A 5% increase in investment prices at 31 December 2018, would have increased the value of investments at fair value throughprofit or loss by US$181,080,394 (31 December 2017: US$153,529,848).
Barings Global Investment Funds 2 Plc
Notes to the Financial Statementsfor the financial year ended 31 December 2018 (continued)

Barings Global Investment Funds 2 Plc 54
Barings Global Investment Funds 2 Plc
Notes to the Financial Statementsfor the financial year ended 31 December 2018 (continued)
11. Financial instruments and associated risks (continued)
Credit risk
Credit risk is the risk that a counterparty to a financial instrument will fail to discharge an obligation or commitment that it hasentered into with the Funds, resulting in a financial loss to the Funds.
The Funds’ Investment Managers analyse credit concentration based on the counterparty, industry and geographical locationof the financial assets that the Funds hold. Barings Global High Yield Credit Strategies Fund exposure and Global Multi-CreditStrategy Fund 3 exposure are viewed on a look through basis of the holding of their Subsidiaries. Details are included in theaudited financial statements of the Subsidiaries which are attached in the Appendix to this report. The credit risk concentrationof Barings Investment Grade CLO Fund is spread between a number of counterparties.
The top ten holdings represent the following percentage of the respective portfolio:
Fund 31 Dec 2018 31 Dec 2017
Barings Investment Grade CLO Fund 16.41% 13.70%
The Funds may utilise forward foreign exchange contracts to seek to hedge against declines in the value of the Funds’ positionsas a result of changes in foreign currency exchange rates. The Funds are exposed to credit risk associated with the forwardforeign exchange contract counterparties with whom it trades and will also bear the risk of settlement default.
None of the financial assets and financial liabilities are offset in the Statement of Financial Position. The Company’s financialassets and financial liabilities are subject to an enforceable master netting arrangement or similar agreement that covers similarfinancial instruments. While the terms and conditions of these agreements may vary, all transactions under any such agreementconstitute a single contractual relationship. Each party’s obligation to make any payments, deliveries or other transfers inrespect of any transaction under such an agreement may be netted against the other party’s obligations under such agreement.A default by a party in performance with respect to one transaction under such an agreement would give the other party theright to terminate all transactions under such agreement and calculate one net amount owed from one party to the other. Thefollowing tables present information about the offsetting of derivative instruments.
As at 31 December 2018, Barings Global High Yield Credit Strategies Fund’s derivative assets and liabilities are as follows:
Value of
derivative Financial Collateral Collateral
Description Counterparty assets Instrument received pledged Net
US$ US$ US$ US$ US$
Forward foreign exchange contracts State Street Bank 886,887 (886,887) - - -–––––––––––––– –––––––––––––– –––––––––––––– –––––––––––––– ––––––––––––––
886,887 (886,887) - - -–––––––––––––– –––––––––––––– –––––––––––––– –––––––––––––– –––––––––––––––––––––––––––– –––––––––––––– –––––––––––––– –––––––––––––– ––––––––––––––
Value of
derivative Financial Collateral Collateral
Description Counterparty liabilities Instrument received pledged Net
US$ US$ US$ US$ US$
Forward foreign exchange contracts State Street Bank (12,245,424) 886,887 - - (11,358,537)–––––––––––––– –––––––––––––– –––––––––––––– –––––––––––––– ––––––––––––––
(12,245,424) 886,887 - - (11,358,537)–––––––––––––– –––––––––––––– –––––––––––––– –––––––––––––– –––––––––––––––––––––––––––– –––––––––––––– –––––––––––––– –––––––––––––– ––––––––––––––

Barings Global Investment Funds 2 Plc 55
11. Financial instruments and associated risks (continued)
Credit risk (continued)
As at 31 December 2017, Barings Global High Yield Credit Strategies Fund’s derivative assets and liabilities are as follows:
Value of
derivative Financial Collateral Collateral
Description Counterparty assets Instrument received pledged Net
US$ US$ US$ US$ US$
Forward foreign exchange contracts National Australia Bank Limited 6,651,380 - - - 6,651,380State Street Bank 4,356,448 (109,749) - - 4,246,699
–––––––––––––– –––––––––––––– –––––––––––––– –––––––––––––– ––––––––––––––11,007,828 (109,749) - - 10,898,079
–––––––––––––– –––––––––––––– –––––––––––––– –––––––––––––– –––––––––––––––––––––––––––– –––––––––––––– –––––––––––––– –––––––––––––– ––––––––––––––
Value of
derivative Financial Collateral Collateral
Description Counterparty assets Instrument received pledged Net
US$ US$ US$ US$ US$
Forward foreign exchange contracts State Street Bank (109,749) 109,749 - - -–––––––––––––– –––––––––––––– –––––––––––––– –––––––––––––– ––––––––––––––
(109,749) 109,749 - - -–––––––––––––– –––––––––––––– –––––––––––––– –––––––––––––– –––––––––––––––––––––––––––– –––––––––––––– –––––––––––––– –––––––––––––– ––––––––––––––
As at 31 December 2018, Barings Investment Grade CLO Fund’s derivative assets and liabilities are as follows:
Value of
derivative Financial Collateral Collateral
Description Counterparty assets Instrument received pledged Net
US$ US$ US$ US$ US$
Forward foreign exchange contracts State Street Bank 70,159 (70,159) - - -–––––––––––––– –––––––––––––– –––––––––––––– –––––––––––––– ––––––––––––––
70,159 (70,159) - - -–––––––––––––– –––––––––––––– –––––––––––––– –––––––––––––– –––––––––––––––––––––––––––– –––––––––––––– –––––––––––––– –––––––––––––– ––––––––––––––
Value of
derivative Financial Collateral Collateral
Description Counterparty liabilities Instrument received pledged Net
US$ US$ US$ US$ US$
Forward foreign exchange contracts State Street Bank (2,534,719) 70,159 - - (2,464,560)–––––––––––––– –––––––––––––– –––––––––––––– –––––––––––––– ––––––––––––––
(2,534,719) 70,159 - - (2,464,560)–––––––––––––– –––––––––––––– –––––––––––––– –––––––––––––– –––––––––––––––––––––––––––– –––––––––––––– –––––––––––––– –––––––––––––– ––––––––––––––
Barings Global Investment Funds 2 Plc
Notes to the Financial Statementsfor the financial year ended 31 December 2018 (continued)

Barings Global Investment Funds 2 Plc 56
Barings Global Investment Funds 2 Plc
Notes to the Financial Statementsfor the financial year ended 31 December 2018 (continued)
11. Financial instruments and associated risks (continued)
Credit risk (continued)
As at 31 December 2017, Barings Investment Grade CLO Fund’s derivative assets and liabilities are as follows:
Value of
derivative Financial Collateral Collateral
Description Counterparty assets Instrument received pledged Net
US$ US$ US$ US$ US$
Forward foreign exchange contracts State Street Bank 2,251,824 (659,871) - - 1,591,953–––––––––––––– –––––––––––––– –––––––––––––– –––––––––––––– ––––––––––––––
2,251,824 (659,871) - - 1,591,953–––––––––––––– –––––––––––––– –––––––––––––– –––––––––––––– –––––––––––––––––––––––––––– –––––––––––––– –––––––––––––– –––––––––––––– ––––––––––––––
Value of
derivative Financial Collateral Collateral
Description Counterparty liabilities Instrument received pledged Net
US$ US$ US$ US$ US$
Forward foreign exchange contracts State Street Bank (659,871) 659,871 - - -–––––––––––––– –––––––––––––– –––––––––––––– –––––––––––––– ––––––––––––––
(659,871) 659,871 - - -–––––––––––––– –––––––––––––– –––––––––––––– –––––––––––––– –––––––––––––––––––––––––––– –––––––––––––– –––––––––––––– –––––––––––––– ––––––––––––––
Barings Investment Grade CLO Fund’s financial assets exposed to credit risk were concentrated in the following geographicalareas as at 31 December 2018 and 31 December 2017:
% of Market Value % of Market Value
31 Dec 2018 31 Dec 2017
Ireland 9.22 5.99Netherlands 5.16 4.06Supra National* 0.91 1.00United Kingdom - 0.21United States 84.71 88.74
–––––––––––––– ––––––––––––––Total 100.00 100.00
–––––––––––––– –––––––––––––––––––––––––––– ––––––––––––––
*Supra National is what the Investment Manager uses for Euro deals since there is significant exposure to several countries.
At 31 December 2018 and 31 December 2017, Barings Investment Grade CLO Fund held investments with the following publicallyquoted credit ratings:
% of Market Value % of Market Value
31 Dec 2018 31 Dec 2017
A1 - 1.40A2 39.09 34.21Aa1 - 2.38Aa2 22.06 20.68Aaa 10.43 12.35Baa1 0.50 0.93Baa2 3.89 8.23Baa3 23.05 19.82BBB 0.98 -
–––––––––––––– ––––––––––––––Total 100.00 100.00
–––––––––––––– –––––––––––––––––––––––––––– ––––––––––––––

Barings Global Investment Funds 2 Plc 57
11. Financial instruments and associated risks (continued)
Credit risk (continued)
Credit risk arising on transactions with brokers relates to transactions awaiting settlement. The Funds monitor the credit ratingand financial positions of the brokers used to mitigate this risk. The Investment Managers also monitor the settlement processon a regular basis.
The nature of the non-publically rated assets is entirely consistent with the loan market. The Investment Managers undertakeextensive due diligence on all deals before initial investment. Post initial approval by the credit committee and throughout theholding period of the investment, the Investment Managers continually evaluate the investment’s performance including suchmeasures as reviewing pricing levels, monthly accounts, budgets and meeting management, where appropriate.
Investments in CLOs are dependent on the Investment Manager’s credit analysis, the Investment Manager employs its owncredit research and analysis, which includes a study of existing debt, capital structure, ability to service debt and to paydividends, the issuer’s sensitivity to economic conditions, its operating history and the current trend of earnings.
CLO’s generally are subordinated to certain other obligations of the issuer. CLO issuers may acquire interests in loans and otherdebt obligations by way of sale, assignment or participation.
At 31 December 2018 and 31 December 2017, Barings Investment Grade CLO Funds’ CLO's consisted of the following:
31 Dec 2018 31 Dec 2017
US$ US$
Senior CLO’s 175,770,238 165,082,716Mezzanine CLO’s 326,175,392 301,214,532Equity CLO’s - 20,085,709
–––––––––––––– ––––––––––––––Total 501,945,630 486,382,957
–––––––––––––– –––––––––––––––––––––––––––– ––––––––––––––
As at 31 December 2018, the Company’s financial assets exposed to credit risk are as follows:
Barings Barings
Global High Yield Investment Global
Credit Strategies Grade CLO Multi-Credit
Fund Fund Strategy Fund 3
US$ US$ GBP
Loan to Subsidiary 2,893,366,496 - 175,928,570Investments - 501,945,630 -Forward foreign exchange contracts 886,887 70,159 -Other receivables 302,724 4,303,262 -Cash and cash equivalents - 706,988 -
–––––––––––––– –––––––––––––– ––––––––––––––Total 2,894,556,107 507,026,039 175,928,570
–––––––––––––– –––––––––––––– –––––––––––––––––––––––––––– –––––––––––––– ––––––––––––––
Barings Global Investment Funds 2 Plc
Notes to the Financial Statementsfor the financial year ended 31 December 2018 (continued)

Barings Global Investment Funds 2 Plc 58
11. Financial instruments and associated risks (continued)
Credit risk (continued)
As at 31 December 2017, the Company’s financial assets exposed to credit risk are as follows:
Barings Barings
Global High Yield Investment Global
Credit Strategies Grade CLO Multi-Credit
Fund Fund Strategy Fund 3
US$ US$ GBP
Investments 2,340,913,506 486,382,957 180,202,464Forward foreign exchange contracts 11,007,828 2,251,824 -Other receivables - 3,314,845 -Cash and cash equivalents - 6,517,879 -
–––––––––––––– –––––––––––––– ––––––––––––––Total 2,351,921,334 498,467,505 180,202,464
–––––––––––––– –––––––––––––– –––––––––––––––––––––––––––– –––––––––––––– ––––––––––––––
Amounts in the above tables are based on the carrying value of the financial assets as at the financial year/period end date.
Substantially all of the assets of the Funds (including cash) are held by the Custodian, State Street Custodial Services (Ireland)Limited. Bankruptcy or insolvency of the Custodian may cause the Funds’ rights with respect to securities held by the Custodianto be delayed or limited. The Funds monitor their risk by monitoring the credit quality and financial positions of the Custodianthe Funds use. The long-term credit rating of the parent company of the Custodian, State Street Corporation as at 31 December2018 was A (31 December 2017: A). The Funds’ assets and cash are maintained within the Custodian’s custodial network insegregated accounts. The Custodian will ensure that any agent it appoints to assist in safekeeping the assets of the Funds willsegregate these assets. Thus in the event of insolvency or bankruptcy of the Custodian, the Funds’ assets are segregated andprotected and this further reduces counterparty risk.
Liquidity risk
Liquidity risk is the risk that the Funds will encounter difficulty in meeting obligations arising from its financial liabilities that aresettled by delivering cash or another financial asset, or that such obligations will have to be settled in a manner that isdisadvantageous to the Funds.
The Funds’ constitutional documentation makes provision for a range of measures to assist with the management of liquidity onan on-going basis, including, for example, the deferral of redemption applications. The Funds are typically managed with asmall ‘buffer’ of cash (to minimise the cash drag impact on returns for investors at the subsidiary level) but also typically haveinvestments in senior secured public fixed or floating rate notes whose settlement period (T+3 through Euroclear) permits morerapid sale where this might be required for liquidity purposes.
Due to liquidity constraints in the structured credit market, where a Fund receives substantial redemption requests, theInvestment Manager may be obliged to dispose of investments of that Fund in advance of the relevant Dealing Day. Any sale ofa particular Fund’s assets prior to the relevant Dealing Day could have a negative impact on the performance of that Fund, asthe Fund will not be pursuing its investment objective in respect of the portion of its assets held in cash or other liquid assetspending the redemption of shares. Each Fund will seek to be well diversified. However, in the event of a material demand forredemptions, a Fund could be forced to sell liquid positions resulting in an over-weighting in a small number of illiquid investment.In such circumstances, the aggregate return of the relevant Fund may be substantially and adversely affected by theunfavourable performance of a single investment. The Funds’ restriction of redemptions of shares in excess of fifteen per cent ofthe total Net Asset Value of the relevant Fund on any one Dealing Day may mitigate this risk should these circumstances arise.
Barings Global Investment Funds 2 Plc
Notes to the Financial Statementsfor the financial year ended 31 December 2018 (continued)
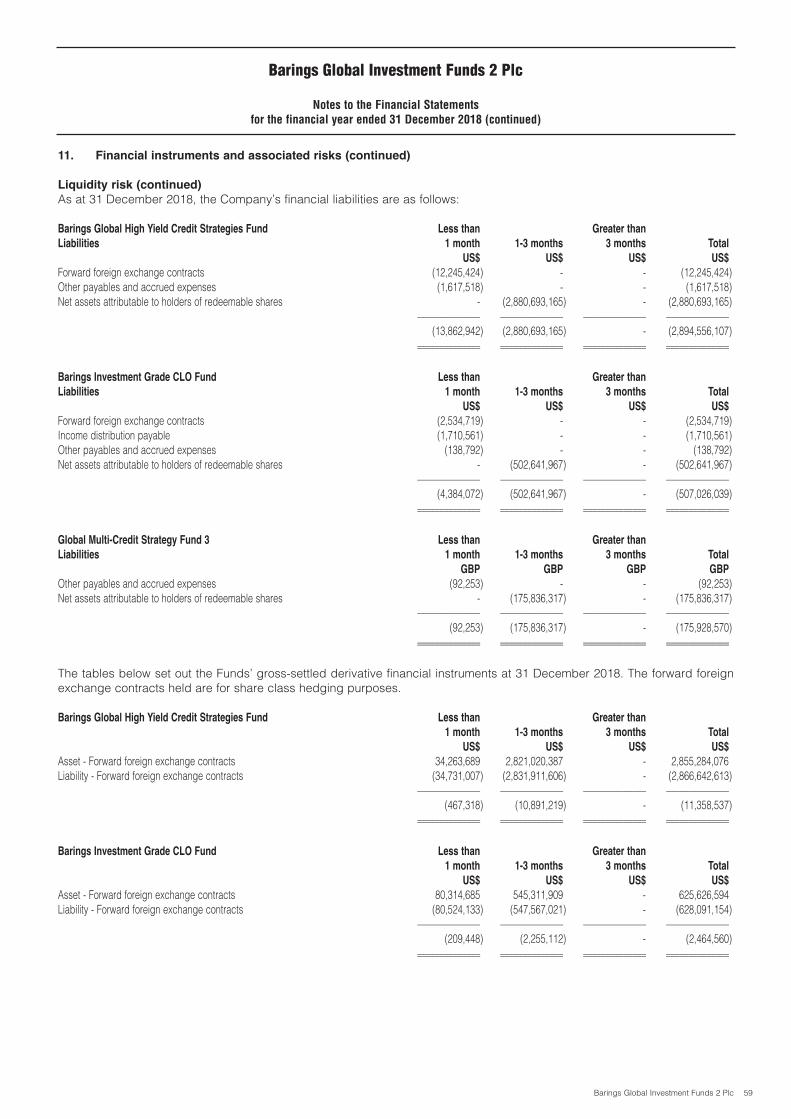
Barings Global Investment Funds 2 Plc 59
11. Financial instruments and associated risks (continued)
Liquidity risk (continued)
As at 31 December 2018, the Company’s financial liabilities are as follows:
Barings Global High Yield Credit Strategies Fund Less than Greater than
Liabilities 1 month 1-3 months 3 months Total
US$ US$ US$ US$
Forward foreign exchange contracts (12,245,424) - - (12,245,424)Other payables and accrued expenses (1,617,518) - - (1,617,518)Net assets attributable to holders of redeemable shares - (2,880,693,165) - (2,880,693,165)
–––––––––––––– –––––––––––––– –––––––––––––– ––––––––––––––(13,862,942) (2,880,693,165) - (2,894,556,107)
–––––––––––––– –––––––––––––– –––––––––––––– –––––––––––––––––––––––––––– –––––––––––––– –––––––––––––– ––––––––––––––
Barings Investment Grade CLO Fund Less than Greater than
Liabilities 1 month 1-3 months 3 months Total
US$ US$ US$ US$
Forward foreign exchange contracts (2,534,719) - - (2,534,719)Income distribution payable (1,710,561) - - (1,710,561)Other payables and accrued expenses (138,792) - - (138,792)Net assets attributable to holders of redeemable shares - (502,641,967) - (502,641,967)
–––––––––––––– –––––––––––––– –––––––––––––– ––––––––––––––(4,384,072) (502,641,967) - (507,026,039)
–––––––––––––– –––––––––––––– –––––––––––––– –––––––––––––––––––––––––––– –––––––––––––– –––––––––––––– ––––––––––––––
Global Multi-Credit Strategy Fund 3 Less than Greater than
Liabilities 1 month 1-3 months 3 months Total
GBP GBP GBP GBP
Other payables and accrued expenses (92,253) - - (92,253)Net assets attributable to holders of redeemable shares - (175,836,317) - (175,836,317)
–––––––––––––– –––––––––––––– –––––––––––––– ––––––––––––––(92,253) (175,836,317) - (175,928,570)
–––––––––––––– –––––––––––––– –––––––––––––– –––––––––––––––––––––––––––– –––––––––––––– –––––––––––––– ––––––––––––––
The tables below set out the Funds’ gross-settled derivative financial instruments at 31 December 2018. The forward foreignexchange contracts held are for share class hedging purposes.
Barings Global High Yield Credit Strategies Fund Less than Greater than
1 month 1-3 months 3 months Total
US$ US$ US$ US$
Asset - Forward foreign exchange contracts 34,263,689 2,821,020,387 - 2,855,284,076 Liability - Forward foreign exchange contracts (34,731,007) (2,831,911,606) - (2,866,642,613)
–––––––––––––– –––––––––––––– –––––––––––––– ––––––––––––––(467,318) (10,891,219) - (11,358,537)
–––––––––––––– –––––––––––––– –––––––––––––– –––––––––––––––––––––––––––– –––––––––––––– –––––––––––––– ––––––––––––––
Barings Investment Grade CLO Fund Less than Greater than
1 month 1-3 months 3 months Total
US$ US$ US$ US$
Asset - Forward foreign exchange contracts 80,314,685 545,311,909 - 625,626,594Liability - Forward foreign exchange contracts (80,524,133) (547,567,021) - (628,091,154)
–––––––––––––– –––––––––––––– –––––––––––––– ––––––––––––––(209,448) (2,255,112) - (2,464,560)
–––––––––––––– –––––––––––––– –––––––––––––– –––––––––––––––––––––––––––– –––––––––––––– –––––––––––––– ––––––––––––––
Barings Global Investment Funds 2 Plc
Notes to the Financial Statementsfor the financial year ended 31 December 2018 (continued)

Barings Global Investment Funds 2 Plc 60
11. Financial instruments and associated risks (continued)
Liquidity risk (continued)
As at 31 December 2017, the Company’s financial liabilities are as follows:
Barings Global High Yield Credit Strategies Fund Less than Greater than
Liabilities 1 month 1-3 months 3 months Total
US$ US$ US$ US$
Forward foreign exchange contracts (109,749) - - (109,749)Other payables and accrued expenses (1,265,506) - - (1,265,506)Net assets attributable to holders of redeemable shares - (2,350,546,079) - (2,350,546,079)
–––––––––––––– –––––––––––––– –––––––––––––– ––––––––––––––(1,375,255) (2,350,546,079) - (2,351,921,334)
–––––––––––––– –––––––––––––– –––––––––––––– –––––––––––––––––––––––––––– –––––––––––––– –––––––––––––– ––––––––––––––
Barings Investment Grade CLO Fund Less than Greater than
Liabilities 1 month 1-3 months 3 months Total
US$ US$ US$ US$
Forward foreign exchange contracts (659,871) - - (659,871)Income distribution payable (1,563,726) - - (1,563,726)Other payables and accrued expenses (21,726,906) - - (21,726,906)Net assets attributable to holders of redeemable shares - (474,517,002) - (474,517,002)
–––––––––––––– –––––––––––––– –––––––––––––– ––––––––––––––(23,950,503) (474,517,002) - (498,467,505)
–––––––––––––– –––––––––––––– –––––––––––––– –––––––––––––––––––––––––––– –––––––––––––– –––––––––––––– ––––––––––––––
Global Multi-Credit Strategy Fund 3 Less than Greater than
Liabilities 1 month 1-3 months 3 months Total
GBP GBP GBP GBP
Other payables and accrued expenses (17,165) - - (17,165)Net assets attributable to holders of redeemable shares - (180,185,299) - (180,185,299)
–––––––––––––– –––––––––––––– –––––––––––––– ––––––––––––––(17,165) (180,185,299) - (180,202,464)
–––––––––––––– –––––––––––––– –––––––––––––– –––––––––––––––––––––––––––– –––––––––––––– –––––––––––––– ––––––––––––––
The tables below set out the Funds’ gross-settled derivative financial instruments at 31 December 2017. The forward foreignexchange contracts held are for share class hedging purposes.
Barings Global High Yield Credit Strategies Fund Less than Greater than
1 month 1-3 months 3 months Total
US$ US$ US$ US$
Asset - Forward foreign exchange contracts 2,251,062,067 - - 2,251,062,067Liability - Forward foreign exchange contracts (2,240,163,988) - - (2,240,163,988)
–––––––––––––– –––––––––––––– –––––––––––––– ––––––––––––––10,898,079 - - 10,898,079
–––––––––––––– –––––––––––––– –––––––––––––– –––––––––––––––––––––––––––– –––––––––––––– –––––––––––––– ––––––––––––––
Barings Global Investment Funds 2 Plc
Notes to the Financial Statementsfor the financial year ended 31 December 2018 (continued)

Barings Global Investment Funds 2 Plc 61
11. Financial instruments and associated risks (continued)
Liquidity risk (continued)
Barings Investment Grade CLO Fund Less than Greater than
1 month 1-3 months 3 months Total
US$ US$ US$ US$
Asset - Forward foreign exchange contracts 515,488,218 - - 515,488,218Liability - Forward foreign exchange contracts (513,896,265) - - (513,896,265)
–––––––––––––– –––––––––––––– –––––––––––––– ––––––––––––––1,591,953 - - 1,591,953
–––––––––––––– –––––––––––––– –––––––––––––– –––––––––––––––––––––––––––– –––––––––––––– –––––––––––––– ––––––––––––––
12. Interests in other entities
Interests in Unconsolidated Structured Entities
IFRS 12 defines a structured entity as an entity that has been designed so that voting or similar rights are not the dominantfactor in deciding who controls the entity, such as when any voting rights relate to the administrative tasks only and the relevantactivities are directed by means of contractual agreements. A structured entity often has some of the following features orattributes:• restricted activities;• a narrow and well defined objective;• insufficient equity to permit the structured entity to finance its activities without subordinated financial support; and• financing in the form of multiple contractually linked instruments that create concentrations of credit or other risks.
Involvement with Unconsolidated Structured Entities
The Company has concluded that the CLOs in which Barings Investment Grade CLO Fund invests, but does not consolidatemeets the definition of structural entities because:• the voting rights in the CLOs are not the dominant rights in deciding who controls them, as they relate to administrator
tasks only;• Each CLOs activities are restricted by its Prospectus; and• The CLOs have narrow and well defined objectives to provide investment opportunities to investors.
Investment entityTo comply with the amendment to IFRS 10 and to be exempt from preparing consolidated financial statements, the Companymust meet the definition of an investment entity. The Company is satisfied that it meets both the required criteria and typicalcharacteristics of an investment entity as specified in Note 2.
Barings Global Investment Funds 2 Plc
Notes to the Financial Statementsfor the financial year ended 31 December 2018 (continued)

Barings Global Investment Funds 2 Plc 62
12. Interests in other entities (continued)
Involvement with Unconsolidated Structured Entities (continued)
SubsidiaryAs at 31 December 2018, the company had two Subsidiaries, Barings Global High Yield Credit Strategies Limited and BaringsGlobal Multi-Credit Strategy 3 Limited, which are investments in unconsolidated structured entities and they are 100%Subsidiaries of Barings Global Investment Funds 2 plc. As detailed in Note 2, the Company has determined that theSubsidiaries continue to meet the definition of a subsidiary under the provisions of IFRS 10. Subsidiaries are entities under theCompany’s control. The Company controls an entity when it is exposed to, or has rights to, variable returns from its involvementwith the entity and has the ability to affect those returns through power over the entity which is the case in this instance.
Therefore the Subsidiary is treated as a simple investment and is measured at fair value through profit or loss.
Interest in unconsolidated structured entity subsidiary as at 31 December 2018:
Barings Global High Yield Credit Strategies Fund
% of Total
Financial
Barings’s Assets at Maximum
Line item in Statement Size of SEs Holding Fair Value exposure
of Financial No of Notional Fair Value through to losses
Structured Entity (“SE”) Position Investments in US$m in US$m Profit or Loss in US$m
Barings Global High Yield Financial assets at fair valueCredit Strategies Limited through profit or loss 1 2,893 2,893 100.00 2,893
Global Multi-Credit Strategy Fund 3
% of Total
Financial
Barings’s Assets at Maximum
Line item in Statement Size of SEs Holding Fair Value exposure
of Financial No of Notional Fair Value through to losses
Structured Entity (“SE”) Position Investments in GBPm in GBPm Profit or Loss in GBPm
Barings Global Multi-Credit Financial assets at fair valueStrategy 3 Limited through profit or loss 1 176 176 100.00 176
Unconsolidated structured entity (non-subsidiary) as at 31 December 2018:
Barings Investment Grade CLO Fund
% of Total
Financial
Range of the Average Barings’s Assets at Maximum
Line item in Statement size of SEs Notional Holding Fair Value exposure
of Financial No of Notional of SEs Fair Value through to losses
Structured Entities (“SE”) Position Investments in US$m in US$m in US$m Profit or Loss in US$m
CDO/CLO Financial assets at fair valuethrough profit or loss 163 7-355 47 502 100.00 502
Barings Global Investment Funds 2 Plc
Notes to the Financial Statementsfor the financial year ended 31 December 2018 (continued)

Barings Global Investment Funds 2 Plc 63
12. Interests in other entities (continued)
Involvement with Unconsolidated Structured Entities (continued)
Interest in unconsolidated structured entity subsidiary as at 31 December 2017:
Barings Global High Yield Credit Strategies Fund
% of Total
Financial
Barings’s Assets at Maximum
Line item in Statement Size of SEs Holding Fair Value exposure
of Financial No of Notional Fair Value through to losses
Structured Entity (“SE”) Position Investments in US$m in US$m Profit or Loss in US$m
Barings Global High Yield Financial assets at fair valueCredit Strategies Limited through profit or loss 1 2,341 2,341 100.00 2,341
Global Multi-Credit Strategy Fund 3
% of Total
Financial
Barings’s Assets at Maximum
Line item in Statement Size of SEs Holding Fair Value exposure
of Financial No of Notional Fair Value through to losses
Structured Entity (“SE”) Position Investments in GBPm in GBPm Profit or Loss in GBPm
Barings Global Multi-Credit Financial assets at fair valueStrategy 3 Limited through profit or loss 1 180 180 100.00 180
Unconsolidated structured entity (non-subsidiary) as at 31 December 2017:
Barings Investment Grade CLO Fund
% of Total
Financial
Range of the Average Barings’s Assets at Maximum
Line item in Statement size of SEs Notional Holding Fair Value exposure
of Financial No of Notional of SEs Fair Value through to losses
Structured Entities (“SE”) Position Investments in US$m in US$m in US$m Profit or Loss in US$m
CDO/CLO Financial assets at fair valuethrough profit or loss 173 7-832 58 486 100.00 486
Barings Global Investment Funds 2 Plc
Notes to the Financial Statementsfor the financial year ended 31 December 2018 (continued)
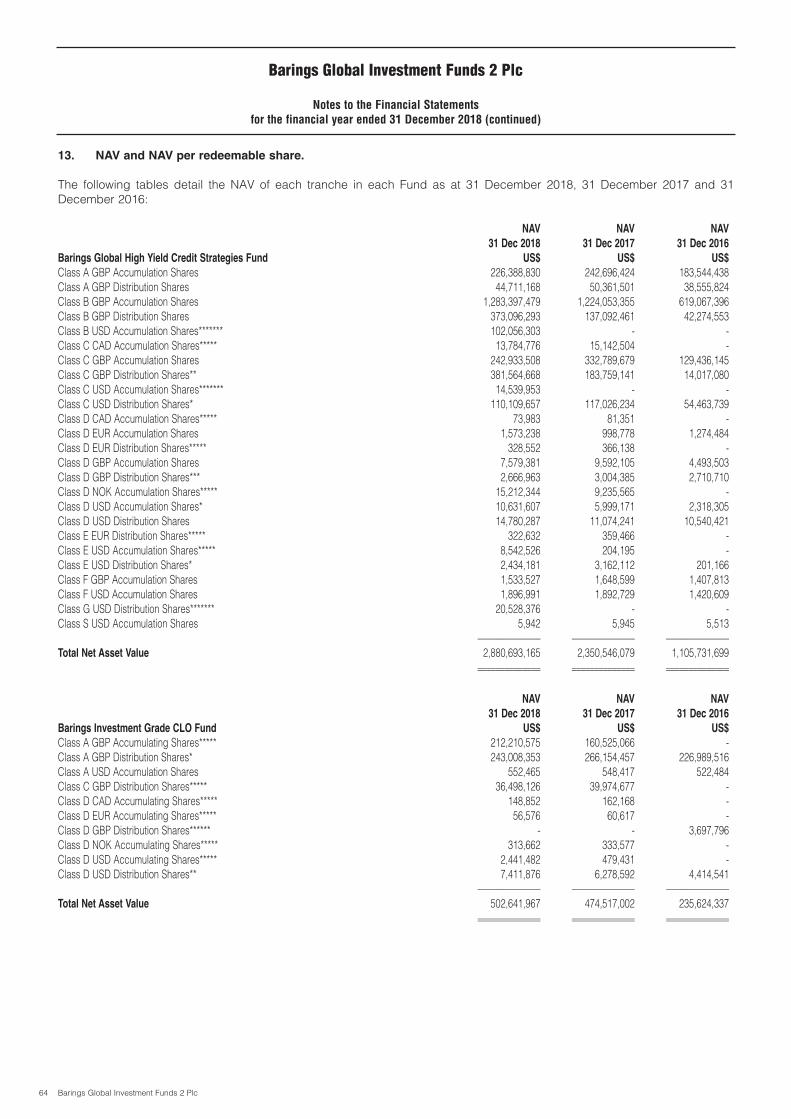
Barings Global Investment Funds 2 Plc 64
13. NAV and NAV per redeemable share.
The following tables detail the NAV of each tranche in each Fund as at 31 December 2018, 31 December 2017 and 31December 2016:
NAV NAV NAV
31 Dec 2018 31 Dec 2017 31 Dec 2016
Barings Global High Yield Credit Strategies Fund US$ US$ US$
Class A GBP Accumulation Shares 226,388,830 242,696,424 183,544,438Class A GBP Distribution Shares 44,711,168 50,361,501 38,555,824Class B GBP Accumulation Shares 1,283,397,479 1,224,053,355 619,067,396Class B GBP Distribution Shares 373,096,293 137,092,461 42,274,553Class B USD Accumulation Shares******* 102,056,303 - -Class C CAD Accumulation Shares***** 13,784,776 15,142,504 -Class C GBP Accumulation Shares 242,933,508 332,789,679 129,436,145Class C GBP Distribution Shares** 381,564,668 183,759,141 14,017,080Class C USD Accumulation Shares******* 14,539,953 - -Class C USD Distribution Shares* 110,109,657 117,026,234 54,463,739Class D CAD Accumulation Shares***** 73,983 81,351 -Class D EUR Accumulation Shares 1,573,238 998,778 1,274,484Class D EUR Distribution Shares***** 328,552 366,138 -Class D GBP Accumulation Shares 7,579,381 9,592,105 4,493,503Class D GBP Distribution Shares*** 2,666,963 3,004,385 2,710,710Class D NOK Accumulation Shares***** 15,212,344 9,235,565 -Class D USD Accumulation Shares* 10,631,607 5,999,171 2,318,305Class D USD Distribution Shares 14,780,287 11,074,241 10,540,421Class E EUR Distribution Shares***** 322,632 359,466 -Class E USD Accumulation Shares***** 8,542,526 204,195 -Class E USD Distribution Shares* 2,434,181 3,162,112 201,166Class F GBP Accumulation Shares 1,533,527 1,648,599 1,407,813Class F USD Accumulation Shares 1,896,991 1,892,729 1,420,609Class G USD Distribution Shares******* 20,528,376 - -Class S USD Accumulation Shares 5,942 5,945 5,513
–––––––––––––– –––––––––––––– ––––––––––––––Total Net Asset Value 2,880,693,165 2,350,546,079 1,105,731,699
–––––––––––––– –––––––––––––– –––––––––––––––––––––––––––– –––––––––––––– ––––––––––––––
NAV NAV NAV
31 Dec 2018 31 Dec 2017 31 Dec 2016
Barings Investment Grade CLO Fund US$ US$ US$
Class A GBP Accumulating Shares***** 212,210,575 160,525,066 -Class A GBP Distribution Shares* 243,008,353 266,154,457 226,989,516Class A USD Accumulation Shares 552,465 548,417 522,484Class C GBP Distribution Shares***** 36,498,126 39,974,677 -Class D CAD Accumulating Shares***** 148,852 162,168 -Class D EUR Accumulating Shares***** 56,576 60,617 -Class D GBP Distribution Shares****** - - 3,697,796Class D NOK Accumulating Shares***** 313,662 333,577 -Class D USD Accumulating Shares***** 2,441,482 479,431 -Class D USD Distribution Shares** 7,411,876 6,278,592 4,414,541
–––––––––––––– –––––––––––––– ––––––––––––––Total Net Asset Value 502,641,967 474,517,002 235,624,337
–––––––––––––– –––––––––––––– –––––––––––––––––––––––––––– –––––––––––––– ––––––––––––––
Barings Global Investment Funds 2 Plc
Notes to the Financial Statementsfor the financial year ended 31 December 2018 (continued)
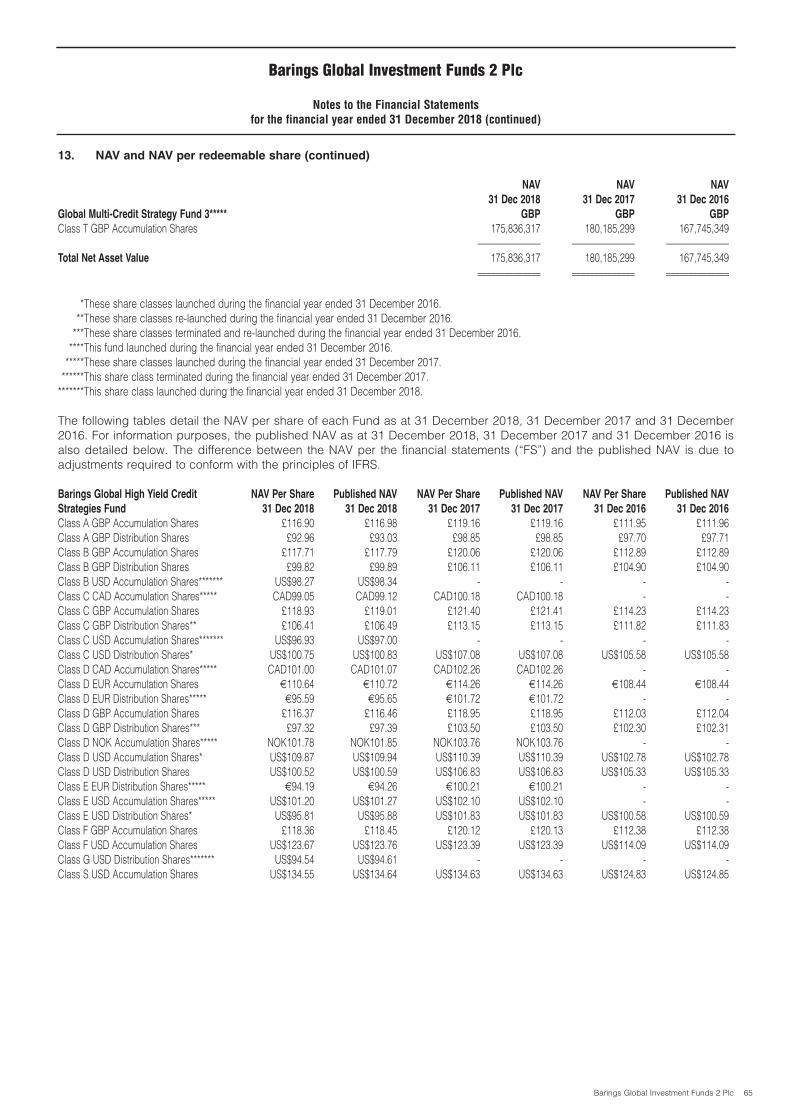
Barings Global Investment Funds 2 Plc 65
13. NAV and NAV per redeemable share (continued)
NAV NAV NAV
31 Dec 2018 31 Dec 2017 31 Dec 2016
Global Multi-Credit Strategy Fund 3***** GBP GBP GBP
Class T GBP Accumulation Shares 175,836,317 180,185,299 167,745,349–––––––––––––– –––––––––––––– ––––––––––––––
Total Net Asset Value 175,836,317 180,185,299 167,745,349–––––––––––––– –––––––––––––– –––––––––––––––––––––––––––– –––––––––––––– ––––––––––––––
*******These share classes launched during the financial year ended 31 December 2016.*******These share classes re-launched during the financial year ended 31 December 2016.*******These share classes terminated and re-launched during the financial year ended 31 December 2016.*******This fund launched during the financial year ended 31 December 2016.*******These share classes launched during the financial year ended 31 December 2017.*******This share class terminated during the financial year ended 31 December 2017.*******This share class launched during the financial year ended 31 December 2018.
The following tables detail the NAV per share of each Fund as at 31 December 2018, 31 December 2017 and 31 December2016. For information purposes, the published NAV as at 31 December 2018, 31 December 2017 and 31 December 2016 isalso detailed below. The difference between the NAV per the financial statements (“FS”) and the published NAV is due toadjustments required to conform with the principles of IFRS.
Barings Global High Yield Credit NAV Per Share Published NAV NAV Per Share Published NAV NAV Per Share Published NAV
Strategies Fund 31 Dec 2018 31 Dec 2018 31 Dec 2017 31 Dec 2017 31 Dec 2016 31 Dec 2016
Class A GBP Accumulation Shares £116.90 £116.98 £119.16 £119.16 £111.95 £111.96Class A GBP Distribution Shares £92.96 £93.03 £98.85 £98.85 £97.70 £97.71Class B GBP Accumulation Shares £117.71 £117.79 £120.06 £120.06 £112.89 £112.89Class B GBP Distribution Shares £99.82 £99.89 £106.11 £106.11 £104.90 £104.90Class B USD Accumulation Shares******* US$98.27 US$98.34 - - - -Class C CAD Accumulation Shares***** CAD99.05 CAD99.12 CAD100.18 CAD100.18 - -Class C GBP Accumulation Shares £118.93 £119.01 £121.40 £121.41 £114.23 £114.23Class C GBP Distribution Shares** £106.41 £106.49 £113.15 £113.15 £111.82 £111.83Class C USD Accumulation Shares******* US$96.93 US$97.00 - - - -Class C USD Distribution Shares* US$100.75 US$100.83 US$107.08 US$107.08 US$105.58 US$105.58Class D CAD Accumulation Shares***** CAD101.00 CAD101.07 CAD102.26 CAD102.26 - -Class D EUR Accumulation Shares €110.64 €110.72 €114.26 €114.26 €108.44 €108.44Class D EUR Distribution Shares***** €95.59 €95.65 €101.72 €101.72 - -Class D GBP Accumulation Shares £116.37 £116.46 £118.95 £118.95 £112.03 £112.04Class D GBP Distribution Shares*** £97.32 £97.39 £103.50 £103.50 £102.30 £102.31Class D NOK Accumulation Shares***** NOK101.78 NOK101.85 NOK103.76 NOK103.76 - -Class D USD Accumulation Shares* US$109.87 US$109.94 US$110.39 US$110.39 US$102.78 US$102.78Class D USD Distribution Shares US$100.52 US$100.59 US$106.83 US$106.83 US$105.33 US$105.33Class E EUR Distribution Shares***** €94.19 €94.26 €100.21 €100.21 - -Class E USD Accumulation Shares***** US$101.20 US$101.27 US$102.10 US$102.10 - -Class E USD Distribution Shares* US$95.81 US$95.88 US$101.83 US$101.83 US$100.58 US$100.59Class F GBP Accumulation Shares £118.36 £118.45 £120.12 £120.13 £112.38 £112.38Class F USD Accumulation Shares US$123.67 US$123.76 US$123.39 US$123.39 US$114.09 US$114.09Class G USD Distribution Shares******* US$94.54 US$94.61 - - - -Class S USD Accumulation Shares US$134.55 US$134.64 US$134.63 US$134.63 US$124.83 US$124.85
Barings Global Investment Funds 2 Plc
Notes to the Financial Statementsfor the financial year ended 31 December 2018 (continued)
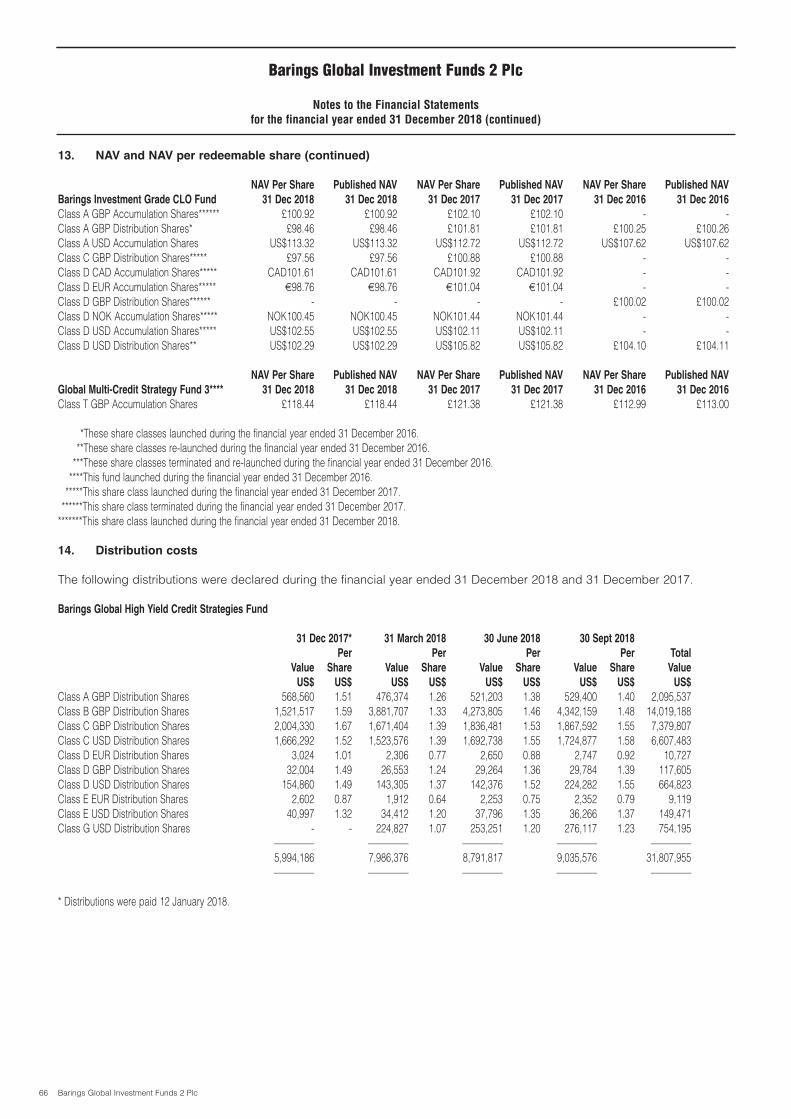
Barings Global Investment Funds 2 Plc 66
13. NAV and NAV per redeemable share (continued)
NAV Per Share Published NAV NAV Per Share Published NAV NAV Per Share Published NAV
Barings Investment Grade CLO Fund 31 Dec 2018 31 Dec 2018 31 Dec 2017 31 Dec 2017 31 Dec 2016 31 Dec 2016
Class A GBP Accumulation Shares****** £100.92 £100.92 £102.10 £102.10 - -Class A GBP Distribution Shares* £98.46 £98.46 £101.81 £101.81 £100.25 £100.26Class A USD Accumulation Shares US$113.32 US$113.32 US$112.72 US$112.72 US$107.62 US$107.62Class C GBP Distribution Shares***** £97.56 £97.56 £100.88 £100.88 - -Class D CAD Accumulation Shares***** CAD101.61 CAD101.61 CAD101.92 CAD101.92 - -Class D EUR Accumulation Shares***** €98.76 €98.76 €101.04 €101.04 - -Class D GBP Distribution Shares****** - - - - £100.02 £100.02Class D NOK Accumulation Shares***** NOK100.45 NOK100.45 NOK101.44 NOK101.44 - -Class D USD Accumulation Shares***** US$102.55 US$102.55 US$102.11 US$102.11 - -Class D USD Distribution Shares** US$102.29 US$102.29 US$105.82 US$105.82 £104.10 £104.11
NAV Per Share Published NAV NAV Per Share Published NAV NAV Per Share Published NAV
Global Multi-Credit Strategy Fund 3**** 31 Dec 2018 31 Dec 2018 31 Dec 2017 31 Dec 2017 31 Dec 2016 31 Dec 2016
Class T GBP Accumulation Shares £118.44 £118.44 £121.38 £121.38 £112.99 £113.00
*******These share classes launched during the financial year ended 31 December 2016.*******These share classes re-launched during the financial year ended 31 December 2016.*******These share classes terminated and re-launched during the financial year ended 31 December 2016.*******This fund launched during the financial year ended 31 December 2016.*******This share class launched during the financial year ended 31 December 2017.*******This share class terminated during the financial year ended 31 December 2017.*******This share class launched during the financial year ended 31 December 2018.
14. Distribution costs
The following distributions were declared during the financial year ended 31 December 2018 and 31 December 2017.
Barings Global High Yield Credit Strategies Fund
31 Dec 2017* 31 March 2018 30 June 2018 30 Sept 2018
Per Per Per Per Total
Value Share Value Share Value Share Value Share Value
US$ US$ US$ US$ US$ US$ US$ US$ US$
Class A GBP Distribution Shares 568,560 1.51 476,374 1.26 521,203 1.38 529,400 1.40 2,095,537Class B GBP Distribution Shares 1,521,517 1.59 3,881,707 1.33 4,273,805 1.46 4,342,159 1.48 14,019,188Class C GBP Distribution Shares 2,004,330 1.67 1,671,404 1.39 1,836,481 1.53 1,867,592 1.55 7,379,807Class C USD Distribution Shares 1,666,292 1.52 1,523,576 1.39 1,692,738 1.55 1,724,877 1.58 6,607,483Class D EUR Distribution Shares 3,024 1.01 2,306 0.77 2,650 0.88 2,747 0.92 10,727Class D GBP Distribution Shares 32,004 1.49 26,553 1.24 29,264 1.36 29,784 1.39 117,605Class D USD Distribution Shares 154,860 1.49 143,305 1.37 142,376 1.52 224,282 1.55 664,823Class E EUR Distribution Shares 2,602 0.87 1,912 0.64 2,253 0.75 2,352 0.79 9,119Class E USD Distribution Shares 40,997 1.32 34,412 1.20 37,796 1.35 36,266 1.37 149,471Class G USD Distribution Shares - - 224,827 1.07 253,251 1.20 276,117 1.23 754,195
––––––––– ––––––––– ––––––––– ––––––––– –––––––––5,994,186 7,986,376 8,791,817 9,035,576 31,807,955––––––––– ––––––––– ––––––––– ––––––––– –––––––––
* Distributions were paid 12 January 2018.
Barings Global Investment Funds 2 Plc
Notes to the Financial Statementsfor the financial year ended 31 December 2018 (continued)

Barings Global Investment Funds 2 Plc 67
14. Distribution costs (continued)
Barings Global High Yield Credit Strategies Fund
31 Dec 2016* 31 March 2017 30 June 2017 30 Sept 2017
Per Per Per Per Total
Value Share Value Share Value Share Value Share Value
US$ US$ US$ US$ US$ US$ US$ US$ US$
Class A GBP Distribution Shares 531,502 1.66 489,192 1.53 506,280 1.58 501,490 1.57 2,028,464Class B GBP Distribution Shares 574,773 1.76 1,355,656 1.62 1,402,404 1.67 1,388,226 1.65 4,721,059Class C GBP Distribution Shares 187,929 1.85 413,850 1.70 822,912 1.75 1,697,654 1.74 3,122,345Class C USD Distribution Shares 839,838 1.63 1,011,417 1.51 1,510,910 1.54 1,514,346 1.52 4,876,511Class D EUR Distribution Shares - - 3,192 1.06 3,429 1.14 3,451 1.15 10,072Class D GBP Distribution Shares 35,660 1.66 32,670 1.52 33,778 1.57 33,381 1.55 135,489Class D USD Distribution Shares 159,878 1.60 149,888 1.48 154,647 1.51 152,428 1.49 616,841Class E EUR Distribution Shares - - 942 0.94 1,011 1.01 1,014 1.01 2,967Class E USD Distribution Shares 3,400 1.70 7,872 1.22 27,587 1.33 31,298 1.32 70,157
––––––––– ––––––––– ––––––––– ––––––––– –––––––––2,332,980 3,464,679 4,462,958 5,323,288 15,583,905––––––––– ––––––––– ––––––––– ––––––––– –––––––––
* Distributions were paid 13 January 2017
Barings Investment Grade CLO Fund
31 March 2018 30 June 2018 30 Sept 2018 31 Dec 2018*
Per Per Per Per Total
Value Share Value Share Value Share Value Share Value
US$ US$ US$ US$ US$ US$ US$ US$ US$
Class A GBP Distribution Shares 1,092,116 0.56 1,556,082 0.80 1,575,066 0.81 1,425,503 0.74 5,648,767Class C GBP Distribution Shares 159,991 0.55 229,735 0.78 232,689 0.79 210,297 0.72 832,712Class D USD Distribution Shares 50,857 0.86 63,674 1.07 64,427 1.08 74,761 1.03 253,719
––––––––– ––––––––– ––––––––– ––––––––– –––––––––1,302,964 1,849,491 1,872,182 1,710,561 6,735,198––––––––– ––––––––– ––––––––– ––––––––– –––––––––
* Distributions were paid 15 January 2019
Barings Investment Grade CLO Fund
31 March 2017 30 June 2017 30 Sept 2017 31 Dec 2017**
Per Per Per Per Total
Value Share Value Share Value Share Value Share Value
US$ US$ US$ US$ US$ US$ US$ US$ US$
Class A GBP Distribution Shares 1,249,567 0.68 1,161,721 0.63 1,098,610 0.57 1,318,905 0.68 4,828,803Class C GBP Distribution Shares 194,098 0.66 180,038 0.61 161,030 0.55 193,977 0.66 729,143Class D GBP Distribution Shares 19,508 0.65 - - - - - - 19,508Class D USD Distribution Shares 32,577 0.77 43,854 0.74 41,878 0.71 50,844 0.86 169,153
––––––––– ––––––––– ––––––––– ––––––––– –––––––––1,495,750 1,385,613 1,301,518 1,563,726 5,746,607––––––––– ––––––––– ––––––––– ––––––––– –––––––––
** Distributions were paid 12 January 2018
Barings Global Investment Funds 2 Plc
Notes to the Financial Statementsfor the financial year ended 31 December 2018 (continued)

Barings Global Investment Funds 2 Plc 68
15. Exchange rates
The following exchange rates (against US$) were used in the Statement of Financial Position to translate foreign currencyamounts, investments and other assets and liabilities denominated in currencies other than US$:
Currency 31 Dec 2018 31 Dec 2017
CAD 0.7325 0.7955EUR 1.1457 1.1998GBP 1.2746 1.3502NOK 0.1157 0.1218
Income and expenses were converted (against US$) at an average rate for the financial year ended 31 December 2018:
Average exchange rates Average exchange rates
for the year for the period
1 January 2018 1 January 2017
to 31 December 2018 to 31 December 2017
GBP 1.3304 1.3018
16. Prospectus
There were no material changes to the Supplement or Prospectus during the financial year.
17. Contingent liabilities
There are no contingent liabilities as at 31 December 2018 or 31 December 2017.
18. Revolving Credit Facilities
The Subsidiary has entered into the following revolving credit facility with State Street Bank and Trust Company, RBC Bank,ScotiaBank and National Australia Bank Limited.
The borrower is the Subsidiary of the Fund. The Fund guarantees the loan on behalf of its Subsidiary. The credit facility is basecurrency (US$). Borrowing is at 1.25% over the relevant index. There is a commitment fee of 0.325% per annum on the unusedamount.
As at 31 December 2018 New amount
Effective
Old amount 5 December 2018
Borrower Guarantor US$ millions US$ millions
1) Barings Global High Yield Credit Strategies Limited Barings Global High Yield Credit Strategies Fund 115 180
On 5 December 2018 the facility was renewed for one year and increased.
19. Soft commissions
There were no soft commission arrangements entered into by the Investment Managers on behalf of the Company during thefinancial year ended 31 December 2018 or 31 December 2017.
20. Taxation
Under current Irish law and practice the Company qualifies as an investment undertaking under Section 739B of the TaxesConsolidation Act, 1997 and is not therefore chargeable to Irish tax on its relevant income or relevant gains. No stamp, transferor registration tax is payable in Ireland on the issue, redemption or transfer of shares in the Company. Distributions and intereston securities issued in countries other than Ireland may be subject to taxes including withholding taxes imposed by suchcountries. The Company may not be able to benefit from a reduction in the rate of withholding tax by virtue of the double taxationagreement in operation between Ireland and other countries. The Company may not, therefore, be able to reclaim withholdingtax suffered by it in particular countries.
Barings Global Investment Funds 2 Plc
Notes to the Financial Statementsfor the financial year ended 31 December 2018 (continued)

Barings Global Investment Funds 2 Plc 69
20. Taxation (continued)
To the extent that a chargeable event arises in respect of a shareholder, the Company may be required to deduct tax in connectionwith that chargeable event and pay the tax to the Irish Revenue Commissioners. A chargeable event can include dividendpayments to shareholders, appropriation, cancellation, redemption, repurchase or transfer of shares, or a deemed disposal ofshares every 8 years beginning from the date of acquisition of those shares. Certain exemptions can apply. To the extent thatshareholders have appropriate tax declarations in place with the Company there may be no requirement to deduct tax.
The Barings Global High Yield Credit Strategies Fund and the Global Multi-Credit Strategy Fund 3 hold their investmentsthrough their Subsidiaries, which are Irish residents and are qualifying companies for the purposes of Section 110 of the TaxesConsolidation Act, 1997, as amended. The Subsidiary is subject to corporation tax in Ireland on its profits computed as thoughthey were carrying on a trade. However, as the Subsidiary is financed by borrowing, the cost of this finance is deductible andaccordingly their profits for tax purposes will not be material. Interest payable by the Subsidiaries to the Barings Global HighYield Credit Strategies Fund and Global Multi-Credit Strategy Fund 3 can be paid free of any Irish withholding tax.
21. Comparative financial year
The comparative amounts in these financial statements are for the financial year ended 31 December 2017.
22. Significant events during the financial year
The Barings Global High Yield Credit Strategies Fund launched share classes during the financial year:
Share Class Launch Date
Class G USD Accumulation Shares* 09 February 2018Class G USD Distribution Shares 09 February 2018Class B USD Accumulation Shares 11 May 2018Class C USD Accumulation Shares 01 July 2018
*This share class was redeemed during the year ended 31 December 2018.
There were no other significant events during the financial year, which require adjustment to, or disclosure in the financialstatements.
23. Subsequent events
The following distributions were declared by the funds subsequent to the financial year end:
Barings Global High Yield Credit Strategies Fund
31 Dec 2018 31 Dec 2018
Value Per Share
US$ US$
Class A GBP Distribution Shares 513,358 1.36 Class B GBP Distribution Shares 4,211,648 1.44 Class C GBP Distribution Shares 4,233,490 1.50 Class C USD Distribution Shares 1,704,940 1.56 Class D EUR Distribution Shares 2,701 0.90 Class D GBP Distribution Shares 28,903 1.34 Class D USD Distribution Shares 225,049 1.53 Class E EUR Distribution Shares 2,320 0.78 Class E USD Distribution Shares 34,554 1.36 Class G USD Distribution Shares 264,956 1.22
––––––––––11,221,919––––––––––––––––––––
Barings Global Investment Funds 2 Plc
Notes to the Financial Statementsfor the financial year ended 31 December 2018 (continued)

Barings Global Investment Funds 2 Plc 70
23. Subsequent events (continued)
Brexit
Whilst the medium to long-term consequences of the decision to leave the EU remain uncertain in any scenario, there could beshort-term volatility which could have a negative impact on general economic conditions, business and consumer confidencein both the UK and EU, which may in turn have negative political, economic and market impacts more widely. The longer-termconsequences may be affected by the terms of any future arrangements the UK has with the remaining member states of theEU27. Among other things, the UK's decision to leave the EU could lead to changes in the law and tax treatment of funds,instability in the equity, debt and foreign exchange markets, including volatility in the value of the pound sterling or the euro.
There were no other subsequent events affecting the Funds after the financial year end.
24. Approval of the financial statements
The Board of Directors approved these financial statements on the 23 April 2019.
Barings Global Investment Funds 2 Plc
Notes to the Financial Statementsfor the financial year ended 31 December 2018 (continued)

Barings Global Investment Funds 2 Plc 71
Barings Global Investment Funds 2 PlcBarings Global High Yield Credit Strategies Fund
Schedule of Investments (Unaudited)as at 31 December 2018
Loan to Subsidiary
Fair Value % of Net
Country Industry Obligor US$ Assets
Ireland Finance Barings Global High Yield Credit Strategies Limited 2,893,366,496 100.44––––––––––––– –––––––
Total Loan (31 December 2017: US$2,340,913,506) 2,893,366,496 100.44
––––––––––––– –––––––
Forward Foreign Exchange Contracts
Unrealised
Amount Amount Gain % of Net
Maturity Counterparty Currency Bought Currency Sold US$ Assets
15/01/2019 State Street Bank and Trust Company EUR 290,785 USD 332,196 1,302 0.00
15/01/2019 State Street Bank and Trust Company EUR 296,001 USD 338,155 1,326 0.00
15/01/2019 State Street Bank and Trust Company EUR 307,609 USD 349,936 2,857 0.00
15/01/2019 State Street Bank and Trust Company EUR 1,100,499 USD 1,257,221 4,929 0.00
14/02/2019 State Street Bank and Trust Company GBP 237,990 USD 303,400 570 0.00
14/02/2019 State Street Bank and Trust Company GBP 13,400,000 USD 16,951,871 163,058 0.01
14/02/2019 State Street Bank and Trust Company GBP 19,900,000 USD 25,119,969 296,977 0.01
15/01/2019 State Street Bank and Trust Company USD 573 CAD 777 4 0.00
15/01/2019 State Street Bank and Trust Company USD 405 CAD 542 8 0.00
15/01/2019 State Street Bank and Trust Company USD 440 CAD 584 12 0.00
15/01/2019 State Street Bank and Trust Company USD 1,910 CAD 2,552 41 0.00
15/01/2019 State Street Bank and Trust Company USD 106,528 CAD 144,297 795 0.00
15/01/2019 State Street Bank and Trust Company USD 75,316 CAD 100,672 1,549 0.00
15/01/2019 State Street Bank and Trust Company USD 81,272 CAD 107,936 2,182 0.00
15/01/2019 State Street Bank and Trust Company USD 355,896 CAD 475,367 7,572 0.00
14/02/2019 State Street Bank and Trust Company USD 8,236 GBP 6,433 19 0.00
14/02/2019 State Street Bank and Trust Company USD 29,139 GBP 22,790 31 0.00
14/02/2019 State Street Bank and Trust Company USD 15,170 GBP 11,851 34 0.00
14/02/2019 State Street Bank and Trust Company USD 43,113 GBP 33,679 97 0.00
14/02/2019 State Street Bank and Trust Company USD 46,809 GBP 36,476 221 0.00
14/02/2019 State Street Bank and Trust Company USD 81,223 GBP 63,293 383 0.00
14/02/2019 State Street Bank and Trust Company USD 249,250 GBP 194,708 562 0.00
14/02/2019 State Street Bank and Trust Company USD 230,833 GBP 179,877 1,089 0.00
14/02/2019 State Street Bank and Trust Company USD 1,262,041 GBP 985,878 2,845 0.00

Barings Global Investment Funds 2 Plc 72
Barings Global Investment Funds 2 PlcBarings Global High Yield Credit Strategies Fund
Schedule of Investments (Unaudited) (continued)as at 31 December 2018
Forward Foreign Exchange Contracts (continued)
Unrealised
Amount Amount Gain % of Net
Maturity Counterparty Currency Bought Currency Sold US$ Assets
14/02/2019 State Street Bank and Trust Company USD 1,450,172 GBP 1,132,842 3,269 0.00
14/02/2019 State Street Bank and Trust Company USD 1,976,704 GBP 1,544,156 4,456 0.00
14/02/2019 State Street Bank and Trust Company USD 2,092,618 GBP 1,634,706 4,717 0.00
14/02/2019 State Street Bank and Trust Company USD 1,362,266 GBP 1,061,546 6,424 0.00
14/02/2019 State Street Bank and Trust Company USD 7,057,875 GBP 5,513,452 15,909 0.00
14/02/2019 State Street Bank and Trust Company USD 6,897,896 GBP 5,375,186 32,528 0.00
14/02/2019 State Street Bank and Trust Company USD 8,442,948 GBP 6,579,168 39,814 0.00
14/02/2019 State Street Bank and Trust Company USD 10,049,204 GBP 7,830,844 47,388 0.00
14/02/2019 State Street Bank and Trust Company USD 11,359,380 GBP 8,851,798 53,566 0.00
14/02/2019 State Street Bank and Trust Company USD 38,312,308 GBP 29,854,871 180,666 0.01
15/01/2019 State Street Bank and Trust Company USD 83,007 NOK 711,165 713 0.00
15/01/2019 State Street Bank and Trust Company USD 87,924 NOK 744,871 1,729 0.00
15/01/2019 State Street Bank and Trust Company USD 422,444 NOK 3,588,024 7,245 0.00
––––––––––––– –––––––Total unrealised gain on forward foreign exchange contracts
(31 December 2017: US$11,007,828) 886,887 0.03
––––––––––––– –––––––
Unrealised
Amount Amount Loss % of Net
Maturity Counterparty Currency Bought Currency Sold US$ Assets
15/01/2019 State Street Bank and Trust Company CAD 19,714,188 USD 14,700,923 (255,429) (0.01)
15/01/2019 State Street Bank and Trust Company CAD 105,818 USD 78,909 (1,371) (0.00)
14/02/2019 State Street Bank and Trust Company GBP 1,037,080,395 USD 1,330,340,803 (5,746,951) (0.19)
14/02/2019 State Street Bank and Trust Company GBP 307,488,142 USD 394,438,102 (1,703,937) (0.06)
14/02/2019 State Street Bank and Trust Company GBP 299,697,546 USD 384,444,520 (1,660,765) (0.06)
14/02/2019 State Street Bank and Trust Company GBP 200,909,235 USD 257,721,343 (1,113,333) (0.04)
14/02/2019 State Street Bank and Trust Company GBP 186,567,635 USD 239,324,298 (1,033,859) (0.04)
14/02/2019 State Street Bank and Trust Company GBP 36,846,554 USD 47,265,838 (204,184) (0.01)
14/02/2019 State Street Bank and Trust Company GBP 6,247,810 USD 8,014,534 (34,622) (0.00)
14/02/2019 State Street Bank and Trust Company GBP 2,198,423 USD 2,820,082 (12,183) (0.00)
14/02/2019 State Street Bank and Trust Company GBP 1,263,228 USD 1,620,438 (7,000) (0.00)

Barings Global Investment Funds 2 Plc 73
Forward Foreign Exchange Contracts (continued)
Unrealised
Amount Amount Loss % of Net
Maturity Counterparty Currency Bought Currency Sold US$ Assets
15/01/2019 State Street Bank and Trust Company NOK 138,427,336 USD 16,259,363 (240,821) (0.01)
15/01/2019 State Street Bank and Trust Company USD 6,508 EUR 5,725 (58) (0.00)
15/01/2019 State Street Bank and Trust Company USD 12,922 EUR 11,313 (52) (0.00)
15/01/2019 State Street Bank and Trust Company USD 9,230 EUR 8,071 (26) (0.00)
15/01/2019 State Street Bank and Trust Company USD 6,955 EUR 6,084 (22) (0.00)
15/01/2019 State Street Bank and Trust Company USD 1,751 EUR 1,540 (16) (0.00)
15/01/2019 State Street Bank and Trust Company USD 1,741 EUR 1,531 (16) (0.00)
15/01/2019 State Street Bank and Trust Company USD 3,492 EUR 3,057 (14) (0.00)
15/01/2019 State Street Bank and Trust Company USD 3,415 EUR 2,990 (14) (0.00)
15/01/2019 State Street Bank and Trust Company USD 2,483 EUR 2,171 (7) (0.00)
15/01/2019 State Street Bank and Trust Company USD 2,467 EUR 2,157 (7) (0.00)
15/01/2019 State Street Bank and Trust Company USD 1,895 EUR 1,657 (6) (0.00)
15/01/2019 State Street Bank and Trust Company USD 1,871 EUR 1,636 (6) (0.00)
14/02/2019 State Street Bank and Trust Company USD 6,654,697 GBP 5,259,142 (62,455) (0.00)
14/02/2019 State Street Bank and Trust Company USD 9,723,559 GBP 7,653,676 (51,973) (0.00)
14/02/2019 State Street Bank and Trust Company USD 1,973,078 GBP 1,559,304 (18,518) (0.00)
14/02/2019 State Street Bank and Trust Company USD 1,933,071 GBP 1,527,687 (18,141) (0.00)
14/02/2019 State Street Bank and Trust Company USD 2,913,751 GBP 2,293,492 (15,573) (0.00)
14/02/2019 State Street Bank and Trust Company USD 2,799,448 GBP 2,203,521 (14,963) (0.00)
14/02/2019 State Street Bankand Trust Company USD 1,286,414 GBP 1,016,640 (12,073) (0.00)
14/02/2019 State Street Bank and Trust Company USD 1,194,355 GBP 943,887 (11,209) (0.00)
14/02/2019 State Street Bank and Trust Company USD 1,824,752 GBP 1,436,312 (9,753) (0.00)
14/02/2019 State Street Bank and Trust Company USD 1,694,889 GBP 1,334,093 (9,059) (0.00)
14/02/2019 State Street Bank and Trust Company USD 235,882 GBP 186,415 (2,214) (0.00)
14/02/2019 State Street Bank and Trust Company USD 334,736 GBP 263,480 (1,789) (0.00)
14/02/2019 State Street Bank and Trust Company USD 40,308 GBP 31,855 (378) (0.00)
14/02/2019 State Street Bank and Trust Company USD 57,165 GBP 44,996 (306) (0.00)
14/02/2019 State Street Bank and Trust Company USD 24,244 GBP 19,157 (224) (0.00)
Barings Global Investment Funds 2 PlcBarings Global High Yield Credit Strategies Fund
Schedule of Investments (Unaudited) (continued)as at 31 December 2018

Barings Global Investment Funds 2 Plc 74
Forward Foreign Exchange Contracts (continued)
Unrealised
Amount Amount Loss % of Net
Maturity Counterparty Currency Bought Currency Sold US$ Assets
14/02/2019 State Street Bank and Trust Company USD 14,183 GBP 11,209 (133) (0.00)
14/02/2019 State Street Bank and Trust Company USD 20,115 GBP 15,833 (108) (0.00)
14/02/2019 State Street Bank and Trust Company USD 7,973 GBP 6,301 (75) (0.00)
14/02/2019 State Street Bank and Trust Company USD 11,328 GBP 8,916 (61) (0.00)
14/02/2019 State Street Bank and Trust Company USD 285 GBP 225 (2) (0.00)
15/01/2019 State Street Bank and Trust Company USD 118,025 NOK 1,029,898 (1,152) (0.00)
15/01/2019 State Street Bank and Trust Company USD 45,722 NOK 400,000 (566) (0.00)
–––––––––––– –––––––Total unrealised loss on forward foreign exchange contracts
(31 December 2017: (US$109,749)) (12,245,424) (0.42)
–––––––––––– –––––––Net loss on forward foreign exchange contracts (31 December 2017: US$10,898,079) (11,358,537) (0.39)
–––––––––––– –––––––
Fair Value % of Net
Summary US$ Assets
Total investments at fair value through profit or loss 2,893,366,496 100.44Net loss on forward foreign exchange contracts (11,358,537) (0.39)Other net liabilities (1,314,794) (0.05)
––––––––––––– –––––––Total Net Assets 2,880,693,165 100.00
––––––––––––– –––––––
Barings Global Investment Funds 2 PlcBarings Global High Yield Credit Strategies Fund
Schedule of Investments (Unaudited) (continued)as at 31 December 2018
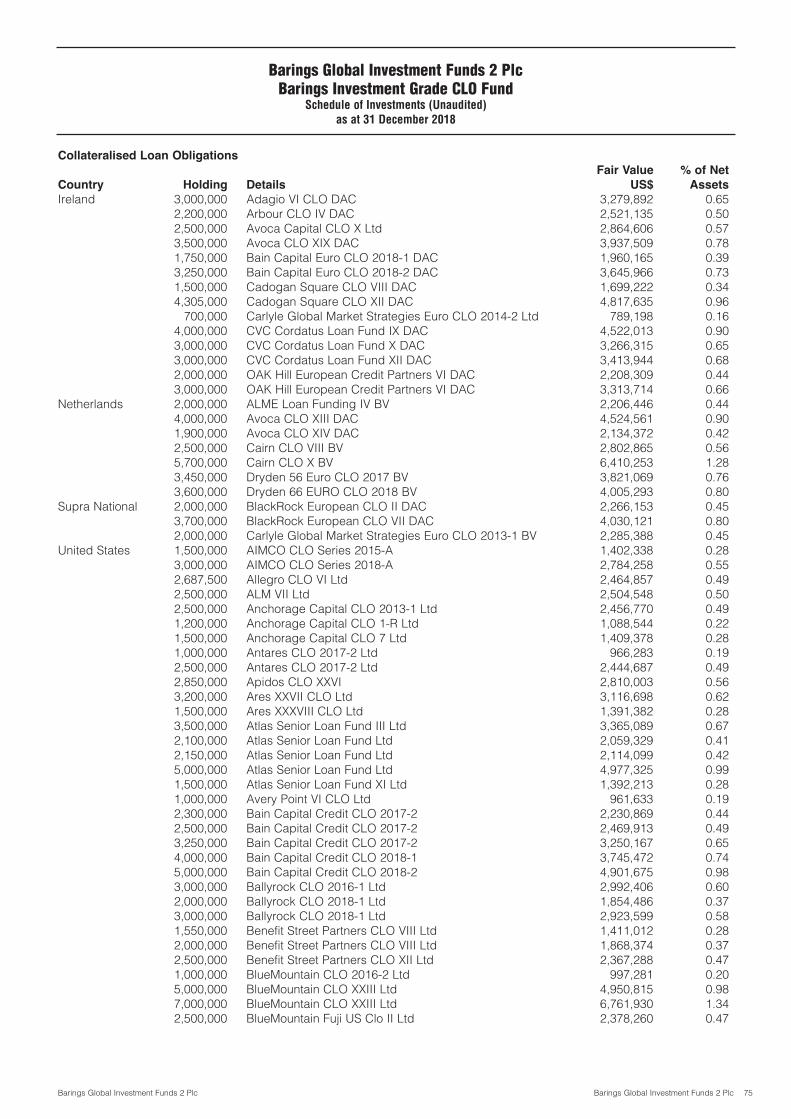
Barings Global Investment Funds 2 Plc 75
Barings Global Investment Funds 2 PlcBarings Investment Grade CLO Fund
Schedule of Investments (Unaudited)as at 31 December 2018
Collateralised Loan Obligations
Fair Value % of Net
Country Holding Details US$ Assets
Ireland 3,000,000 Adagio VI CLO DAC 3,279,892 0.652,200,000 Arbour CLO IV DAC 2,521,135 0.502,500,000 Avoca Capital CLO X Ltd 2,864,606 0.573,500,000 Avoca CLO XIX DAC 3,937,509 0.781,750,000 Bain Capital Euro CLO 2018-1 DAC 1,960,165 0.393,250,000 Bain Capital Euro CLO 2018-2 DAC 3,645,966 0.731,500,000 Cadogan Square CLO VIII DAC 1,699,222 0.344,305,000 Cadogan Square CLO XII DAC 4,817,635 0.96
700,000 Carlyle Global Market Strategies Euro CLO 2014-2 Ltd 789,198 0.164,000,000 CVC Cordatus Loan Fund IX DAC 4,522,013 0.903,000,000 CVC Cordatus Loan Fund X DAC 3,266,315 0.653,000,000 CVC Cordatus Loan Fund XII DAC 3,413,944 0.682,000,000 OAK Hill European Credit Partners VI DAC 2,208,309 0.443,000,000 OAK Hill European Credit Partners VI DAC 3,313,714 0.66
Netherlands 2,000,000 ALME Loan Funding IV BV 2,206,446 0.444,000,000 Avoca CLO XIII DAC 4,524,561 0.901,900,000 Avoca CLO XIV DAC 2,134,372 0.422,500,000 Cairn CLO VIII BV 2,802,865 0.565,700,000 Cairn CLO X BV 6,410,253 1.283,450,000 Dryden 56 Euro CLO 2017 BV 3,821,069 0.763,600,000 Dryden 66 EURO CLO 2018 BV 4,005,293 0.80
Supra National 2,000,000 BlackRock European CLO II DAC 2,266,153 0.453,700,000 BlackRock European CLO VII DAC 4,030,121 0.802,000,000 Carlyle Global Market Strategies Euro CLO 2013-1 BV 2,285,388 0.45
United States 1,500,000 AIMCO CLO Series 2015-A 1,402,338 0.283,000,000 AIMCO CLO Series 2018-A 2,784,258 0.552,687,500 Allegro CLO VI Ltd 2,464,857 0.492,500,000 ALM VII Ltd 2,504,548 0.502,500,000 Anchorage Capital CLO 2013-1 Ltd 2,456,770 0.491,200,000 Anchorage Capital CLO 1-R Ltd 1,088,544 0.221,500,000 Anchorage Capital CLO 7 Ltd 1,409,378 0.281,000,000 Antares CLO 2017-2 Ltd 966,283 0.192,500,000 Antares CLO 2017-2 Ltd 2,444,687 0.492,850,000 Apidos CLO XXVI 2,810,003 0.563,200,000 Ares XXVII CLO Ltd 3,116,698 0.621,500,000 Ares XXXVIII CLO Ltd 1,391,382 0.283,500,000 Atlas Senior Loan Fund III Ltd 3,365,089 0.672,100,000 Atlas Senior Loan Fund Ltd 2,059,329 0.412,150,000 Atlas Senior Loan Fund Ltd 2,114,099 0.425,000,000 Atlas Senior Loan Fund Ltd 4,977,325 0.991,500,000 Atlas Senior Loan Fund XI Ltd 1,392,213 0.281,000,000 Avery Point VI CLO Ltd 961,633 0.192,300,000 Bain Capital Credit CLO 2017-2 2,230,869 0.442,500,000 Bain Capital Credit CLO 2017-2 2,469,913 0.493,250,000 Bain Capital Credit CLO 2017-2 3,250,167 0.654,000,000 Bain Capital Credit CLO 2018-1 3,745,472 0.745,000,000 Bain Capital Credit CLO 2018-2 4,901,675 0.983,000,000 Ballyrock CLO 2016-1 Ltd 2,992,406 0.602,000,000 Ballyrock CLO 2018-1 Ltd 1,854,486 0.373,000,000 Ballyrock CLO 2018-1 Ltd 2,923,599 0.581,550,000 Benefit Street Partners CLO VIII Ltd 1,411,012 0.282,000,000 Benefit Street Partners CLO VIII Ltd 1,868,374 0.372,500,000 Benefit Street Partners CLO XII Ltd 2,367,288 0.471,000,000 BlueMountain CLO 2016-2 Ltd 997,281 0.205,000,000 BlueMountain CLO XXIII Ltd 4,950,815 0.987,000,000 BlueMountain CLO XXIII Ltd 6,761,930 1.342,500,000 BlueMountain Fuji US Clo II Ltd 2,378,260 0.47
Barings Global Investment Funds 2 Plc

Barings Global Investment Funds 2 Plc 76
Collateralised Loan Obligations (continued)
Fair Value % of Net
Country Holding Details US$ Assets
United States 1,500,000 Carbone Clo Ltd 1,397,727 0.28(continued) 1,350,000 Carlyle Global Market Strategies CLO 2013-2 Ltd 1,241,669 0.25
1,350,000 Carlyle Global Market Strategies CLO 2016-3 Ltd 1,352,059 0.273,300,000 CBAM 2017-2 Ltd 3,203,053 0.644,000,000 Cedar Funding VIII 3,877,752 0.77
18,250,000 CIFC Funding 2014-V Ltd 18,033,737 3.593,000,000 CIFC Funding 2017-IV Ltd 2,846,517 0.573,600,000 CIFC Funding 2017-IV Ltd 3,536,186 0.701,500,000 CIFC Funding 2018-I Ltd 1,353,822 0.271,000,000 Crestline Denali CLO XIV Ltd 944,236 0.197,800,000 Crestline Denali CLO XIV Ltd 7,616,543 1.513,100,000 Crestline Denali CLO XVI Ltd 2,872,910 0.574,000,000 Crestline Denali CLO XVII Ltd 3,859,196 0.772,100,000 Deer Creek Clo Ltd 2017-1 1,952,607 0.391,560,000 Denali Capital CLO XI Ltd 1,485,438 0.305,000,000 Dryden XXVIII Senior Loan Fund 4,944,050 0.982,000,000 Flatiron CLO 2015-1 Ltd 1,958,012 0.391,500,000 Galaxy XIX CLO Ltd 1,450,220 0.295,000,000 Galaxy XIX CLO Ltd 4,913,810 0.98
500,000 Galaxy XXVI CLO Ltd 478,672 0.101,450,000 Gallatin CLO VIII 2017-1 Ltd 1,373,684 0.272,250,000 Gallatin CLO VIII 2017-1 Ltd 2,239,016 0.445,000,000 Goldentree Loan Management US Clo 2 Ltd 4,719,525 0.942,000,000 GoldentTree Loan Management US CLO 1 Ltd 1,958,352 0.391,000,000 Greywolf CLO IV Ltd 984,622 0.204,230,000 Greywolf CLO IV Ltd 4,229,600 0.843,250,000 Greywolf CLO VI Ltd 3,181,279 0.632,000,000 Grippen Park Clo Ltd 1,946,630 0.392,000,000 Highbridge Loan Management 3-2014 1,947,178 0.392,500,000 Highbridge Loan Management 3-2014 2,430,575 0.482,000,000 HPS Loan Management 11-2017 Ltd 1,946,914 0.393,370,000 HPS Loan Management 13-2018 Ltd 3,133,665 0.622,340,000 KKR Clo 19 Ltd 2,157,489 0.432,300,000 KKR CLO 23 Ltd 2,141,068 0.437,000,000 KKR CLO 9 Ltd 6,964,488 1.381,500,000 KKR Financial CLO 2013-1 Ltd 1,449,236 0.291,000,000 LCM XIII LP 1,000,072 0.204,000,000 LCM XV LP 3,991,064 0.791,100,000 LCM XXV Ltd 1,073,884 0.212,500,000 Madison Park Funding X Ltd 2,500,204 0.503,450,000 Madison Park Funding XI Ltd 3,335,046 0.661,200,000 Madison Park Funding XIV Ltd 1,159,067 0.232,600,000 Madison Park Funding XIV Ltd 2,443,961 0.484,000,000 Madison Park Funding XV Ltd 3,954,042 0.793,000,000 Madison Park Funding XVII Ltd 2,974,920 0.592,500,000 Madison Park Funding XXII Ltd 2,511,366 0.504,000,000 Madison Park Funding XXIV Ltd 3,994,100 0.796,000,000 Madison Park Funding XXIX Ltd 5,798,057 1.152,000,000 Madison Park Funding XXVII Ltd 1,837,146 0.362,500,000 Madison Park Funding XXVII Ltd 2,352,435 0.474,000,000 Madison Park Funding XXVIII Ltd 3,916,040 0.782,000,000 Magnetite VIII Ltd 1,896,536 0.381,750,000 Magnetite XIX Ltd 1,709,678 0.342,100,000 Marble Point Clo X Ltd 2,056,704 0.411,500,000 Mill Creek II CLO Ltd 1,502,255 0.302,375,000 Milos CLO Ltd 2,276,568 0.454,000,000 Milos CLO Ltd 3,857,204 0.77
Barings Global Investment Funds 2 PlcBarings Investment Grade CLO FundSchedule of Investments (Unaudited) (continued)
as at 31 December 2018

Barings Global Investment Funds 2 Plc 77
Collateralised Loan Obligations (continued)
Fair Value % of Net
Country Holding Details US$ Assets
United States 4,250,000 Neuberger Berman CLO XXII Ltd 4,058,801 0.81(continued) 4,000,000 Oak Hill Credit Partners X-R Ltd 3,869,464 0.77
5,000,000 Oak Hill Credit Partners X-R Ltd 4,843,880 0.962,000,000 Oaktree CLO 2014-1 1,953,600 0.396,050,000 Oaktree CLO 2018-1 Ltd 5,928,678 1.185,000,000 OCP CLO 2015-10 Ltd 4,823,140 0.96
750,000 OCP CLO 2017-14 Ltd 700,782 0.142,650,000 OHA Credit Funding 1 Ltd 2,511,779 0.504,000,000 OHA Credit Partners XI Ltd 3,857,436 0.773,000,000 OHA Loan Funding 2012-1 Ltd 3,008,679 0.603,700,000 OHA Loan Funding 2012-1 Ltd 3,700,529 0.732,000,000 Palmer Square CLO 2015-1 Ltd 1,987,468 0.403,000,000 Race Point VIII CLO Ltd 2,909,742 0.581,500,000 Recette Clo Ltd 1,411,515 0.286,200,000 Regatta VIII Funding Ltd 6,110,304 1.222,650,000 Regatta XIV Funding Ltd 2,623,585 0.524,000,000 Regatta XV Funding Ltd 3,777,252 0.759,000,000 Rockford Tower CLO 2017-3 Ltd 8,903,510 1.778,000,000 RR 1 LLC 7,879,944 1.573,500,000 RR 2 Ltd 3,333,547 0.662,000,000 RR 3 Ltd 1,823,550 0.362,500,000 RR 3 Ltd 2,354,325 0.478,000,000 RR 5 Ltd 7,762,623 1.542,000,000 Sound Point CLO II Ltd 1,815,070 0.364,000,000 Sound Point Clo XVI Ltd 3,920,496 0.782,000,000 Sounds Point CLO IV-R Ltd 1,920,708 0.385,000,000 Steele Creek CLO 2015-1 Ltd 4,990,540 0.992,000,000 Steele Creek Clo 2017-1 Ltd 1,862,284 0.373,600,000 Steele Creek Clo 2017-1 Ltd 3,343,471 0.673,000,000 Steele Creek Clo 2018-2 Ltd 2,859,927 0.572,500,000 TCI-Cent Clo 2016-1 Ltd 2,495,743 0.54,000,000 TCI-Cent Clo 2017-1 Income Note Issuer Ltd 3,902,464 0.785,000,000 TCI-Cent Clo 2017-1 Income Note Issuer Ltd 4,853,730 0.972,000,000 TCI-Symphony CLO 2017-1 Ltd 1,941,890 0.393,000,000 THL Credit Wind River 2015-2 CLO Ltd 2,823,933 0.565,000,000 THL Credit Wind River 2016-2 Clo Ltd 4,966,650 0.992,000,000 THL Credit Wind River 2017-2 Clo Ltd 1,957,528 0.394,500,000 THL Credit Wind River 2017-3 Clo Ltd 4,421,943 0.884,000,000 THL Credit Wind River 2018-3 CLO Ltd 3,930,636 0.784,000,000 TICP CLO VII Ltd 3,940,560 0.782,225,000 Voya CLO 2017-1 Ltd 2,155,337 0.432,000,000 Wellfleet CLO 2017-1 Ltd 1,948,504 0.391,000,000 Wellfleet CLO 2017-2 Ltd 964,896 0.192,900,000 Wellfleet CLO 2017-2 Ltd 2,786,796 0.554,600,000 Wellfleet CLO 2017-2 Ltd 4,589,172 0.915,850,000 Wellfleet CLO 2017-2 Ltd 5,679,853 1.134,000,000 Wellfleet CLO 2017-3 Ltd 3,809,192 0.762,000,000 Wellfleet CLO 2018-2 Ltd 1,912,124 0.382,300,000 Wellfleet CLO 2018-3 Ltd 2,217,039 0.44
–––––––––––– –––––––Total Collateralised Loan Obligations (31 December 2017: US$486,382,957) 501,945,630 99.86
–––––––––––– –––––––Total investments at fair value through profit or loss
(31 December 2017: US$486,382,957) 501,945,630 99.86
–––––––––––– –––––––
Barings Global Investment Funds 2 PlcBarings Investment Grade CLO FundSchedule of Investments (Unaudited) (continued)
as at 31 December 2018
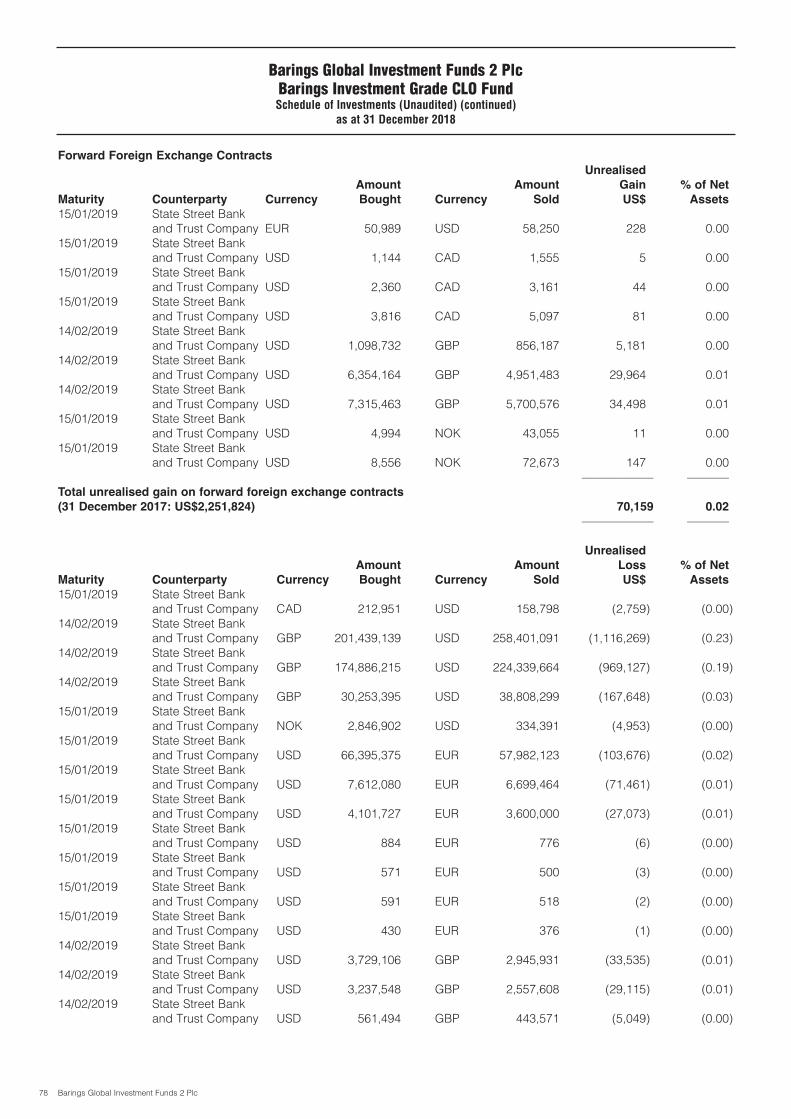
Barings Global Investment Funds 2 Plc 78
Forward Foreign Exchange Contracts
Unrealised
Amount Amount Gain % of Net
Maturity Counterparty Currency Bought Currency Sold US$ Assets
15/01/2019 State Street Bank and Trust Company EUR 50,989 USD 58,250 228 0.00
15/01/2019 State Street Bank and Trust Company USD 1,144 CAD 1,555 5 0.00
15/01/2019 State Street Bank and Trust Company USD 2,360 CAD 3,161 44 0.00
15/01/2019 State Street Bank and Trust Company USD 3,816 CAD 5,097 81 0.00
14/02/2019 State Street Bank and Trust Company USD 1,098,732 GBP 856,187 5,181 0.00
14/02/2019 State Street Bank and Trust Company USD 6,354,164 GBP 4,951,483 29,964 0.01
14/02/2019 State Street Bank and Trust Company USD 7,315,463 GBP 5,700,576 34,498 0.01
15/01/2019 State Street Bank and Trust Company USD 4,994 NOK 43,055 11 0.00
15/01/2019 State Street Bank and Trust Company USD 8,556 NOK 72,673 147 0.00
–––––––––––– –––––––Total unrealised gain on forward foreign exchange contracts
(31 December 2017: US$2,251,824) 70,159 0.02
–––––––––––– –––––––
Unrealised
Amount Amount Loss % of Net
Maturity Counterparty Currency Bought Currency Sold US$ Assets
15/01/2019 State Street Bank and Trust Company CAD 212,951 USD 158,798 (2,759) (0.00)
14/02/2019 State Street Bank and Trust Company GBP 201,439,139 USD 258,401,091 (1,116,269) (0.23)
14/02/2019 State Street Bank and Trust Company GBP 174,886,215 USD 224,339,664 (969,127) (0.19)
14/02/2019 State Street Bank and Trust Company GBP 30,253,395 USD 38,808,299 (167,648) (0.03)
15/01/2019 State Street Bank and Trust Company NOK 2,846,902 USD 334,391 (4,953) (0.00)
15/01/2019 State Street Bank and Trust Company USD 66,395,375 EUR 57,982,123 (103,676) (0.02)
15/01/2019 State Street Bank and Trust Company USD 7,612,080 EUR 6,699,464 (71,461) (0.01)
15/01/2019 State Street Bank and Trust Company USD 4,101,727 EUR 3,600,000 (27,073) (0.01)
15/01/2019 State Street Bank and Trust Company USD 884 EUR 776 (6) (0.00)
15/01/2019 State Street Bank and Trust Company USD 571 EUR 500 (3) (0.00)
15/01/2019 State Street Bank and Trust Company USD 591 EUR 518 (2) (0.00)
15/01/2019 State Street Bank and Trust Company USD 430 EUR 376 (1) (0.00)
14/02/2019 State Street Bank and Trust Company USD 3,729,106 GBP 2,945,931 (33,535) (0.01)
14/02/2019 State Street Bank and Trust Company USD 3,237,548 GBP 2,557,608 (29,115) (0.01)
14/02/2019 State Street Bank and Trust Company USD 561,494 GBP 443,571 (5,049) (0.00)
Barings Global Investment Funds 2 PlcBarings Investment Grade CLO FundSchedule of Investments (Unaudited) (continued)
as at 31 December 2018
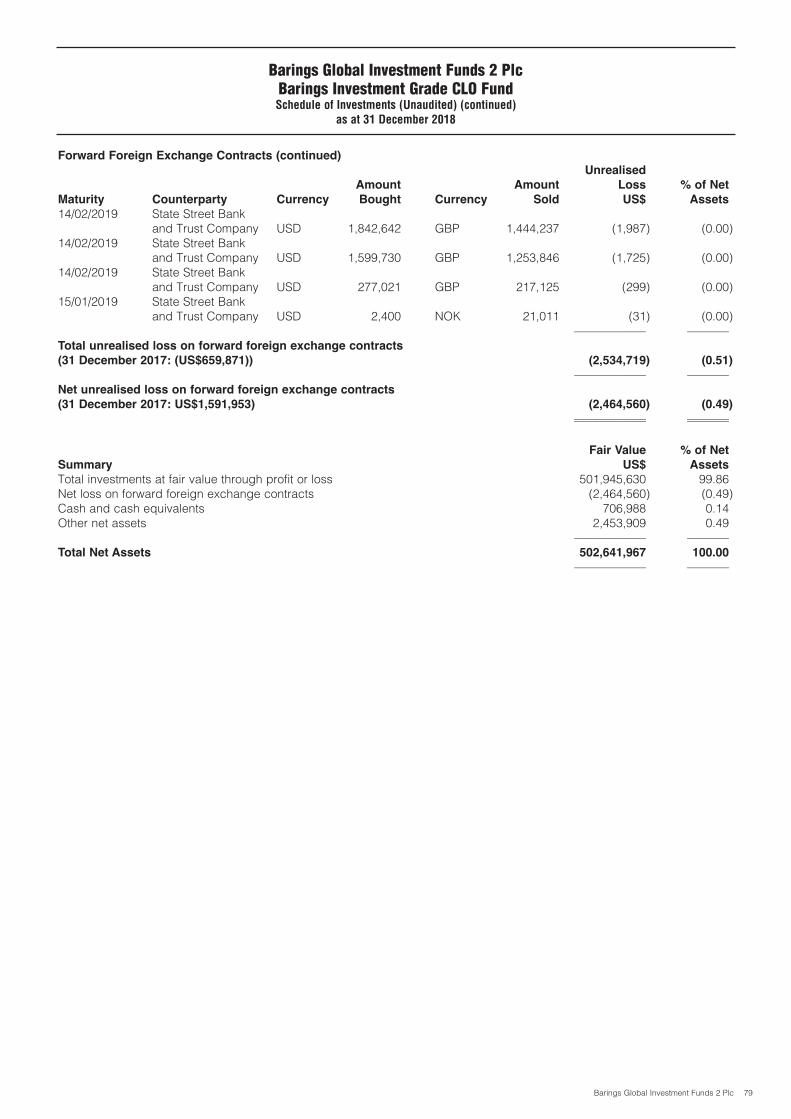
Barings Global Investment Funds 2 Plc 79
Forward Foreign Exchange Contracts (continued)
Unrealised
Amount Amount Loss % of Net
Maturity Counterparty Currency Bought Currency Sold US$ Assets
14/02/2019 State Street Bank and Trust Company USD 1,842,642 GBP 1,444,237 (1,987) (0.00)
14/02/2019 State Street Bank and Trust Company USD 1,599,730 GBP 1,253,846 (1,725) (0.00)
14/02/2019 State Street Bank and Trust Company USD 277,021 GBP 217,125 (299) (0.00)
15/01/2019 State Street Bank and Trust Company USD 2,400 NOK 21,011 (31) (0.00)
–––––––––––– –––––––Total unrealised loss on forward foreign exchange contracts
(31 December 2017: (US$659,871)) (2,534,719) (0.51)
–––––––––––– –––––––Net unrealised loss on forward foreign exchange contracts
(31 December 2017: US$1,591,953) (2,464,560) (0.49)
–––––––––––– ––––––––––––––––––– –––––––
Fair Value % of Net
Summary US$ Assets
Total investments at fair value through profit or loss 501,945,630 99.86Net loss on forward foreign exchange contracts (2,464,560) (0.49)Cash and cash equivalents 706,988 0.14Other net assets 2,453,909 0.49
–––––––––––– –––––––Total Net Assets 502,641,967 100.00
–––––––––––– –––––––
Barings Global Investment Funds 2 PlcBarings Investment Grade CLO FundSchedule of Investments (Unaudited) (continued)
as at 31 December 2018

Barings Global Investment Funds 2 Plc 80
Loan to Subsidiary
Fair Value % of Net
Country Industry Obligor GBP Assets
Ireland Finance Barings Global Multi-Credit Strategy 3 Limited 175,928,570 100.05––––––––––––– –––––––
Total Loan 175,928,570 100.05
––––––––––––– –––––––
Fair Value % of Net
Summary GBP Assets
Total investments at fair value through profit or loss 175,928,570 100.05Other net liabilities (92,253) (0.05)
––––––––––––– –––––––Total Net Assets 175,836,317 100.00
––––––––––––– –––––––
Barings Global Investment Funds 2 PlcGlobal Multi-Credit Strategy Fund 3
Schedule of Investments (Unaudited)as at 31 December 2018

Barings Global Investment Funds 2 Plc 81
Barings Global Investment Funds 2 PlcBarings Investment Grade CLO Fund
Significant Changes in Portfolio Composition (Unaudited)for financial year ended 31 December 2018
Purchases
Cost
Issuer US$
CIFC Funding 2014-V Ltd 18,250,000RR 5 Ltd 8,000,000Crestline Denali CLO XIV Ltd 7,800,000BlueMountain CLO XXIII Ltd 7,000,000Cairn CLO X BV 6,662,731Oaktree CLO 2018-1 Ltd 6,050,000Atlas Senior Loan Fund X Ltd 6,000,000Madison Park Funding XXIX Ltd 6,000,000THL Credit Wind River 2016-2 CLO Ltd 5,000,000BlueMountain CLO XXIII Ltd 5,000,000Oak Hill Credit Partners X-R Ltd 5,000,000Bain Capital Credit CLO 2018-2 5,000,000Cadogan Square CLO XII DAC 4,911,787Diageo Capital Plc 4,498,700Mccormick & Company 4,494,304VF Corp 4,492,206Brown-Forman Corp 4,491,255Aon Corp 4,490,925Rogers Communications 4,490,438Avangrid Inc 4,487,063
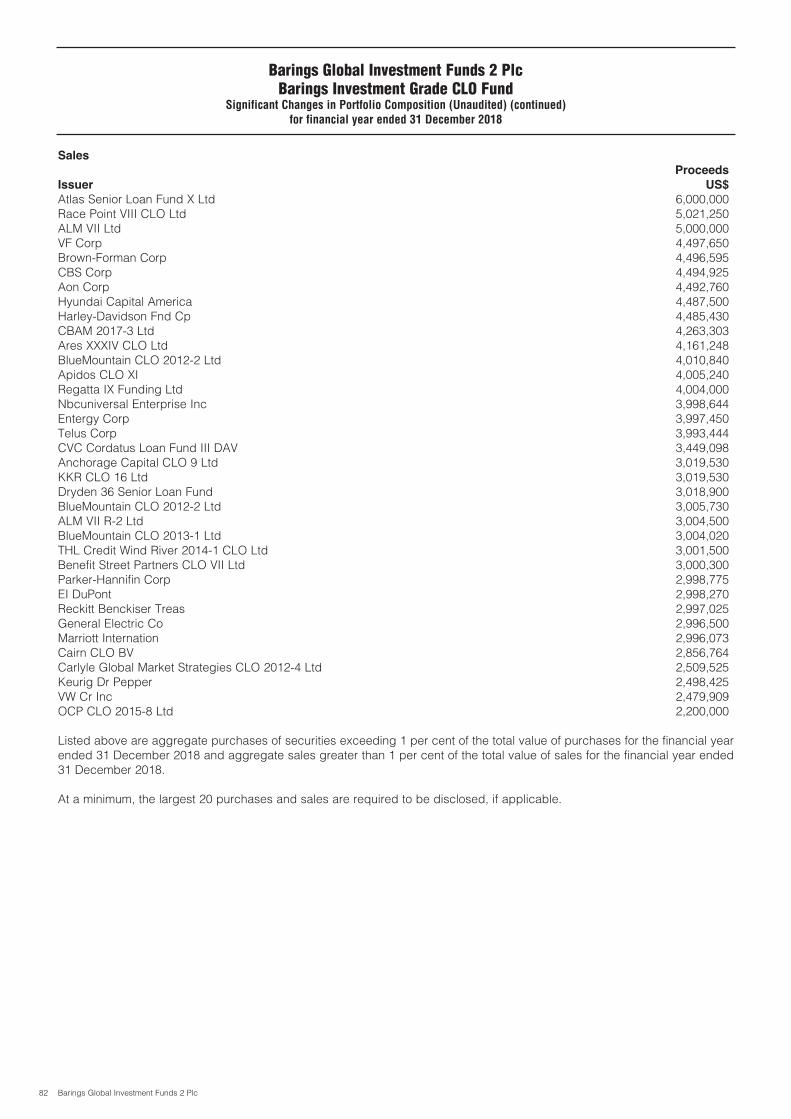
Barings Global Investment Funds 2 Plc 82
Sales
Proceeds
Issuer US$
Atlas Senior Loan Fund X Ltd 6,000,000Race Point VIII CLO Ltd 5,021,250ALM VII Ltd 5,000,000VF Corp 4,497,650Brown-Forman Corp 4,496,595CBS Corp 4,494,925Aon Corp 4,492,760Hyundai Capital America 4,487,500Harley-Davidson Fnd Cp 4,485,430CBAM 2017-3 Ltd 4,263,303Ares XXXIV CLO Ltd 4,161,248BlueMountain CLO 2012-2 Ltd 4,010,840Apidos CLO XI 4,005,240Regatta IX Funding Ltd 4,004,000Nbcuniversal Enterprise Inc 3,998,644Entergy Corp 3,997,450Telus Corp 3,993,444CVC Cordatus Loan Fund III DAV 3,449,098Anchorage Capital CLO 9 Ltd 3,019,530KKR CLO 16 Ltd 3,019,530Dryden 36 Senior Loan Fund 3,018,900BlueMountain CLO 2012-2 Ltd 3,005,730ALM VII R-2 Ltd 3,004,500BlueMountain CLO 2013-1 Ltd 3,004,020THL Credit Wind River 2014-1 CLO Ltd 3,001,500Benefit Street Partners CLO VII Ltd 3,000,300Parker-Hannifin Corp 2,998,775EI DuPont 2,998,270Reckitt Benckiser Treas 2,997,025General Electric Co 2,996,500Marriott Internation 2,996,073Cairn CLO BV 2,856,764Carlyle Global Market Strategies CLO 2012-4 Ltd 2,509,525Keurig Dr Pepper 2,498,425VW Cr Inc 2,479,909OCP CLO 2015-8 Ltd 2,200,000
Listed above are aggregate purchases of securities exceeding 1 per cent of the total value of purchases for the financial yearended 31 December 2018 and aggregate sales greater than 1 per cent of the total value of sales for the financial year ended31 December 2018.
At a minimum, the largest 20 purchases and sales are required to be disclosed, if applicable.
Barings Global Investment Funds 2 PlcBarings Investment Grade CLO Fund
Significant Changes in Portfolio Composition (Unaudited) (continued)for financial year ended 31 December 2018

Barings Global Investment Funds 2 Plc 83
There were no purchases or sales of securities for the financial year ended 31 December 2018. Purchases and Sales arecompleted at the Subsidiary level. Please refer to the financial statements of the Subsidiary.
Barings Global Investment Funds 2 PlcBarings Global High Yield Credit Strategies Fund
Significant Changes in Portfolio Composition (Unaudited)for financial year ended 31 December 2018

Barings Global Investment Funds 2 Plc 84
There were no purchases or sales of securities for the financial year ended 31 December 2018. Purchases and Sales arecompleted at the Subsidiary level. Please refer to the financial statements of the Subsidiary.
Barings Global Investment Funds 2 PlcGlobal Multi-Credit Strategy Fund 3
Significant Changes in Portfolio Composition (Unaudited)for financial year ended 31 December 2018

Barings Global Investment Funds 2 Plc 85
Barings Global Investment Funds 2 Plc
Disclosure of Remuneration (Unaudited)for financial year ended 31 December 2018
Remuneration Disclosure
Barings LLC paid the following remuneration to staff in respect of the financial year ending on 31 December 2018 in
relation to work on Barings Global Investment Funds 2 Plc and its related Funds:
31 Dec 2018
US$ (000)
Fixed remuneration 564Variable remuneration 1,634
––––––––––Total remuneration 2,198
––––––––––––––––––––Number of Beneficiaries: 89
The above disclosures reflect the remuneration attributable to the Funds only. For these purposes, the total remunerationattributable to the activities of Barings LLC has been allocated to each fund under management.
The total remuneration disclosed above is notionally allocated between the Funds managed by Barings LLC, for
disclosure purposes, as follows:
USD (000)
Fixed Variable
Barings Global High Yield Credit Strategies Fund 460 1,394Barings Senior CLO Debt Fund 67 130Global Multi‐Credit Strategy Fund 3 36 110
–––––––––– ––––––––––Total Barings Global Investment Funds 2 Plc remuneration 563 1,634
–––––––––– –––––––––––––––––––– ––––––––––
The total remuneration disclosed above relates to the staff of Barings LLC that have worked on the Funds. It has been allocatedbetween the funds under management of Barings LLC in proportion to the income received from the Funds during 2018.However, it is not possible to attribute remuneration paid to individual staff directly to income received from any fund.
Amounts paid to Senior Staff US$ (000)
Aggregate remuneration of senior management 29,756Aggregate remuneration of employees whose actions have a material impacton the risk profile of the management of the Funds by Barings LLC 32,477
The remuneration indicated above represents the total remuneration of the relevant Barings LLC staff that worked on the Fundsand other senior management employed by Barings LLC, but does not otherwise include remuneration paid to personnelemployed by Barings LLC's delegates or other members of the Board not employed by Barings LLC.

Barings Global Investment Funds 2 Plc 86
Total Expense Ratio (“TER”)
The average TER table shows the actual expenses incurred by the Fund, expressed as an annualised percentage of theaverage (“Avg.”) Net Asset Value (“NAV”) of the Funds for the financial year ended 31 December 2018.
Expense %
of Avg. NAV
Barings Global High Yield Credit Strategies Fund 31 Dec 2018
Class A GBP Accumulation Shares 0.53Class A GBP Distribution Shares 0.53Class B GBP Accumulating Shares 0.61Class B GBP Distribution Shares 0.61Class B USD Accumulating Shares 0.60Class C CAD Accumulating Shares 0.69Class C GBP Accumulating Shares 0.68Class C GBP Distribution Shares 0.69Class C USD Accumulating Shares 0.68Class C USD Distribution Shares 0.67Class D CAD Accumulating Shares 0.78Class D EUR Accumulating Shares 0.78Class D EUR Distribution Shares 0.79Class D GBP Accumulating Shares 0.79Class D GBP Distribution Shares 0.79Class D NOK Accumulating Shares 0.78Class D USD Accumulating Shares 0.78Class D USD Distribution Shares 0.78Class E EUR Distribution Shares 1.19Class E USD Accumulating Shares 1.18Class E USD Distribution Shares 1.18Class F GBP Accumulating shares 0.09Class F USD Accumulating shares 0.08Class G USD Distribution Shares 1.67Class S USD Accumulating Shares 0.37
Expense %
of Avg. NAV
Barings Investment Grade CLO Fund 31 Dec 2018
Class A GBP Accumulating Shares 0.29Class A GBP Distribution Shares 0.28Class A USD Accumulating Shares 0.28Class C GBP Distribution Shares 0.32Class D CAD Accumulating Shares 0.37Class D EUR Accumulating Shares 0.37Class D NOK Accumulating Shares 0.37Class D USD Accumulating Shares 0.36Class D USD Distribution Shares 0.36
Expense %
of Avg. NAV
Global Multi-Credit Strategy Fund 3 31 Dec 2018
Class T GBP Accumulating Shares 0.62
Barings Global Investment Funds 2 Plc
Appendix - Total Expense and Performance Data (Unaudited)
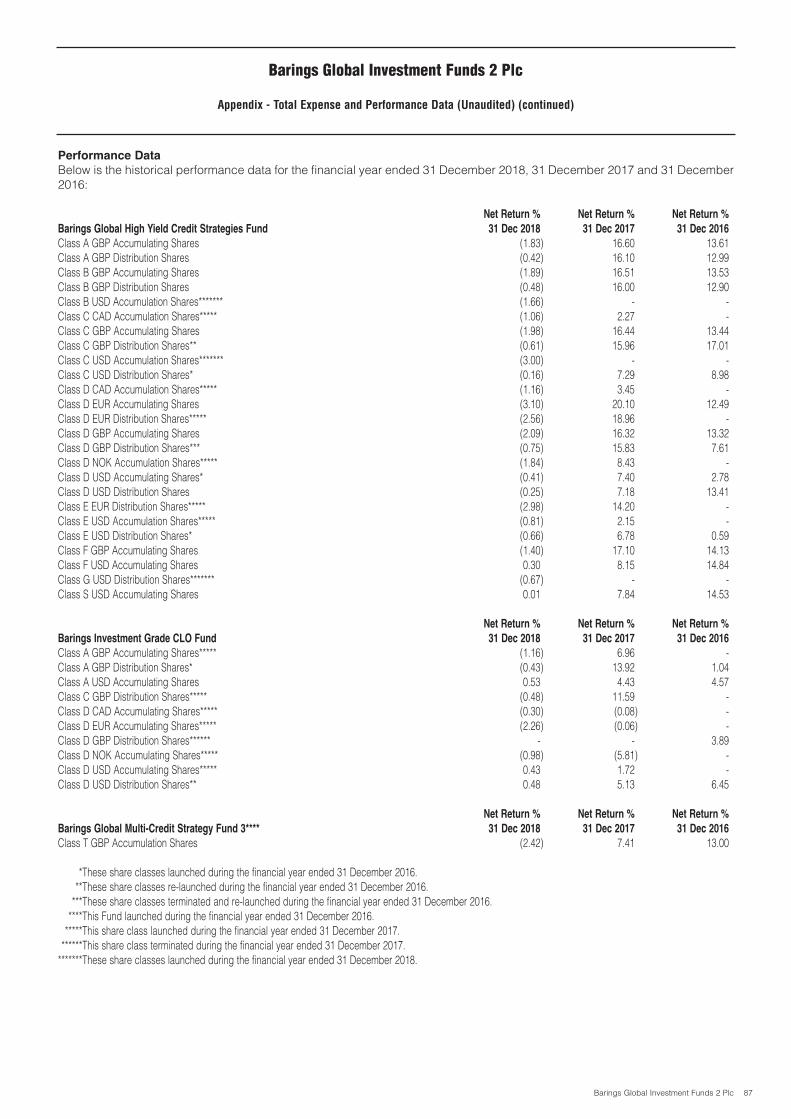
Barings Global Investment Funds 2 Plc 87
Performance Data
Below is the historical performance data for the financial year ended 31 December 2018, 31 December 2017 and 31 December2016:
Net Return % Net Return % Net Return %
Barings Global High Yield Credit Strategies Fund 31 Dec 2018 31 Dec 2017 31 Dec 2016
Class A GBP Accumulating Shares (1.83) 16.60 13.61Class A GBP Distribution Shares (0.42) 16.10 12.99Class B GBP Accumulating Shares (1.89) 16.51 13.53Class B GBP Distribution Shares (0.48) 16.00 12.90Class B USD Accumulation Shares******* (1.66) - -Class C CAD Accumulation Shares***** (1.06) 2.27 -Class C GBP Accumulating Shares (1.98) 16.44 13.44Class C GBP Distribution Shares** (0.61) 15.96 17.01Class C USD Accumulation Shares******* (3.00) - -Class C USD Distribution Shares* (0.16) 7.29 8.98Class D CAD Accumulation Shares***** (1.16) 3.45 -Class D EUR Accumulating Shares (3.10) 20.10 12.49Class D EUR Distribution Shares***** (2.56) 18.96 -Class D GBP Accumulating Shares (2.09) 16.32 13.32Class D GBP Distribution Shares*** (0.75) 15.83 7.61Class D NOK Accumulation Shares***** (1.84) 8.43 -Class D USD Accumulating Shares* (0.41) 7.40 2.78Class D USD Distribution Shares (0.25) 7.18 13.41Class E EUR Distribution Shares***** (2.98) 14.20 -Class E USD Accumulation Shares***** (0.81) 2.15 -Class E USD Distribution Shares* (0.66) 6.78 0.59Class F GBP Accumulating Shares (1.40) 17.10 14.13Class F USD Accumulating Shares 0.30 8.15 14.84Class G USD Distribution Shares******* (0.67) - -Class S USD Accumulating Shares 0.01 7.84 14.53
Net Return % Net Return % Net Return %
Barings Investment Grade CLO Fund 31 Dec 2018 31 Dec 2017 31 Dec 2016
Class A GBP Accumulating Shares***** (1.16) 6.96 -Class A GBP Distribution Shares* (0.43) 13.92 1.04Class A USD Accumulating Shares 0.53 4.43 4.57Class C GBP Distribution Shares***** (0.48) 11.59 -Class D CAD Accumulating Shares***** (0.30) (0.08) -Class D EUR Accumulating Shares***** (2.26) (0.06) -Class D GBP Distribution Shares****** - - 3.89Class D NOK Accumulating Shares***** (0.98) (5.81) -Class D USD Accumulating Shares***** 0.43 1.72 -Class D USD Distribution Shares** 0.48 5.13 6.45
Net Return % Net Return % Net Return %
Barings Global Multi-Credit Strategy Fund 3**** 31 Dec 2018 31 Dec 2017 31 Dec 2016
Class T GBP Accumulation Shares (2.42) 7.41 13.00
*******These share classes launched during the financial year ended 31 December 2016.*******These share classes re-launched during the financial year ended 31 December 2016.*******These share classes terminated and re-launched during the financial year ended 31 December 2016.*******This Fund launched during the financial year ended 31 December 2016.*******This share class launched during the financial year ended 31 December 2017.*******This share class terminated during the financial year ended 31 December 2017.*******These share classes launched during the financial year ended 31 December 2018.
Barings Global Investment Funds 2 Plc
Appendix - Total Expense and Performance Data (Unaudited) (continued)