
302 THE MADRAS UNIVERSITY JOURNAL [Vol. XXV
21
Transcript of 302 THE MADRAS UNIVERSITY JOURNAL [Vol. XXV

302 THE MADRAS UNIVERSITY JOURNAL [Vol. XXV
June. Vijayaraghavan (1951) has investigated the food and feeding habits of the fish and Mahadevan (1950) has described the histology of the alimentary tract. Some amount of work on the biology of the fish has been done on the West coast also. (See Prabhu, 1955, for literature concerning the species).
Material and Methods
Ribbon fish are caught in Madras in boat-seines and shoreseines; only the latter land their catches in fresh condition, and so the material for this study was collected only from them. The samples were obtained, from the landing place itself, usually once a week, during the period August 1948 to June 1949 and August 1949 to June 1950. In the laboratory the gonads and alimentary canal were dissected out and the fish preserved in 10% formalin wherein they were kept for 7-10 days. The gonads were weighed after removing the excess body fluids by a filter paper and then preserved in 5% formalin. The classification of maturity stages was modelled after the standards adopted by the International Council for the Exploration of the Sea; the weight of the gonads served to support this. The alimentary canal was also preserved in 5% formalin for a later study of the contents. On a prelimin;iry. examination, it was seen that the fish feed mainly on teleosts and larger crustaceans. As only broad groupings were necessary for purposes of this investigation, the stomach contents were classified into (a) crustacea, (b) teleosts and (c) the rest including digested matter. The volumes of these categories were also determined, usually by the displacement method.
The main method adopted for the assessment of the fat content of the muscles was the histological technique recommended by Wilson (1939), whereby the fatness of 'a fish is judged by the extent of the area stained in a slice taken from it. That portion of the body which gives the best picture of fat when stained is determined first. From a comparative study of the slices of this part prepared from a large number of fish, different degrees or grades of fatness are defined. In subsequent analyses of samples every indivi'dual is allotted one or the other of these fat degrees. To make the fixation of fat values less arbitrary, the following procedures were adopted : (1). The area of the most prominent, stained regions in a slice was measured by a net-micrometer under a constant magnification (6 X 3) and expressed in terms of a slice of standard dimensions (height 100 mm, width 50 mm). Thus, the range of

•
1.955] FAT CONTENT OF RIBBON FISH 303
variation in the area of the relevant fatty regions in slices of dif.ferent fat degrees could be determined. (2). After taking a slice and preserving it in 10% formaliu, a s~ple of body muscles was prepared from a fresh fish and the fat extracted chemically, first With->"edistilled rectified spirit and then: with ether. Repetition of this experiment gave the range of fat values indicated by the different fat degrees (see table1). The a~vantages of the methods described above over procedures which d.!'pend purely on chemical extraction are obvious. (For further details of techniques adopted, see Sek:liaran 1949 and 1950).
Distribution of adipose tissue
As mentioned earlier, attention here is confined mainly to fat stored in and around the body muscles. Of the fat-storing tissues, the most prominent ones are situated above the neural spine and a little way down from the upper tip of the slice. In this region can
. be distinguished (a) a lower triangular area (b) a club-shaped area above it and (c) a more dorsal coloured patch on either side o(the median septum. The total area of these tissues exceeded that of others in slices taken from fishes of different fat degrees, and they also. could be conveniently measured. Hence only these tissues were taken into account when calculating the areit of fat-spread.
Among the other sites of fat storage, the muscle at the top of the slice 'which is divided by a septum into a crescent-shaped part above and a small circular portion below is noteworthy. In fish of poor fat content the two parts are distinct, but with increased aceumulation of fat in the muscles, they merge into one another (see fig. 1). Sub-cutaneous fat is not well developed in the ribbon fish. It is arranged in very small patches opposite the septa that divide the laternal muscles. Adipose tissue also extends along the septa that traverse the muscles ill upper region of the slice. In addition to these, the centrum and the arches above and below it reveal coloured patches.
Fat degrees: · A preliminary examination showed that as in the case of the flounder (Wilson 1939) slices taken from the widest part of the body midway between head and tail gave the best picture of fat. The two faces of a slice varied little with regard to the general appearance of ·fatness, nor did sex make any marked difference. After a careful and repeated comparison of slices prepared from different samples, it was seen that the individuals comprising
,
304 THE MADRAS UNIVERSITY JOURNAL [Vol. XXV
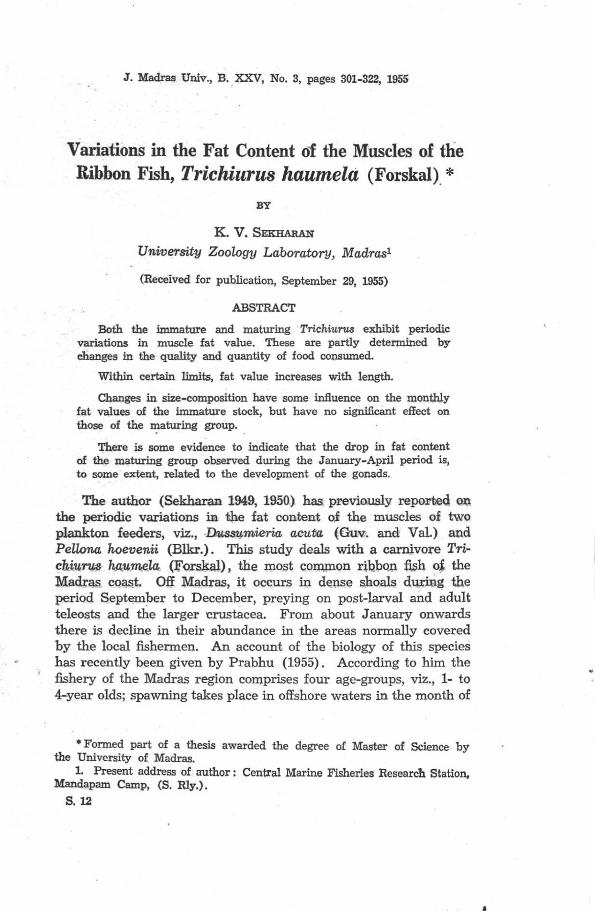
the population could be graded into eight degrees of fatness. Typical slices representing the different fat degrees are illustrated in fig. 1. In table 1, the second 'Column gives the area of the median dorsal
2 3 4
~
"- .J "'!; l\7'
5 6 7
8
Fig. 1.
Diagramatic representation of typical slices of the ribbon fish of different fat degrees. (The numbers
refer to fat degrees) ..
stained region measured under a magnification of 6 X 3 and expressed in terms of a slice of standard slice. The amount of fat present in fishes of different fat degrees, as determined by chemical extraction, is shown in column 3.
..
•
,
1
1955] FAT CONTENT OF RIBBON FISH
TABLE 1
305
The relation of fat degrees to (1) the area of the median dorsal adipose tissue in a slice of standard dimensions (100 mm. 50 mm.) and .(2) to the amount of fat as determined by chemical extraction.
Fat Degrees
1
2
3
4
5
6
7
8
The area of the median dorsal adipose tissues. (Measured under the magnification, 6 X 3, and expressed in tenus of the number of squares of the net-micrometer)
up to 250
250-400
400-550
550-700
700-850
850-1000
1000-1150
1150-1300 or above.
Grouping of TTichiuTUS
Percentage of fat in fish of different fat
degrees.
up to 0'5
0'5-0'9
0'9-1'3
1'3-1'7
1 '7-2'1
2'1-2'5
2'5-2'9
2'9-3'5
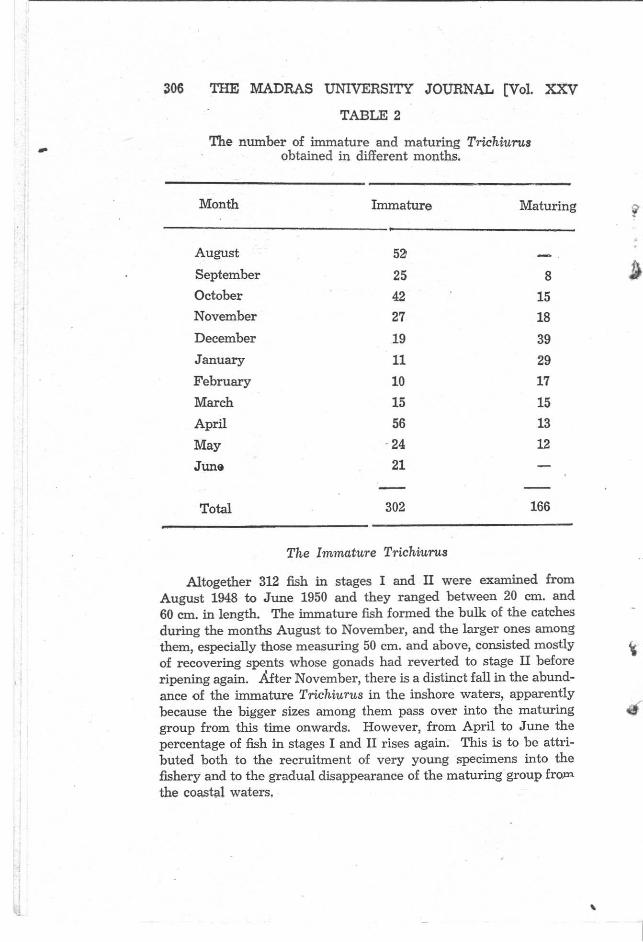
Primary grouping in the case of the ribbon fish was done with reference to the scale of maturity. This was a reversal of the principle followed in regard to Dussumieria and Pellona (Sekharan, 1949 and 1950), which were first classified according to size and fat variations studied in relation to the period of the year, food and maturity. For the ribbon fish two broad groups were recognised, viz., inunature and maturing. The immature group consisted of fish whose gonads were in stages I and II; those in stage II and above were included in the maturing group. It may be of interest to add here that the commercial catches did not contain specimens in stage VI (spawning) . The samples collected during the period of the study totalled 468 individuals. Table 2 gives the numerical strength of the two groups in different months.
•
: I I
306 THE MADRAS UNIVERSITY JOURNAL [Vol. XXV
TABLE 2
The number of immature and maturing Triehiurus . obtained in different months.
Month Immature
August 52
September 25
October 42 November 27
December 19
January 11 February 10
March 15
April 56 May · 24
June 21
Total 302
The Immature TTichiurus
Maturing
8
15
18
39
29
17
15
13
12
166
Altogether 312 fish in stages I and II were examined from August 1948 to June 1950 and they ranged between 20 cm. and 60 cm. in length. The immature fish formed the bulk of the catches during the months August to November, and the larger ones among them, especially those measuring 50 cm. and above, consisted mostly of recovering spents whose gonads had reverted to stage II before ripening again. After November, there is a distinct faU in the abundance of the immature TTichiurtts in the inshore waters, apparently because the bigger sizes among them pass over into the maturing group from this time onwards. However, from April to June the percentage of fish in stages I and II rises again. This is to be attributed both to the recruitment of very young specimens into the fishery and to the gradual disappearance of the maturing group fr= the coastal waters.
•

...
t
1955] FAT CONTENT OF RIBBON FISH 307
The monthly fat values of the immature stock are represented .in fig. 2 and table 3. As there was no significant variation between the two years with regard to the periodic trends of fatness, the figures for corresponding months are combined. So also, the s<'xes did not differ much .in their fat content, and therefore they were not treated separately.
SEPTEMBER
I,.,..,..,.., ..... .,........., ~
Fig. 2.
The fat value of immature Trichiurus in different months. (In terms of percentage number in each fat degree.)
In August about 20% of the fish were .in fat degree 1 and 25% were in degree 5 -";'d above. The comparable figures for October were 2% and 57% respectively, which indicates a rapid improvement in the quality of the ribbon fish. Of the immature fish of November, there were none in degree 1 and in December those in degrees 5 and above constituted about 63% of the sample. It was also noticed that fat degrees 1 and 2 were unrepresented during this month. These lower degrees of fatness reappear in about 27% of the fish included in the January sample, another striking feature of which was the absence of degrees 7 and 8. It will be apparent

308 THE MADRAS UNIVERSITY JOURNAL [Vol. XXV
from this that in January the immature fish suffered a drop in fat value compared to their condition in December. This decline continued during the succeeding months as well, and in April as much as 45 % were in degree 1 and there were no specimens in. degrees >!hove 4. A "gght rec<'!very is indicated for the months of May and June. 1
TABLE 3
The fat value of immature TrichiuTUs in different months.
Months
. August
September
October
November
~cember
January
February
March
ApPl
May June
Fat Degrees
1 2 3 4 5 6 7 8
10 9 11 9 6
1 , 4335
1 746 7
412 7 1 1
872
3 4 4 2 8 4 2
3 4 4 521
1 2 3 2 2 1
2 1 1 321
643 2
25 16 10 5
7 6 632
64542
Average
3'3 4'5
4-7
5·0
5'1
4'4
3'5 2,1
1'9 2'5
2'6
'1
The mean monthly fat degrees of the fish are given in table 3. ~ They also show that the immature stock were fattest in the months November and December and leanest in April.
Fat content of immature TrichiuTUs in r.elation to length
As mentioned before, the immature stock available in the inshore waters embraced a wide range of size. In order to ascertain whether fat content varied, to any extent, with length, the fish were arbitrarily divided into four size-groups, viz., 20-29 em., 30-39 cm.,

I' , ,
I
•
..
1955,1 FAT tONTENT OF RIBBON FISH 309
40-49 em. and 50-59 em. The average fat degrees of the' various length-groups during different months are indicated in table 4 .
• ,TABLE 4
The -Ielation of length to fatness in immature TTichiuTUs (t!le number of fish in each length group is given within
- ,: brackets)
Length groups Months
20-29 em. 30-39 cm. 40-49 C.m. 50-59 cm.
August l·S (15) 3·2 (5) 3·S (24) !).-1 (S) . September 2·0 (1) 3·6 (S) 4·9 (7) 5·2 (9)
October 4·2 (21) 5·1 (20) 5·0 (1)
November 4·4 (7) 5·3 (20)
December 4·9 (15) 6·() (4)
January 4·1 (9) 5·5 (2)
February 3·5 (10)
March 2·1 (15)
April 1·9 (41) 2·0 (15)
May 2·2 (9) 2'6 (15)
June 2·1 (S) 2·9 (13)
Average fat degree 1·9 3·4 4·S 5·2
It: will t;~ e;;;.cient th~t -among TrichiuTUS of maturity stages I and II, the larger ones .u-e consistently fatter. But the data also show that there are periodic variations in the size-composition of tne immature group. Hei:ice, when the larger, fatter fish ripen their gonads and enter fhe maturing group, -or 'When there is a recruitment of smaller sizes into the fishery, the average fat value of the imn:1"ture stock as a whole would fall. With a view to investi. gating this aspect still further, 'the average length of the samples
S.13

310 THE MADRAS UNIVERSITY JOURNAL [Vol. XXV
examined in different months were calculated and compared with the fat value of the stock. (See fig. 3).
The mean size of the fish is more than 40 cm. during the months August to November, and it reaches the minimum in April. In May and June there is another rise in average length. This might to some extent explain the observed fluctuations in fat content of the immature stock. However, this relation is not always apparent and some of the discrepancies may be drawn attention to here. Thus, though the highest level of fatness was noted in December, the mean size of the fish of that month was considerably lower than
,. 6
/\ / .
/ '. . , 40- 5-
/ V'" __ '- ___
..,. \ " u ~ 3-
§ .. .. 0
1= 30
" z "' ..,
25
r .-- \.
'l...._. ., I
gJ / " " , i;l
" 3
... < .. ,
A'UG, SEP. OCT NOV DEC JAN. FES. MAR APR. MAY JUN.
Fig. 3.
Average fat degree (- - -), mean length (_. - . -) and food (teleosts) (--) in immature TrichiuTUS.
that recorded during November. Similarly, both the February and March samples had the same average length, yet the March nsh were much leaner than those of February. These instances point to the likelihood of the fat cycle being influenced by other factors as well, of which food is perhaps the most important.
~ 4010 ~
o z o .,
30r. ~ ~ i
0% ~ s: Q
lO~ I
t
1955] FAT CONTENT OF RIBBON FISH 311
Food and Fatness in Immature TrichiuTUs
The results of analyses of the stomach contents are summarised in table 5.
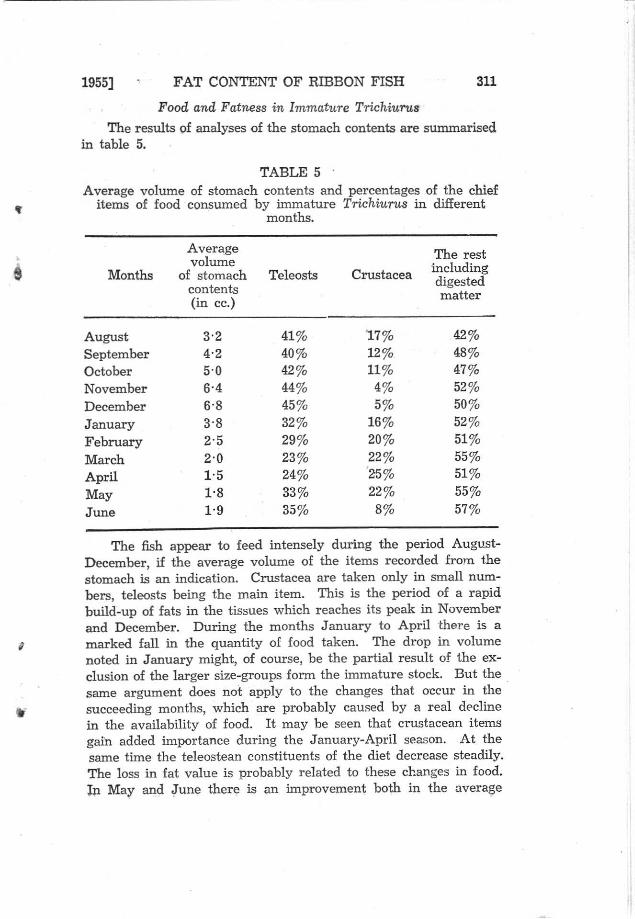
TABLE 5 Average volume of stomach contents and percentages of the chief
items of food consumed by immature Trichiurus in different months.
Average The rest volume including Months of stomach Teleosts Crustacea contents
digested
(in cc.) matter
August 3'2 41% 17% 42 % September 4'2 40% 12% 48% October 5'0 42% 11% 47% November 6'4 44% 4% 52%
December 6'8 45% 5% 50%
January 3'8 32% 16% 52%
February 2'5 29% 20% 51%
March 2'0 23 % 22% 55%
April 1·5 24% '25% 51%
May 1-8 33% 22% 55%
June 1'9 35% 8% 57%
The fish appear to feed intensely during the period AugustDecember, if the average volume of the items recorded from the stomach is an indication. Crustacea are taken only in small numbers, teleosts being the main item. This is the period of a rapid build-up of fats in the tissues which reaches its peak in November and December. During the months January to April there is a marked fall in the quantity of food taken. The drop in volume noted in January might, of course, be the partial result of the exclusion of the larger size-groups form the immature stock. But the . same argument does not apply to the changes that occur in the succeeding months, which are probably caused by a real dpcline in the availability of food. It may be seen that crustacean items gai'n added importance during the January-April season. At the same time the teleostean constituents of the diet decrease steadily. The loss in fat value is probably related to these changes in food. In May and June there is an improvement both in the avera!je

312 THE MADRAS UNIVERSITY JOURNAL [Vol. XXV
volume of food and the quantity of teleosts consumed, which coin.cides with an increase in the fat content of the muscles.
Maturing TriehiuTUs
Maturing fish (those in stage and above) are always relatively large, measuring not more than 40 em. in length. They shoal in the inshore waters from September to January, gradually forsaking
SEPTEMBER.
'" '" '"
",'
., ., '" a:
~ " ., '"
'" '" .. .. -< -< ... ..
Fig. 4.
The fat value of maturing Trichiuf"tLB in different monilis (in terms of percentage number in
each fat degree).
the area in later months. The June and July catches contain practically no ribbon fish of this category. The data presented in table 7 give a probable explanation for this. After February, the maturintl fish belong to st.ages above ITl; also, the observed weight of th~
•
1955] FA"T CONTENT OF RffiBON FISH 313
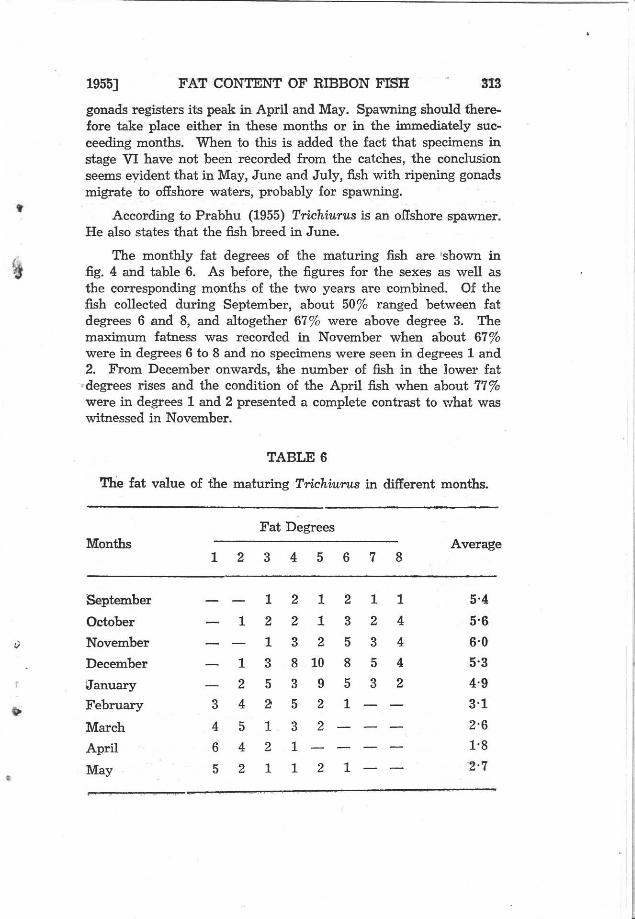
gonads registers its peak in April and May. Spawning should therefore take place either in these months or in the immediately succeeding months. When to this is added the fact that specimens in stage VI have not been recorded from the catches, the conclusion seems eyident that in May, June and July, fish with ripening gonads migrate to offshore waters, probably for spawning.
Accor-ding to Prabhu (1955) TTichiuTUS is an offshore spawner. He also states that the fish breed in June.
The monthly fat degrees of the maturing fish are 'shown in fig. 4 and table 6. As before, the figures for the sexes as well as tbe corresponding months of the two years are combined. Of the fish collected during September, about 50% ranged between fat degrees 6 and 8, and altogether 67% were above degree 3. The maximum fatness was recorded in November when about 67% were in degrees 6 to 8 and no specimens were seen in degrees 1 and 2. From December onwards, ihe number of fish in the lower fat
>degrees rises and the condition of the April fish when about 77% were in degrees 1 and 2 presented a complete contrast to what was witnessed in November.
TABLE 6
The fat value of the maturing TrichiuTUS in different months.
Months
September
October
November
December
cranuary
February
March
April
May
Fat Degrees
1 2 3 4 5 6 7 8
1 2 1 2 1 1
122 1 324
13253 4 1 3 8 10 8 5 4
2 5 3 953 2
3 425 2 1
4 5 1 3 2
642 1
5 2 112 1
Average
5'4
5'6 6'0 5'3 4·9
3'1
2'6
1'8 -2'7
314 THE MADRAS UNIVERSITY JOURNAL [Vol. XXV
When the monthly mean fat degrees were calculated they gave the same general picture as described above. November "howed the highest average arid April the smallest. In May only 12 specimens could be collected and the mean fat value for that month was greater than that noted for April. Taking into consideration the sma1iness of the sample, the increase is possibly not significant. However, the probability that it portrays a real upward trend cannot be discounted, especially since the inunature stock also exhibits a similar phenomenon at this time.
I Fatness and length of maturing fish
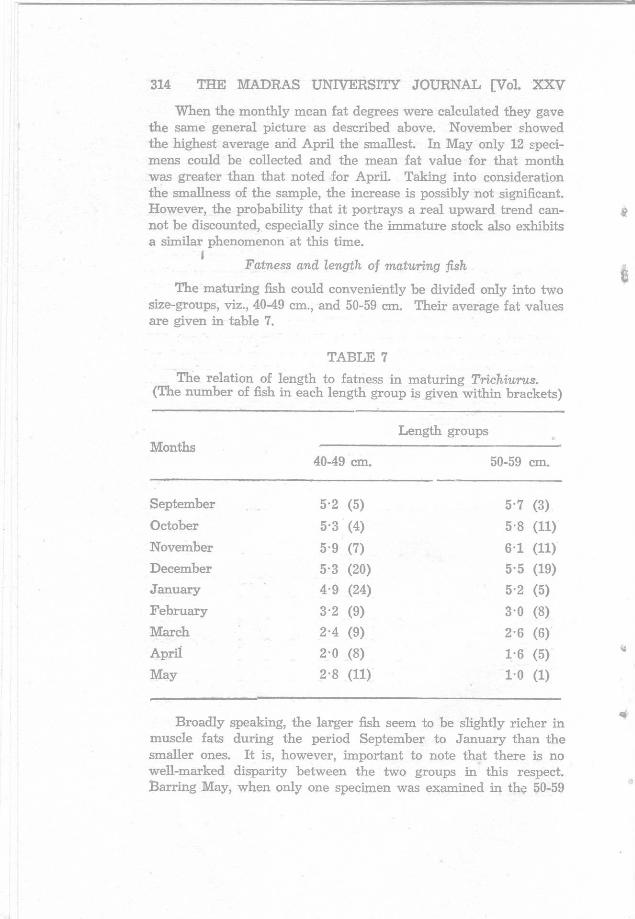
The maturing fish could conveniently be divided only into two size-groups, viz., 40-49 cm., and 50-59 em. Their average fat values are given in table 7.
TABLE 7
The relation of length to fatness in maturing Trichiu'l'Us. (The number of fish in each length group is given within brackets)
Length groups Months
40-49 cm. 50-59 em.
September 5'2 (5) 5'7 (3) October 5'3 (4) 5'8 (11)
November 5'9 (7) 6'1 (11)
December 5'3 (20) 5'5 (19) January 4'9 (24) 5'2 (5) February 3'2 (9) 3'0 (8) March 2'4 (9) 2'6 (6) April 2'0 (8) 1'6 (5) May 2'8 (11) 1'0 (1)
Broadly speaking, the larger fish seem to be slightly richer in muscle fats during the period September to January than the smaller ones. It is, however, important to note that there is no well-marked disparity between the two groups in this respect. Barring May, when only one specimen was e:s;amined in tho;> 50-59
~
•

I . ~
1 5 5
,,; o 1.2 4 i!i ~
"' '" " ;) " ., ?5 0.9 " 3
" .. !;; 0
fi: ..
Q 0.6 2
~
0. 3 1
1955] FAT CONTENT OF RIBBON FISH 315
em. group, the maximum value of the difference amounted only to O' 5 fat degree and it occurred in the months of September and October. During the other months it ranged between O· 2 and O' 4 fat degree, which is perhaps well within the experimentai error inherent in the methods employed. It may therefore be slh'"Illised that changes in size-composition would be of little consequence as far as the fat value of the maturing group is concerned-a condition remarkably different from that of the immature stock.
The average lengths of the monthly samples are plotted in fig. 5. The October sample had the maximum mean size, but the peak value for fatness was recorded in November. Again, the mean size was practically the same in the months of March and April,
......... ", , -.....- , .. ..- ..... '" .J>......
0 - .. "'\ 0
Y '" ...
i ....... 8 . '. z
.I ...... ~ 0 ." ... l'l , i'l ~
\ ... ~
\1 I 0
" '. g n 0
70%
60
50
40
3
~ 2
"'
SEP. OCT NOV DEC JAN FEB. MAR· MAY
Fig.5.
Average fat degree (- - -), mean length (-' -' -). food teteosts) V.:=.::.:) and average weight of the gonads (--) in maturing Trichiu.rus.
while in February it was greater than that shown for January; and yet, the fish become progressively leaner from January onwards. Apparently, the fat cycle has to be explained in terms of other factors. Of the latter, two most obvious ones, viz., food and maturity are considered here.
50
5 2
, M
SO ~ ;l c ." .,
48 {Jj
'" z " " 46 ..:....
44

, •
316 THE MADRAS UNIVERSITY JOURNAL [Vol. XXV
Food ot maturing fish in relation to tat content
~e maturing fish seem to maintain a uniformly high rate of feeding from October to December. Teleosts which form the staple diet are abundant at this time and the stomach always revealed a large number of fish belonging to various families. Sometimes they even formed 80-90% of the contents.
TABLE 8
The average volume of stomach contents and the percentages of the chief items of food consumed by maturing Trichiurus
Months
September
October
November
December
January
February
March
April
May
in different months.
Average volume of
Teleosts food taken (in cc.)
5·6 45% 6·4 54%
7-5 61%
7·1 59% 6·2 45%
5·5 46%
4·9 40%.
4·a 35%
5·2 44%
The rest
Crustacea in<;luding digested matter
5% 50%
3% 43%
5% 34%
6% 35%
10% 45%.
8% 46%
11% 49%.
13% 52%.
11% 45%
Crustaceans are taken only irregularly and that too only in small quantities. The intensity of feeding and the abundance of teleostean items probably contribute to a great increase in fat deposition which reaches its peak in November. In December feeding does not change appreciably either in quality or in quantity, but the fat content or the muscles shows a downward . trend. But from january onwards the proportion of teleosts found in the stomach drops, and the fish on the whole takes in less volume of food. Crustacea continue to be a numerically important item of the diet, but apparently are not fattening enough, and in April when the ribbon fish is poorest in average fatness teleostean items decline to their minimum value.
I~
IJ

.. ,
1955] FAT CONTENT OF RIBBON FISH 317
Maturation in relation to fatness
In December, the intensity of feeding is ahnost the same as before, especially as far as it applies to teleostean constituents; still a lowering of fat value is noticed. Probably this is the result of the fat expenditure necessitated by the growth of gonads (see fig. 5). From September to November the fish are in stage III and they are very rich in fat because the loss, if any, from the inuscles during the transition from stage II to stage III would be small and could perhaps be more than compensated for by the intensity of feeding. Besides, it is possible that the fat required for the development of the gonads came from the liver and other visceral organs which have not been considered here.
The average weight of the gonads and the number of fish in different maturity stages are shown in table 9. (In the table the weights of both testis and ovary are combined to get the average).
TABLE 9
The stages of maturity and the average weight of gonads of Trichiurus in different months
Average
Months Maturity stages weight
of the I II III IV V gonads
(in gms.)
September 8 0·17
October 15 0·20
November 18 0·25
December 35 4 0·40
January 6 20 3 0·52
February 2 9 6 o·n March 8 7 0·98
April 3 10 1·50
May 12 1·80
The gonads have an average weight of about 0·25 gm. in November, and it goes up to about 0·40 gm. in December when same of the fish enter maturity stage IV. These changes probably result in the
S.14
•

318 THE MADRAS UNIVERSITY JOURNAL [Vol. XXV
withdrawal of muscle fats which the' fish is unable to replace in spite of vigorous feeding. During January the number of fish in stage IV increases and stage V is also touched, and by April the majority are in stages IV and V. Progression of maturity is ac-
I companied by a rather rapid increase in the weight of the gonads and it coincides with lhe depletion of fat reserves. Fats are probably not deposited in the ova after stage V, and the month of May when stage V is the dominant maturity scale, registers a slight increase in the muscle fats of the stock.
Discussion
From a comparison of the results summarised in tables 3 and 6 it will be evident that maturing Trichiurus are on the whole fatter than the immature ones. The two groups also vary with reference to their diet,the former taking in more of teleosts and less of crustacea than the latter. But this could perhaps be regarded as partially incidental to the difference in their average lengths. This aspect, namely the relation between food and length in the ribbon fish has been investigated by Vijayaraghavan (1951). He divides the population into two categories according to size, and finds that the menu of the bigger fish includes a greater proportion of teleosts and less of crustacea than that of the smaller ones. According to Prabhu (1955) Trichiurus haumela is a selective feeder. He also observes that fish of 46-62 cm. feed on fewer prawns and smaller fish than the younger ones. A further dissection of his data shows that the teleosts taken by fish less than 39cm. consist of Anchoviella spp., Dussumieria spp., Leiognathus spp. and rarely of Therapon spp. and Caranx spp; but a wider r~ge of species belonging to various families is preyed upon by the larger individuals. The maturing Trichiurus, as has already been explained, have a sizerange of 40-59 cm., while the immature fish vary from 20 to 59 cm; however, within the latter group, specimens measuring more than 40 cm. are rarely met with during the January-July ,eason. Since growth in length ensures a greater swimming power and a capacity to handle a larger size-range and variety of prey, the maturing fish, by virtue of their greater mean size, have an obvious advantage over the immature stock, and their greater fatness should ·be attributed, at least partly, to their habit of consuming more teleosts than the latter-an instance parallel to what was found in the case of D. acuta and P. hoevenii (Sekharan 1949 and 1950). The possibility of fishes exercising selection is not discounted here, but when it occurs, especially in a carnivore like Trichiurus, it would undoubt-
. ,
f
320 THE MADRAS UNIVERSITY JOURNAL [Vol. XXV
at this time than they did during the preceding period, but still the fish become steadily leaner. This again seems to emphasise the importance of teleosts in the nutrition of the ribbon fish. It may be mentioned here that the observations made during this study on the feeding cycle of the fish find corroboration in their broad outlines, in the investigations reported on by Vijayaraghavan (1951) and Prabhu (1955). The former says that there is a defi
nite increase in the volume of the stomach contents from September to December, and in the data given by the latter the peak figure for the volume of stomach contents is noted against the month of December.
The relation between fatness and the quality and quantity of food has formed the subject of many other studies on fishes. (Channon and Saby 1932, Lovern and Wood 1937, Dixon 1937, Wilson 1939, Hickling 1947 etc.). A correlation between fat content of plankton and that of herring has been established by Wimpenny (1938). Dealing with the red mullet, Upeneus indicus Ramaswamy (1955) has also dwelt on the influence on the fat value of food on that of the fish. According to Chidambaram et al (1952) , there are two peaks of fat accumulation in an year for the Indian mackerel, and they attribute this to feeding activity. They have also shown that periodic variations occur in the size-composition of the commercial catches of mackerel. In Trichiurus changes in size affect the monthly fat values of the immature group, but are of little significance as far as the other group is concerned.
The evidence advanced for proving the influence of maturity on the fat content of the fish is of course rather indirect. The problem here is' complicated by the fact that the ripening of the gonads and the decline in fat value occur simultaneously with a fall in the quality and quantity of food. However, it is seen that the maturing groups experiences a greater loss of fat than the immature stock during the January-April period. They have much the same fat value in April, though, when in peak condition, they differ markedly. The greater extent of fat depletion suffered by the maturing stock could perhaps be ascribed to an increase in metabolic requirements occasioned by the rapid development of the gonads. Hickling (1947) also recognises the effect of the ripening of the testes and ovary on the fat content of the pilchard. Most other workers, however believe that there is little, if any, pre-spawning depletion, and that a rapid exhaustion of muscle fats occurs after spawning. With the available data, it is difficult to say whether spawning has any effect on the fat content of the ribbon fish. But it must be
•
I
1955] FAT CONTENT OF RIBBON FISH 321
emphasised here that most of the fishes where such a phenomenon has been demonstrated are known to abstain from food during the spawning period.
ACKNOWLEDGMENT
I am greatly indebted to Dr. C. P. Gnanamuthu, Director, University Zoology Laboratory, Madras, for suggesting the problem and for the guidance and encouragement given during the course of this investigation and to Dr. N. K. Panikkar, Chief Reserch Officer, Central Marine Fisheries Research Station, Mandapam Camp, for kindly going through the manuscript and making valuable suggestions and also for offering facilities at the Station for photographing Fig. 1. Thanks are due to the syndicate of the Madras University for the award of a studentship during the tenure of which this investigation was ~arried out. I also thank Shri K. G. Nambiar, artist-photographer, Central Marine Fisheries Research Station, Mandapam Camp, for his help in preparing Fig. 1 for publication.
Brocklesby, H. N.
Bruoe, J. R.
Bull, H. O.
Channon, H. J. & El Saby, M. K.
'Chari, S. T.
(1941) The chemistry and technology of marine animal oils with particular references to those of Canada. Bull. Fioh. R.... Bd. Canada. 59: (Ottawa). p. 442.
(19U) Changes in the chemical eomposition of the tissues of the herring in relation to age and maturity. Biochem. J., 18: 469-85.
(1928) The relationship between state of maturity and chemical composition of the whiting. J. MaT. hioZ. Assoc., 15: 207-218.
(1932) Fat metabolism of the herring. I. A preliminary survey. Biochem. J., 26: 2021-34.
(1948) Nutritive values of some of the West Coast fishes of the Madras Province. Indian J. med. Re3., 36: 253-59.
Chidambaram, K., (1952) Studies on mackerel: fat variations-and certain biological aspects. Proe. Indian Acad. Sci. B, 35: 43-68.
Krishnamurthy, C. G., Venkataraman, R. & Chari, S. T.
Dixon, B. (1937) The composition of the Polish sprat catches in the Bay of Danzig in the season 1934-35 and 1935-3~. Rapp. Proc. Verb. Reunion, 102; Appendix, 1-12.

322 THE MADRAS UNIVERSITY JOURNAL [Vol. XXV
Hickling, C. F.
Lovern, J. A.
Lovern, J. A. & Wood, H.
Mahadevan, S.
Milroy, T. H.
Prabhu, M. S.
Ramaswamy, T. S.
Sekharan, K. V.
. (1947) 'The season cycle in the Cornish pilchard, Sardina. pilchaTdus, Walbaum. J. MaT. _ bioI. Ass., U. K. 26: 115-138.
(1938) Fat metaboUsm in fishes. XliI. Factors influencing the composition of the depot fat of fishes. Bio<:hem. J.,32: 1214-24.
(1937) Variations in the chemical coml'osition of her- . \"ing. J. Mar. bioi. Ass., U. K. 22: 281-93.
(1950) 'The digestive system of Caran;r dieaaba (Forsk) and Trlchiurus haumela (Forsk.). J. Madras Unv., 20: 25-48-
(1898) 'The physical and chemical changes ta\ting place in the ova of certain marine teleosts during maturation. ts'ixteenth Ann. Rep. Filh. Bd. Scotland, Part m: 135-LS2.
(1955) Some aspects of the biology of the ribbon fish, Trichiurm haumela (Forskal). Indio .. J. Fioh.., 2: 132-63.
(1955) Fat contents of the Red Mullet, Upe ... us indicus (Shaw). J. Madras Un;v., B, 25: 115-22.
(1949) Feeding and maturity in relation to fats in the muscles of the rainbow sardine, DU3sumieTia. a.cv.ta (Cuv. & Val.). J . Madras Um"., B, 18: 38-48.
(1950) Variations in the fat content of the Indian herring, Pellona hoev ... ii (Bleeker). J. ·Madras Univ.,'. B, 20; 47-65.
Vijayaraghav3n, P. (1951) Food of the ribbon fishes of Madras. J. Mod,..s Univ . .1 B, 21: ·81-~.
Wilson,. D: P.
Wimpenny, R. S.
(1939) Seasonal variations in the fat content of flounder, PleqT01tectes fle8US' L. J. Mar. biol. Ass., U. K. 18: 361-79.
(1938) A routine method of estimation of fat in plankton and its application to he:rring tissues. J. duo
, ,
Cons., 13: 338-40. .
"
J


![Vol XXV], No.]](https://static.fdocuments.in/doc/165x107/625486dcdc949f59821fe028/vol-xxv-no.jpg)