
3012011
14
RETAIL RESEARCH Weekly Statistics Global Index 27-Mar 20-Mar Change (%) Sensex 27459 28261 -2.84 Nifty 8341 8571 -2.68 DJIA 17713 18128 -2.29 Nasdaq 4891 5026 -2.69 FTSE 6855 7023 -2.39 DAX 11868 12039 -1.42 Hang Seng 24486 24375 0.46 Nikkei 19286 19560 -1.40 Bovespa 50095 51967 -3.60 Indonesia Jakarta 5397 5443 -0.85 Singapore – Strait 3450 3412 1.11 MSCI Emerging Mkt 958 970 -1.24 Mutual Fund Categories watch Category Name 1 Week Absolute 1 Month Absolute 3 Month Absolute 6 Month Absolute 1 Year CAGR 3 Year CAGR Arbitrage Funds -0.08 0.18 2.22 4.07 8.33 8.87 Balanced - Debt -0.67 -0.76 2.52 5.91 20.05 13.55 Balanced - Equity -1.65 -2.46 3.29 9.18 36.66 19.99 Equity - Banking -3.02 -5.27 -1.99 15.42 44.55 21.06 Equity - Div Yield -2.15 -3.89 1.70 9.34 44.34 19.21 Equity - Infrastr -2.24 -3.76 3.32 11.23 51.84 16.63 Equity - Large Cap -2.31 -3.74 3.69 9.96 39.15 20.12 Equity - Mid Cap -2.30 -2.80 4.24 15.05 65.84 30.74 Equity - Multi CAP -2.20 -3.15 4.04 11.71 46.22 22.86 Equity - Small Cap -2.51 -3.37 4.87 19.15 90.68 33.09 Equity - FMCG -2.38 -8.64 0.02 6.54 23.49 22.20 Equity - Infotech -2.92 -4.89 5.54 7.38 32.88 23.95 Equity - Pharma -0.10 9.51 15.24 20.51 65.37 37.71 ELSS -2.36 -3.41 4.22 11.23 43.78 23.05 Gold ETFs 2.15 -0.02 -1.16 -1.54 -6.78 -3.74 Gilt Funds -0.15 -0.17 3.06 8.76 15.24 9.77 Income Funds 0.03 0.13 2.60 6.80 12.35 9.45 Liquid Funds 0.15 0.60 1.97 4.01 8.39 8.64 MIP -0.39 -0.39 2.67 6.81 16.44 10.75 Note: Trailing Returns up to 1 year are absolute and over 1 year are CAGR. NAV/index values are as on Mar 27, 2015. Equity Markets Extending losses for third straight week, the benchmark BSE Sensex plunged by 802 points to end at a ten-week low of 27,459 on across-the-board selling, prompted by geo-political worries, and expiry of derivatives contract on March 26. The NSE Nifty also tumbled by 230 points to end the week at ten-week low of 8,341. Outlook for the current weeks Trend in global markets, investment by foreign portfolio investors (FPIs), the movement of rupee against the dollar, and crude oil price movement will dictate trend on the bourses in the absence of any major domestic macro-economic data. Next week is a truncated trading week. The stock market will remain shut on Thursday, 2 April 2015, on account of Mahavir Jayanti and again on Friday, 3 April 2015, on account of Good Friday. On the economic front, HSBC India Manufacturing Purchasing Managers' Index (PMI) for March 2015 is due on Thursday, 2 April 2015. The headline HSBC India Purchasing Managers' Index (PMI) fell from 52.9 in the previous month to 51.2 in February, reaching a five-month low. The government will unveil Eight Core Infrastructure Industries data for February 2015 on Tuesday, 31 March 2015. The government will also unveil fiscal deficit data for February 2015 on Tuesday, 31 March 2015. The next major trigger for the Indian markets is Q4 results of India Inc. The Q4 results season starts during second week of April 2015. If in coming sessions Nifty sustains above 8325 level then traders may see a temporary reversal in the trend, which could lead Nifty to 8420 followed by 8540 level. If Nifty trades below 8325 level then traders may see correction in Nifty to continue up to 8263 level followed by 8175 level. Global Markets Major indexes notched modest gains, not nearly enough to make up for the four previous days of losses. It wound up being the second-worst week for the market so far this year. The Dow Jones fell 415 points, or 2.3%, to 17,713 and the Nasdaq composite fell 135 points, or 2.7%, to 4,891. Stocks fell most of the week due to a combination of weaker-than-expected economic data and concerns that the rapid rise of the dollar may crimp US corporate earnings. G sec Markets Indian bond yields ended up during the week ended March 27, 2015. The G sec market opened the week on Monday on a cautious note ahead of the announcement of borrowing figures for H1FY16 that were announced post market hours. The government announced that it will borrow Rs 3.60 lakh crore in the RETAIL RESEARCH Mar 30, 2015 Weekly Mutual Fund and Debt Report
description
pdf
Transcript of 3012011

RETAIL RESEARCH
Weekly Statistics Global Index 27-Mar 20-Mar Change (%)
Sensex 27459 28261 -2.84
Nifty 8341 8571 -2.68
DJIA 17713 18128 -2.29
Nasdaq 4891 5026 -2.69
FTSE 6855 7023 -2.39
DAX 11868 12039 -1.42
Hang Seng 24486 24375 0.46
Nikkei 19286 19560 -1.40
Bovespa 50095 51967 -3.60
Indonesia Jakarta 5397 5443 -0.85
Singapore – Strait 3450 3412 1.11
MSCI Emerging Mkt 958 970 -1.24
Mutual Fund Categories watch
Category Name 1 Week
Absolute 1 Month Absolute
3 Month Absolute
6 Month Absolute
1 Year CAGR
3 Year CAGR
Arbitrage Funds -0.08 0.18 2.22 4.07 8.33 8.87 Balanced - Debt -0.67 -0.76 2.52 5.91 20.05 13.55 Balanced - Equity -1.65 -2.46 3.29 9.18 36.66 19.99 Equity - Banking -3.02 -5.27 -1.99 15.42 44.55 21.06 Equity - Div Yield -2.15 -3.89 1.70 9.34 44.34 19.21 Equity - Infrastr -2.24 -3.76 3.32 11.23 51.84 16.63 Equity - Large Cap -2.31 -3.74 3.69 9.96 39.15 20.12 Equity - Mid Cap -2.30 -2.80 4.24 15.05 65.84 30.74 Equity - Multi CAP -2.20 -3.15 4.04 11.71 46.22 22.86 Equity - Small Cap -2.51 -3.37 4.87 19.15 90.68 33.09 Equity - FMCG -2.38 -8.64 0.02 6.54 23.49 22.20 Equity - Infotech -2.92 -4.89 5.54 7.38 32.88 23.95 Equity - Pharma -0.10 9.51 15.24 20.51 65.37 37.71 ELSS -2.36 -3.41 4.22 11.23 43.78 23.05 Gold ETFs 2.15 -0.02 -1.16 -1.54 -6.78 -3.74 Gilt Funds -0.15 -0.17 3.06 8.76 15.24 9.77 Income Funds 0.03 0.13 2.60 6.80 12.35 9.45 Liquid Funds 0.15 0.60 1.97 4.01 8.39 8.64 MIP -0.39 -0.39 2.67 6.81 16.44 10.75 Note: Trailing Returns up to 1 year are absolute and over 1 year are CAGR. NAV/index values are as on Mar 27, 2015.
Equity Markets
Extending losses for third straight week, the benchmark BSE Sensex plunged by 802 points to end at a ten-week low of 27,459 on across-the-board selling, prompted by geo-political worries, and expiry of derivatives contract on March 26. The NSE Nifty also tumbled by 230 points to end the week at ten-week low of 8,341.
Outlook for the current weeks Trend in global markets, investment by foreign portfolio investors (FPIs), the movement of rupee against the dollar, and crude oil price movement will dictate trend on the bourses in the absence of any major domestic macro-economic data. Next week is a truncated trading week. The stock market will remain shut on Thursday, 2 April 2015, on account of Mahavir Jayanti and again on Friday, 3 April 2015, on account of Good Friday. On the economic front, HSBC India Manufacturing Purchasing Managers' Index (PMI) for March 2015 is due on Thursday, 2 April 2015. The headline HSBC India Purchasing Managers' Index (PMI) fell from 52.9 in the previous month to 51.2 in February, reaching a five-month low. The government will unveil Eight Core Infrastructure Industries data for February 2015 on Tuesday, 31 March 2015. The government will also unveil fiscal deficit data for February 2015 on Tuesday, 31 March 2015. The next major trigger for the Indian markets is Q4 results of India Inc. The Q4 results season starts during second week of April 2015. If in coming sessions Nifty sustains above 8325 level then traders may see a temporary reversal in the trend, which could lead Nifty to 8420 followed by 8540 level. If Nifty trades below 8325 level then traders may see correction in Nifty to continue up to 8263 level followed by 8175 level.
Global Markets Major indexes notched modest gains, not nearly enough to make up for the four previous days of losses. It wound up being the second-worst week for the market so far this year. The Dow Jones fell 415 points, or 2.3%, to 17,713 and the Nasdaq composite fell 135 points, or 2.7%, to 4,891. Stocks fell most of the week due to a combination of weaker-than-expected economic data and concerns that the rapid rise of the dollar may crimp US corporate earnings.
G sec Markets Indian bond yields ended up during the week ended March 27, 2015. The G sec market opened the week on Monday on a cautious note ahead of the announcement of borrowing figures for H1FY16 that were announced post market hours. The government announced that it will borrow Rs 3.60 lakh crore in the
RETAIL RESEARCH
Mar 30, 2015
Weekly Mutual Fund and Debt Report

RETAIL RESEARCH
10 Year G sec Benchmark move:
Liquidity:
Debt Securities Benchmarks watch
Debt (%) 20-Mar 13-Mar Change (bps)
Call Rate 7.5 7.7 -20 CBLO 7.59 7.36 23
Repo 7.5 7.5 0
Reverse Repo 6.5 6.5 0
10 Year G sec 7.78 7.75 3
LIBOR – UK 0.56 0.56 0
LIBOR – USA 0.27 0.27 0
LIBOR – Europe 0.27 0.27 0
first-half of the next fiscal year, which would be 66.7% of the full year target announced in the annual budget last month. G sec prices ended higher on Tuesday tracking the issuance calendar for H1 2015-16, which came largely in line with expectations. Strengthening of domestic currency against the dollar also supported the prices. A fall in US benchmark treasury yields also supported gilt prices. The prices of the government securities ended lower on Wednesday tracking weakness in the domestic currency. However, a decline in US Treasury yields supported the market. G sec bonds prices ended down on Thursday tracking a rise in the global crude oil prices. Weakness in the domestic currency also weighed the market prices. G sec prices ended up on Friday tracking improvement seen in the domestic currency. Hence, the yields of the 10-year benchmark 8.40% 2024 bond ended up by 3bps at 7.78% (Rs 104.07) on Friday against the last week close of 7.75%.
Outlook for the week We feel that the new 10-year G Sec yields could trade in the 7.65% - 7.90% band for the week.
T Bill Auctions The T-Bill auctions held last week were fully subscribed in the 91 days T-Bill. The cut-off for 91-Days T-Bill was set at Rs 97.98, implying a yield of 8.27% (previous week yield 8.31%). The 182-Days T-Bill auctions were fully subscribed. The cut-off for 364-Days T-Bill was set at Rs 96.10 implying a yield of 8.14%.
Liquidity, Call & CBLO The liquidity in the banking system improved during last week compared to the previous week. The net infusion from the LAF window was a daily average of Rs. 6,582 crore for last week (Rs. 14,534 crore in previous week). The inter-bank call rates traded around 7.50% levels on Friday. The CBLO rates were positioned at 7.59% level.

RETAIL RESEARCH
AAA Corporate Bond Spread over Gsec:
AAA Corporate Bond Spread over Gsec Security 27-Mar 20-Mar 1 Year 59 62 3 Year 62 65 5 Year 49 53 10 Year 42 40 Forthcoming Auctions; Security Date of Auction Value (Rs. Crs) 91 Day T-Bill 01-Apr-15 8,000 364 Day T-Bill 01-Apr-15 6,000 Certificates of Deposits: Maturity 27-Mar 20-Mar
3 Months 8.7 8.65 6 Months 8.57 8.55 1 Year 8.47 8.45 Commercial Papers: Maturity 27-Mar 20-Mar
3 Months 9.05 8.9 6 Months 9.1 9.2 1 Year 8.95 9.05 Commodity Update: Commodity 27-Mar 20-Mar Change (%)
NYMEX Crude Oil ($/bbl) 48.87 46.57 +4.94% Gold (oz/$) 1,199.8 1,184.64 +1.28%
Corporate Debts The 1 year bond ended at 8.75% compared to the previous week close of 8.75%. The 10-year AAA bond traded at 8.33% compared to the previous week close 8.30%.
Currency The USD depreciated against the Euro by 1.27 % for week ended 27th March 2015. The dollar depreciated against the yen by 0.66% for the week. The USD appreciated against the pound by 0.64%.
Gold & Crude oil International crude oil prices (WTI) gained by 4.94% for the week ended 27th March, 2015 to close at USD 48.87 per barrel. International gold prices gained 1.28% for the week ended 27th March, 2015 to close at USD 1199.8 per troy ounce.
10 Yr G sec Benchmark Yields Movements in last one month.

RETAIL RESEARCH
Scheme Analysis IDFC Premier Equity Fund - G
RETAIL RESEARCH
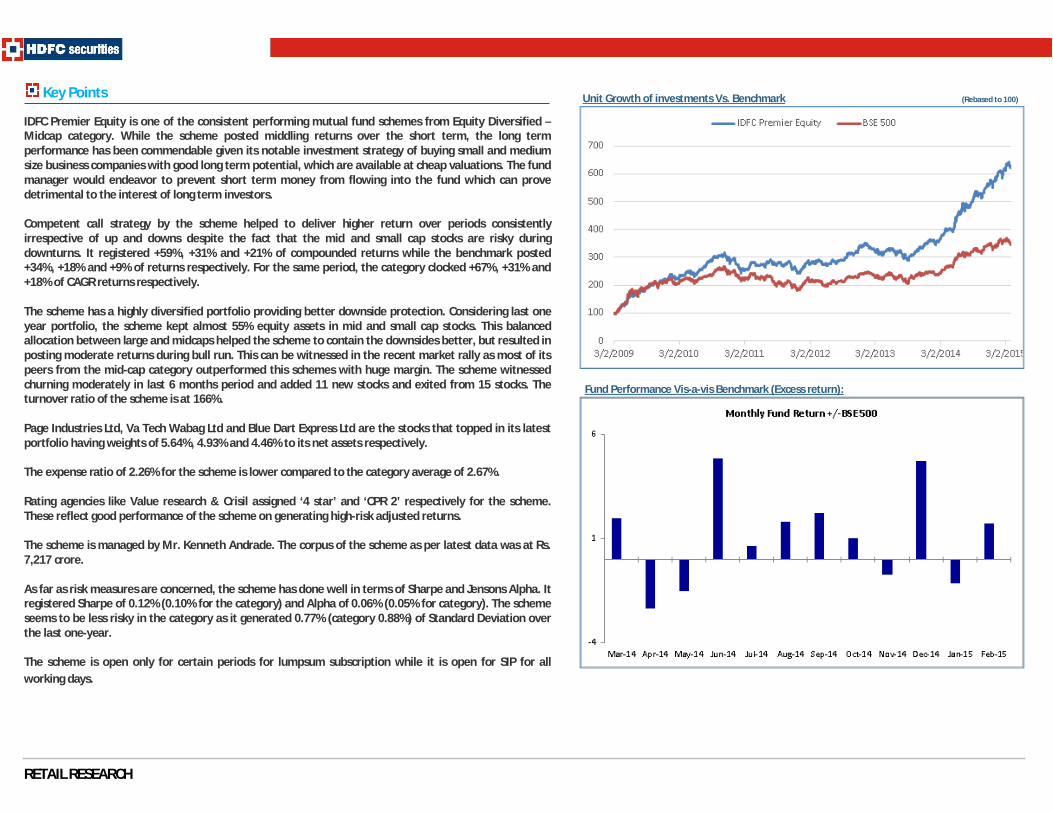
Unit Growth of investments Vs. Benchmark (Rebased to 100)
Fund Performance Vis-a-vis Benchmark (Excess return):
Key Points IDFC Premier Equity is one of the consistent performing mutual fund schemes from Equity Diversified – Midcap category. While the scheme posted middling returns over the short term, the long term performance has been commendable given its notable investment strategy of buying small and medium size business companies with good long term potential, which are available at cheap valuations. The fund manager would endeavor to prevent short term money from flowing into the fund which can prove detrimental to the interest of long term investors. Competent call strategy by the scheme helped to deliver higher return over periods consistently irrespective of up and downs despite the fact that the mid and small cap stocks are risky during downturns. It registered +59%, +31% and +21% of compounded returns while the benchmark posted +34%, +18% and +9% of returns respectively. For the same period, the category clocked +67%, +31% and +18% of CAGR returns respectively. The scheme has a highly diversified portfolio providing better downside protection. Considering last one year portfolio, the scheme kept almost 55% equity assets in mid and small cap stocks. This balanced allocation between large and midcaps helped the scheme to contain the downsides better, but resulted in posting moderate returns during bull run. This can be witnessed in the recent market rally as most of its peers from the mid-cap category outperformed this schemes with huge margin. The scheme witnessed churning moderately in last 6 months period and added 11 new stocks and exited from 15 stocks. The turnover ratio of the scheme is at 166%. Page Industries Ltd, Va Tech Wabag Ltd and Blue Dart Express Ltd are the stocks that topped in its latest portfolio having weights of 5.64%, 4.93% and 4.46% to its net assets respectively. The expense ratio of 2.26% for the scheme is lower compared to the category average of 2.67%. Rating agencies like Value research & Crisil assigned ‘4 star’ and ‘CPR 2’ respectively for the scheme. These reflect good performance of the scheme on generating high-risk adjusted returns. The scheme is managed by Mr. Kenneth Andrade. The corpus of the scheme as per latest data was at Rs. 7,217 crore. As far as risk measures are concerned, the scheme has done well in terms of Sharpe and Jensons Alpha. It registered Sharpe of 0.12% (0.10% for the category) and Alpha of 0.06% (0.05% for category). The scheme seems to be less risky in the category as it generated 0.77% (category 0.88%) of Standard Deviation over the last one-year. The scheme is open only for certain periods for lumpsum subscription while it is open for SIP for all working days.
RETAIL RESEARCH
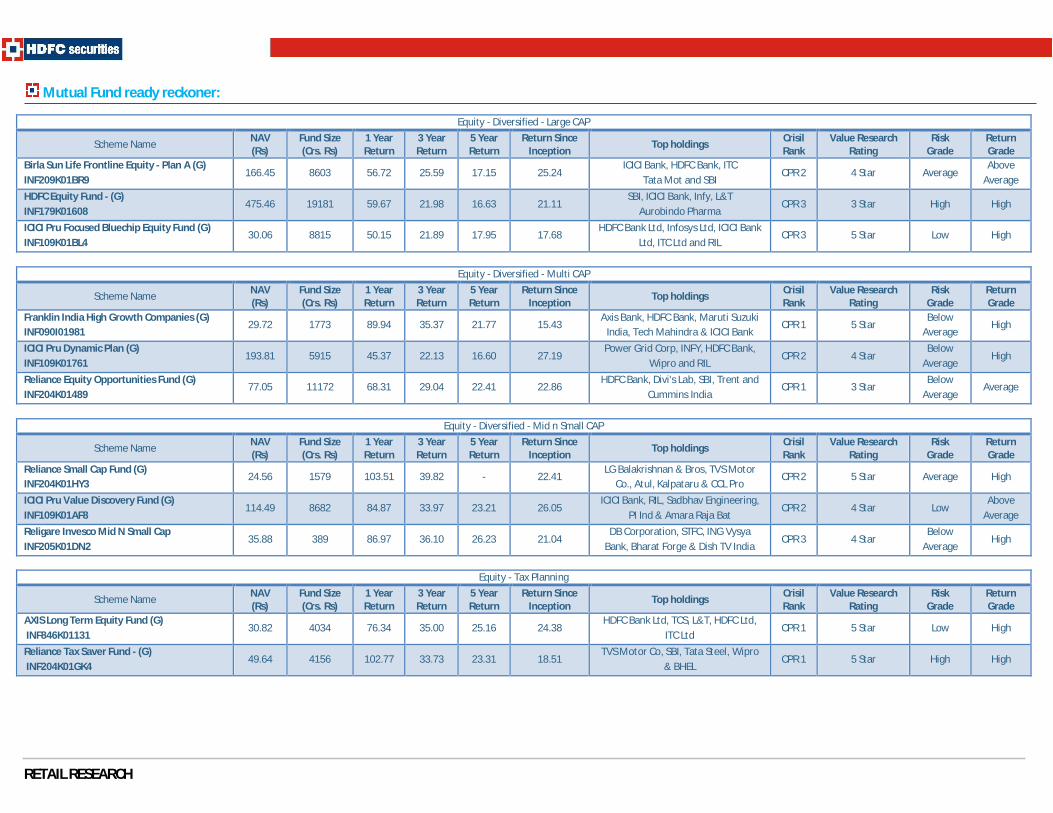
Mutual Fund ready reckoner:
Equity - Diversified - Large CAP
Scheme Name NAV (Rs)
Fund Size (Crs. Rs)
1 Year Return
3 Year Return
5 Year Return
Return Since Inception
Top holdings Crisil Rank
Value Research Rating
Risk Grade
Return Grade
Birla Sun Life Frontline Equity - Plan A (G) INF209K01BR9
166.45 8603 56.72 25.59 17.15 25.24 ICICI Bank, HDFC Bank, ITC
Tata Mot and SBI CPR 2 4 Star Average
Above Average
HDFC Equity Fund - (G) INF179K01608
475.46 19181 59.67 21.98 16.63 21.11 SBI, ICICI Bank, Infy, L&T
Aurobindo Pharma CPR 3 3 Star High High
ICICI Pru Focused Bluechip Equity Fund (G) INF109K01BL4
30.06 8815 50.15 21.89 17.95 17.68 HDFC Bank Ltd, Infosys Ltd, ICICI Bank
Ltd, ITC Ltd and RIL CPR 3 5 Star Low High
Equity - Diversified - Multi CAP
Scheme Name NAV (Rs)
Fund Size (Crs. Rs)
1 Year Return
3 Year Return
5 Year Return
Return Since Inception
Top holdings Crisil Rank
Value Research Rating
Risk Grade
Return Grade
Franklin India High Growth Companies (G) INF090I01981
29.72 1773 89.94 35.37 21.77 15.43 Axis Bank, HDFC Bank, Maruti Suzuki
India, Tech Mahindra & ICICI Bank CPR 1 5 Star
Below Average
High
ICICI Pru Dynamic Plan (G) INF109K01761
193.81 5915 45.37 22.13 16.60 27.19 Power Grid Corp, INFY, HDFC Bank,
Wipro and RIL CPR 2 4 Star
Below Average
High
Reliance Equity Opportunities Fund (G) INF204K01489
77.05 11172 68.31 29.04 22.41 22.86 HDFC Bank, Divi's Lab, SBI, Trent and
Cummins India CPR 1 3 Star
Below Average
Average
Equity - Diversified - Mid n Small CAP
Scheme Name NAV (Rs)
Fund Size (Crs. Rs)
1 Year Return
3 Year Return
5 Year Return
Return Since Inception
Top holdings Crisil Rank
Value Research Rating
Risk Grade
Return Grade
Reliance Small Cap Fund (G) INF204K01HY3
24.56 1579 103.51 39.82 - 22.41 LG Balakrishnan & Bros, TVS Motor
Co., Atul, Kalpataru & CCL Pro CPR 2 5 Star Average High
ICICI Pru Value Discovery Fund (G) INF109K01AF8
114.49 8682 84.87 33.97 23.21 26.05 ICICI Bank, RIL, Sadbhav Engineering,
PI Ind & Amara Raja Bat CPR 2 4 Star Low
Above Average
Religare Invesco Mid N Small Cap INF205K01DN2
35.88 389 86.97 36.10 26.23 21.04 DB Corporation, STFC, ING Vysya
Bank, Bharat Forge & Dish TV India CPR 3 4 Star
Below Average
High
Equity - Tax Planning
Scheme Name NAV (Rs)
Fund Size (Crs. Rs)
1 Year Return
3 Year Return
5 Year Return
Return Since Inception
Top holdings Crisil Rank
Value Research Rating
Risk Grade
Return Grade
AXIS Long Term Equity Fund (G) INF846K01131
30.82 4034 76.34 35.00 25.16 24.38 HDFC Bank Ltd, TCS, L&T, HDFC Ltd,
ITC Ltd CPR 1 5 Star Low High
Reliance Tax Saver Fund - (G) INF204K01GK4
49.64 4156 102.77 33.73 23.31 18.51 TVS Motor Co, SBI, Tata Steel, Wipro
& BHEL CPR 1 5 Star High High

RETAIL RESEARCH
Hybrid - Equity Oriented (Atleast 60% in equity)
Scheme Name NAV (Rs)
Fund Size (Crs. Rs)
1 Year Return
3 Year Return
5 Year Return
Return Since Inception Top holdings
Crisil Rank
Value Research Rating
Risk Grade
Return Grade
HDFC Balanced Fund (G) INF179K01392
107.50 3284 51.84 22.77 19.03 17.85 SBI, ICICI Bank, Axis Bank, Aurobindo
Pharma & L&T CPR 1 4 Star
Below Average
High
ICICI Pru Balanced Fund - (G) INF109K01480
93.20 1633 50.32 24.29 18.94 15.68 HDFC Bank, Motherson Sumi, City
Union Bank, Maruti Suzuki Ind & ICICI CPR 1 5 Star
Below Average
Above Average
Hybrid - Monthly Income Plan - Long Term (About 15% to 20% in equity)
Scheme Name NAV (Rs)
Fund Size (Crs. Rs)
1 Year Return
3 Year Return
5 Year Return
Return Since Inception Top holdings
Crisil Rank
Value Research Rating
Risk Grade
Return Grade
Reliance Monthly Income Plan (G) INF204K01FD1
33.37 2521 26.84 13.12 10.97 11.40 Eq: Sundaram-Clayton, Federal Mogul
Goetze, HDFC Bank. CP: PFC CPR 2 4 Star
Above Average
Above Average
HDFC Monthly Income Plan - LTP (G) INF179K01AE4
34.66 3818 27.25 12.90 10.95 11.77 Eq: SBI, Infy, ICICI Bank, L&T. Debt:
TATA Power, Hindalco Inds CPR 2 3 Star Average Average
Liquid Funds
Scheme Name NAV (Rs) Fund Size (Crs. Rs)
1 Year Return
2 Year Return
3 Year Return
Return Since Inception Top Holdings Crisil
Rank Value Research
Rating Risk
Grade Return Grade
HDFC Liquid Fund (G) INF179K01KG8
27.35 14666 9.05 9.20 9.24 7.25 CP: National Bank Agr. Rur. Devp, CD: National Bank Agr. Rur, Union Bank.
CPR 3 3 Star Below
Average Above
Average SBI Magnum InstaCash - Cash Plan INF200K01LJ4
3064.08 1134 8.96 9.20 9.19 7.34 CP: M&M Financial Services, Kotak
Mahindra Prime, PFC, CD: SIDBI 2014 CPR 3 4 Star
Below Average
Above Average
Ultra Short Term Funds
Scheme Name NAV (Rs)
Fund Size (Crs. Rs)
1 Year Return
2 Year Return
3 Year Return
Return Since Inception Top Holdings
Crisil Rank
Value Research Rating
Risk Grade
Return Grade
ICICI Pru Flexible Income Plan - Regular (G) INF109K01746
260.58 11913 9.50 9.55 9.52 7.49 CD: NABARD, Canara Bk, T Bill, CP:
HDFC, Debt: TCFSL CPR 1 4 Star
Below Average
Above Average
SBI Mag Income FRP - Savings Plus Bond (G) INF200K01636
21.50 842 8.90 9.03 9.26 7.47 CD: HDFC, ICICI, IDBI. Debt: LIC Hou,
HDFC. CP: Sesa ste CPR 3 3 Star Low Average
Short Term Income Funds
Scheme Name NAV (Rs)
Fund Size (Crs. Rs)
1 Year Return
2 Year Return
3 Year Return
Return Since Inception Top Holdings
Crisil Rank
Value Research Rating
Risk Grade
Return Grade
Sundaram Select Debt - STAP (G) INF903J01FG3
24.00 985 10.83 9.95 10.28 7.27 FD: J&K Bank, D: 11.6% DHFL. 2015,
CD: Central Bank of India 2013, CPR 3 3 Star Average
Above Average
Franklin India Short Term Income (G) INF090I01304
2847.73 10332 12.25 10.57 10.36 8.33 PTC: 11.85% Adani Enterprises. Debt:
Dewan Housing Fin CPR 1 4 Star Average
Above Average
RETAIL RESEARCH
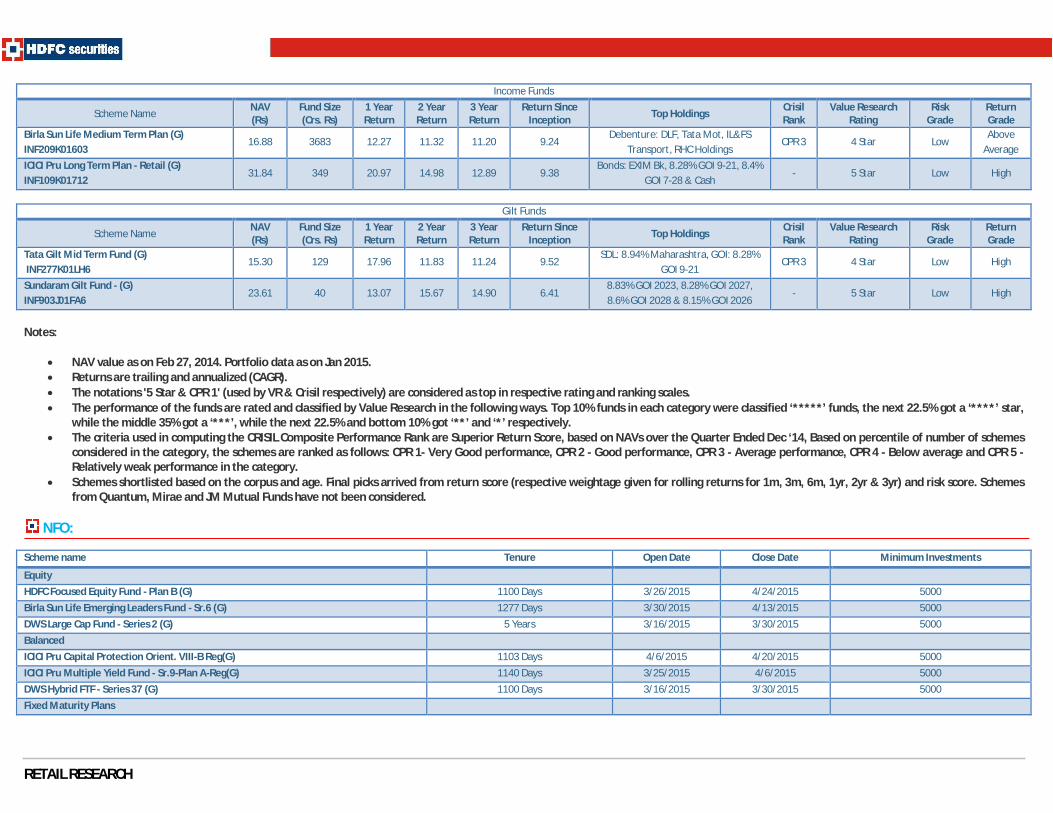
Income Funds
Scheme Name NAV (Rs)
Fund Size (Crs. Rs)
1 Year Return
2 Year Return
3 Year Return
Return Since Inception Top Holdings
Crisil Rank
Value Research Rating
Risk Grade
Return Grade
Birla Sun Life Medium Term Plan (G) INF209K01603
16.88 3683 12.27 11.32 11.20 9.24 Debenture: DLF, Tata Mot, IL&FS
Transport, RHC Holdings CPR 3 4 Star Low
Above Average
ICICI Pru Long Term Plan - Retail (G) INF109K01712
31.84 349 20.97 14.98 12.89 9.38 Bonds: EXIM Bk, 8.28% GOI 9-21, 8.4%
GOI 7-28 & Cash - 5 Star Low High
Gilt Funds
Scheme Name NAV (Rs)
Fund Size (Crs. Rs)
1 Year Return
2 Year Return
3 Year Return
Return Since Inception Top Holdings
Crisil Rank
Value Research Rating
Risk Grade
Return Grade
Tata Gilt Mid Term Fund (G) INF277K01LH6
15.30 129 17.96 11.83 11.24 9.52 SDL: 8.94% Maharashtra, GOI: 8.28%
GOI 9-21 CPR 3 4 Star Low High
Sundaram Gilt Fund - (G) INF903J01FA6
23.61 40 13.07 15.67 14.90 6.41 8.83% GOI 2023, 8.28% GOI 2027, 8.6% GOI 2028 & 8.15% GOI 2026
- 5 Star Low High
Notes:
NAV value as on Feb 27, 2014. Portfolio data as on Jan 2015. Returns are trailing and annualized (CAGR). The notations '5 Star & CPR 1' (used by VR & Crisil respectively) are considered as top in respective rating and ranking scales. The performance of the funds are rated and classified by Value Research in the following ways. Top 10% funds in each category were classified ‘*****’ funds, the next 22.5% got a ‘****’ star,
while the middle 35% got a ‘***’, while the next 22.5% and bottom 10% got ‘**’ and ‘*’ respectively. The criteria used in computing the CRISIL Composite Performance Rank are Superior Return Score, based on NAVs over the Quarter Ended Dec ‘14, Based on percentile of number of schemes
considered in the category, the schemes are ranked as follows: CPR 1- Very Good performance, CPR 2 - Good performance, CPR 3 - Average performance, CPR 4 - Below average and CPR 5 - Relatively weak performance in the category.
Schemes shortlisted based on the corpus and age. Final picks arrived from return score (respective weightage given for rolling returns for 1m, 3m, 6m, 1yr, 2yr & 3yr) and risk score. Schemes from Quantum, Mirae and JM Mutual Funds have not been considered.
NFO:
Scheme name Tenure Open Date Close Date Minimum Investments
Equity HDFC Focused Equity Fund - Plan B (G) 1100 Days 3/26/2015 4/24/2015 5000 Birla Sun Life Emerging Leaders Fund - Sr.6 (G) 1277 Days 3/30/2015 4/13/2015 5000 DWS Large Cap Fund - Series 2 (G) 5 Years 3/16/2015 3/30/2015 5000 Balanced ICICI Pru Capital Protection Orient. VIII-B Reg(G) 1103 Days 4/6/2015 4/20/2015 5000 ICICI Pru Multiple Yield Fund - Sr.9-Plan A-Reg(G) 1140 Days 3/25/2015 4/6/2015 5000 DWS Hybrid FTF - Series 37 (G) 1100 Days 3/16/2015 3/30/2015 5000 Fixed Maturity Plans

RETAIL RESEARCH
Dividend Scheme Name Record Date Gross (%) Date
SBI Magnum Tax Gain Scheme (D) 3/27/2015 55.00 3/30/2015 BNP Paribas Dividend Yield Fund (D) 3/27/2015 1.00 3/30/2015 DSP BR Small And Mid Cap Fund (D) 3/27/2015 23.00 3/30/2015 DWS Alpha Equity Fund (D) 3/27/2015 10.00 3/30/2015 DWS Alpha Equity Fund - Wealth Plan (D) 3/27/2015 10.00 3/30/2015 Franklin India Flexi Cap Fund (D) 3/27/2015 17.50 3/30/2015 UTI-Top 100 Fund (D) 3/26/2015 30.00 3/27/2015 Edelweiss ELSS Fund (D) 3/26/2015 5.00 3/27/2015 Religare Invesco Growth Fund (D) 3/26/2015 85.00 3/27/2015 Sahara Tax Gain Fund (D) 3/31/2015 25.00 4/1/2015
DSP BR Dual Advantage Fund - Sr.37 - 36Mth (G) 36 Months 4/6/2015 4/20/2015 5000 Reliance Fixed Horizon - XXVIII - Sr.16 (G) 1151 Days 4/9/2015 4/15/2015 5000 UTI-FTI - Series XXI - XV(1103Days)-Reg (G) 1103 Days 3/27/2015 4/9/2015 5000 ICICI Pru FMP - Series 76 - 1134Days Plan X-Reg(G) 1134 Days 4/6/2015 4/9/2015 5000 DWS FMP - Series 90 - 1100Days (G) 1100 Days 3/24/2015 4/7/2015 5000 Reliance Fixed Horizon - XXVIII - Sr.15 (G) 1159 Days 4/1/2015 4/7/2015 5000 DWS FMP - Series 89 - 1101Days (G) 1101 Days 3/24/2015 4/6/2015 5000 ICICI Pru FMP - Series 76 - 1127Days Plan W-Reg(G) 1127 Days 3/30/2015 4/6/2015 5000 SBI Debt Fund Series B - 9 (G) 1105 Days 3/21/2015 3/30/2015 5000 SBI Dual Advantage Fund - Series VIII (G) 1111 Days 3/16/2015 3/30/2015 5000 Reliance Fixed Horizon - XXVIII - Sr.13 (G) 1121 Days 3/27/2015 3/30/2015 5000 Income Funds Birla Sun Life Corporate Bond Fund (G) 3/30/2015 4/13/2015 5000 Liquid Funds Sundaram Select Small Cap - Series IV (G) 5 Years 3/27/2015 4/10/2015 5000 Short Term Income Funds HDFC FMP - 1115Days-Mar 2015(1)(XXXIII) (G) 1115 Days 3/30/2015 4/7/2015 5000 UTI-Medium Term Fund (G) 3/25/2015 3/30/2015 5000
Mutual Fund NEWS:
Change in load structure in HDFC Banking and PSU Debt Fund: HDFC Mutual Fund has removed the exit load of HDFC Banking and PSU Debt Fund. The existing exit load is 0.25 per cent if redeemed within 1 month. The effective date is March 26, 2015. Change in load structure in L&T Cash Fund removes exit load: L&T Mutual Fund has removed the exit load of L&T Cash Fund. The existing exit load is 0.50 per cent if redeemed within 20 days. The effective date is March 27, 2015.

RETAIL RESEARCH
Global Updates: (Source: AMC Newsletters) India:
• India’s foreign exchange reserves hit an all-time high of $340 bn for the week ending March 20. • Government lowers the price of domestically produced natural gas by over 10% (based on net calorific value) to $5.02 per mmBtu from $5.6 per unit, the first ever reduction in the rates of the
fuel. • Central Board of Direct Taxes issues circular clarifying that dividends declared or paid by a foreign company outside India in respect of shares that derived their value substantially fromassets
situated in India will not be "deemed" as income taxable in India. • Supreme Court allows the government to finalise the spectrum auction bids and collect the initial payment amounting to Rs 28000 cr out of Rs 1.09 lakh cr from the successful telecom
companies before March 31. • Prime Minister Narendra Modi to launch MUDRA (Micro Units Development and Refinance Agency) Bank on April 8. • Asian Development Bank (ADB) projects India's economy to grow by 7.8% in2015-16 compared with 8.1-8.5% pegged by the Economic Survey for 2014-15. • According to SEBI data, mutual fund investments in banking stocks stood at Rs. 77,805 cr as of February 2015, accounting for 21.32% of their total equity assets under management (AUM) of
Rs. 3.65 lakh cr. • RBI Deputy Governor R Gandhi says the development of India’s corporate bond market has "not been too satisfactory", adding that the huge supply of government bonds has been one of the
impediments. • SEBI relaxes norms for domestic funds managing offshore money by dropping the 20-25 rule which required a minimum of 20 investors and a cap of 25% on investment by an individual, for
funds from low-risk foreign investors. Asia:
• China’s industrial profits fell 4.2% in January-February period from a year earlier to 745.2 bn yuan, compared with an 8% decline in December. • Japan’s consumer price index rose 2% in February from the year-ago period, compared with 2.2% in January. • Japan’s retail sales fell 1.8% in February, compared with a 2% drop in January.
US:
• The US economy expanded at a 2.2% annual rate in the fourth quarter of 2014 following growth of 5% in the third quarter. • University of Michigan's consumer sentiment index rose to 93 in March, compared with 95.4 reading in February. • US initial claims for state unemployment benefits dropped 9,000 to a seasonally adjusted 282,000 for the week ended March 21. • US Markit Services PMI rose to 58.6 in March from 57.1 in February; composite PMI increased to 58.5 in March, up from 57.2 in February. • US durable goods orders dropped 1.4% in February following a 2% increase in January.
UK:
• UK Markit PMI for the service sector decreased to 56.7 in February from 57.2 in January; the composite PMI inched up to 57.0, a three-month high, from 56.9 in January. • UK visible trade deficit narrowed to 8.4 bn pounds in January from 9.9 bn pounds in December.
Euro Zone:
• Euro zone manufacturing PMI rose to a seasonally adjusted 51.9 in March, up from a final reading of 51.0 in February. • Euro zone services PMI improved to a 46-month high of 54.3 in March from 53.7 in February

RETAIL RESEARCH
Economic Calendar:
Date Country Event Period Frequency Unit Previous
30-03-2015 UK M4 Money Supply (Y//Y) Feb, 2015 Monthly Percent -2.2 31-03-2015 India CPI-Industrial Workers Feb Monthly pct 7.17 31-03-2015 India IIP Core (YoY Chg) Feb Monthly pct 1.8 31-03-2015 India Government finances -fiscal deficit (pct of Budget Estimate) Apr-Feb Monthly pct 107 31-03-2015 US S&P Case-Shiller HPI (20-city, SA - M/M) Jan, 2015 Monthly Percent 0.9 31-03-2015 US Chicago PMI (Business Barometer Index - Level) Mar, 2015 Monthly 45.8 31-03-2015 US Consumer Confidence (Consumer Confidence - Level) Mar, 2015 Monthly 96.4 31-03-2015 US State Street Investor Confidence Index Mar, 2015 Monthly 105.2 1/4/2015 Japan Tankan (Large Mfrs) Q1, 2015 Quarterly 12 1/4/2015 India 91 day T- Bills auction of Rs 80 bln (cut-off yld) Weekly pct 8.27 1/4/2015 India Reserve Money (change on year) Wk to Mar 27 Weekly pct 12.6 1/4/2015 India M3 (YoY Chg) Wk to Mar 20 Fortnightly pct 11.34 1/4/2015 India 364 day T- Bills auction of Rs 60 bln (cut-off yld) Fortnightly pct 7.98 1/4/2015 US Motor Vehicle Sales (Domestic Vehicle Sales) Mar, 2015 Monthly Million 13.1 1/4/2015 European Monetary Union PMI Manufacturing Index (Level) Mar, 2015 Monthly 51 1/4/2015 UK CIPS/PMI Manufacturing Index (Level) Mar, 2015 Monthly 54.1 1/4/2015 US MBA Mortgage Applications (Composite Index - W/W Change) wk3/27, 2015 Weekly Percent 9.5 1/4/2015 US ISM Mfg Index (ISM Mfg Index - Level) Mar, 2015 Monthly 52.9 1/4/2015 US EIA Petroleum Status Report wk3/27, 2015 Weekly 2/4/2015 India Power generation Mar Monthly bln kwh 80.68 2/4/2015 India HSBC India manufacturing PMI Feb Monthly 51.2 2/4/2015 US Jobless Claims wk3/28, 2015 Weekly 2/4/2015 US Bloomberg Consumer Comfort Index wk3/29, 2015 Weekly 3/4/2015 US Fed Balance Sheet wk4/1, 2015 Weekly 3/4/2015 India WMA (ways and means advance) - to central govt Wk to Mar 27 Weekly Rs bln 3/4/2015 India FX reserve (change on wk) Wk to Mar 27 Weekly $ mln 4261.7 3/4/2015 India Bank Deposit (YoY Chg) Wk to Mar 20 Fortnightly pct 11.6 3/4/2015 India Bank Credit (YoY Chg) Wk to Mar 20 Fortnightly pct 10.2 3/4/2015 India Bank Investment (YoY Chg) Wk to Mar 20 Fortnightly pct 15.3 3/4/2015 India Bank Cash Deposit Ratio Wk to Mar 20 Fortnightly 4.87 3/4/2015 India Bank Investment Deposit Ratio Wk to Mar 20 Fortnightly 30.06 3/4/2015 India Bank Credit Deposit Ratio Wk to Mar 20 Fortnightly 76.27 6/4/2015 India HSBC India Services PMI Mar Monthly 53.9 6/4/2015 India HSBC India composite PMI Mar Monthly 53.5 6/4/2015 US ISM Non-Mfg Index (Composite Index - Level) Mar, 2015 Monthly 56.9

RETAIL RESEARCH
Relationship among policy rates and benchmarks:
The RBI surprised the market by cutting the repo rate by 25bps to 7.50%. The central bank action is appropriate by the below trajectory reading on inflation and a high in quality fiscal consolidation path provided by the government on the Union Budget. The RBI is likely to cut the repo rate further based on the development in macroeconomic numbers. Deposit vs. Advance Growth (YoY)%
Growth in non-food credit for commercial banks slowed to 10.19% at Rs 65,24,257 crore for the fortnight ended March 6, RBI data show. On the other hand, banks deposits continue to outpace credit growth by rising 11.62 per cent to Rs 85,54,045 crore in the period, as against Rs 76,63,535 crore in the same period last year.
Economy Updates
US Dollar Vs Indian Rupee
The US dollar appreciated against the rupee by 0.19% for the week ended 27th March, 2015. India’s rupee fell the most in almost two weeks on speculation importers stepped up dollar purchases to pay fiscal-year-end bills and as local stocks retreated. The Indian rupee plunged against the dollar to due to heavy capital outflows and a spike in oil prices after Saudi Arabia announced war on Yemen.
WPI Inflation (YoY)
Inflation, as measured by the wholesale price index (WPI), fell to a steep -2.06 percent, marking the fourth straight month of deflating prices, which is, year-on-year inflation fell to the lowest level since it has been tracked in the current 2005 series. The February contraction was led by a month-on-month decline in all three broad groups that make up the index.

RETAIL RESEARCH
Corporate Bonds Spread Vs Gilt Securities:
Corporate bond yields rose last week. The one year AAA credit spreads fell by 3 basis points while 5 year spread fell by 4 basis points. Liquidity support from RBI (Bn. Rs)
The liquidity in the banking system improved during last week compared to the previous week. The net infusion from the LAF window was a daily average of Rs. 6,582 crore for last week (Rs. 14,534 crore in previous week). The inter-bank call rates traded around 7.50% levels on Friday. The CBLO rates were positioned at 7.59% level
Money Stock (M3) (YoY) (%)
Money Supply M3 in India increased to Rs. 1,05,321.20 Billion in March of 2015 from Rs. 1,04,155.85 Billion in February of 2015. Money Supply M3 in India averaged Rs. 17046.13 Billion from 1972 until 2015, reaching an all time high of Rs. 105321.20 Billion in March of 2015 and a record low of Rs. 123.52 Billion in January of 1972.
Foreign Exchange Reserves (mn of USD)
India’s foreign exchange reserves hit an all-time high of $340 bn for the week ending March 20.

RETAIL RESEARCH
Certificates of Deposit (%):
CD rates are trending marginally lower in the recent periods. The CD rates hovered around 8.47% levels (as per the latest data) (one year CD). Commercial Paper (%):
Rates of Commercial papers are seen trading lower in the recent periods. The CP rates are hovering around 8.95% levels (one year maturity CP).
MF’s net investment in Debt (Rs Crs):
In January, the MF have bought debt worth Rs. 33,124 crore while in Feb, they have bought debt worth Rs. 60,749 crore. So far in Mar, they bought Rs. 72,394 crore.
FII’s net investment in Debt (Rs Crs):
In January, FII bought debt worth Rs. 23,068 crore while in Feb, they have bought debt worth Rs. 13,422 crore. So far in Mar, they bought Rs. 6,216 crore. Analyst: Dhuraivel Gunasekaran ([email protected])
RETAIL RESEARCH Tel: (022) 3075 3400 Fax: (022) 2496 5066 Corporate Office
HDFC securities Limited, I Think Techno Campus, Building - B, "Alpha", Office Floor 8, Near Kanjurmarg Station, Opp. Crompton Greaves, Kanjurmarg (East), Mumbai 400 042 Phone: (022) 3075 3400 Fax: (022) 2496 5066 Website: www.hdfcsec.com Email: [email protected]
Disclaimer: Mutual Funds and Debt investments are subject to risk. Past performance is no guarantee for future performance This document has been prepared by HDFC Securities Limited and is meant for sole use by the recipient and not for circulation. This document is not to be reported or copied or made available to others. It should not be considered to be taken as an offer to sell or a solicitation to buy any security. The information contained herein is from sources believed reliable. We do not represent that it is accurate or complete and it should not be relied upon as such. We may have from time to time positions or options on, and buy and sell securities referred to herein. We may from time to time solicit from, or perform investment banking, or other services for, any company mentioned in this document. This report is intended for non-Institutional Clients
This report has been prepared by the Retail Research team of HDFC Securities Ltd. The views, opinions, estimates, ratings, target price, entry prices and/or other parameters mentioned in this document may or may not match or may be contrary with those of the other Research teams (Institutional, PCG) of HDFC Securities Ltd.


