
3009076
33
Retail Research 1 Monthly Equity Commentary 26 27 28 S 02 03 04 05 08 09 10 11 12 15 16 17 18 19 22 23 24 25 26 29 30 8240 8220 8200 8180 8160 8140 8120 8100 8080 8060 8040 8020 8 T 7980 7960 7940 7920 7900 7880 7860 7840 7820 7800 1-CNXNifty.CNX Nifty Index.NSE - 30/09/14 Trend7 Daily Month Gone By The Benchmark indices ended flat for the month of September 2014. BSE Sensex fell by 0.03% and Nifty closed marginally higher by 0.13% for the month. Frontline Indices: Week No % Chg Key Positives Key Negatives Sensex Nifty 1 +0.6 +0.7 India's foreign exchange reserves surged by $60.5 mn to $318.64 bn during the week as foreign currency assets rose, the RBI said. India HSBC/Markit purchasing managers' index for the services industry stood at 50.6 in August, down from 52.2 in July, indicating a slowdown in the sector activity as new business expanded at a weaker pace. HSBC Markit Manufacturing PMI for India fell to a seasonally adjusted annual rate of 52.40, from 53.00 in the preceding quarter. Analysts had expected HSBC Markit Manufacturing PMI to fall to 52.90 in the last quarter. 2 -0.9 -0.8 The annual consumer price inflation (CPI) eased to 7.8% in August, helped mainly by slower annual increases in prices of fuel, light & clothes. After launching highway projects worth Rs 1.5 lakh cr that were stuck on account of various regulatory hurdles, the government is all set to roll out Rs 2 lakh cr worth of infrastructure projects this year. India's foreign exchange reserves fell by $1.327 bn in the week to September 5, as the country's central bank sold dollars to prevent currency volatility. 3 +1.0 +1.0 India's wholesale price inflation eased to its lowest level in nearly five years in August. The wholesale India's foreign exchange reserves fell for the second straight week as the country's central bank sold dollars to prevent currency volatility after the Monthly Strategy Report – October 2014
description
report
Transcript of 3009076

Retail Research
1
Monthly Equity Commentary
26 27 28 S 02 03 04 05 08 09 10 11 12 15 16 17 18 19 22 23 24 25 26 29 30
8240
8220
8200
8180
8160
8140
8120
8100
8080
8060
8040
8020
8 T
7980
7960
7940
7920
7900
7880
7860
7840
7820
7800
1-CNXNifty.CNX Nifty Index.NSE - 30/09/14 Trend7
Daily
Month Gone By The Benchmark indices ended flat for the month of September 2014. BSE Sensex fell by
0.03% and Nifty closed marginally higher by 0.13% for the month. Frontline Indices: Week
No % Chg
Key Positives Key Negatives Sensex Nifty
1 +0.6 +0.7
India's foreign exchange reserves surged by $60.5 mn to $318.64 bn during the week as foreign currency assets rose, the RBI said.
India HSBC/Markit purchasing managers' index for the services industry stood at 50.6 in August, down from 52.2 in July, indicating a slowdown in the sector activity as new business expanded at a weaker pace.
HSBC Markit Manufacturing PMI for India fell to a seasonally adjusted annual rate of 52.40, from 53.00 in the preceding quarter. Analysts had expected HSBC Markit Manufacturing PMI to fall to 52.90 in the last quarter.
2 -0.9 -0.8
The annual consumer price inflation (CPI) eased to 7.8% in August, helped mainly by slower annual increases in prices of fuel, light & clothes.
After launching highway projects worth Rs 1.5 lakh cr that were stuck on account of various regulatory hurdles, the government is all set to roll out Rs 2 lakh cr worth of infrastructure projects this year.
India's foreign exchange reserves fell by $1.327 bn in the week to September 5, as the country's central bank sold dollars to prevent currency volatility.
3 +1.0 +1.0 India's wholesale price inflation eased to its lowest level in nearly five years in August. The wholesale
India's foreign exchange reserves fell for the second straight week as the country's central bank sold dollars to prevent currency volatility after the
Monthly Strategy Report – October 2014

Retail Research
2
price index (WPI) rose 3.74 percent year-on-year last month, helped to its slowest pace since October 2009 by a favourable statistical base and falling global crude oil prices.
India signed a 5-year trade and economic cooperation agreement with China with a view to improve the trade balance and obtain $20 billion Chinese investment into the country.
US Fed Reserves said that it may withdraw monetary easing sooner than expected. Reserves fell by $1.615 billion in the week to September 12 to $315.698 billion.
4 -2.1 -2.2
Standard & Poor's raised the outlook for India's "BBB-minus" rating back to "stable" from "negative," saying Prime Minister Narendra Modi government's "strong" mandate would allow it to implement fiscal and economic reforms.
The government has streamlined execution of highway projects worth Rs 1.50 lakh crore and a target of building 30 km of highways a day will be achieved in another two years.
The Supreme Court on Wednesday cancelled all coal block allocations except for government run blocks that operate on a non-JV basis. The criteria fit just four of the 218 blocks that were deemed illegal by the court in its August order. Media reports said exempted coal blocks included allocations to NTPC, SAIL and Sasan UMPP.
India's foreign exchange reserves fell by $101.3 mn to $315.596 bn in the week to Sept 19 despite a rise in non-US currency assets.
Global markets:
Indices Aug-14 Sep-14 %
Change
US - Dow Jones 17098 17043 -0.3
US - Nasdaq 4580 4493 -1.9
UK - FTSE 6820 6623 -2.9
Japan - Nikkei 15425 16174 4.9
Germany - DAX 9470 9474 0.04
Brazil - Bovespa 61288 54116 -11.7
Singapore - Strait Times 3327 3277 -1.5
Hong Kong – Hang Seng 24742 22933 -7.3
India - Sensex 26638* 26631 -0.03
India - Nifty 7954* 7965 0.02
Indonesia - Jakarta Composite 5137 5138 0.01
Chinese - Shanghai composite 2217 2364 6.6 *As on 28th Aug 2014
World markets ended the month of Sept 2014 on a negative/flat note. The worst hit were Bovespa and Hang Seng falling by 11.7% and 7.3% respectively, while the other list of losers included FTSE, Nasdaq, Strait Times and Dow Jones which were all down by 2.9%, 1.9%, 1.5% and 0.3% respectively. Indices like Nikkei and Shanghai rose significantly by 4.9% and 6.6% respectively while DAX, Nifty, Jakarta and Sensex were flat at 0.04%, 0.02%, 0.01% and -0.03%.
Average daily volumes on BSE during the month of Sept 2014 rose by 32.7%
M-o-M. (NSE daily average volumes rose by 12.3% M-o-M). The average daily derivatives volumes on NSE rose by 6.1% to Rs. 231921.77 cr in September.

Retail Research
3
The performance of the sectoral Indices was mixed. The top two gainers were Auto and Healthcare, which rose by 11.6% and 8.2% respectively. The top two losers were Realty and Metal which fell by 8.8% and 6.2% respectively.
BSE Indices 31-Aug-14 30-Sep-14 % chg Remarks Sensex 26,638.1 26,630.5 -0.03 Smallcap 10,264.5 10,681.5 +4.1 Midcap 9,298.9 9,530.4 +2.5 BSE 500 10,096.1 10,173.3 +0.8 BSE 200 3,233.7 3,251.8 +0.6 BSE 100 8,016.7 8,015.7 -0.01 Auto 17,293.7 17,746.9 +2.6
Bankex 18,003.7 17,615.5 -2.2 Bank stocks declined on reports that the collective exposure of banks to coal blocks which are under legal scrutiny and related industries stands at a whopping Rs 4 lakh crore.
Capital Goods 14,913.2 14,267.7 -4.3 The industrial activity data, measured in terms of the Index of Industrial Production (IIP) has been below expectations which triggered a sell in this sector
Consumer Durables 9,180.8 9,850.8 +7.3 Consumer durable manufacturers are expecting sales to pick up this festive season on hopes of an economic recovery after two years of negligible sales growth.
FMCG 7,401.8 7,631.0 +3.1 Due to the volatility in the cyclical sector, investors are going back to defensives.
Healthcare 13,356.9 14,352.3 +7.5 Pharma stocks rose as rupee edged lower against the dollar. Weakness in rupee could boost
sales of pharma companies in rupee terms as pharma firms derive substantial revenue from exports.
IT 10,085.9 10,687.6 +6.0 The technology stocks rose on back of robust economic indicators from USA and due to the shift from cyclicals to defensives.
Metal 12,252.7 11,409.4 -6.9
Metal and mining stocks declined as a batch of weak data out of China raised concern of a sharp slowdown in the world's second-biggest economy.
Also the Supreme Court’s verdict on cancellation of 214 coal blocks, added to the pressure in this sector
Oil & Gas 11,184.9 10,728.9 -4.1
PSU OMCs fell on reports that diesel prices may be cut for first time in seven years on declining crude oil prices.
The fall in this sector was also due to the deferment of the gas price decision by the Government to 15th November 2014
Power 2,041.8 1,978.1 -3.1 Sector fell due to cancellation of coal blocks which would hamper power production. PSU 8,096.3 7,782.5 -3.9
Realty 1,727.4 1,581.3 -8.5 Real estate stocks witnessed selling pressure after Delhi government hiked the circle rates -- the minimum valuation at which properties have to be registered -- by up to 20 percent.
TECK 5,594.3 5,918.7 +5.8
Sectoral performance:

Retail Research
4
Fund Activity
Particulars Net Buy / Sell Net Buy / Sell Open Interest Open Interest Remarks Aug -14 Sep –14 Aug -14 Sep–14
FII Activity (Rs. in Cr) FII Activity (Rs. in Cr) Equities (Cash) +6436.7 +5164.8 FIIs continued to be large net buyers in Sept. Index Futures +1337.6 -3716.8 11199 11052 FIIs were net sellers with a flat open interest. Index Options +11061.5 +15704.5 43573 58915 FIIs were net buyers with rise in open interest. Stock Futures +5569.3 -6167.6 44849 42355 FIIs were net sellers with fall in open interest. Stock Options -670.8 -630.5 27 1545 FIIs were net sellers along with major rise in open interest.
MF Activity (Rs. In Cr) MF Activity (Rs. In Cr) Equities (Cash) +6957.6 +4135.8 MFs were large net buyers in the month of September. FIIs were net buyers of debt papers buying a net amount of Rs.16177.2cr of debt papers compared to Rs. 17105.5cr worth debt bought in Aug.
Indian G-Sec bond yields ended lower by 5 bps at 8.51% at the end of September 2014
over August 2014. Bond Yields are seen falling in the near term, due to the Reserve Bank of India's (RBI) steps to further develop the government securities (G-sec) market and enhance liquidity. Bond Prices rose on GoI’s borrowing program for the second half coming in lower than expectations – this offset selling pressure as investors pared positions ahead of the central bank's monetary policy review on 30th September, while weakness in the local currency also hurt and also worries about earlier-than-expected U.S. rate hikes, which could dent the big foreign inflows into Indian shares and debt markets.
Bond Yields

Retail Research
5
In September 2014, the Reuters/Jefferies CRB Index of 19 raw materials ended lower by 4.85% to close at 279. The Reuters/Jeffries CRB Index fell on account of a fall witnessed in commodities like Wheat (down 35.06%), Corn (down 15.1%), Nickel (down 10.6%), Cotton (down 10.0%), Heating Oil (down 7.4%), Aluminium (down 6.8%), Gold (down 5.8%), Crude Oil (down 5.0%), Copper (down 4.1%), Coffee (down 3.9%), and Sugar (down 0.1%). However, Silver, Lean Hogs, Live Cattle, Natural Gas and Cocoa were all up by 13.0%, 11.0%, 4.6%, 3.0%, and 2.7% respectively.
Behaviour of commodity prices (including LME 3 month buyer prices for base metals)
during the month ended September 2014 is given below. All of the base metal prices closed negative for the month of September.
Behaviour of commodity prices (including LME 3 month buyer prices for base metals) during the month ended September 2014: Commodity 30-Sep-14 29-Aug-14 % Chg Reasons
Gold 1,212 1,287 -5.82%
Gold fell to its lowest as a stronger dollar outweighed any safe-haven demand from lower equities and heightened tensions over Ukraine.
Prices traded near its lowest level in two-and-a-half months on robust U.S. economic data that curbed the metal's safe-haven appeal.
Bullion posted its longest losing streak since April 2013, after the U.S. Federal Reserve indicated it could raise interest rates sooner than expected earlier this month.
The Federal Reserve increased its estimate for the target rate on overnight loans between banks amid signs that the U.S. economic recovery is gaining traction and also it raised its estimate for a key lending rate even as policy makers affirmed a pledge to keep borrowing costs close to zero percent for a considerable time which weighted on the gold price.
The dollar's rally to a 13-month high dampened demand for the precious metal as an alternative investment
Crude Oil 91 96 -5.00%
WTI crude oil prices dipped as a disappointing US jobs report tempered the sentiment over demand in the world’s top crude consumer and as dealers digested a mixed US inventory report and a new round of interest rate cuts by the European Central Bank, while keeping a watch on the Ukraine conflict.
Oil prices came under pressure on concerns about fragile demand, flush global supplies and a surging US Dollar.
Prices closed at their lowest level since November 2012 on its biggest one-day drop in nearly 23 months. Slack demand for oil, a slew of weak macroeconomic data out of China and the eurozone, a stronger dollar as
well as plentiful supplies that include surging output from Libya dragged prices lower in the quarter. Aluminium 1,969 2,113 -6.84%
Copper 6,686 6,970 -4.07%
Copper slid to its lowest in almost three months after Chinese inflation data showed more signs of cooling growth in the world's top metals user and prices looked vulnerable to further losses given looming supply growth
Prices fell under pressure as weak factory data from China raised concerns about the outlook for demand from the world's top metals consumer.
Commodities

Retail Research
6
The industrial metal slipped amid signs of ample supply in the world's top copper user, and expectations of steadying demand into the end of the year.
Zinc 2,290 2,360 -2.97%
Nickel 16,595 18,570 -10.64%
Nickel prices tumbled on speculation that a ban of ore exports won’t occur anytime soon by the Philippines, the largest supplier to China and because of higher dollar price.
Speculators indulged in booking profits at prevailing levels ignoring the metal's gains overseas. Besides, low demand from alloy-makers and other consuming industries in domestic spot markets, weighed on
prices. Tin 20,300 21,875 -7.20% Tin prices dropped to a 13-month low on stockist selling amidst reduced demand from alloy industries. Lead 2,092 2,251 -7.06%
The Baltic Dry Index (BDI) lost 7.32% in the month to close at 1063. BDI is a number issued daily by the London-based Baltic Exchange. Not restricted to Baltic Sea countries, the index provides "an assessment of the price of moving the major raw materials by sea. Taking in 23 shipping routes measured on a time charter basis, the index covers Handysize, Supramax, Panamax, and Capesize dry bulk carriers carrying a range of commodities including coal, iron ore and grain. The main sea freight index at Baltic Exchange for bigger vessels dropped mainly due to a fall in capesize and panamax rates.
The USD mostly ended on Positive note vs other currencies in September 2013. The dollar
hit a four-year high against a basket of major currencies, putting the greenback on track for its biggest quarterly gain in six years, and a two-year high against the euro after consumer prices in the euro zone rose 0.3 percent year-on-year, slowing from 0.4 percent annual increases in August and July.
Given below is a table that shows the depreciation (-)/appreciation (+) of the dollar against various currencies for the month of September 2014: USD to: 30-Sep-14 31-Aug-14 % Chg Reasons Pakistani rupee 103.99 103.17 0.8% Hong Kong dollar 7.76 7.75 0.2% Chinese yuan 6.16 6.15 0.0%
Indian rupee 61.59 60.53 1.8%
The Indian rupee fell posting its worst month since the record low levels of August 2013, as the dollar continued to strengthen against emerging market currencies over growing bets for an early hike in U.S. interest rates.
The Currency fell the most in more than a month on speculation an improving U.S. economy will prompt the Federal Reserve to bring forward its timetable for increasing interest rates.
Taiwan dollar 30.47 30.76 -0.9%
Currencies

Retail Research
7
Singapore dollar 1.27 1.25 2.0% Argentine peso 8.49 8.49 -0.1%
Euro 0.79 0.76 3.5%
The euro fell to a new two-year low against the dollar after data showed euro zone annual inflation at 0.3 per cent in September.
The euro depreciated on the prospect of diverging monetary policy between the Federal Reserve and the European Central Bank as rate differentials swing decisively in the greenback's favor.
The euro also dropped after a report showed German business confidence fell more than forecast, fueling bets the European Central Bank will add further monetary stimulus.
Thai baht 32.42 32.66 -0.7%
Malaysian ringgit 3.28 3.16 3.6%
Malaysia’s ringgit fell by the most in a year and led losses in Asia on concern a strengthening U.S. economy will prompt the Federal Reserve to bring forward its timeline for raising borrowing costs.
Investor sentiment weakened following a slowdown in Chinese industrial production in August also weighed on currency.
Indonesian rupiah 12195.10 11709.60 4.1%
The rupiah weakened against dollar for the first time since June on speculation foreign investors will cut their holdings of Indonesian assets as the Federal Reserve moves toward raising borrowing costs.
Rupiah declined after global funds pulled money from local stocks in anticipation of an increase in U.S. interest rates.
The Currency also fell to a seven-month low after the passage of a law scrapping direct elections for local officials spurred outflows from Indonesia’s stock market.
Japanese yen 109.45 104.10 5.1%
The Japanese yen fell against the other major currencies as strong US economic data released last week boosted investors' sentiment.
The yen fell to the lowest level versus the dollar in almost six years on speculation faster economic expansion in the U.S. will convince the Federal Reserve to raise borrowing costs, while the Bank of Japan maintains monthly bond buying to keep rates low to bolster growth.
Japan’s currency was set to complete a four-week loss as demand for the greenback climbed afterdata showed U.S. service industries expanded in August at the fastest pace in nine years.
Brazilian real 2.44 2.27 7.5%
The Brazil’s real touched its lowest level fell to a five-year low on speculation it may be hard to pull the economy out of recession as the much-maligned President Dilma Rousseff appears to be gaining more support ahead of the October elections.
The currency was the worst performance among 31 major currencies. The decline was the biggest among 24 emerging-market currencies tracked by Bloomberg. The dollar has been gaining over the past three months on expectations that the Federal Reserve is
moving closer to raising U.S. interest rates from near zero for the first time since the financial crisis.
Korean won 1055.19 1040.37 1.4% (Data Source:www.oanda.com)

Retail Research
8
Comparison of Equity Returns in various markets - MSCI Indices in US$ terms MSCI Index Last MTD 3MTD YTD 1 Yr MSCI Index Last MTD 3MTD YTD 1 Yr BRIC 274.2 -9.4% -4.3% -1.5% -0.1% EUROPE 1,685.8 -3.8% -7.4% -4.2% 3.0%
EM (EMERGING MARKETS) 1,005.3 -7.6% -4.3% 0.3% 1.8% G7 INDEX 1,501.2 -2.5% -2.0% 2.8% 11.3%
EM ASIA 460.1 -6.0% -2.5% 3.1% 6.7% WORLD 1,698.4 -2.9% -2.6% 2.3% 10.0%
EM EUROPE 374.4 -6.1% -13.9% -14.4% -16.0%
EM EUROPE & MIDDLE EAST 320.6 -4.9% -11.0% -13.8% -15.4% AUSTRALIA 846.1 -11.9% -9.1% -3.2% -4.9%
EM LATIN AMERICA 3,170.5 -13.5% -5.9% -1.0% -4.0% PORTUGAL 77.7 -9.7% -25.2% -21.8% -20.8%
AUSTRIA 951.9 -9.4% -21.8% -25.4% -23.4%
CHINA 61.7 -6.8% 0.3% -2.3% 1.4% NEW ZEALAND 131.9 -7.8% -10.4% 0.5% -4.1%
INDIA 500.6 -1.5% 1.6% 22.9% 35.4% HONG KONG 9,510.4 -7.7% -3.3% -0.7% 2.3%
INDONESIA 823.1 -3.1% 3.3% 23.7% 17.5% CANADA 1,843.2 -6.7% -4.9% 5.0% 8.6%
KOREA 423.3 -8.2% -7.3% -4.3% -0.5% NORWAY 3,095.2 -5.8% -7.9% 0.0% 5.5%
MALAYSIA 494.3 -4.8% -4.1% -2.6% 2.0% UNITED KINGDOM 1,319.0 -5.3% -6.9% -4.1% 2.3%
PHILIPPINES 574.8 0.4% 3.7% 23.0% 16.7% GERMANY 1,966.3 -4.2% -11.2% -11.8% -0.1%
TAIWAN 304.9 -7.0% -5.5% 5.2% 9.7% SINGAPORE 4,151.6 -4.1% -2.4% 0.5% 0.7%
THAILAND 423.1 0.0% 6.7% 21.0% 8.3% FRANCE 1,642.7 -3.7% -8.5% -6.0% -0.7%
BRAZIL 2,170.3 -19.4% -9.2% -2.2% -8.3% SPAIN 529.3 -3.1% -7.8% 2.8% 13.9%
CHILE 1,669.2 -2.6% -7.9% -9.4% -16.1%
COLOMBIA 1,049.7 -10.4% -8.7% 1.1% -10.6% Frontier Markets
MEXICO 7,163.4 -4.2% 1.8% 2.7% 9.8% FM (FRONTIER MARKETS) 700.5 0.4% 1.1% 17.8% 25.3%
PERU 1,214.1 -6.4% -1.7% 10.2% 13.3%
CZECH REPUBLIC 404.0 3.4% 1.7% 9.6% 8.7% BANGLADESH 1,077.7 16.4% 25.3% 57.2% 63.8%
GREECE 99.6 -12.6% -20.0% -16.0% -7.5% GHANA 985.4 14.4% -16.7% -32.2% -29.3%
HUNGARY 377.4 -1.7% -12.8% -19.2% -24.3% ARGENTINA 2,616.8 11.3% 2.6% 27.6% 50.6%
POLAND 859.0 0.4% -4.4% -3.3% -0.1% MOROCCO 306.3 3.8% 4.7% 5.3% 7.5%
RUSSIA 611.1 -5.8% -17.3% -22.3% -22.2% OMAN 892.6 2.4% 9.2% 13.9% 15.4%
TURKEY 477.4 -12.1% -11.8% 4.7% -10.2% SRI LANKA 264.9 2.4% 13.6% 15.8% 24.4%
EGYPT 933.0 5.7% 28.0% 38.1% 64.8% BULGARIA 177.7 -6.3% -12.0% 0.8% 20.5%
SOUTH AFRICA 530.4 -9.6% -7.2% 0.2% 1.9% ROMANIA 510.2 -7.1% -10.3% 2.3% 10.4%
QATAR 1,148.9 3.5% 17.7% 22.7% 31.1% VIETNAM 459.1 -7.6% 2.0% 11.2% 13.7%
UNITED ARAB EMIRATES 572.2 5.2% 22.9% 42.2% 69.1% ESTONIA 566.8 -9.1% -17.1% -28.6% -31.5%
The Equity markets across the globe ended the month of September 2014 on a negative note. The Developed markets ended lower in the range of 2.9-3.8% with Europe being a top loser, down 3.8% (followed by World & G7, which fell 2.9% & 2.5% respectively). Emerging markets fell 7.6%, led by EM - Latin America & EM – BRIC, down 13.5% & 9.4% respectively. EM – Asia, EM – Europe and EM - Europe & Middle East underperformed,
Global markets end on a negative note; Developed & Emerging Markets fell, Frontier markets ended flat

Retail Research
9
reporting decline of 6.0%, 6.1% & 4.9% respectively. Growth in Frontier markets was moderate at 0.4% during the month.
Amongst the Frontier markets, Estonia, Vietnam, Romania & Bulgaria were the top losers,
which fell by 9.1%, 7.6%, 7.1% & 6.3% respectively. However, the index fall was limited, as selective markets like Bangladesh, Ghana & Argentina outperformed, rose by double digit 16.4%, 14.4% & 11.3% respectively. Morocco, Oman, Sri lanka also rose by 3.8%, 2.4% & 2.4% respectively.
Dhaka stocks rebounded due to investors’ optimistic share purchasing expecting better returns. It managed to sustain the positive vibes as fresh fund injection through various sources continued. Fresh funds were coming to the capital market from the banking sector as the banks’ interest rate on deposit declined significantly in recent times. Bangladesh exports in August rose 7.25 percent from a year ago to $2.16 billion, driven by an increase in readymade garment exports and ending a brief slowdown in July. Bangladesh's trade confidence rose sharply, by 38 points in six months, which is the second highest among 23 countries globally. The jump was due to growing demand for its garments from Western buyers and the recent initiatives aimed at making the country's apparel factories safer. HSBC's latest Trade Confidence Index, which was published recently, shows that Bangladesh's score increased to 141 in the first half of 2014, from 103 in the second half of 2013.
There was continued recovery in the Ghanaian stock market as the benchmark GSE Composite Index moved northward, reflecting a better year-to-date gain in local currency. The sustained recovery was driven by rising confidence in the Ghanaian banking sector.
Argentina’s senate mulled a bill to sidestep the U.S. court ruling that resulted in Argentina’s July debt default, and a handful of local stocks including banks rallied. Despite the debt crisis Argentina’s stock market has soared, yielding some of the biggest gains in the world in recent weeks as investors dodge capital controls by buying equities in local currency that can be sold abroad for dollars, as well as seeking refuge from inflation that is close to 40 per cent. The rally was also fuelled by the government’s moves to win back market confidence after settling long-running disputes with investors, as well as speculation that electricity tariffs would be unfrozen, providing a particular boost for energy companies.
Estonia & Vietnam pull the Frontier markets lower; but Bangladesh, Ghana & Argentina restrict index losses

Retail Research
10
Vietnamese stocks fell on account of waned liquidity & after economic data from HCM City showed the consumer price index increased sharply from August. September's index rose 1.13 per cent above last month and 3.16 per cent over the same period last year.
Amongst the Emerging markets, EM-Latin America & BRIC were the top losers, down
13.5% & 9.4% respectively. The fall in the EM – Latin America were led by Brazil, Columbia, Peru, Mexico & Chile,
which registered fell of 19.4%, 10.4%, 6.4%, 4.2% & 2.6% respectively. Brazilian markets got hammered ahead of election. Brazil's stock market and currency
were sent reeling by signs President Dilma Rousseff is pulling ahead of her main challenger in the country's presidential election next month. A poll released by research firm Datafolha showed Rousseff with 47 per cent of voter intention against Silva's 43 per cent in a potential second-round runoff. Silva had once led by as much as 10 points in a potential runoff. Another poll released showed Rousseff with 47.7 per cent in the second round, against Silva's 38.7 per cent. Brazilian investors have been heavily critical of Rousseff's government for implementing policies that have gone against minority shareholder interests in state-run companies and a tendency to enact one-off stimulus measures rather than structural reforms.
The fall in the BRIC index was driven largely by Brazil, China, Russia & India (down 19.4%, 6.8%, 5.8% & 1.5% respectively).
Chinese stocks fell on poor economic data. The latest indicator of China's deceleration with a sharper-than-expected drop-off in industrial production for August to 6.9% year-over-year, the slowest pace since 2009, during the global financial crisis, a sign of renewed weakness in the world’s second-largest economy. Several financial institutions lowered their growth forecasts for China's economy. China’s economy has been slowing for several years, but a sharp correction in real estate markets in recent months has led to concern that the slowdown could turn into a more severe slump.
Russian shares fell, bucking the trend on other stock markets, amid concern that Western sanctions over Ukraine are imposing a heavy toll on Russia's economy. Russian stocks dropped the most in seven weeks as AFK Sistema lost more than a third of its market value after billionaire owner Vladimir Evtushenkov was placed under house arrest on suspicion of money laundering. The arrest is worsening investor sentiment already reeling from the crisis in Ukraine after the U.S. and European Union expanded sanctions on Russian companies and individuals this month.
Brazil, Columbia, Peru, Mexico & Chile underperformed led to Latin American index fell
BRIC markets underperformed - Brazil, Russia, India & China

Retail Research
11
Among the EM - Asia, Korea, Taiwan, China, India, Indonesia, Malaysia were the top
losers, down 8.2%, 7.0%, 6.8%, 1.5%, 3.1% & 4.8% respectively. Philippines & Thailand closed moderately by 0.4% & 0.0% respectively.
Korea shares fell on concerns over tepid exports. South Korean shares ended in negative territory as tensions in Hong Kong spurred risk-averse sentiments. South Korean shares ended lower as foreign investors continued to sell local stocks amid worries about foreign exchange losses caused by the depreciation of local currency to the U.S. dollar. China is South Korea's largest export destination, and government officials worry that any sharp slowdown there could knock South Korean exporters. Analysts are also wary of the looming earnings season, which is expected to underline the tough times for the corporate sector.
Among the EM – Europe and Europe & Middle East, Turkey, Greece and Russia were the top losers, down 12.1%, 12.6% & 5.8% respectively in September. Hungary fell marginally by 1.7%. However, Czech Republic, Qatar & UAE outperformed, up 3.4%, 3.5% & 5.2% respectively, which restricted further index losses. Poland was flat at 0.4%.
Turkish stocks fell the most in the world while the lira and government bonds dropped on concern higher U.S. interest rates next year will curtail appetite for riskier assets. Turkish assets have come under pressure, with the lira posting the third-biggest drop in emerging Europe and Africa, as investors weighed prospects for the Federal Reserve to start increasing borrowing costs. U.S. policy makers raised their estimates for future interest rates, while retaining a pledge to hold them near zero for a “considerable time.” Turkey is among countries most vulnerable to shocks from higher U.S. rates.
Fitch downgraded Greece’s sovereign debt rating from 'CCC' to 'C'. Fitch considers that the proposal to reduce Greece's public debt burden via a debt exchange with private creditors will, if completed, constitute a rating default, and result in the country's IDR being lowered to Restricted Default ('RD') upon completion.
MSCI upgraded the UAE and Qatar from frontier to emerging market status in May and arranged for frontier funds to exit those countries through a series of monthly sales. United Arab Emirates and Qatar rebounded on Dubai developer Emaar Properties surged. The initial public offer of Emaar's malls and retail unit will be one of the largest equity sales in the Middle East since 2008, underlining Dubai's recovery from a credit crisis that forced many state-linked developers to stall projects.
Korea, Taiwan, China underperform
Turkey, Greece & Russia pull EM – Europe & Middle East index lower; Czech Republic, Qatar & UAE limit the losses.

Retail Research
12
Among the developed markets, Australia, Portugal, Austria, Newzealand & HongKong were the top losers, down 11.9%, 9.7%, 9.4%, 7.8% & 7.7% respectively. Israel grew at a decent rate by 1.7%. Further, the index fell due to underperformance from markets like Canada, Norway, UK, Germany, Singapore, France and Spain, which fell by 6.7%, 5.8%, 5.3%, 4.2%, 4.1%, 3.7% & 3.1% respectively.
Australia stock fell after the U.S. Federal Reserve signaled a move to higher interest rates is ahead. The Australian share market closed lower taking a hit as international investors pool their money in a strengthening US economy.
The geopolitical anxiety in the EU could have influenced the drop in markets after the EU governments stopped the new Russian sanctions.
European stock markets have fallen and the euro has struck its lowest level against the US dollar for almost two years as investors worried about unrest in Hong Kong ahead of an ECB meeting. Tensions in Hong Kong were cited as the main reason for the overall risk-aversion seen throughout the month, with US stocks extending declines on the civil unrest.
Hong Kong stocks fell, with the benchmark index capping its biggest two-day drop since February, as major streets in the city center remained barricaded by protesters for a third day. Shares extended their drop after a Chinese manufacturing gauge fell from the preliminary level reported earlier. The MSCI Hong Kong Index lost 0.8 percent, bringing its decline from an Aug. 20 high to more than 10 percent. Hong Kong’s stock market remains under a correction mood because of political jitters.
In its recent FOMC meet, the Fed Reserve renewed its pledge to keep interest rates near zero for a considerable time, but also indicated it could raise borrowing costs faster than expected when it starts moving. Many economists and traders had expected the U.S. central bank to alter the rate guidance it has provided since March, given generally improving data on the economy's performance. But the Fed repeated its assurance that rates would stay ultra-low for a "considerable time" after a bond-buying stimulus program ends. In a statement after a two-day meeting of its policy-setting Federal Open Market Committee, it announced a further $10 bn reduction in its monthly purchases, leaving the program on course to be shuttered next month.
Australia, Portugal, Austria – top losers amongst the developed markets
Outlook going forward
Global Market Outlook
Fed hints at steeper rate hike path, could impact the emerging markets in near term

Retail Research
13
The statement was virtually unchanged from July, though new quarterly projections released with it showed the central bank's view on where interest rates should be in future years is diverging from where financial markets have bet they will be. While the much analyzed phrase 'considerable time' remained in the FOMC statement, the newly announced scheme for interest rate normalization shows that higher rates are on the cards. The most significant change was the new rate projections, which suggested officials were positioning themselves for a potentially faster pace of rate hikes than they had envisioned when the last set of forecasts were released in June.
The recent economic data in US has been much better than expected. GDP grew by 4.6% in Q2CY14. U.S. manufacturing activity hovered at a near 4-1/2-year high in September and factory employment surged. A measure of U.S. consumer confidence reached its highest level since July 2013. Further, initial claims continue to hover near an eight-year bottom amid a very low rate of layoff. This gives further evidence that interest rates hikes could be faster once it starts. We expect the rate hikes to begin sometime in H1CY15.
The fear of rise in the rates earlier than expected could start to negatively impact the global markets in the near term. The increase in the interest rates in US could result in outflow of funds from the emerging markets / other developed markets, as it would become less profitable to borrow money in US and invest abroad. However, the rise in rates could somewhat benefit the US markets as people would invest in US equities on a signal that the US economy has turned around.
While the global markets could be impacted, we don’t expect the damage to be significant. The policy makers would ensure that no hard landing might happen.
The EU is to keep sanctions against Russia in place, judging that Ukraine's peace deal is
not fully effective. EU ambassadors who met recently had noted some encouraging developments since the 5 September ceasefire was agreed. However, it seems other parts of the peace deal would need to be properly implemented.
The sanctions target senior Russian officials, as well as Russia's oil industry, defence firms and banks. Western governments and the Ukrainian authorities in Kiev accuse Russia of supplying the separatist rebels in eastern Ukraine with heavy weapons and soldiers. However, Russia denies the allegations. EU and US sanctions have been in place since Russia's annexation of Crimea in March. At least 3,200 people have died in fighting since April in Ukraine's Donetsk and Luhansk regions, and thousands of civilians have fled the
EU to keep Russia sanctions in place over Ukraine

Retail Research
14
conflict. A shaky ceasefire has held since 5 September, and the two sides have since agreed to set up a 30km buffer zone. But there have been frequent flare-ups of violence.
Last week Ukraine's Prime Minister, Arseniy Yatsenyuk, told the UN General Assembly that Russian troops were still operating in eastern Ukraine. He urged the West not to lift sanctions until his country regained control of all its territory. Both the US and the EU have said sanctions could be lifted if the situation on the ground improves sufficiently.
Japan said recently that it was imposing additional sanctions on Russia because of its involvement in the Ukraine conflict and that it had also formally protested at the visit to a contested island by an aide to Russian President Vladimir Putin. The new measures include banning certain Russian banks from issuing securities in Japan and stepping up inspections to prevent arms being shipped to Russia, Chief Cabinet Secretary Yoshihide Suga said.
EU is Russia’s biggest global trading partner, a net importer in a relationship dominated by oil and gas. Europe’s dependence on Russia, energy wise, also makes the continent vulnerable. Crude petroleum and natural gas was the biggest Russian import for 21 of the 28 E.U. member states last year. Of the major European countries, Germany is most exposed to the Russian risk. Russia is a major client for German electricity plants, gas turbines and agricultural machines. At a time when the eurozone is still recovering from recession, the uncertainty could rapidly spread from specific sectors to the economy as a whole. The delay in lifting up the sanctions on Russia / continued sanctions on Russia could delay the recovery in Europe.
As US and allied warplanes continued to strike targets inside Syria, the Obama
administration is marshalling support for a war that is more and more explicitly aimed against the regime of Syrian President Bashar al-Assad, rather than the Islamic State of Iraq and Syria (ISIS).
The battle for the Syrian Kurdish city of Korbani near the northern border with Turkey has become the pretext for the Turkish mobilisation of tanks and troops in preparation for a possible incursion into Syria. The Turkish government is preparing its own military intervention as part of the escalating US-led war. The Turkish government has mooted the establishment of a buffer zone inside Syria and also called for a no-fly zone over areas of Syria—an appeal that the Obama administration now declares it is considering. The creation of a no-fly zone is transparently directed against the Assad regime and the Syrian military, the only force inside the country that has war planes.
Escalation of US-Syria conflict could result in investors turning away from riskier assets

Retail Research
15
Over the past three years, Turkey has been a source of support for anti-Assad militias, including ISIS, as well as a transit country for fighters, finance and arms flowing into Syria from other countries. While the Obama administration has called on the Turkish government to close its borders with Syria, it has used its NATO ally for the same supply purposes. The CIA jointly operates a centre inside Turkey, known as the Military Operations Command, through which it has helped arm and support the Western-aligned opposition inside Syria.
The US was joined by its "coalition partners", Bahrain, Saudi Arabia, Jordan and the United Arab Emirates in an attack against ISIS in Syria, the first attack conducted alongside Middle Eastern countries. The US has been carrying out strikes in Iraq against the militant group since last month and in Syria since last week with the help of Arab allies. It aims to destroy the bases and forces of the al-Qaida offshoot that has captured large areas of both countries.
The escalation of the conflict will of course raise questions over the risk appetite of many within the markets, who are no doubt worried about a major war which appears to be unfolding. Due to this increased geopolitical tension (along with other tensions like continued sanctions on Russia and present unrest in Hong Kong) could result in investors turning away from riskier assets and beginning to invest in safe havens. U.S. lawmakers have urged congressional action to back Obama's Syria war. The political analysts warn that continued war between US and Syria could dampen participation by anti-war Democrats in the November elections.
President Barack Obama's handling of the economy may be reviled by his political opponents, but he is receiving support from a surprising quarter: foreign exchange traders. The US dollar, after one of its most prolonged weak spells ever, has now re-emerged as the preferred currency for global investors. Across trading desks in New York, London and elsewhere, analysts are rushing to raise their dollar forecasts based on the resurgence in the US economy. In part, this bullish mood is tied to signals from the Federal Reserve that it will soon stop its bond-buying program - a change that would lift interest rates and buoy the dollar. Yet the recent rally in the dollar, which has gained about 3.2% against the euro since Aug. 20 and about 8% against the yen since July 1, underscores expectations that the US economy will continue to grow at a faster clip than that of Europe, Japan and even large emerging markets, all of which are seeing their economies stagnate.
Why US dollar has re-emerged as preferred currency for global investors

Retail Research
16
The increasing push by investors into the dollar can be seen as a favorable report card on the US economy, highlighting good performance in crucial benchmarks such as growth and fiscal responsibility, and an increasingly competitive position abroad because of a boom in energy exports. As long as the US continues to grow and the rest of the world remains stagnant, the dollar would continue to rally.
Past periods of dollar strength came when the dollar's status as a reserve currency was more firmly entrenched. More than a decade of easy US credit, the start of the euro and China's emergence as an economic colossus made the dollar less popular for global central banks, which diversified into euros, the renminbi and other alternatives. Now, with the Federal Reserve cementing its role as a lender of last resort to central banks all over the world, the dollar is poised to recapture lost ground as the preferred currency for central banks.
However, a strong dollar is not always a plus. Over time, it can stall economic growth by hurting exports, although economists point out that even with its recent spurt the currency remains undervalued in historical terms. Another consequence of a stronger dollar is currency instability in emerging markets. As currencies like the Turkish lira, the Brazilian real and the Chinese renminbi weaken, investors will be less willing to hold on to their assets in these countries - choosing instead to park their money in higher-yielding US dollar assets.
Recent unrest in Hong Kong is spooking markets for fear it could escalate, challenging Beijing to make a measured political response, at a time when Chinese and global growth are at the heart of market anxiety. There are worries that if the unrest prolongs, then it could impact China’s growth, which could in turn have an impact on growth of other economies who are major trading partners of China. That has made investors uneasy.
China would not likely risk harming Hong Kong's important economic role as a gateway for trade into the mainland. It is also a key banking hub, where Chinese banks and companies seek offshore funding. The big fear currently is that this proves too much for Chinese officials so they sacrifice reform for stability, so they slow down financial reforms and other types of reform. We feeI that is the risk people are not clear about. Hong Kong's role as a financial centre is critical to Chinese companies.
Recent unrest in Hong Kong could also impact markets in near term

Retail Research
17
India received a shot in the arm as global rating agency Standard & Poor's recently revised India's credit outlook to "stable" from "negative", acknowledging the improvement in the country’s economic environment. The revision was backed by an improvement in India’s external position and growth prospects and means it’s no longer on the brink of a "junk" rating. S&P was the last of the three main global ratings agencies with a negative outlook on India; Moody’s never changed India’s outlook, while Fitch upgraded it to stable in 2013.
Although Moody’s outlook on India remains stable, Andrew Colquhoun, Head of Asia-Pacific Sovereign Ratings Group at Fitch Ratings doesn't see any chance of an alteration in ratings for India in the medium-term. Moody's also does not expect a change in rating for India soon. The agency will look at Reserve Bank’s views on inflation trends, macro outlook and growth sustainability before any ratings action.
Mr. Andrew stated that on the Budget front, it was interesting that the new government reaffirmed the outgoing government’s fiscal deficit target. However, he stated that from his perspective, it remains a challenging target. In particular, there is an assumption for divestment revenue that is quite optimistic. Recent experience has been that when divestment revenues fall short the government responses by coming back on capital spending to keep the deficit within target and that is obviously something that has an impact on longer term growth prospects. So it remains to be seen whether the new government can find more supportive formula on the fiscal front.
On the growth outlook, Fitch stated that it expects it to accelerate but it would focus more on its sustainability, especially during times when global conditions turn less benign or if there is a domestic shock of one kind or another. So its focus would be more on the quality of growth acceleration, how much it is supported by increase in savings, increase in investment and increase in productivity most importantly.
U.S. President Barack Obama and new Indian Prime Minister Narendra Modi vowed recently to expand and deepen their countries' strategic partnership and make it a model for the rest of the world. In a joint "vision statement" issued after their first meeting at a White House dinner, the two leaders said they would work together not just for the benefit of both our nations, but for the benefit of the world. They said their countries would cooperate on security and to fight terrorism and would back a "rules based" global
India unlikely to see ratings upgrade in the near term
Indian Market Outlook
Obama, Modi vow to boost strategic ties

Retail Research
18
order in which India assumes greater multilateral responsibility, including a reformed U.N. Security Council.
They also vowed to work together against the threat posed by climate change and to cooperate to address the consequences of unchecked pollution. The two leaders also said their countries would work to ensure that economic growth brought better livelihoods for all people and stressed the importance of open markets and fair and transparent practices to allow trade to flourish. Washington has been keen to expand business and security ties with India, which it sees as a key counterbalance to an increasingly assertive China in Asia. Obama has backed New Delhi's bid to become a permanent member of the U.N. Security Council.
As part of an effort to spur foreign investment, Mr. Modi met many U.S. corporate leaders and told them he was committed to liberalizing India's economy, which has underperformed other emerging markets recently after years of breakneck growth.
Whether Modi’s visit to US would translate into fund and technology inflow into India will be watched carefully over the new few months.
RBI Governor Raghuram Rajan, on Sept 30, 2014, kept key rates unchanged in its fourth
bi-monthly monetary policy. It kept the policy repo rate under the liquidity adjustment facility (LAF) unchanged at 8% and the cash reserve ratio (CRR) of scheduled banks unchanged at 4% of net demand and time liabilities (NDTL); RBI said that since June, headline inflation has ebbed to levels which are consistent with the desired near-term glide path of disinflation – 8% by January 2015.
RBI said in the statement that most heartening feature has been the steady decline in inflation excluding food and fuel, by a cumulative 111 basis points since January 2014, to a new low. It added that with international crude prices softening and relative stability in the foreign exchange market, some upside risks to inflation are receding. However, it said that yet, there are risks from food price shocks as the full effects of the monsoon’s passage unfold, and from geo-political developments that could materialize rapidly.
RBI said that turning to the medium-term objective (6% by January 2016) the balance of risks is still to the upside, though somewhat lower than in the last policy statement. It said that this continues to warrant policy preparedness to contain pressures if the risks materialize. Therefore, it said that the future policy stance will be influenced by the Reserve Bank’s projections of inflation relative to the medium term objective (6% by January 2016), while being contingent on incoming data. RBI also said that in order to further develop the government securities market and enhance liquidity, it has been
Rates cuts unlikely over the next few months; however, markets have discounted the same

Retail Research
19
decided to bring down the ceiling on SLR securities under the held to maturity (HTM) category from 24% of NDTL to 22% in a graduated manner.
From RBI’s policy statement, it seems that there are upside risks to inflation in the next few months. Hence we feel RBI is unlikely to cut the interest rates over the next few months and would continue to focus on inflation trends. The current financial year might end up being the first in seven years to see the RBI keeping the benchmark repo rate unchanged. However, this is unlikely to impact the markets in the near term as the same has already been discounted. Infact any positive surprises could boost the sentiments.
India Inc had an impressive quarter in Q1FY15. Following the positive trend seen in Q4FY14, Indian corporate sector saw earnings acceleration in Q1FY15. This was led by sectors like auto, IT, pharma and FMCG that continued to show strong earnings growth. According to data compiled by Care Ratings, over 1,204 companies have registered a substantial growth of 33.4% at Rs 62,040 cr in net profit for the first quarter of this fiscal. This is against 8.8%, at Rs 46,792 cr, registered in the corresponding quarter of fiscal 2014. During the quarter, total net sales grew 12.8% at Rs 5,54,426 cr against 4.8% or Rs 4,91,689 cr in Q1FY14.
The June quarter had an advantage of lower growth in the corresponding quarter of the prior fiscal—the base effect. Sustaining the high profit growth trend in the coming quarters may be difficult because of the high base effect. The real test will come in the remaining three quarters of the fiscal since it will be compared with the more robust performance in the corresponding quarters of the previous year.
Focus would shift to Q2 (July-Sept 2014) earnings which would kick start from second week of October. We don’t expect any material improvement in the sales & profit growth on Y-o-Y basis in Q2. However, certain sectors like IT & Healthcare could do well because of recent depreciation of INR (vs. USD).
The Indian markets have witnessed strong FII flows over the last one year on expectations
that the new Modi – led NDA Government would turnaround the slowing economy. The FIIs were reported net buyers to the tune of Rs. 843.5 bn over Jan-Sept 2014. However, it should be noted that though healthy, the FII buying has moderated over the last three to four months (Rs. 109 bn in June; Rs. 114 bn in July; Rs. 64.4 bn in Aug; Rs. 56.1 bn in Sept, compared to Rs. 165 bn in May 2014).
With the two major events viz; Elections & Budget already over, we feel the focus would now shift to fundamentals and execution. In the near term FII flows could moderate
FII flows could moderate in near term because of ongoing geopolitical tensions & fears of interest rate hike in US
Q1FY15 results were good, focus would now shit to Q2FY15 earnings

Retail Research
20
further on the back of ongoing geopolitical tensions, no positive surprises expected in Q2 results, and lack of major positive events on the local bourses. Fears of rise in the interest rates in 2015 could also slow down the fresh fund inflows from FIIs and could result in some outflows in near term. However, the moderation in flows could be temporary (for a few months). If the government delivers on its promises and the economy growth picks up pace, the FII flows could pick up again and remain healthy.
The USD index, the gauge that measures the strength of the US currency against a basket of major units, has bounced back near the new four-year high. Investors have now realized that a rise in interest rate by US fed will create surplus demand for dollar and other solid assets. In the past few months, US Dollar (DXY) index has strengthened around ~7% to 85.9 levels (as on Sept 30, 2014) since April 01, 2014. This has been primarily because of the diverging trend in the US Federal Reserve vis-à-vis European Central Bank (ECB). While the Fed is likely to move towards neutrality, the renewed risk of fading recovery in the Euro zone (EZ) has forced ECB to move towards further easing. Consequently, Euro has fallen 3.5% against USD. Japanese Yen has depreciated by 5.1% vs. USD index. This trend is likely to be reinforced further, as the Fed’s move towards neutrality becomes more apparent. Apart from developed market currencies, USD index has also strengthened significantly against the many emerging market currencies like Malaysian Ringgit (3.6%), Indonesian Rupiah (4.1%) & Brazilian Real (up 7.5%) in September. However, Korean won and INR have shown great resilience as the appreciation of USD index vs. these emerging currencies has not yet been sharp.
However, we feel, continued strengthening of USD index could result in more & steep depreciation in INR in near term. While one may consider lower crude prices in response to strong DXY to have salubrious influence on India CAD and INR, historical assessment indicates that on net basis, INR actually weakens in response to stronger DXY. Further, if interest rate tightens in US, it could result in more outflow of funds and rupee depreciation, which could result in fall in the Indian equities.
Also it should be noted that historically, USD index and Nifty have inverse co-relation, though with a time lag. However, over the last six months, the markets have exhibited positive co-relation with USD index. This could be due to euphoric market reaction to the new government at the Centre & expectations of turnaround in economy post that. However, this trend could reverse going forward. If USD index continues to strengthen over the next few months, the Indian markets could witness a reversal and could start moving down.
Strengthening USD a threat to Indian currency & equity markets

Retail Research
21
Indian stock markets have been rallying sharply since March this year. While a large part of the rally was seen as a euphoric market reaction to the new government at the Centre, it appears that the fundamentals have played a role too in keeping the kept market sentiments buoyant. The market is partly factoring India’s transition to an economy with higher GDP growth in medium term and also, with lower cost of capital.
We believe that formation of BJP led government at the centre will meaningfully improve 'business confidence' and boost investment cycle, leading to higher GDP growth in FY16 onwards. However it may take two-three quarters more for the core sectors, including capital goods and infrastructure to return to growth, assuming a pick-up in the Capex cycle. For consumer sectors, demand is expected to pick up when festive season begins.
The average earnings growth has been close to 14% in the last four quarters (Q2FY14 to Q1FY15) as against less than 5% in the four quarters preceding these (Q2FY13 to Q1FY14). That shows sustained improvement in the growth trajectory. The earnings growth in the domestic-demand driven sectors (non-export companies) also improved significantly to around 12% in Q1FY15 which is way higher than the growth trend of low single digits in the past ten quarters.
In light of the subdued earnings growth over the past couple of years, we believe the 16- 17% EPS growth forecast is achievable over the next couple of years. This is based on the premise that inflation will subside, resulting in increase in real incomes, improved
Markets to consolidate / correct in near term before the next uptrend begins
Retail Research
22
investor confidence post the general election and global recovery. However, lower global growth could play spoilsport.
Economic reforms are India’s only hope for higher GDP growth in the medium term. India has limited fiscal or monetary options currently given its macroeconomic challenges. Economic reforms can propel earnings in a few sectors in the short term and evidence of fiscal consolidation and structural reforms may finally encourage the RBI to reduce policy rates, which can lead to a re-rating of the market. We expect these events to play out over the next 2-3 quarters.
While the medium to long term trend of the market remains bullish, the absence of any fresh positive triggers on the local bourses in the near term, increasing geopolitical tensions (like Ukraine Crisis, US-Syria, unrest in Hong Kong, etc) and fear of interest rate hikes in US in the next few months could result in some consolidation / correction in the Indian equity markets in the near term. We expect the BSE Sensex to trade in the range of 25800-27300. Probability of the markets breaking above the higher range is less in the month of October, unless there is a big positive trigger like upgrade of GDP estimates, earnings upgrades or the geopolitical tensions ease drastically (looks unlikely in the near term).
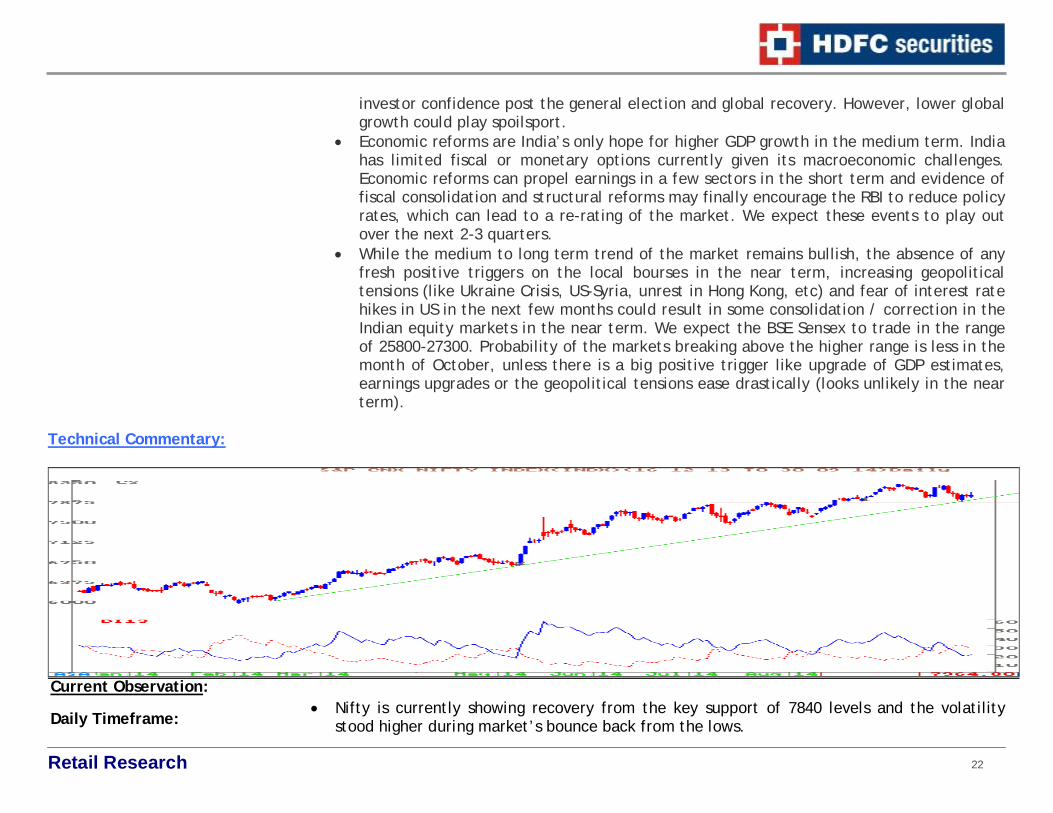
Technical Commentary:
Nifty is currently showing recovery from the key support of 7840 levels and the volatility stood higher during market’s bounce back from the lows.
Current Observation: Daily Timeframe:

Retail Research
23
The key event of RBI’s mid quarter policy review triggered fresh intraday buying but Nifty was not be able to break above the hurdles of around 8030.
The formation of minor negative sequence of lower tops and bottoms is on its way as per daily timeframe and recently Nifty has formed a lower bottom around 7841-26th Sept. The larger degree of higher tops and bottoms is still intact and Nifty is currently taking support of intermediate trend line (green line, which is drawn from the low of 5984-14th Feb).
This suggests strength of uptrend as per larger timeframe and minor weakness as per smaller timeframe. The strength of larger timeframe always has influence on the weakness of smaller timeframe, hence one may expect Nifty to hold the lower levels support around 7850 levels for near term.
The daily momentum oscillator like RSI is placed near its lower bullish range around 40 levels and daily positive swing indicator like -DMI is forming lower lows (as compared to previous +DMI peak). This signals the recent decline of Nifty has not damaged the strength of momentum oscillators and this could be viewed as positive for the underlying trend.
Nifty as per weekly timeframe is showing declines in the last three weeks, but the buying is
emerging from the lower levels. Weekly Timeframe:

Retail Research
24
The intermediate support of ascending trend line (brown line which is connected from the lower levels of 5933-early Feb 14) is intact and Nifty is showing recovery from near that trend line area.
Though Nifty has declined in the last three weeks after forming a high of around 8180 levels, there is absence of the formation of important bearish top reversal pattern.
The support of ascending trend line as per weekly timeframe is likely to offer support for falling swing of Nifty.
Weekly momentum oscillator like RSI is now placed around 66 levels. The key area of 60 has been holding up nicely during previous higher bottom formations of Nifty and as long as weekly RSI stays above 60 levels, there is a possibility of bounce back in RSI/Nifty as per larger timeframe in near term.
Nifty Monthly timeframe
After a continuous up move in the last four months, Nifty is showing high wave type candle pattern for the month of Sept, which is suggesting a tiring or breather type pattern. This pattern could pause the underlying uptrend for the time being, but this could be viewed as a top reversal pattern only when the Nifty moves below 7629.
During sharp uptrend (faster up moves), the formation of such type of candle patterns are likely and it more often results in a pause of the underlying trend and the underlying continuous its trend after a minor intra month consolidation or minor declines, before resuming its main trend.
Monthly Timeframe

Retail Research
25
Monthly momentum oscillator like 14 month RSI has been consolidating around 76 levels. From here, monthly RSI could decline down to 65-60 levels. This decline could have a minor negative impact on the price of Nifty, but RSI could itself turn down sharply.
In the last 6-7 months, Nifty is continuously moving up and there is a possibility of the formation of a new higher bottom by showing minor declines as per monthly timeframe chart. This possible higher bottom process could attract buying interest from the lower levels.
The detailed study of smaller to larger timeframe is signaling a larger degree of consolidation for Nifty for the next one month. At the beginning of October month we could possibly see a bounce back in Nifty up to the highs of 8065/8160 levels, before showing fresh corrections from the highs.
Having formed a tiring type candlestick pattern in last month as per monthly chart, we are likely to see decline in the market from the highs, but unlikely to see any down trend/sharp declines as per larger degree unless the Nifty falls below 7629. At the same time there is a possibility of emergence of strong buying interest from the lower levels.
The crucial lower levels supports for Nifty for the next one month is placed around 7629 levels (below 7850 levels) and any upside bounce is expected to halt around 8160-80 levels. This suggests larger consolidation range is ahead for the market between 8200-7600 levels over the next one month.
Learning Technical Analysis New algorithmic traders practising at the retail level may question whether it is still possible
to compete with the large institutional quant funds. Due to the nature of the institutional regulatory environment, the organisational structure and a need to maintain investor relations, funds suffer from certain disadvantages that do not affect the retail algorithmic traders.
The capital and regulatory constraints imposed on funds lead to certain predictable behaviours, which can be exploited by a retail trader. "Big money" moves the markets, and as such one can dream up many strategies to take advantage of such movements.
Trading Advantages/disadvantages enjoyed by the retail algorithmic trader over many larger funds are mentioned below.
Capacity - A retail trader has greater freedom to play in smaller markets. They can generate significant returns in these spaces, even while institutional funds can't.
Summing Up
Can the Retail Algorithmic Trader compete with the large Quant Funds

Retail Research
26
Crowding the trade - Funds suffer from "technology transfer", as staff turnover can be high. Non-Disclosure Agreements and Non-Compete Agreements mitigate the issue, but it still leads to many quant funds "chasing the same trade". Retail traders are not constrained to follow the same strategies and so can remain uncorrelated to the larger funds.
Market impact - When playing in highly liquid, non-OTC markets, the low capital base of retail accounts reduces market impact substantially.
Leverage - A large quant fund, depending upon their legal setup, is constrained by margin/leverage regulations. Private investment funds do not suffer from the same disadvantage, although they are equally constrained from a risk management perspective.
Risk Management - Retail Algo traders often take a different approach to risk management than the larger quant funds. It is often advantageous to be "small and nimble" in the context of risk.
Crucially, there is no risk management budget imposed on the retail trader beyond that which they impose themselves, nor is there a compliance or risk management department enforcing oversight. This allows the retail trader to deploy custom or preferred risk modelling methodologies, without the need to follow "industry standards". However, this flexibility can lead to retail traders to becoming "sloppy" with risk management.
Investor Relations - As the retail trader is independent, he need not concern himself with outside investors who drive the larger quant funds. The outside investors drive all manner of incentives for the larger fund - issues which the retail trader need not concern themselves with.
Compensation structure - In the retail environment the trader is concerned only with absolute return. Retail traders are also able to suffer more volatile equity curves since nobody is watching their performance who might be capable of redeeming capital from their fund.
Regulations and reporting - Beyond taxation there is little in the way of regulatory reporting constraints for the retail trader. Further, there is no need to provide monthly performance reports or "dress up" a portfolio prior to a client newsletter being sent. This is a big time-saver.
Benchmark comparison - Funds are not only compared with their peers, but also "industry benchmarks". For a long-only India equities fund, investors will want to see returns in excess of the Sensex/Nifty. Retail traders are not enforced in the same way to compare their strategies to a benchmark.

Retail Research
27
Performance fees - The downside to being a retail trader are the lack of management and performance fees enjoyed by the successful quant funds.
Technology - One area where the retail trader is at a significant disadvantage is in the choice of technology for the trading system. Using the best technology is expensive in terms of time, capital or both. The retail trader must pay for this out of trading profits as there are no management fees to cover expenses.
In conclusion, it can be seen that retail traders possess significant comparative advantages over the larger quant funds. Potentially, there are many ways in which these advantages can be exploited.
Derivatives Commentary:
The month of Sept 2014 saw the Nifty scaling new life highs to touch a high of 8180 before sliding lower in the later part of the month. The Nifty lost 1.44% during the Sept series.
In the F&O space, the FIIs were net sellers in the Index Futures segment of Rs.3717 cr (vs net buyers of Rs.1338 cr in August 2014) with flat open interest. In the index Options segment, the FIIs were large net buyers of Rs.15705 cr (vs net buyers of Rs.11062 cr in Aug 2014), which was accompanied with a rise in open interest. In the Stock Futures segment, FIIs were large net sellers, while open interest fell over August.
The Oct 2014 series has started on a heavier note compared to the previous series. In terms of value, the Oct 2014 series has begun with market wide OI at Rs.68,088crs. Vs.

Retail Research
28
Rs.66,400crs. at the beginning of the Sept 2014 series. It was Rs.64,100crs. at the beginning of the Aug 2014 series. This increase in OI indicates that traders have become more aggressive despite the recent correction in the markets.
Looking at the rollover data, we observe that Nifty rollover figures were marginally higher at 72% Vs. the three month average of 71%. Market wide rollover was at 79% which is in line with its three month average.
The build up of short rollovers due to the decline in prices towards expiry and the absence of any substantial rise in rollover suggests that sentiment has turned uncertain after the Government’s decision to defer gas price increase and the Supreme Court’s verdict to scrap coal blocks.
Sectorally, defensives like IT, Pharma and FMCG saw long rolls while Banking, Power, Metal and select mid cap stocks saw short rollovers.
Coming to stock specific action, shorts rollovers were seen in SBI, Axis bank, ICICI Bank, NMDC, Sesa Sterlite, Jindal Steel, Hindalco, Powergrid and Tata Power.
Reflecting the declining volatility expectations, the Nifty IV has dipped to 12.89% at the start of the Oct series from 13.56% at the beginning of the Sept series. The Nifty OI PCR rose to 0.85 at the start of the Oct series from 0.79 at the start of the Sept series. The rise in the OI PCR indicates a greater buildup of puts in the market.
Technically, the Nifty is now in a short term downtrend after breaking the crucial supports of 7925.
Index option activity is suggesting a trading range of 7800-8200 in the near term. This is because the maximum Call OI is currently being seen in the 8100-8200 strikes indicating this is the maximum expected upside for the Nifty in the near term. In the put segment, maximum OI is currently being seen in the 7900-7800 puts, suggesting this is the maximum risk on the downside for the near term.

Retail Research
29
The call backspread (reverse call ratio spread) is a bullish strategy in options trading that involves selling a number of call options and buying more call options of the same underlying stock and expiration date at a higher strike price. It is an unlimited profit, limited risk options trading strategy that is taken when the options trader thinks that the underlying stock will experience significant upside movement in the near term.
When to use: Normally entered when market is near bottom and shows signs of increasing activity, with greater probability to upside.
Profit: Maximum Profit = Unlimited Profit Achieved When Price of Underlying >= 2 x Strike Price of Long Call - Strike Price of
Short Call +/- Net Premium Paid/Received Profit = Price of Underlying - Strike Price of Long Call - Max Loss
Loss: Max Loss = Strike Price of Long Call - Strike Price of Short Call +/- Net Premium
Paid/Received + Commissions Paid Max Loss Occurs When Strike Price of Long Call
Breakeven: Upper Breakeven Point = Strike Price of Long Call + Points of Maximum Loss Lower Breakeven Point = Strike Price of Short Call
Learning Derivatives Analysis Call Ratio Backspread
Sell 1 ITM Call Buy 2 OTM Calls

Retail Research
30
The put backspread (reverse put ratio spread) is a bearish strategy in options trading that involves selling a number of put options and buying more put options of the same underlying stock and expiration date at a lower strike price. It is an unlimited profit, limited risk options trading strategy that is taken when the options trader thinks that the underlying stock will experience significant downside movement in the near term.
When to use: Normally entered when market is near top and shows signs of increasing activity, with greater probability to downside (for example, if last major move was up, followed by stagnation).
Profit: Maximum Profit = Unlimited Profit Achieved When Price of Underlying < 2 x Strike Price of Long Put - Strike Price of Short
Put + Net Premium Received Profit = Strike Price of Long Put - Price of Underlying - Max Loss
Loss: Max Loss = Strike Price of Short Put - Strike Price of Long Put - Net Premium Received +
Commissions Paid Max Loss Occurs When Price of Underlying = Strike Price of Long Put
Breakeven: Upper Breakeven Point = Strike Price of Short Put Lower Breakeven Point = Strike Price of Long Put - Points of Maximum Loss
Sell 1 ITM Put Buy 2 OTM Puts
Put Ratio Backspread

Retail Research
31
Extract of Calls during September 2014
Index Futures Calls
Date B/S Trading Call Entry at Sloss Targets Exit Price / CMP Exit Date
% G/L Comments
Time Horizon
Avg. Entry
Abs. Gain/Loss
25-Sep-14 B Nifty 8022.0 7985.0 8200.0 7985.0 25-Sep-14 -0.5 Stop Loss Triggered 1-5 Days 8022.0 -37
24-Sep-14 S Short Nifty Oct Fut 8063.6 8100.0 7980.0 8016.2 24-Sep-14 0.6 Premature Profit Booked 1-5 days 8063.6 47.35
17-Sep-14 B Nifty Future 7970.5 7939.0 8060.0 8060.0 18-Sep-14 1.1 Target Achieved 2-3 days 7970.5 89.5
12-Sep-14 B Bank Nifty Sept Fut 16318.0 16245.0 16450.0 16245.0 15-Sep-14 -0.4 Stoploss Trigg. 2-3Days 16318.0 -73
10-Sep-14 B Nifty Future 8107.3 8074.0 8160.0 8139.4 10-Sep-14 0.4 Premature Profit Booked 2-3 days 8107.3 32.1
4-Sep-14 S Nifty Sept Fut 8110.0 8145.0 8050.0 8145.0 5-Sep-14 -0.4 Stop Loss Triggered 2-3Days 8110.0 -35
4-Sep-14 S Nifty Sept Fut 8112.4 8157.0 8000.0 8096.7 4-Sep-14 0.2 Premature Profit Booked 1-5 days 8112.4 15.65
Stock and Nifty Options Calls
Date B/S Trading Call Entry at Sloss Targets Exit Price / CMP Exit Date % G/L Comments
Time Horizon
Avg. Entry
Abs. Gain/Loss
30-Sep-14 B Yes Bank 540 Put 10.3 6.9 22.0 14.6 30-Sep-14 41.3 Premature Profit Booked 1-5 Days 10.3 4.25
26-Sep-14 B SSLT 270 Put Oct 9.6 5.9 18.0 8.5 29-Sep-14 -11.5 Premature Exit 3-5 Days 9.6 -1.1
23-Sep-14 B Hindalco 160 Put Oct 7.4 3.9 14.0 10.6 24-Sep-14 43.5 Premature Profit Booked 3-5 Days 7.35 3.2
19-Sep-14 B Tata Global 170 Call 2.6 1.4 5.5 5.5 19-Sep-14 111.5 Target Achieved 2-3 days 2.6 2.9
16-Sep-14 B KTK Bank 125 Put Sept 1.8 0.9 3.5 2.8 16-Sep-14 60.0 Premature Profit Booked 3-5 Days 1.75 1.75
9-Sep-14 B Bank of Baroda Sept 900 Calls 30.0 21.0 50.0 22.4 10-Sep-14 -25.3 Premature Exit 1-5 days 30 -7.6
4-Sep-14 B Apollo Tyres 180 Put 5.1 2.8 10.0 3.9 4-Sep-14 -24.5 Exit 2-3 days 5.1 -1.25
1-Sep-14 B Tata Motors 520 Put Sept 13.8 6.5 25.0 17.7 2-Sep-14 28.3 Premature Profit Booked 3-5 Days 13.8 3.9 Update of Trading BTST / STBT/ Future Calls
Date B/S Trading Call Entry at Sloss Targets Exit Price / CMP Exit Date
% G/L Comments
Time Horizon
Avg. Entry
Abs. Gain/Loss
30-Sep-14 B Colgate Palm 1694 1640 1750 1727.3 30-Sep-14 2.0 Premature Profit Booked 3-7 days 1694 33.25
29-Sep-14 B Heliosmath 108, 113.85 106 126 121.5 29-Sep-14 6.7 Premature Profit Booked 2-3 days 113.85 7.65
25-Sep-14 B Nuclues Software 235.95 226 255 226.0 26-Sep-14 -4.2 Stop Loss Triggered 2-3 days 235.95 -9.95
22-Sep-14 B Sobha Developers 439.5 419.5 485 432.6 23-Sep-14 -1.6 Premature Exit 3-5Days 439.5 -6.95
19-Sep-14 B Hubtown 125 117 138 132.5 19-Sep-14 6.0 Premature Profit Booked 3-5Days 125 7.5
18-Sep-14 B Zee Learn 35.5, 37.2 34.45 42 39.8 18-Sep-14 7.0 Premature Profit Booked 2-3 days 37.2 2.6
12-Sep-14 B Delta Corp 94, 95.55 92 105 92.0 16-Sep-14 -2.9 Stop Loss Triggered 2-3 days 94.75 -2.75
10-Sep-14 B U Flex 161.95 157 172 166.4 11-Sep-14 2.7 Premature Profit Booked 2-3 days 161.95 4.45

Retail Research
32
8-Sep-14 B Siemens 865.55 825 940 901.5 9-Sep-14 4.1 Premature Profit Booked 3-5Days 865.55 35.9
5-Sep-14 B Asian Paints 640.1 620 680 680.0 8-Sep-14 6.2 Target Achieved 5-10 days 640.1 39.9
4-Sep-14 B Wabco India 3810 3700 4200 3931.6 4-Sep-14 3.2 Premature Profit Booked 3-7 days 3810 121.55
2-Sep-14 B IVRCL Infra 19.25 18.1 25 19.7 3-Sep-14 2.3 Premature Profit Booked 5-10 days 19.25 0.45
1-Sep-14 B Seamec Ltd 146.5 139 170 152.8 1-Sep-14 4.3 Premature Profit Booked 2-3 days 146.5 6.3 Positional Calls
Date B/S Trading Call Entry at Sloss Targets Exit Price / CMP Exit Date
% G/L Comments
Time Horizon
Avg. Entry
Abs. Gain/Loss
29-Sep-14 B IBReal 74.4 70.9 82 70.9 30-Sep-14 -4.7 Stop Loss Triggered 5-7 Days 74.4
24-Sep-14 S PNB Oct Fut. 945.25 - 965 995 840 878.5 25-Sep-14 7.6 Premature Profit Booked 2 Weeks 945.25 66.75
18-Sep-14 B HCL Insys 78.8 - 76.5 74.5 90 85.7 19-Sep-14 8.7 Premature Profit Booked 2 - 3 Weeks 78.8 6.85
17-Sep-14 B Manaapuram 28.5 - 27.5 26.3 35 31.3 18-Sep-14 9.6 Premature Profit Booked 3-14 days 28.5 2.75
9-Sep-14 B Aries Agro 102 - 98 94 120 110.9 9-Sep-14 8.7 Premature Profit Booked 3-10 days 102 8.9
8-Sep-14 B KPIT 159.8 150.5 182 165.3 11-Sep-14 3.4 Premature Profit Booked 1 Week 159.8 5.45
8-Sep-14 B BF Utilities 645.95 600 750 676.4 16-Sep-14 4.7 Premature Profit Booked 5-10 days 645.95 30.45
8-Sep-14 B All Cargo 256 240 320 241.0 15-Sep-14 -5.9 Exit Called 5-10 days 256 -15
2-Sep-14 B GE Shipping 393 365 500 416.6 10-Sep-14 6.0 Premature Profit Booked 40-75 days 393 23.55
25-Aug-14 B USHER Agro 43.5 - 41.5 40 55 50.0 10-Sep-14 14.9 Premature Profit Booked 3-10 days 43.5 6.5
25-Aug-14 B HCC 39.3 36 46 42.1 3-Sep-14 7.1 Premature Profit Booked 5-10 days 39.3 2.8
22-Aug-14 B Ktk Bank 129.5 122.5 145 132.9 5-Sep-14 2.6 Premature Profit Booked 5-10 days 129.5 3.4

Retail Research
33
Gainers & Losers – September 2014
Price Price % chg 29-Aug-14 30-Sep-14
MRF 24030.95 32681.95 36.00
HEXAWARE 159.90 201.15 25.80
APOLLOTYRE 165.30 203.75 23.26
EICHERMOT 9755.95 11972.00 22.71
TVSMOTOR 186.50 227.95 22.23
CIPLA 514.20 626.80 21.90
AUROPHARMA 817.55 968.25 18.43
DIVISLAB 1564.75 1800.35 15.06
ZEEL 273.70 314.15 14.78
COLPAL 1536.10 1742.55 13.44
Price Price % chg 29-Aug-14 30-Sep-14
JPASSOCIAT 46.50 26.45 -43.12
GMRINFRA 25.35 17.55 -30.77
JINDALSTEL 233.00 172.80 -25.84
IDBI 75.95 60.85 -19.88
BHEL 240.90 200.45 -16.79
BANKINDIA 277.45 232.00 -16.38
RELINFRA 699.30 585.45 -16.28
DLF 177.30 150.85 -14.92
RCOM 116.00 99.00 -14.66
SAIL 81.05 69.60 -14.13
Price Price % chg 29-Aug-14 30-Sep-14
JKTYRE 276.45 489.20 76.96
GSFC 67.50 114.55 69.70
NBCC 422.40 688.40 62.97
MASTEK 190.30 291.35 53.10
HFCL 13.40 19.90 48.51
MANGCHEFER 68.75 98.10 42.69
IBPOW 9.05 12.90 42.54
SUNDARMFIN 934.50 1304.80 39.63
ZENSARTECH 444.30 615.85 38.61
WELSPUNIND 217.80 300.20 37.83
Price Price % chg 29-Aug-14 30-Sep-14
JPASSOCIAT 46.50 26.45 -43.12
USHAMART 40.30 23.30 -42.18
SUZLON 21.55 12.90 -40.14
MONNETISPA 113.10 77.60 -31.39
GMRINFRA 25.35 17.55 -30.77
BALRAMCHIN 71.95 50.00 -30.51
IMFA 353.95 249.95 -29.38
JPINFRATEC 31.60 22.55 -28.64
JINDALSTEL 233.00 172.80 -25.84
GVKPIL 13.65 10.15 -25.64
Top Gainers From F&O Top Losers From F&O Top Gainers From CNX 500
Top Losers From CNX 500
RETAIL RESEARCH Tel: (022) 3075 3400 Fax: (022) 2496 5066 Corporate Office HDFC securities Limited, I Think Techno Campus, Building - B, "Alpha", Office Floor 8, Near Kanjurmarg Station, Opp. Crompton Greaves, Kanjurmarg (East), Mumbai 400 042 Phone: (022) 3075 3400 Fax: (022) 2496 5066 Website: www.hdfcsec.com Email: [email protected] Disclaimer: This document has been prepared by HDFC securities Limited and is meant for sole use by the recipient and not for circulation. This document is not to be reported or copied or made available to others. It should not be considered to be taken as an offer to sell or a solicitation to buy any security. The information contained herein is from sources believed reliable. We do not represent that it is accurate or complete and it should not be relied upon as such. We may have from time to time positions or options on, and buy and sell securities referred to herein. We may from time to time solicit from, or perform investment banking, or other services for, any company mentioned in this document. This report is intended for non-Institutional Clients only.


