30 Reference Strain (percent) - ACI Foundation
103
CHARLES PANKOW FOUNDATION RGA 04-13 Determination of Yield Strength for Nonprestressed Steel Reinforcement Final Report December 31, 2013 WJE No. 2013.4171 Prepared for: Mr. Mark Perniconi Executive Director Charles Pankow Foundation PO Box 820631 Vancouver, Washington 98682 Prepared by: Wiss, Janney, Elstner Associates, Inc. 225 South Lake Avenue, Suite 1260 Pasadena, California 91101 626.696.4650 tel | 626.696.4699 fax 0 15 30 45 60 75 90 105 0.0 0.1 0.2 0.3 0.4 0.5 0.6 0.7 0.8 0.9 1.0 Stress (ksi) Reference Strain (percent) 0.5% EUL 0.35% EUL Grade 60 Code Assumption Normalized "Roundhouse" Stress-Strain Relationships for Grade 60 and Grade 80 Grade 80 Code Assumption
Transcript of 30 Reference Strain (percent) - ACI Foundation

CHARLES PANKOW FOUNDATION RGA 04-13 Determination of Yield Strength for Nonprestressed Steel Reinforcement
Final Report
December 31, 2013 WJE No. 2013.4171
Prepared for: Mr. Mark Perniconi Executive Director Charles Pankow Foundation PO Box 820631 Vancouver, Washington 98682
Prepared by: Wiss, Janney, Elstner Associates, Inc. 225 South Lake Avenue, Suite 1260 Pasadena, California 91101 626.696.4650 tel | 626.696.4699 fax
0
15
30
45
60
75
90
105
0.0 0.1 0.2 0.3 0.4 0.5 0.6 0.7 0.8 0.9 1.0
Str
ess
(ksi
)
Reference Strain (percent)
0.5
%E
UL
0.3
5%
EU
L
Grade 60 Code Assumption
Normalized "Roundhouse"
Stress-Strain Relationships for
Grade 60 and Grade 80
Grade 80 Code Assumption


CHARLES PANKOW FOUNDATION RGA 04-13 Determination of Yield Strength for Nonprestressed Steel Reinforcement
Jeff Rautenberg Jeff Rautenberg, Project Engineer
Scott K. Graham Scott K. Graham, Project Engineer
Conrad Paulson Conrad Paulson, Principal Investigator
Final Report
December 31, 2013 WJE No. 2013.4171
Prepared for: Mr. Mark Perniconi Executive Director Charles Pankow Foundation PO Box 820631 Vancouver, Washington 98682
Prepared by: Wiss, Janney, Elstner Associates, Inc. 225 South Lake Avenue, Suite 1260 Pasadena, California 91101 626.696.4650 tel | 626.696.4699 fax


TABLE OF CONTENTS
Executive Summary ...................................................................................................................................... 1 Purpose ................................................................................................................................................... 1 Background ............................................................................................................................................ 1 Research Methodology ........................................................................................................................... 2 Findings .................................................................................................................................................. 3 Recommendation .................................................................................................................................... 4
Introduction ................................................................................................................................................... 5 Scope of Research ......................................................................................................................................... 5 Yield Stress Measurement Methods ............................................................................................................. 6
Yield Point (Halt-of-Force Method) ....................................................................................................... 6 Offset Method ......................................................................................................................................... 7 Extension Under Load (EUL) Method ................................................................................................... 7
Historical Background .................................................................................................................................. 8 Methodology for Strength Calculations ...................................................................................................... 12
Objective .............................................................................................................................................. 12 Specified Minimum Yield Strengths .................................................................................................... 12 Yield Measurement Methods ............................................................................................................... 13 Overview of Computational Procedure ................................................................................................ 14 Member Cross-Sections and Strengths of Materials ............................................................................ 15 Code-Specified Sectional Strengths ..................................................................................................... 17
Relevant ACI 318-14 Provisions ................................................................................................... 17 Beam Strength Methodology ......................................................................................................... 17 Column Strength Methodology ...................................................................................................... 18
Reinforcement Stress-Strain Relationships .......................................................................................... 20 Characterization of Actual Relationships ...................................................................................... 20 Selection of Relationships used in Member Sectional Analysis .................................................... 22 Normalization of Relationships used in Member Strength Analysis ............................................. 22
Analytical Sectional Strengths ............................................................................................................. 27 Concrete Stress-Strain Relationships ............................................................................................. 27 Methodology for “Actual” Strength ............................................................................................... 29
Parametric Studies ...................................................................................................................................... 31 Methodology for Examination of Results ............................................................................................ 31 Results and Their Examination ............................................................................................................ 34
Beam Sections ................................................................................................................................ 34 Column Sections ............................................................................................................................ 34
Summary Discussion and Recommendations ............................................................................................. 39 Recommended Yield Measurement Method ........................................................................................ 39 Recommended Code Change ............................................................................................................... 40 Additional Considerations Related to Yield Measurement Method ..................................................... 40 Collateral Observations ........................................................................................................................ 41
Acknowledgements ..................................................................................................................................... 43 References ................................................................................................................................................... 43 Appendix A - Normalized Versus Actual Stress-Strain Curves ............................................................... A-1 Appendix B - Results of Parametric Analyses of Beam Sections ............................................................. B-1 Appendix C - Results of Parametric Analyses of Column Sections ......................................................... C-1 Appendix D - ACI 318 Code Change Submittal ....................................................................................... D-1


CHARLES PANKOW FOUNDATION RGA 04-13 Determination of Yield Strength for Nonprestressed Steel Reinforcement
This final report supersedes the working report submitted to ACI Committee 318, dated October 2, 2013.
Two substantive changes have been made. The parametric study of sectional strength has been extended
to include columns with longitudinal reinforcement ratios, , of 6 percent and 8 percent, resulting in
expanded data summary tables and appendix for results of column sectional analyses, and the appendix
for the code change submittal has been updated to reflect the final version as approved by ACI
Committee 318 on October 23, 2013. Additionally, numerous editorial improvements and corrections of
typographical errors have been made throughout the report.
EXECUTIVE SUMMARY
Purpose
The purpose of this study is to determine if it would be appropriate to change the method required by the
2011 edition of ACI 318 “Building Code Requirements for Structural Concrete (ACI 318-11)” (the ACI
Code) for measuring the yield strength of nonprestressed reinforcement without a well-defined yield
point. The present method is the extension under load method at a strain of 0.35 percent, as first required
by the 1971 edition of ACI 318, “Building Code Requirements for Reinforced Concrete (ACI 318-71).” It
is requested by the industry that the requirement be changed to the offset method at an offset strain of
0.2 percent, which is used for virtually all other forms of steel in the U.S. and for most steel reinforcement
around the world.
Background
As described in more detail in the Historical Background section of this report, the provisions in
ACI 318-11 related to determination of yield strength for nonprestressed steel reinforcement, and also the
corresponding provisions originally proposed for inclusion in ACI 318-14, remained essentially
unchanged from ACI 318-71. Historical records show that the provisions were developed in 1967 by an
ad-hoc group operating under ACI Committee 318, and when these provisions were under development, a
primary consideration was the actual stress-strain behavior of the Grade 60 and Grade 75 steel bar
reinforcement being manufactured at that time.
Since the time of ad-hoc group’s deliberations of 1967, and since the time that ACI 318-71 was issued,
significant changes have taken place in the industry that manufactures nonprestressed steel reinforcement.
The processes and sources of raw materials for manufacturing of steel bar reinforcement have evolved,
and as a result, the stress-strain behavior of steel bar reinforcement being manufactured today is different
from that of the bars manufactured in the 1960s and early 1970s. Stainless steel bars, carbon steel wires,
and stainless steel wires are now permitted by the ACI 318 Code; the stress-strain behavior of these
products can differ from that of steel bar reinforcement. Smaller-diameter steel bars can now be
packaged in coils at the steel mill; the cold working associated with coiling and subsequent straightening
can alter the stress-strain behavior of the parent material.
It is unclear whether there has been any assessment of the stress-strain behavior as new reinforcement
products were introduced to into the ACI 318 Code, or if there has been any reassessment of the stress-

Charles Pankow Foundation RGA #04-13
Determination of Yield Strength for Nonprestressed Steel Reinforcement
Final Report – December 31, 2013
Page 2
strain behavior of steel bar reinforcement as manufacturing practices changed. On this basis, therefore, it
can be argued that the ACI 318-11 Code provisions for determination of yield strength are potentially
obsolete, and that the provisions are due for reassessment.
Research Methodology
The aim of the research reported herein is to provide a reassessment of the ACI 318 Code provisions for
determination of yield strength for nonprestressed steel reinforcement having a specified yield strength
not exceeding 80,000 psi (Grade 80), giving appropriate consideration of the stress-strain behavior of
reinforcement as currently manufactured by the industry and as currently permitted for use under
ACI 318.
The reassessment examines actual stress-strain curves for straight and coiled steel bar reinforcement
conforming to the following specifications: ASTM A615 “Standard Specification for Deformed and Plain
Carbon-Steel Bars for Concrete Reinforcement” (Grades 60, 75 and 80), A706 “Standard Specification
for Low-Alloy Steel Deformed and Plain Bars for Concrete Reinforcement” (Grades 60 and 80), and
A955 “Standard Specification for Deformed and Plain Stainless-Steel Bars for Concrete Reinforcement”
(Grade 60). Actual curves are characterized as sharply-yielding or gradually-yielding, and normalized
stress-strain relationships are developed for Grade 60 and Grade 80 reinforcement, both sharply-yielding
and gradually-yielding, based on observed actual stress-strain behavior. As used here, “normalized”
means that the gradually-yielding stress-strain curve develops exactly the specified yield strength when
yield is measured according to the method being considered. A normalized, gradually-yielding
relationship is developed for each of the different yield measurement methods (0.35 percent extension
under load [EUL], 0.50 percent EUL, 0.1 percent offset, and 0.2 percent offset) as appropriate, for both
Grade 60 and Grade 80 reinforcement. The various methods for determination of yield strength are
described in detail in the body of this report. Sharply-yielding, normalized stress-strain relationships that
include realistic strain hardening (described as elastic-plastic-strain-hardening) are also developed, as are
gradually-yielding stress-strain curves with softened initial elastic modulus to represent coiled reinforcing
bars.
The various normalized stress-strain relationships for both Grade 60 and Grade 80 reinforcement are
included in a parametric study that calculates “actual” sectional strength for numerous beams and
columns using analysis described in detail in the body of this report. Beam sections included are singly-
reinforced; values for longitudinal =0 to 6 percent by 0.5 percent increments and additionally at b; and
concrete =5,000 psi and 8,000 psi. The beam studies also include the softened gradually-yielding
stress-strain relationships for coiled bars. Column sections included have longitudinal reinforcement
uniformly distributed across all faces; values for longitudinal =1, 2, 3, 4, 6 and 8 percent; square shapes
with =0.8 and rectangular shapes (2:1 aspect ratio) with =0.8; and concrete =5,000 psi, 8,000 psi, and
12,000 psi. Limited consideration is given to a rectangular column section (2:1 aspect ratio) with =0.6,
=1 and 2 percent, and =5,000 psi. The column analysis does not consider coiled reinforcement stress-
strain relationships because the common maximum size for coiled bars is No. 6, making coiled bars
unlikely to be used as longitudinal reinforcement in columns.
The parametric “actual” sectional strength calculations are based on strain compatibility and equilibrium
methods, and employ “actual” non-linear stress-strain relationships for both concrete and reinforcement.
Moment strengths, including the moment values for P-M interaction curves of columns, are established as
the maximum value extracted from the moment-curvature curve for a given section under a given axial

Charles Pankow Foundation RGA #04-13
Determination of Yield Strength for Nonprestressed Steel Reinforcement
Final Report – December 31, 2013
Page 3
load (beams assumed to have zero axial load). Results are presented graphically in the form of versus
moment (-M) curves for beams, and axial force versus moment (P-M) interaction curves for columns.
Also included in the parametric study are code-based nominal sectional strengths and design (×nominal)
sectional strengths. Nominal strengths are based on the assumptions permitted by ACI 318-14 Chapter 22
– Sectional Strength. Code-based nominal and design strengths are plotted on the same graphs as the
analytical “actual” sectional strengths for comparative purposes.
Findings
Comparisons are made between analytical “actual” section strengths, calculated using the various
gradually-yielding stress-strain relationships for reinforcement, and certain “benchmark” sectional
strengths, as follows:
Comparisons with code-calculated nominal strength indicate whether the analytical “actual” sectional
strength for a member reinforced with gradually-yielding reinforcement is weaker or stronger than the
nominal sectional strength permitted to be used in accordance with code.
Comparisons with elastic-plastic-strain-hardening analytical strength indicate whether the analytical
“actual” sectional strength loss or gain is attributable to a particular gradually-yielding stress-strain
relationship for the reinforcement.
Comparisons with code-calculated design (×nominal) strength indicate the “margin of safety”
provided by a section having reinforcement that exhibits a particular stress-strain relationship.
For beam sections, the results of practical interest are those sections having longitudinal reinforcement
ratio in the range min<<0.75b (approximately), where min is the minimum reinforcement required for
flexural sections and b is the reinforcement ratio that produces balanced strain conditions
(simultaneously reaching the tensile yield strain in the reinforcement and maximum code-permitted
compressive strain in the concrete) using nominal sectional strength calculations. For all beam sections
within this range of practical reinforcement ratios, all normalized reinforcement stress-strain relationships
for straight or coiled bars, including those stress-strain relationships normalized to the 0.2 percent offset
yield strength, provide analytical “actual” strengths that equal or exceed the corresponding code-
calculated nominal sectional strength.
Column sections of practical interest have longitudinal =1 and 2 percent, while the sections reinforced at
=4 percent and larger are heavily-reinforced and might be considered less economical. For column
sections with concrete strength =5,000 psi and 8,000 psi, for all considered values of , the majority of
the normalized gradually-yielding stress-strain relationships for reinforcement produce analytical
sectional strengths that are at least 99 percent of the corresponding code-calculated nominal sectional
strengths. In cases where the gradually-yielding stress-strain relationships produce analytical strengths
lower than code-calculated nominal strengths, the “worst case” (across all concrete strengths) for
relationships normalized to the 0.2 percent offset yield strength is with a limited number of columns
having =6 and 8 percent, which produce an analytical strength equal to 93 percent of code-calculated
nominal strength. Examination of the P-M interaction curves for these cases reveals that these instances
occur in the column behavior regime where the strength reduction factor, , is compression-controlled,
resulting in =0.65 (for tied columns).
For column sections with concrete strength =12,000 psi, however, the code-calculated nominal
strengths always exceed the analytical “actual” strengths, regardless of the reinforcement stress-strain

Charles Pankow Foundation RGA #04-13
Determination of Yield Strength for Nonprestressed Steel Reinforcement
Final Report – December 31, 2013
Page 4
relationship being considered. More practical column sections at =12,000 psi with =1 and 2 percent
have analytical strengths not less than 97 percent of code nominal strength, for the gradually-yielding
stress-strain relationship normalized to the 0.2 percent offset yield strength. The “worst case” for
=12,000 psi with reinforcement stress-strain relationships normalized to the 0.2 percent offset yield
strength is also with some columns having =6 and 8 percent, which again produce an analytical strength
equal to 93 percent of code-calculated nominal strength.
Comparisons to sectional strengths provided by elastic-plastic-strain-hardening stress-strain relationships
for reinforcement are also useful. The 0.2 percent offset gradually-yielding relationships provide sectional
strengths that range from 92 to 100 percent of the sectional strength provided by the elastic-plastic-strain-
hardening stress-strain relationships. The “worst case” ratio of 92 percent involves a single instance of a
square column with the highest permissible reinforcement ratio of =8 percent, concrete with
=5,000 psi, and reinforcement with fy=60,000 psi. More practical column sections with =1 and
2 percent have analytical strengths based on a 0.2 percent offset gradually-yielding relationship that are
not less than 95 percent of that provided by the elastic-plastic-strain-hardening stress-strain relationship.
Again, these relative strength reductions occur in the column behavior regime where the strength
reduction factor, , is compression-controlled, resulting in =0.65 (for tied columns).
An important additional consideration for columns is the likelihood of using reinforcement with a
gradually-yielding stress-strain curve in an actual reinforced concrete column. To assess this likelihood,
stress-strain curves were reviewed from reinforcing bar tensile tests performed under consistent research
laboratory conditions (such as load rate, instrumentation, and operator qualification) at the WJE
laboratories between 2003 and 2013. Approximately 200 samples of ASTM A615 and A706
reinforcement (including Grades 60, 75 and 80) were reviewed. Less than 2 percent of all samples
exhibited gradually-yielding stress-strain curves. Coiled reinforcement is not considered in this estimate
because the common maximum size of coiled bar is No. 6, and so they are unlikely to be used for column
longitudinal reinforcement.
As summarized above, only heavily-reinforced sections with =6 percent and larger are found to have
analytical “actual” strengths as low as 93 percent of code nominal strength when reinforced with
gradually-yielding reinforcement. Considering that columns with such high reinforcement ratios are only
very rarely used and that gradually-yielding reinforcement represents at most a few percent of A615 and
A706 bars found in columns, there is only a very small likelihood, probably well less than 1 percent, that
the “actual” shortfall in column strength will be as high as 7 percent when the yield strength of the
reinforcement exactly equals the specified value. Because the code-specified -factor for these sections is
0.65 and because the actual average yield strength of reinforcement ranges from 1.06 to 1.14 times the
specified yield strength (depending upon the grade of reinforcement), the columns will have an ample
margin of safety.
Recommendation
On this basis, therefore, it was recommended in code change Submittal CB006 (described later in this
report) that the yield measurement method specified by the ACI 318-14 Code for gradually-yielding
nonprestressed steel reinforcement become the offset method using an offset of 0.2 percent. Based on the
research reported herein, the change does not adversely affect the structural safety of reinforced concrete
sections. On October 23, 2013, ACI Committee 318 approved code change Submittal CB006.

Charles Pankow Foundation RGA #04-13
Determination of Yield Strength for Nonprestressed Steel Reinforcement
Final Report – December 31, 2013
Page 5
INTRODUCTION
The goal of this study is to determine if it would be appropriate to change the method specified by the
ACI Code for measuring the yield strength of nonprestressed reinforcement without a well-defined yield
point. The present method is the extension under load method at a strain of 0.35 percent, as first required
by the 1971 edition of the ACI Code (ACI 318-71). The change of yield measurement method is in part
prompted at the request of the industry that manufactures steel bar reinforcement, who ask that the
requirement be changed to the offset method at an offset strain of 0.2 percent. The 0.2 percent offset
method is used for virtually all other forms of steel products in the U.S. and for most steel bar
reinforcement around the world. The change will allow for a more consistent determination of yield
strength in reinforcement, and will encourage the use of modern measurement methods in testing
laboratories and steel mills. The request is based in part on the roundhouse nature of the stress-strain
curves of coiled bars and of some higher-grade reinforcing steels. The change would align the ACI Code
with common industry practice.
SCOPE OF RESEARCH
The purpose of this research is to revise outdated methods for determination of yield strength of modern
nonprestressed steel reinforcement. Specifically, the research is focused on the proposed provisions of
ACI 318-14 related to the determination of yield strength for the different types of nonprestressed steel
reinforcement. The objectives are to assess the influence that the method of determination of yield
strength may have on the strength of reinforced concrete members and to formulate recommended
changes to update ACI 318-14 Code provisions as justified by the outcome of the research. The
following tasks are performed:
1. Yield strength determination methodologies are summarized for nonprestressed steel reinforcement as
specified in various editions of ACI 318 and the related ASTM specifications for steel reinforcement
as referenced by ACI 318, for the period of time from the 1960s to the present (2013).
2. The research considers actual stress-strain curves for nonprestressed steel reinforcement that were
readily obtained from the public domain, from within WJE, and from the reinforcement
manufacturing industry, as coordinated by the Concrete Reinforcing Steel Institute (CRSI). The
stress-strain curves were reviewed and categorized. For types of reinforcement where stress-strain
relationships could not be readily obtained, judgment is exercised regarding stress-strain relationships
assumed for such reinforcement.
3. Based on the general shapes of the actual stress-strain curves obtained in Task 2, normalized stress-
strain relationships are developed for the types of reinforcement considered. The yield strength
definitions (measurement methods) that are examined include the 0.1 percent offset and 0.2 percent
offset methods for all grades of reinforcement. Following the provisions of ACI 318-08, the
0.35 percent extension under load (EUL) method is considered for reinforcement with specified yield
strength greater than 60,000 psi, and the 0.5 percent EUL method is considered for reinforcement
with lesser specified yield strengths. As used here, “normalized” means that the gradually-yielding
stress-strain curve develops exactly the specified yield strength when yield is measured according to
the method being considered. The various methods for determination of yield strength are described
in detail in the next chapter of this report.
4. A limited number of representative reinforced concrete sections for flexural (beam and slab) and
compression (beam-column) sections are established. The sectional geometries, longitudinal
reinforcement distribution, and materials strengths considered are described later in this report. These
sections are used to parametrically study nominal sectional strengths under the provisions of
ACI 318-14 Chapter 22 – Sectional Strength.

Charles Pankow Foundation RGA #04-13
Determination of Yield Strength for Nonprestressed Steel Reinforcement
Final Report – December 31, 2013
Page 6
5. For the same representative sections considered for Task 4, analytical “actual” sectional strengths are
parametrically studied by analysis. The analytical calculation methods incorporate the various
gradually-yielding stress-strain relationships for reinforcement as developed under Task 3, and
nonlinear stress-strain behavior for concrete as described later in this report. The analytical “actual”
sectional strengths are compared to the code-based strengths calculated in Task 4. It is possible to
identify both strength gains and strength loses that can be attributed to gradually-yielding stress-strain
relationships.
6. A proposed ACI 318 Code Change Proposal, with suggested revisions for both the Code and its
Commentary, has been prepared. The change recommendations pertain to the determination of yield
strength as specified by ACI 318 for nonprestressed steel reinforcement. The findings of the research
reported herein provide the technical basis for the proposed change.
7. On the basis of the yield determination methodology recommended under Task 6, opinions are
formulated regarding the following related matters:
a. What percentages of steel bar reinforcement are likely to exhibit “sharply-yielding” stress-strain
behavior versus “gradually-yielding behavior?”
b. What is the likely effect on yield strengths reported by certified mill test reports?
c. What is the likely effect on the yield strength statistics for nonprestressed reinforcement as used
for the most recent reliability calibration of the ACI 318 Code?
Because ACI 318 currently limits most nonprestressed steel reinforcement to specified minimum yield
strengths not exceeding 80,000 psi, the reinforcement yield strength considered in this research is also
similarly limited. Steel reinforcement with specified minimum yield strengths exceeding 80,000 psi is not
considered because the use of such reinforcement is severely restricted by current ACI 318 Code
provisions.
An examination of serviceability concerns is not included because the intent of this research is to study
only reinforcement yield strengths that are currently recognized by the ACI 318 Code as noted
immediately above. On this basis, it is assumed that the ACI Code already adequately captures
serviceability concerns for currently-recognized reinforcement, and therefore it is also assumed that
methodology of yield strength determination will have negligible effect on present serviceability
provisions in the Code.
YIELD STRESS MEASUREMENT METHODS
Yield stress is typically taken as either the yield point for materials that are sharply yielding, such as that
represented by the stress-strain curve of Figure 1a, or as the yield strength for materials that are more
gradually yielding, such as those represented by the stress-strain curves of Figure 1b and Figure 1c. The
following descriptions of methods for measuring yield point and yield strength are taken from
ASTM A370-11 “Standard Test Methods and Definitions for Mechanical Testing of Steel Products” and
ASTM E8-11 “Standard Test Methods for Tension Testing of Metallic Materials.”
The proposed ACI 318-14 does not necessarily use the terms yield stress, yield point and yield strength in
precisely the same manner as do the ASTM specifications.
Yield Point (Halt-of-Force Method)
The yield point is the first stress in a material, less than the maximum obtainable stress, at which an
increase in strain occurs without an increase in stress. The stress-strain diagram is characterized by a

Charles Pankow Foundation RGA #04-13
Determination of Yield Strength for Nonprestressed Steel Reinforcement
Final Report – December 31, 2013
Page 7
sharp knee or discontinuity; refer to Figure 1a. The yield point of a sharply-yielding material can be
determined by one of the following methods:
Halt-of-the-Force Method: Apply an increasing force to the specimen at a uniform deformation rate.
When the force hesitates, record the corresponding stress as the upper yield strength. (The Halt-of-the-
Force Method was formerly known as the Halt-of-the-Pointer Method, the Drop-of-the-Beam Method,
and the Halt-of-the-Load Method.)
Autographic Diagram Method: When a sharp-kneed stress-strain diagram is obtained by an autographic
recording device, take the stress corresponding to the top of the knee, Ry in Figure 1a, or the stress at
which the curve drops as the yield point.
Offset Method
Offset Method: Yield strength is the stress at which a material exhibits a specified limiting deviation from
the proportionality of stress to strain. To determine the yield strength by the “offset method,” it is
necessary to secure data (autographic or numerical) from which a stress-strain diagram with a distinct
modulus characteristic of the material being tested may be drawn. Then on the stress-strain diagram,
Figure 1b, lay off Om equal to the specified value of the offset, draw mn parallel to OA, and thus locate
point r, the intersection of mn with the stress-strain curve corresponding to load Ry, which is the yield-
strength load.
Extension Under Load (EUL) Method
Extension Under Load Method: When testing material for yield point and the test specimens may not
exhibit a well-defined sharply-yielding deformation that characterizes a yield point, a value equivalent to
the yield point in its practical significance may be determined by the following method. Attach an
extensometer to the specimen. When the load producing a specified extension is reached, record Ry, the
stress corresponding to the load at the specified extension, Om, as the yield point; refer to Figure 1c.
a) Yield Point Method b) Offset Method c) Extension Under Load Method
Figure 1. Stress-strain diagrams showing methods of yield stress determination

Charles Pankow Foundation RGA #04-13
Determination of Yield Strength for Nonprestressed Steel Reinforcement
Final Report – December 31, 2013
Page 8
HISTORICAL BACKGROUND
ACI 318-08, “Building Code Requirements for Structural Concrete,” Section 3.5.3.2, specifies that “…for
[deformed reinforcing] bars with [specified minimum yield strength] exceeding 60,000 psi, the yield
strength shall be taken as the stress corresponding to a strain of 0.35 percent.” This provision first
appeared in Section 3.5.1 of ACI 318-71 and continued to appear unchanged in ACI 318 until the 2011
edition. With ACI 318-11, the wording was changed to read “… [specified minimum yield strength] of at
least 60,000 psi…” [emphasis added] This same provision had been included in the first and many
subsequent drafts of proposed ACI 318-14.
Historical records, provided by the headquarters of the American Concrete Institute (ACI), show that the
requirement to measure yield strength as the stress corresponding to a strain of 0.35 percent was
developed in 1967 by the “Ad Hoc Group on Reinforcement,” operating under ACI Committee 318. The
group was chaired by E. Hognestad, and other group members included E. Cohen (ex officio, as Chair of
ACI Committee 318), W. A. Heitmann, G. F. Leyh (ex officio), R. C. Reese, P. F. Rice, C. P. Seiss, and
A. C. Weber. The written reports of the ad-hoc group, dated March 8, 1967, and April 10, 1967, reveal
that the particular requirement of 0.35 percent strain was established specifically for steel bar
reinforcement having a specified minimum yield strength of 75,000 psi (Grade 75), with consideration
given to the actual stress-strain behavior of Grade 75 bars manufactured at that time. Bars having other
specified minimum yield strengths were to have their own criteria: bars having a specified minimum yield
strength of 60,000 psi (Grade 60) were to be assessed at 0.3 percent strain, and bars having a specified
minimum yield strength of 80,000 psi (Grade 80) were to be assessed at 0.37 percent strain. The reports
of the Ad Hoc Group indicate that these particular values of EUL strain were established as equivalents to
strains corresponding to the offset method at a strain of 0.1 percent.
However, when the ACI 318-71 Code was issued, only the 0.35 percent strain requirement for
determination of yield for Grade 75 reinforcement was included in Section 3.5.1 of the Code. The
provision as written was applicable to reinforcement with specified minimum yield strength “exceeding
60,000 psi.” The particular language employed does not covey the specific linkage between the
0.35 percent strain requirement and Grade 75 reinforcement, leading to inadvertent application of this
requirement to other grades of reinforcement, such as Grade 80.
Specific provisions for determination of yield for Grades 40 and 60 reinforcement were not included.
Because ACI 318-71 was silent as to yield measurement requirements for Grades 40 and 60, the yield
measurement methods specified by the applicable ASTM manufacturing standards were to be used.
ACI 318-71 Commentary Section 3.5.1, along with a review of representative stress-strain curves for steel
reinforcement as manufactured in the 1960s, Figure 2 and Figure 3, provide insight into the relationship
between ACI 318-71 and the ASTM standards that prevailed at that time (the late 1960s).
Grade 40 bars at that time were always sharply yielding. The provisions of ASTM A615-68
pertaining to Grade 40 reinforcement specified that the yield point be reported by the halt-of-force
method, an appropriate method for sharply-yielding steel. ACI 318-71 took no exception.

Charles Pankow Foundation RGA #04-13
Determination of Yield Strength for Nonprestressed Steel Reinforcement
Final Report – December 31, 2013
Page 9
Figure 2. Actual stress-strain curves for nonprestressed steel bar reinforcement
(Grades 75, 60, and 40, top to bottom) that were manufactured during the mid-
1960s. (Pfister and Hognestad, 1964, excerpt of Figure 2).
Figure 3. Actual stress-strain curve for Grade 60 steel bar reinforcement
manufactured circa 1970. (WJE, 1970, Figure 12).

Charles Pankow Foundation RGA #04-13
Determination of Yield Strength for Nonprestressed Steel Reinforcement
Final Report – December 31, 2013
Page 10
Grade 60 bars at that time were almost, but not quite, sharply yielding. ASTM 615-68 specified that
yield strength be determined by the EUL method at a strain of 0.5 percent for Grade 60 bars. A
careful study, summarized in ACI 318-71 Commentary Section 3.5.1, examined the actual stress-
strain relationship for 272 samples of Grade 60 bars conforming to ASTM A432-67, “Deformed
Billet Steel Bars For Concrete Reinforcement with 60,000 PSI Minimum Yield Strength.” Figure 3 is
a representative stress-strain curve reproduced from the study. The study found a difference of only a
few percent in the measured yield strength for these Grade 60 bars, whether the yield stress was
determined using the EUL method at a strain of 0.3 percent, 0.35 percent, or 0.5 percent. As a result,
ACI 318-71 did not take an exception to the 0.5 percent strain requirement specified in ASTM
A615-68 for Grade 60 bars, even though the Committee 318 ad-hoc group recommended instead a
strain requirement of 0.3 percent for Grade 60 bars.
Grade 75 bars at that time were never sharply yielding; rather, they were gradually yielding (refer to
Figure 2). ASTM A615-68 specified that yield strength be determined at a strain of 0.6 percent for
Grade 75 bars. However, ACI 318-71 took exception to ASTM A615-68 and specified instead that
yield strength be determined at a strain of 0.35 percent, which was the recommendation of the 1967
ad-hoc group. ACI 318-71 Commentary Section 3.5.1 states that this was established “… in
recognition of the shape of the [Grade 75] reinforcing bar stress-strain curves observed.”
Grade 80 reinforcement was not commercially produced at that time, and so it did not receive
consideration by ACI 318-71, nor did it appear in an ASTM standard specification that was
referenced by ACI 318-71.
A chronological summary of requirements for determination of yield strength, for the period between the
mid-1960s to the present, as specified by ACI 318 and the ASTM manufacturing standards for new billet
steel and low alloy steel bar reinforcement, is given in Table 1.
Since the time that ACI 318-71 was issued, the properties of steel bar reinforcement have changed due
changes in raw materials and manufacturing methods. As a result, the stress-strain behavior of Grades 60
and 75 bars has become, for the most part, sharply yielding. As an example, the actual stress-strain curves
shown in Figure 4 are for representative samples of ASTM A615 Grade 75 reinforcement produced in
2008; these samples of Grade 75 reinforcement are sharply-yielding. In 2009, Grade 80 was introduced
into the ASTM A615 and A706 specifications for steel reinforcing bars; Grade 80 bars appear to be, for
the most part, sharply yielding, but not always.
Additionally, since the late 1960s, new nonprestressed steel reinforcement products have been introduced
into the ACI 318 Code, such as carbon steel wire, stainless steel bars, and stainless steel wire. Some steel
reinforcement products are now coiled at the steel mill as part of the manufacturing process, for
subsequent shipment in coils to the purchaser. The stress-strain behavior for these particular additional
products is never sharply yielding.
Review of the various editions of the ACI 318 Commentary since ACI 318-71 finds no clear indication
that the stress-strain behavior of the additional nonprestressed steel reinforcement products noted above
were considered as the products were introduced into the various editions of the ACI 318 Code since
ACI 318-71, or whether there was any reassessment that the prevailing yield strength determination
methods were appropriate for these additional products. Additionally, the historical record does not
include any profound change to the provisions of ACI 318 for yield strength determination since they
were codified in ACI 318-71.

Charles Pankow Foundation RGA #04-13
Determination of Yield Strength for Nonprestressed Steel Reinforcement
Final Report – December 31, 2013
Page 11
Table 1. Chronology of Specified Yield Methodologies for Steel Bar Reinforcement
(Summary of ASTM specifications limited to A615 billet steel and A706 low-alloy steel)
Authority/ Edition Grade 40 Grade 60 Grade 75 Grade 80 Comment
ASTM A15-62T (GR40)
ASTM A432-62T (GR60)
ASTM A431-62T (GR75)
YP 0.5% EUL 0.6% EUL Not produced Referenced by ACI 318-63
ACI 318-63 Silent Silent 0.3% EUL 0.3% EUL Section 1505
Ad-Hoc Group 1967 Silent 0.30% EUL 0.35% EUL 0.37% EUL Each EUL strain corresponds
to that of the 0.1% offset
method for the strength grade
indicated
ASTM A615-68 YP 0.5% EUL 0.6% EUL N/A Referenced by ACI 318-71
ACI 318-71 Silent Silent 0.35% EUL 0.35% EUL Section 3.5.1
ASTM A615-76a YP; 0.5% EUL YP; 0.5% EUL N/A N/A Referenced by ACI 318-77
ASTM A706-76 N/A YP; 0.35% EUL N/A N/A Referenced by ACI 318-77
ACI 318-77 Silent Silent 0.35% EUL 0.35% EUL Section 3.5.3.3
ASTM A615-82(S1) YP; 0.5% EUL YP; 0.5% EUL N/A N/A Referenced by ACI 318-83
ASTM A706-82a N/A YP; 0.35% EUL N/A N/A Referenced by ACI 318-83
ACI 318-83 Silent Silent 0.35% EUL 0.35% EUL Section 3.5.3.2
ASTM A615-86 YP; 0.5% EUL YP; 0.5% EUL N/A N/A
ASTM A615-87 YP; 0.5% EUL YP; 0.5% EUL YP; 0.35% EUL N/A Referenced by ACI 318-89
ASTM A706-86 N/A YP; 0.35% EUL N/A N/A Referenced by ACI 318-89
ACI 318-89 Silent Silent 0.35% EUL 0.35% EUL Section 3.5.3.2
1989 to 2007 No significant change within ASTM A615, ASTM A706 and ACI 318
ASTM A615-07 YP; 0.5% EUL YP; 0.5% EUL YP; 0.35% EUL N/A Referenced by ACI 318-08
ASTM A706-06a N/A YP; 0.35% EUL N/A N/A Referenced by ACI 318-08
ACI 318-08 Silent Silent 0.35% EUL 0.35% EUL Section 3.5.3.2
ASTM A615-08b YP; 0.2% OM YP; 0.2% OM YP; 0.2% OM N/A
ASTM A706-08a N/A YP; 0.2% OM N/A N/A
ASTM A615-09a YP; 0.2% OM YP; 0.2% OM YP; 0.2% OM YP; 0.2% OM
ASTM A706-09a N/A YP; 0.2% OM N/A YP; 0.2% OM
ASTM A615-09b YP; 0.2% OM YP; 0.2% OM
and 0.35% EUL
YP; 0.2% OM and
0.35% EUL
YP; 0.2% OM
and 0.35% EUL
Referenced by ACI 318-11
ASTM A706-09b N/A YP; 0.2% OM
and 0.35% EUL
N/A YP; 0.2% OM
and 0.35% EUL
Referenced by ACI 318-11
and ACI 318-14
ACI 318-11 0.50% EUL 0.35% EUL 0.35% EUL 0.35% EUL Section 3.5.3.2
ASTM A615-12 YP; 0.2% OM YP; 0.2% OM
and 0.35% EUL
YP; 0.2% OM and
0.35% EUL
YP; 0.2% OM
and 0.35% EUL
Referenced by ACI 318-14
ACI 318-14 (originally
proposed)
0.50% EUL 0.35% EUL 0.35% EUL 0.35% EUL
ACI 318-14 (final
version)
YP; 0.2% OM YP; 0.2% OM YP; 0.2% OM YP; 0.2% OM As approved on October 23,
2013 Abbreviations used: YP = observed yield point; 0.1% OM = offset method (0.1% offset); 0.2% OM = offset method (0.2% offset); 0.35% EUL =
extension under load method at an extension of 0.35%; 0.5% EUL = extension under load method at an extension of 0.5%. Refer to body of report for detailed descriptions of the measurement methods.

Charles Pankow Foundation RGA #04-13
Determination of Yield Strength for Nonprestressed Steel Reinforcement
Final Report – December 31, 2013
Page 12
Figure 4. Representative, actual stress-strain curves for Grade 75
reinforcement manufactured circa 2008. (Figure obtained from Wiss,
Janney, Elstner Associates, Inc., unpublished, 2008.)
METHODOLOGY FOR STRENGTH CALCULATIONS
Objective
A primary objective of the research reported herein is to assess, by parametric study, the influence that the
method of determination of yield strength for nonprestressed steel reinforcement may have on the strength
of reinforced concrete sections. Implicitly, the yield strength of the reinforcement is a parameter in the
parametric study. Additionally, the sectional strength calculations include consideration of the shape of
the yielding region of the stress-strain relationship for the reinforcement. The strain at which a given
stress-strain relationship develops the specified yield strength of the reinforcement is dependent upon the
particular yield measurement method under consideration. The parametric study includes both different
reinforcement yield strengths and different yield measurement methods, as described immediately below,
and as a result, many different stress-strain relationships are included in the parametric study.
Specified Minimum Yield Strengths
Two specified minimum yield strengths are included in the parametric study: 60,000 psi (Grade 60) and
80,000 psi (Grade 80). The reasons for including or excluding specific strengths of reinforcement are as
follows.
Grade 40: Only a limited volume of ASTM A615 Grade 40 reinforcement is currently produced, and
ASTM A706 does not include Grade 40 reinforcement. Additionally, it is commonly accepted that
ASTM A615 Grade 40 reinforcement is essentially always sharply yielding. As a result, the concerns
about yield measurement methods for gradually-yielding reinforcement do not extend to Grade 40
reinforcement. Therefore, Grade 40 reinforcement is not included in the parametric study.
Grade 60: Grade 60 reinforcement is the most commonly-specified strength of steel bar
reinforcement, and it is the most common grade of reinforcement manufactured under both
ASTM A615 and ASTM A706. Therefore, Grade 60 is included in the parametric study.
0
15
30
45
60
75
90
0.000 0.005 0.010 0.015
Str
ess
(ksi
)
Strain
0.35% EUL
0.1% offsest
0.2% offsest

Charles Pankow Foundation RGA #04-13
Determination of Yield Strength for Nonprestressed Steel Reinforcement
Final Report – December 31, 2013
Page 13
Grade 75: Only a limited volume of ASTM A615 Grade 75 reinforcement is currently produced, and
ASTM A706 does not include Grade 75 reinforcement. Additionally, Grade 80 reinforcement is
included in the parametric study, and so the strength-related performance of Grade 75 reinforcement
is bracketed by that of Grade 60 and Grade 80 reinforcement. Therefore, Grade 75 reinforcement is
not included in the parametric study.
Grade 80: Grade 80 reinforcement represents the upper limit of specified minimum yield strength
permitted by ACI 318 for longitudinal nonprestressed steel reinforcement in beams and columns.
Therefore, Grade 80 is included in the parametric study.
ACI 318 also permits the use of stainless steel bar, carbon steel wire, and stainless steel wire as
longitudinal nonprestressed steel reinforcement. The manufacturing standards for these products employ
specified minimum yield strengths in the range of 60,000 psi to 80,000 psi. As described later in this
chapter, actual stress-strain curves for these kinds of reinforcement, to the extent as readily available for
examination under this research, are considered in the development of the normalized relationships for
Grades 60 and 80 reinforcement.
Yield Measurement Methods
The different methods for determining yield stress in nonprestressed steel reinforcement are described in
detail in an earlier chapter of this report; refer to Figure 1 for a graphical depiction of these methods. An
historical summary of the yield measurement methods required by various editions of ACI 318 and
various ASTM standard specifications for manufacturing of reinforcement is also given in an earlier
chapter of this report; refer to Table 1 for a tabular summary of ACI and ASTM requirements. Both
historical and current information is considered for establishing the yield determination methods that are
entered into the parametric study. Specifically, the parametric study includes different yield methods for
different grades of reinforcement for the following reasons:
The EUL method at a strain of 0.50 percent is used with Grade 60 reinforcement because, prior to
ACI 318-11, the ACI 318 Code was silent as to yield measurement method for Grade 60
reinforcement. As a result of this silence, the yield measurement method specified by the ASTM
specifications for reinforcement prevailed. For ASTM A615 Grade 60 reinforcement, this was the
0.50 percent EUL method.
The EUL method at a strain of 0.35 percent is used with Grade 80 reinforcement because the current
code, ACI 318-11, requires that, for reinforcement with a specified yield strength of at least
60,000 psi, yield strength be determined at a strain of 0.35 percent.
The offset method at an offset of 0.1 percent strain is used with both Grades 60 and 80 reinforcement
because, according to available historical records summarized earlier in this report, the apparent intent
of the 1967 ACI Committee 318 “Ad Hoc Group on Reinforcement” was that the 0.1 percent offset
method be applied to all grades of reinforcement, regardless of specified minimum yield strength.
The offset method at an offset of 0.2 percent strain is used with both Grades 60 and 80 reinforcement
because the nonprestressed steel reinforcing bar manufacturing industry has requested that this
specific method be applied to all grades of reinforcement, regardless of specified minimum yield
strength.
The development of normalized stress-strain relationships for Grade 60 and Grade 80 reinforcement, for
the yield determination methods listed above, is described later in this chapter.

Charles Pankow Foundation RGA #04-13
Determination of Yield Strength for Nonprestressed Steel Reinforcement
Final Report – December 31, 2013
Page 14
Overview of Computational Procedure
An overview of the procedure for strength calculations is as follows:
1. Identify a range of member cross-sections for both beams and columns:
a. Include variation of reinforcement ratio, , for both beams and columns; and
b. Consider both rectangular and square shapes for columns.
2. Select ranges of nominal material strengths to be considered:
a. For compressive strength of concrete, representative of those used in practice; and
b. For specified minimum yield strength of reinforcement.
3. For all cross-sections being considered, calculate code-based “nominal strength” (Mn for a beam, and
Mn-Pn interaction curve for a column) using the provisions of ACI 318-14 Chapter 22 – Sectional
Strength and Chapter 20 – Steel Reinforcement Properties, Embedments, and Durability (proposed
version as of December 2013), as follows:
a. Use the principles of strain compatibility and equilibrium;
b. Employ the equivalent rectangular stress block for concrete;
c. Limit concrete compressive strain to 0.003; and
d. Employ an elastic-perfectly plastic stress-strain relationship (without strain hardening) for
reinforcement.
4. For all cross-sections, determine the code-based “design strength” by using the applicable strength
reduction factor, , from ACI 318-14 Chapter 21 – Strength Reduction Factors. The reported design
strength is Mn for a beam, and the reported design interaction curve for a column is Mn-Pn.
5. For the specified minimum yield strengths being considered, develop a series of normalized stress-
strain relationships for reinforcement, to be used for analytically predicting actual member strengths.
a. Collect and examine representative, actual stress-strain curves for the various types of
reinforcement and yield strengths being considered.
b. Based on the actual stress-strain curves for sharply yielding reinforcement, develop normalized
relationships that include an elastic region, a plastic yield plateau at a stress equal to the specified
minimum yield strength, and strain hardening following the yield plateau.
c. Based on the actual stress-strain curves for gradually yielding reinforcement, develop normalized
relationships that include an elastic region up to a proportional limit, followed by gradual yielding
that extends beyond the specified minimum yield strength and into strain hardening. The
gradually-yielding relationships are normalized so that the stress-strain curve reaches exactly the
specified minimum yield strength when yield strength is measured according to one of the yield
measurement methods being considered, such as the offset method (0.1 percent offset or
0.2 percent offset) and extension under load (0.35 percent strain or 0.5 percent strain).
6. Identify a nonlinear stress-strain relationship for concrete, to be used for predicting “actual” sectional
strengths by analysis.
7. For all cross-sections being considered, calculate an analytical strength prediction for “actual”
strength as follows:
a. Use the principles of strain compatibility and equilibrium, where the maximum strain in the
concrete is not necessarily limited to 0.003, for reasons given later in this chapter in the section
entitled “Concrete Stress-Strain Relationships;”
b. Employ the identified nonlinear stress-strain relationship for concrete;
c. Employ the various normalized, nonlinear stress-strain relationships for reinforcement, as
developed previously; and
d. For each combination of cross-section, material strength, reinforcement stress-strain relationship,
and axial force (beams are considered to have zero axial force), calculate the moment-curvature

Charles Pankow Foundation RGA #04-13
Determination of Yield Strength for Nonprestressed Steel Reinforcement
Final Report – December 31, 2013
Page 15
curve for the section. Identify the maximum moment obtained from the curve as the analytical
strength for the cross-section.
8. Present the results for “nominal strength”, “design strength”, and “analytical strength” in a
comparative, nondimensional, graphical manner, as follows:
a. Beam strengths are presented as a series of M- curves; and
b. Column strengths are presented as a series of P-M interaction curves for selected reinforcement
ratios.
These steps are described in greater detail in the following sections of this chapter.
Member Cross-Sections and Strengths of Materials
The most recent reliability calibration for the ACI 318 Code (Nowak et al., 2008) was used for general
guidance in the selection of member cross-sections and specified materials strengths. While code
calibration included only Grade 60 reinforcement, the parametric study reported herein also included
Grade 80 reinforcement. The study also included a broader range of longitudinal reinforcement ratio, , in
beams and in columns than Nowak et al. (2008), included both square and rectangular columns, and
included an even distribution of longitudinal reinforcement around the complete perimeter of the
columns.
Beam Sections. Table 2 summarizes the parameters and their values included in the parametric study of
beam sections. Reinforcement yield strengths are limited to 60,000 psi and 80,000 psi for the reasons
given at the beginning of this chapter. As was the case for code calibration (Nowak et al., 2008), beam
cross-sections are limited to singly-reinforced sections. For the parametric study, a broad range for
reinforcement ratio, , is utilized, specifically, 0%≤≤6%. Consequently, the parametric study includes
beam strength calculations that represent both tension-controlled (reinforcement is yielding) and
compression-controlled (reinforcement remains elastic) sections. Beam sections having the balanced
reinforcement ratio, b, are also specifically included in the parametric study.
For beam sections, the compressive strength of concrete, , is limited to the two discrete values of
5,000 psi and 8,000 psi. These values are representative of concrete strengths as used in practice.
Table 2. Representative Beam Sections Considered
Section Concrete
(psi)
Reinforcement fy
(psi)
Reinforcement Stress-
Strain Relationships
=0% to 6%
by 0.5% increments,
and also at b
5,000 60,000 Refer to Table 5
5,000 80,000 Refer to Table 5
8,000 60,000 Refer to Table 5
8,000 80,000 Refer to Table 5

Charles Pankow Foundation RGA #04-13
Determination of Yield Strength for Nonprestressed Steel Reinforcement
Final Report – December 31, 2013
Page 16
Column Sections. Table 3 summarizes the parameters and their values included in the parametric study
of column sections. Reinforcement yield strengths are limited to 60,000 psi and 80,000 psi for the reasons
given at the beginning of this chapter. In contrast to code calibration, which considered column sections
with longitudinal reinforcement only in two layers, with one layer located in each of two opposing faces
of a column section (Nowak et al., 2008), the column sections include longitudinal reinforcement that is
evenly distributed across all four faces of a column. Longitudinal reinforcement ratios, , are included
over the range of 1%≤≤8%. In the industry, most practical columns have reinforcement ratios on the
order of 1 percent to 2 percent; a column with a reinforcement ratio of 4 percent or larger is commonly
considered to be heavily reinforced and might also be considered less economical. As summarized in the
first column of Table 3, the parametric study includes both square and rectangular column sections, and
for rectangular sections, the study includes two different values for , the ratio of the dimensions of the
column core to the dimensions of the gross section.
Table 3. Representative Column Sections Considered
Section Concrete
(psi)
Reinforcement fy
(psi)
Reinforcement Stress-
Strain Behavior
Square with =0.8
=1%, 2%, 3%, 4%, 6%, 8%
5,000 60,000 Refer to Table 5 and Note 1
5,000 80,000 Refer to Table 5 and Note 1
8,000 60,000 Refer to Table 5 and Note 1
8,000 80,000 Refer to Table 5 and Note 1
12,000 60,000 Refer to Table 5 and Note 1
12,000 80,000 Refer to Table 5 and Note 1
Rectangular with =0.8
=1%, 2%, 3%, 4%, 6%, 8%
5,000 60,000 Refer to Table 5 and Note 1
5,000 80,000 Refer to Table 5 and Note 1
8,000 60,000 Refer to Table 5 and Note 1
8,000 80,000 Refer to Table 5 and Note 1
12,000 60,000 Refer to Table 5 and Note 1
12,000 80,000 Refer to Table 5 and Note 1
Rectangular with =0.6
=1%, 2%
5,000 60,000 Refer to Table 5 and Note 1
5,000 80,000 Refer to Table 5 and Note 1
Note 1: For column analyses, RH 21 and RH 22 stress-strain behaviors as listed in Table 5 are not
included; rationale for this is given in the report.

Charles Pankow Foundation RGA #04-13
Determination of Yield Strength for Nonprestressed Steel Reinforcement
Final Report – December 31, 2013
Page 17
For column sections, the compressive strength of concrete, , is limited to the three discrete values of
5,000 psi, 8,000 psi and 12,000 psi. The two higher strengths are considered representative of higher
strengths of concrete as used in practice.
Code-Specified Sectional Strengths
Numerous researchers and practitioners have proposed various methods by which the axial or flexural
strength of a given cross section can be estimated. These methods range from complex fiber models,
incorporating nonlinear stress-strain characteristics of the concrete and steel comprising the section, to
simplified approaches accounting for little more than the size of the member, and the amount and strength
of the reinforcing steel.
Building codes, including the ACI Code, contain requirements to be met for a sectional analysis to
conform to the code, but intentionally provide leeway for the design structural engineer to use a
reasonable method of their choosing. These codes also specifically provide a simplified procedure,
usually based on the so-called equivalent rectangular (Whitney) stress block for concrete and an elastic-
perfectly plastic stress-strain behavior for reinforcement, which is permitted to be used in determining
sectional strength. That procedure, however, does not necessarily lead to a conservative value for
sectional strength when compared to strengths obtained from more advanced sectional analyses. The
relevant provisions of ACI 318-14 (proposed version as of December 2013) and the resulting
methodologies for computing sectional strengths of beams and columns are described below.
Relevant ACI 318-14 Provisions
ACI 318-14 Chapter 22 – Sectional Strength contains requirements for computing the strengths of beam
and column sections with nonprestressed steel reinforcement. All relevant provisions of this chapter are
utilized to compute the code-specified nominal and design sectional strengths of beams and columns for
the analyses described in this report. Specifically, the computations make use of Section 22.2.2.4
describing the procedure for using an equivalent rectangular concrete stress block, including limitation of
concrete compressive strain to 0.003, and Chapter 20, Sections 20.2.2.1 and 20.2.2.2 describing an
elastic-perfectly-plastic model for nonprestressed steel reinforcement.
Beam Strength Methodology
All beam cross sections analyzed in this study have the same cross-sectional dimensions and are singly
reinforced. The reinforcement ratio, concrete strength, and specified minimum yield strength of the
reinforcing steel are varied as part of the parametric study. For each case, the nominal flexural strength,
Mn, of the cross section is computed as:
(
)
Mn= nominal flexural strength of the section
As= area of longitudinal reinforcement
fs= stress in the longitudinal reinforcement
d= distance from extreme compression fiber to centroid of longitudinal tension reinforcement
1= factor relating depth of equivalent rectangular compressive stress block to neutral axis depth
c= distance from extreme compression fiber to neutral axis

Charles Pankow Foundation RGA #04-13
Determination of Yield Strength for Nonprestressed Steel Reinforcement
Final Report – December 31, 2013
Page 18
The stress in the reinforcement, fs, is assumed to behave linearly-elastic, with fs=sEs (where s= strain in
the reinforcement and Es=29,000,000 psi), until nominal yield stress, fy, is reached, and then plastically
with fs=fy thereafter. The depth to the neutral axis, , is computed by satisfying the conditions of
equilibrium and strain compatibility in accordance with ACI 318-14 Section 22.2.1 and the equation
below, iterating where necessary:
= compressive strength of concrete
b= width of the compression face of the section
The remaining notation is as given previously.
The design flexural strength of a beam section is computed by multiplying the nominal flexural strength
by the appropriate strength-reduction factor, , given in ACI 318-14 Table 21.2.2 for the case of tied
transverse reinforcement, which ranges between 0.90 and 0.65 depending on the computed net tensile
strain in the reinforcement at calculated nominal strength.
Column Strength Methodology
Column sections included in the parametric study vary in cross sectional shape, quantity and strength of
reinforcing steel, concrete strength, and magnitude of concentrically applied axial load, as described in
the paragraphs that follow. When computing the nominal and design strengths of the column section in
accordance with the requirements of ACI 318-14, the basic procedures as described previously for beam
sections are again followed. The nominal flexural strength of each column section at a given level of axial
load is computed by establishing moment equilibrium about the centroid of the section:
∑ [ (
)]
(
)
Mn= nominal flexural strength of the section
ns= number of layers of longitudinal reinforcement
Asi= area of the ith layer of longitudinal reinforcement
fsi= stress in the ith layer of longitudinal reinforcement
di= distance from extreme compression fiber to centroid of the ith layer of longitudinal
reinforcement
d= distance from extreme compression fiber to centroid of longitudinal tension reinforcement
h= overall height of the section
= compressive strength of concrete
b= width of the compression face of the section
1= factor relating depth of equivalent rectangular compressive stress block to neutral axis depth
c= distance from extreme compression fiber to neutral axis
Because there are multiple layers of reinforcement in each column section, the force developed in the
reinforcement in each of the reinforcement layers is multiplied by the distance from the layer to the
centroid of the section to compute that layer’s contribution to bending resistance. As was the case with the
beams, and in compliance with ACI 318-14, the reinforcement is assumed to behave linearly-elastic until
nominal yield stress is reached and plastically at strains thereafter, and is assumed to behave identically in
both tension and compression. Again, similar to the case for beam sections, the depth to the neutral axis,

Charles Pankow Foundation RGA #04-13
Determination of Yield Strength for Nonprestressed Steel Reinforcement
Final Report – December 31, 2013
Page 19
, is computed by satisfying the conditions of equilibrium and strain compatibility in accordance with
ACI 318-14 Section 22.2.1 and the equation below, iterating where necessary:
∑ [ ]
Pn = nominal axial strength of the section (applied axial load)
The remaining notation is as given previously.
It is typically assumed in design that, in addition to the computed bending moments, axial loads imparted
on column sections act concentrically at the geometric centroid of that column. In an attempt to account
for accidental eccentricities of axial load and the resulting increased bending moment in heavily loaded
columns, Section 22.4.2 of ACI 318-14 limits the calculated nominal axial load strength for tied columns
to 80 percent (85 percent for spirally reinforced columns) of an otherwise computed concentric axial
strength nominal value. The maximum nominal axial load, Pn,max, permitted by the code is:
[ ( ) ]
Pn,max = maximum nominal axial strength of the section
Ast = total area of longitudinal reinforcement
∑
Ag = gross area of the section
Ag = bh
fy = specified minimum yield strength of reinforcement
The remaining notation is as given previously.
Implicit in the equation for Pn,max is the assumption that all of the reinforcement and all of the concrete in
the cross section develop their maximum resistance simultaneously, at the same level of compressive
strain. It is widely known and well understood, however, that the strain at which the peak stress in
concrete is reached is a function of its compressive strength, and is not necessarily the same strain at
which the reinforcement develops its yield strength in compression. For steels exhibiting nearly elastic-
perfectly-plastic behavior, the assumption implicit in the equation for Pn,max may be reasonable. The
consequences of this implicit assumption in the context of non-sharply-yielding reinforcing steel,
however, may not be as convenient. While the analytical predictions of “actual” sectional strengths,
described later in this chapter, include the strength-related effects of these differences of strain in
reinforcement and in concrete, further investigation of this topic as it relates to code-permitted formulae is
outside the scope of this report.
The design flexural and corresponding axial load strengths of column sections are computed by
multiplying the nominal strengths by the appropriate strength-reduction factor, , given in ACI 318-14
Table 21.2.2 for tied transverse reinforcement, which ranges between 0.90 and 0.65 as a function of the
computed net tensile strain in the extreme tension layer of reinforcing steel at calculated nominal strength.
In general, columns at axial loads above the balance point have an associated strength-reduction factor of
0.65 ( for a compression controlled section); those with axial loads on the order of 75 percent of the
axial load at the balance point have an associated strength-reduction factor of 0.90 ( for a tension
controlled section); and the strength-reduction factor varies linearly with the computed steel strain for

Charles Pankow Foundation RGA #04-13
Determination of Yield Strength for Nonprestressed Steel Reinforcement
Final Report – December 31, 2013
Page 20
axial loads between those levels (that is, are in the behavior transition region). In the preceding
discussion, the balance point for a column section is the unique combination of axial load and moment
where the tension reinforcement reaches yield strength and the extreme fiber concrete compressive strain
reaches 0.003 at the same time.
Reinforcement Stress-Strain Relationships
A representative sampling of actual stress strain curves from monotonic tension tests on reinforcing bars
have been obtained from the reinforcement manufacturing industry, for recently-manufactured (2012 and
2013) reinforcement as coordinated by the Concrete Reinforcing Steel Institute (CRSI), and from within
the archives of the WJE laboratory and of a university research laboratory, for testing over approximately
the past 10 years. Curves were obtained for reinforcing bars that were manufactured according to the
following standards:
ASTM A615 Grade 60 and Grade 80 (straight reinforcing bar)
ASTM A615 Grade 60 and Grade 80 (coiled reinforcing bar)
ASTM A706 Grade 60 and Grade 80 (straight reinforcing bar)
ASTM A706 Grade 60 and Grade 80 (coiled reinforcing bar)
ASTM A615 Grade 75 (straight reinforcing bar)
ASTM A955 Grade 60 (straight reinforcing bar; stainless steel)
Within a mill certificate database maintained by CRSI for steel bars that were manufactured during 2011
and 2012, there are approximately 151,800 entries for heats of Grade 60 steel bar reinforcement, both
ASTM A615 and A706 combined. An evaluation of the data from CRSI indicates that the average actual
yield strength of reinforcement ranges from 1.06 to 1.14 times the specified minimum yield strength,
depending upon the type and grade of reinforcement. In addition, of the 151,800 entries, approximately
5,600 are for heats of coiled reinforcing steel with the common maximum bar size being No. 6. This
suggests that the production of coiled reinforcement represents less than 4 percent of Grade 60 steel bar
production. The production of coiled bar in Grades 40, 75 and 80 is too small to provide meaningful,
coiled bar-related statistics.
Characterization of Actual Relationships
The obtained stress-strain curves for both straight and coiled bar are reviewed to characterize the general
shapes of the actual stress-strain relationships for the reinforcing bars. Descriptions of the observed
characteristic stress-strain relationships are given in Table 4. Representative actual stress-strain curves
illustrating the different characteristic relationships are shown in Figure 5.
Straight Reinforcing Steel. The vast majority, approximately 98 percent, of the straight reinforcing bar
actual stress-strain curves that were reviewed for this study have stress-strain relationships that include a
linear-elastic portion with a well-defined or sharp yield point, followed by a yield plateau that eventually
transitions to strain hardening (abbreviated as EPSH behavior). This observation is specifically
developed from review of stress-strain curves for reinforcing bar tensile tests that were performed under
consistent research laboratory conditions (such as load rate, instrumentation, operator qualifications, and
temperature) at the WJE laboratories between approximately 2003 and 2013. Of 172 samples of ASTM
A615 and A706 reinforcement of Grades 60, 75 and 80 that were tested, less than 2 percent of all curves
exhibit “roundhouse” (RH) characteristic, gradually-yielding stress-strain relationships. Stress-strain
curves obtained from the industry are not utilized for determination of this percentage because of

Charles Pankow Foundation RGA #04-13
Determination of Yield Strength for Nonprestressed Steel Reinforcement
Final Report – December 31, 2013
Page 21
unknown instrumentation, operator qualifications, load rate and temperature of the reinforcement at time
of the industry stress-strain tests.
Other characteristic curve shapes are observed with straight reinforcing steel including “rounded knee
with strain hardening” (RKSH) and “gradually yielding with strain hardening” (GYSH). Narrative
descriptions for these stress-strain relationships are given in Table 4 and are illustrated in Figure 5.
Table 4. Characterization Categories for Reinforcement Stress-Strain Relationships
Abbreviation Characteristics Comment
CODE Idealized elastic-perfectly plastic without strain
hardening
In accordance with assumptions permitted by
ACI 318-14.
EPSH Elastic-plastic, sharply-kneed yield, with
significant length to the yield plateau, followed
by strain hardening
Assumed onset of strain hardening takes
place at 1.0 percent strain; strain hardening
modeled as parabolic curve.
RKSH Elastic, then “rounded knee” instead of distinct
yield point, followed by a yield plateau, followed
by strain hardening
Anticipated to provide results generally the
same as EPSH behavior; therefore RKSH not
separately included.
GYSH Elastic, then “rounded knee” instead of distinct
yield point, followed by gradual yielding at a
constant rate (that is, a constant slope to the
stress-strain curve), followed by strain hardening
Results provided by RH behavior will
provide a conservative lower bound to GYSH
behavior; therefore GYSH not separately
included.
RH 29
RH 22
RH 21
Elastic followed by indistinct transition into an
increasing rate of continuous yielding
(“roundhouse” behavior); the two-digit
numerical suffix represents the initial tangent
modus at the start of the elastic portion of the
stress-strain curve, in units of 106 psi.
The increasing rate of gradual yielding
results in a broadly curved shape, leading to
the nickname “roundhouse”.
Figure 5. Representative actual reinforcing steel stress-strain curves,
illustrating various relationship characterization categories

Charles Pankow Foundation RGA #04-13
Determination of Yield Strength for Nonprestressed Steel Reinforcement
Final Report – December 31, 2013
Page 22
Coiled Reinforcing Steel. All stress-strain curves for coiled reinforcing bars reviewed in this study were
contributed by industry and exhibit stress-strain relationships that follow the RH shape (Table 4). During
the curve characterization review, it was observed that there is distinct variability in the initial slope of the
RH curves for coiled reinforcing bars as compared to straight reinforcing bars. Some curves for Grade 60
coiled bars have an initial modulus as low as 22,000,000 psi and some curves for Grade 80 coiled bars
have an initial modulus as low as 21,000,000 psi. (The significance of this observation is discussed near
the end of this report.) Given the large departure from the generally accepted modulus of elasticity of
29,000,000 psi (which straight reinforcing bars are observed to typically exhibit), the RH curves for
coiled bar in Grade 60 and Grade 80 are given separate characterizations, RH22 and RH21, respectively.
All straight bar RH curves are characterized as RH29, regardless of grade.
Selection of Relationships used in Member Sectional Analysis
Given the general similarities between the RKSH relationship and the EPSH relationship, it is anticipated
that these relationships will produce generally the same sectional strength results when used as part of the
analytical sectional strength computations. Additionally, it is anticipated that the RH relationships will
provide conservative lower bounds to the GYSH relationships (for reinforcement strains below the yield
strength). Considering that the EPSH relationship provides an upper bound and the various RH
relationships provide a lower bound, the RKSH and GYSH relationships are not separately included in
the parametric study.
As discussed earlier in this chapter, the parametric study is limited to reinforcement with specified
minimum yield strengths of 60,000 psi and 80,000 psi. For reasons also given earlier in this report,
reinforcement with specified minimum yield strengths exceeding 80,000 psi is not considered.
Normalization of Relationships used in Member Strength Analysis
Based on the general shapes of the actual stress-strain curves reviewed in this study, individual
normalized relationships were developed for use in the analytical sectional strength calculations. As used
here, “normalized” means that the stress-strain curve develops exactly the specified yield strength when
yield is measured according to a particular yield measurement method being considered. Development of
the normalized stress-strain relationships included in the parametric study is described in the following
paragraphs.
CODE. The CODE stress-strain relationship is implicitly normalized and is in accord with assumptions
permitted by ACI 318-14: an initial elastic modulus of 29,000,000 psi at strains less that that
corresponding to the specified minimum yield strength, and perfectly plastic at a stress equal to the
specified minimum yield strength for strains beyond yield. The CODE relationship does not include
strain hardening.
EPSH. The normalized EPSH stress-strain relationship yields sharply at the specified minimum yield
strength and includes strain-hardening behavior. Similar to the CODE relationship, the EPSH
relationship has an initial elastic modulus of 29,000,000 psi at strains less than that corresponding to the
specified minimum yield strength, and a perfectly plastic yield plateau at a stress equal to the specified
minimum yield strength, beginning at strains beyond yield. The yield plateau ends at a strain of
1.0 percent and stresses during strain hardening are calculated according to the following parabolic
relationship:

Charles Pankow Foundation RGA #04-13
Determination of Yield Strength for Nonprestressed Steel Reinforcement
Final Report – December 31, 2013
Page 23
(
)
= strain in the reinforcement
fs = stress in the reinforcement
fu = specified tensile strength (90,000 psi for Grade 60, 100,000 psi for Grade 80)
fy = specified yield strength (60,000 psi or 80,000 psi)
su = strain at development of tensile strength (taken to be 9 percent for Grade 60, 6 percent for
Grade 80)
sh = strain at onset of strain hardening (taken to be 1.0 percent)
RH. The normalized relationships for the RH curves are developed using the Ramberg-Osgood equation:
(
)
= strain in the reinforcement
= fs = stress in the reinforcement
E = modulus of elasticity
0 = fy = specified minimum yield strength
= constant depending on material
n = constant depending on material
For each type and grade of steel being considered, a representative sampling of actual stress-strain curves
is plotted next to the Ramberg-Osgood equation. To create the normalized curves, 0 was taken equal to
the specified minimum yield strength, fy, for the reinforcement being considered (60,000 psi or
80,000 psi) and
was established so that the stress-strain curve develops precisely the specified
minimum yield strength when measured according to the yield strength measurement method being
considered (0.35 percent EUL, 0.5 percent EUL, 0.1 percent offset or 0.2 percent offset, as appropriate).
Modulus E and the parameter n are adjusted until the shape of the curve generated by the Ramberg-
Osgood equation visually fits as a lower-bound to the actual stress-strain curves. A representative graph
comparing multiple actual stress-strain curves for Grade 60 coiled bars with the normalized relationships
developed for yield measurement methods of 0.1 percent offset, 0.2 percent offset, and 0.5 percent EUL is
shown in Figure 6. The black dots on the graph indicate the intersection between a particular
measurement method and the corresponding normalized stress-strain relationship. For example, the black
dot on the solid red line in Figure 6 corresponds to the 0.5 percent EUL method; the other black dots
represent other intersections between measurement methods and normalized relationships.
Overall, the parametric study includes reinforcement of fy=60,000 psi and 80,000 psi with stress-strain
relationships that follow the CODE, EPSH, RH21, RH22 and RH29 characteristic curves. A summary of
the stress-strain relationships used in this study is given in Table 5. The graphs of all normalized curves
are given in Figure 7 to Figure 10, inclusive. As before, the black dots on each graph indicate the
intersection between a particular measurement method and the corresponding normalized stress-strain
relationship. For each normalized relationship illustrated in these figures, the numeric values for the
Ramberg-Osgood equation parameters E, 0
and n are tabulated in the figure. For the various grades
and types of reinforcement considered in this study, the complete set of graphs comparing the actual

Charles Pankow Foundation RGA #04-13
Determination of Yield Strength for Nonprestressed Steel Reinforcement
Final Report – December 31, 2013
Page 24
stress-strain curves considered upon, along with the normalized relationships based upon these actual
curves, can be found in Appendix A.
Figure 6. Example (Grade 60 coiled bar reinforcement) of representative actual
stress-strain curves (black lines) and resulting normalized stress-strain
relationships (red lines).
Table 5. Normalized Stress-Strain Relationships for Reinforcement
Yield Strength of
Reinforcement, fy
(psi)
Yield Measurement Method
Observed
Yield Point
Offset Method at
0.1% Offset
Offset Method at
0.2% Offset
0.35% Extension
Under Load (EUL)
0.50% Extension
Under Load (EUL)
80,000 CODE
EPSH
RH 29
RH 21
RH 29
RH 21 RH 29 N/A
75,000 Note 1 Note 1 Note 1 Note 1 Note 1
60,000 CODE
EPSH
RH 29
RH 22
RH 29
RH 22 Note 2
RH 29
RH 22
40,000 Note 3 Note 3 Note 3 Note 3 Note 3
Refer to Table 4 for definition of acronyms used.
Refer to Figure 7 to Figure 10 inclusive for graphical illustration of these normalized stress-strain relationships.
Note 1: Grade 75 reinforcement is not separately included because the strengths of sections using Grade 75
reinforcement are bracketed by the results of the strength analyses for sections using Grade 60 and Grade 80
reinforcement.
Note 2: For Grade 60 reinforcement, the stress-strain relationship for the case of 0.35 percent EUL lies approximately
mid-way between the relationships for 0.1 percent offset and 0.2 percent offset. Therefore this method is not
separately included.
Note 3: Grade 40 reinforcement is not included because only a relatively small volume is produced by the industry.
0
10
20
30
40
50
60
70
80
90
100
0.00 0.10 0.20 0.30 0.40 0.50 0.60 0.70 0.80 0.90 1.00
Str
ess
(ksi
)
Reference Strain (percent)
0.5
%E
UL
Ramberg-Osgood Normalized Parameters:
E = 22,000 ksi
o = 60 ksi
o / E) = 0.001 or 0.002 or 0.002273
n = 10
GR60 Code
Coiled Bars
Actual ASTM Dual A615/A706 Grade 60
Normalized RH22 Grade 60
Source: Industry

Charles Pankow Foundation RGA #04-13
Determination of Yield Strength for Nonprestressed Steel Reinforcement
Final Report – December 31, 2013
Page 25
Figure 7. Normalized stress-strain relationships for CODE specified
(black lines) and EPSH (red lines) characterizations (Grade 60 and
Grade 80).
Figure 8. Normalized stress-strain relationships (red lines) for RH29
characterizations (Grade 60 and Grade 80).

Charles Pankow Foundation RGA #04-13
Determination of Yield Strength for Nonprestressed Steel Reinforcement
Final Report – December 31, 2013
Page 26
Figure 9. Normalized stress-strain relationships (red lines) for RH22
characterizations (Grade 60)
Figure 10. Normalized stress-strain relationships for RH21
characterizations (Grade 80)

Charles Pankow Foundation RGA #04-13
Determination of Yield Strength for Nonprestressed Steel Reinforcement
Final Report – December 31, 2013
Page 27
Analytical Sectional Strengths
The idealized methods permitted in ACI 318-14 for calculating nominal sectional strengths, which are
described earlier in this chapter, are generally accurate within reason, but cannot directly capture the
effects of the actual, nonlinear stress-strain behavior of concrete and reinforcement. The intent of the
research reported herein is to establish the effects of the different yield measurement methods using state-
of-practice analytical techniques to attain a best estimate (or prediction) of actual sectional strengths,
referred to hereafter as analytical “actual” strengths. To do so, a series of approximately 16,000 sectional
analyses are conducted incorporating the nonlinear stress-strain behavior of concrete (described below)
and steel (refer to Table 5), for the member sections considered by this study (refer to Table 2 and
Table 3). The methods of analyses are described in detail below.
Concrete Stress-Strain Relationships
Computing the analytical strength of the beam and column cross sections necessitates the implementation
of a mathematical representation of the stress-strain characteristics of concrete in compression. Many
models have been proposed by many different researchers. The following widely accepted models have
been considered for use in this study (Figure 11):
Hognestad (Hognestad, 1951).
Mander-Unconfined and Mander-Confined (Mander et al., 1988a).
Modified Hognestad: a modification to the Hognestad model as described in ACI 408R-03 (ACI
Committee 408, 2003).
Cornell University: as described in Figure 2.3 of Nilson et al., 2010.
A sensitivity analysis has been conducted to assess the effects of each concrete model at =8,000 psi. It
should be emphasized that the aim of this research project is not to study concrete models, but instead to
examine how stress-strain characteristics of reinforcement may affect the computed strength of cross
sections. Consequently, the intent of the sensitivity analysis of concrete stress-strain modeling is to ensure
that the concrete model selected is appropriate for the purposes of the research reported herein. Figure 12
and Figure 13 show results from the sensitivity analysis for beam and column sections, respectively. It is
Figure 11. Concrete stress-strain models considered in sensitivity
analyses
0.0
2.0
4.0
6.0
8.0
0.000 0.002 0.004 0.006 0.008
Str
ess,
ksi
Strain
Hognestad Mander - Unconfined
Modified Hognestad Mander - Confined
Cornell
f'c8ksi

Charles Pankow Foundation RGA #04-13
Determination of Yield Strength for Nonprestressed Steel Reinforcement
Final Report – December 31, 2013
Page 28
clear that, although there are differences in stress-strain relationships of the various concrete models
themselves, 1) the strength of beam and column sections is relatively insensitive to the concrete model
incorporated into the analysis, especially in the flexure-dominant regions of the curves, 2) all models
predict strengths in excess of the nominal strengths calculated by following ACI 318 code provisions for
most P-M interaction points for columns and M-ρ points for beams, 3) in the few instances where the
code-computed strength exceeds analytical strength, the factor adequately reduces the nominal strength
of the section, 4) the “Cornell” stress-strain model approximates the average of all models, and
5) changing the stress-strain characteristics of the reinforcement from EPSH to RH29 - 0.2% Offset does
not substantively affect the outcome of the different concrete stress-strain models.
Based on a review of the literature documenting each of the models described above, as well as
conversations with industry experts, the Cornell stress-strain models have been selected for a number of
reasons. One consideration is that, when the Hognestad (1951) and Mander (1988a, 1988b) stress-strain
models were first proposed in 1951 and 1988, respectively, the highest compressive strength of concrete
considered in their research was on the order of 6,200 psi; accordingly, these particular models are not
calibrated to include the stress-strain behavior of the higher strength concretes commonly used today. The
modification of the Hognestad model used by ACI Committee 408 was reportedly necessary to better
Figure 12. Concrete model sensitivity analysis results for beam
sections. Upper illustration: Grade 60 reinforcement with EPSH stress-strain
relationship. Lower illustration: Grade 60 reinforcement with RH29
(0.2 percent offset) stress-strain relationship.
0.00
0.10
0.20
0.30
0.40
0.0 1.0 2.0 3.0 4.0 5.0 6.0
Mn
/ f'
cb
d2
Reinforcement Ratio, %Mn per Code Hognestad Mander - Unconfined
ΦMn per Code Modified Hognestad Mander - Confined Core
Cornell
f'c = 8000 psi
fy = 60 ksi
EPSHρ
0.00
0.10
0.20
0.30
0.40
0.0 1.0 2.0 3.0 4.0 5.0 6.0
Mn
/ f'
cb
d2
Reinforcement Ratio, %Mn per Code Hognestad Mander - Unconfined
ΦMn per Code Modified Hognestad Mander - Confined Core
Cornell
f'c = 8000 psi
fy = 60 ksi
0.2% Offsetρ

Charles Pankow Foundation RGA #04-13
Determination of Yield Strength for Nonprestressed Steel Reinforcement
Final Report – December 31, 2013
Page 29
capture the behavior of the higher-strength concretes; the modification consisted of an adjustment to the
strain at which the peak stress in the concrete is reached. It is understood that that the modifications are
based on the data that underlie the Cornell model. Under these considerations, the Cornell stress-strain
relationships are used for the remainder of analyses presented in this report, so that the type of concrete
stress-strain modeling is not introduced as an inadvertent variable in the subsequent parametric study.
Figure 14 illustrates the Cornell stress-strain relationships for the three concrete compressive strengths
included in the parametric study, and digitized stress-strain data for these relationships are given in
Table 6.
Methodology for “Actual” Strength
The analytical “actual” sectional strength is computed by assuming that plane sections remain plane along
with equilibrium of forces acting on the section. Each reinforcing bar is treated as a discrete element,
with its strain based on strain compatibility as a function of its location within the cross-section. For
calculation of force contributed by a reinforcing bar, it is assumed that the reinforcing bar follows one of
the nonlinear stress-strain relationships summarized in Table 5, and that all bars in a section follow the
particular nonlinear relationship being considered. The compression force contributed by the concrete was
determined by integration of the stress profile calculated from the profile of strains acting on the concrete,
under the assumption that the concrete follows the Cornell stress-strain relationship for the appropriate
Figure 13. Concrete model sensitivity analysis results for column
sections
0.00
0.25
0.50
0.75
1.00
1.25
0.00 0.05 0.10 0.15 0.20
P /
f' c
Ag
M / f'cbh2
Nominal Per Code Hognestad Mander - Unconfined
Design Per Code Modified Hognestad Mander - Confined Core
Cornell
f'c = 8000 psi
ρg = 3.0%
fy = 60 ksi
EPSH
0.00
0.25
0.50
0.75
1.00
1.25
0.00 0.05 0.10 0.15 0.20
P /
f' c
Ag
M / f'cbh2
Nominal Per Code Hognestad Mander - Unconfined
Design Per Code Modified Hognestad Mander - Confined Core
Cornell
f'c = 8000 psi
ρg = 3.0%
fy = 60 ksi
0.2% Offset

Charles Pankow Foundation RGA #04-13
Determination of Yield Strength for Nonprestressed Steel Reinforcement
Final Report – December 31, 2013
Page 30
concrete compressive strength. For these “actual” sectional strength computations, compressive strains in
the concrete are permitted to exceed 0.003. This is because the concrete stress-strain relationships include
realistic “softening” of the concrete (decreasing strength with increasing strain), Figure 14, for strains that
exceed the strain corresponding to the maximum stress in the concrete stress-strain relationship.
Figure 14. Concrete stress-strain models used for analyses
Table 6. Digitized Stress-Strain Relationships for Concrete
Concrete Compressive Strength,
5,000 psi 8,000 psi 12,000 psi
Stress (psi) Strain (in./in.) Stress (psi) Strain (in./in.) Stress (psi) Strain (in./in.)
0 0.00000 0 0.00000 0 0.00000
970 0.00025 1,300 0.00025 1,340 0.00025
1,860 0.00050 2,500 0.00050 2,660 0.00050
2,680 0.00075 3,600 0.00075 3,970 0.00075
3,390 0.00100 4,620 0.00100 5,210 0.00100
3,970 0.00125 5,530 0.00125 6,410 0.00125
4,410 0.00150 6,340 0.00150 7,540 0.00150
4,750 0.00175 7,000 0.00175 8,630 0.00175
4,950 0.00200 7,520 0.00200 9,640 0.00200
5,000 0.00225 7,860 0.00225 10,540 0.00225
4,870 0.00250 8,000 0.00250 11,320 0.00250
4,450 0.00275 7,800 0.00275 11,810 0.00275
3,790 0.00300 6,870 0.00300 12,000 0.00294
2,970 0.00325 5,410 0.00325 11,970 0.00300
2,080 0.00351 0 0.00360 11,190 0.00325
0 0.00440 8,970 0.00338
0 0.00360
0.0
3.0
6.0
9.0
12.0
0.000 0.002 0.004 0.006
Str
ess,
ksi
Strain
f'c = 5000 psi f'c = 8000 psi f'c = 12000 psi

Charles Pankow Foundation RGA #04-13
Determination of Yield Strength for Nonprestressed Steel Reinforcement
Final Report – December 31, 2013
Page 31
For a given cross-section and applied axial load, axial force and bending moment equilibrium is
established at approximately 40 points to capture as many pairs of moment and curvature values, thereby
approximating a continuous moment-curvature relationship. For each beam section, applied axial load is
taken to be zero when computing the moment-curvature relationship. The analytical moment strength of
a beam section is taken as the peak bending moment in the resulting moment-curvature relationship. For
each column section, moment-curvature relationships are computed for 40 different applied axial load
levels, equally spaced between zero and the nominal column compression strength computed by code
methodologies, not including the 0.80 strength reduction multiplier meant to account for accidental
eccentricities. The pairs of applied axial load and the maximum moment strength computed from each of
the resulting moment-curvature relationships are combined to form the P-M interaction diagrams for a
column section.
PARAMETRIC STUDIES
The sections considered in the parametric study, including specified minimum materials strengths, are
summarized in Table 2 for beam sections and in Table 3 for column sections. The normalized stress-
strain relationships considered in the study are summarized in Table 5. The parametric study represented
by the cross-sections and stress-strain relationships listed in these tables requires an estimated 16,000
simulations of sectional strength.
Methodology for Examination of Results
For a given combination of cross-section, specified minimum concrete compressive strength, and
specified minimum reinforcement yield strength, three particular calculated strengths are considered
“benchmark” strengths:
The nominal strength of a given cross-section (Mn and Pn), computed according to code-permitted
assumptions.
The design strength of a given cross section (Mn and Pn), computed according to code-permitted
assumptions.
The analytical strength of a given cross-section, computed assuming the EPSH stress-strain
relationship for the reinforcing steel. This analytical strength is considered “benchmark” because the
EPSH reinforcement stress-strain behavior is consistent with that assumed by the code, with the
addition of realistic strain hardening.
The additional analytical “actual” strength computed for a cross-section, using one of the gradually-
yielding RH29, RH22 and RH21 stress-strain relationships (refer to Table 5), represents an analytical best
estimate (or predicted) strength of an actual member reinforced with actual reinforcement that has a
gradually-yielding stress-strain relationship. Comparison of a resulting “RH” analytical strength to the
“benchmark” strengths provides the following information:
Comparison to code-calculated nominal strength represents an analytical prediction that “actual”
sectional strength for a member reinforced with gradually-yielding reinforcement is weaker than, or
stronger than, the sectional strength permitted to be used in accordance with code.
Comparison to EPSH analytical strength represents an analytical prediction of “actual” sectional
strength loss, or strength gain, attributable to a particular gradually-yielding, RH stress-strain
relationship for the reinforcement.
Comparison to code-calculated design strength provides an assessment for the “margin of safety”
provided by a section having reinforcement that exhibits a particular stress-strain relationship.

Charles Pankow Foundation RGA #04-13
Determination of Yield Strength for Nonprestressed Steel Reinforcement
Final Report – December 31, 2013
Page 32
These comparisons are made using the following procedures. One procedure is described for beam
sections, and a second procedure is described for column sections.
Beam Sections. For beam sections, consideration is limited to the range of reinforcement ratio between
min and 0.75b, where min is the minimum reinforcement required by ACI 318 for flexural sections and
b is the balanced reinforcement ratio for a singly-reinforced beam. This is because, in structural design
practice, beams with reinforcement ratios in excess of 0.75b are commonly considered impractical and
economically inefficient, and as a result, are seldom specified.
For the following steps, consider the graphical summary of beam sectional strengths for the representative
case of =8,000 psi and fy=60,000 psi given in Figure 15.
1. For a given value of , find the code-calculated nominal and design sectional strengths.
2. Additionally, for the same value of , find the analytical sectional strengths that are of interest, such
as the sectional strength associated with EPSH reinforcement behavior, and the various RH
reinforcement behaviors.
3. Divide the various analytical strength values by the code nominal strength values, resulting in a
relative strength ratio. Relative ratios greater than 1.0 represent analytical sectional strengths that are
than stronger code-calculated nominal strengths, and ratios less than 1.0 represent analytical sectional
strengths that are weaker than code-calculated nominal strengths.
If relative strength ratios are significantly less than 1.0, an additional comparison can be made between
analytical strength and code design strength, to assess the margin of safety provided by a particular
section.
Column Sections. Relative strengths are quantitatively or qualitatively assessed at three locations on the
P-M interaction curves for the columns, as follows. Representative examples of these locations are
illustrated on Figure 16.
Figure 15. Representative graphical summary of beam sectional strength
results for the case of =8,000 psi and fy=60,000 psi.
0.00
0.10
0.20
0.30
0.40
0.0 1.0 2.0 3.0 4.0 5.0 6.0
Mn
/ f'
cb d
2
Reinforcement Ratio, %
Balance RH29 - 0.50% EUL
Mn per Code RH29 - 0.1% Offset
ΦMn per Code RH29 - 0.2% Offset
EPSH
f'c = 8000 psi
fy = 60 ksi
RH29
ρ

Charles Pankow Foundation RGA #04-13
Determination of Yield Strength for Nonprestressed Steel Reinforcement
Final Report – December 31, 2013
Page 33
1. Quantitative assessment for the case of constant effective eccentricity, e=M/P, that includes the point
of maximum Mn on the nominal strength Pn-Mn interaction curve. This case is selected for
quantitative assessment because it is in the region of the P-M curve where sectional strength results
are most noticeably different for the various reinforcement stress-strain relationships included in the
parametric study.
a. For a given column section, locate the point on the code-based, nominal strength Pn-Mn curve
where the calculated nominal moment is at maximum value. Draw a line passing through the
point of maximum nominal moment on this curve and the origin (P=0, M=0) of the graph, as
illustrated on Figure 16. This line represents a constant effective eccentricity ratio, e=Mn/Pn,
evaluated specifically at the point of maximum Mn on the Pn-Mn interaction curve. Determine the
length along this line between the origin and the intersection of the line with the nominal strength
Pn-Mn curve.
b. Along this same line representing e=Mn/Pn, referring again to Figure 16, find the length between
the origin and the intersection of the line with the various analytical sectional P-M curves that are
of interest, such as the P-M curve associated with EPSH reinforcement behavior, and the curves
associated with the various RH reinforcement behaviors.
c. Divide the lengths associated with the various analytical strength P-M curves by the length
associated with the code nominal strength P-M curve, which produces the relative strength ratio
at the constant eccentricity, e. Relative ratios greater than 1.0 represent analytical “actual”
sectional column strengths that are stronger than code-calculated nominal column strengths, and
ratios less than 1.0 represent analytical “actual” sectional column strengths that are weaker than
code-calculated nominal column strengths.
2. Qualitative assessment for the case where M is the greatest for P=Pn,max (maximum nominal axial
strength permitted by code), comparing the sectional strengths produced using code-based
calculations and the various reinforcement stress-strain relationships included in the parametric study.
Qualitative assessment is used for this case because strength results at this location on the P-M curve
are little affected by the choice of reinforcement stress-strain relationship used for calculating
sectional strength.
Figure 16. Representative graphical summary of column sectional
strength results (for a square column with =8,000 psi, fy=60,000 psi
and =4 percent), illustrating where relative strengths are evaluated.
0.00
0.25
0.50
0.75
1.00
1.25
1.50
0.00 0.05 0.10 0.15 0.20 0.25
P /
f' c
Ag
M / f'cbh2
Nominal Per Code EPSH RH29 - 0.1% Offset
Design Per Code RH29 - 0.50% EUL RH29 - 0.2% Offset
f'c = 8000 psi
ρg = 4.0%
fy = 60 ksi
RH29
Maximum Mn
per Code
Case where M is greatest
for P=Pn,max per Code
Case of constant e=M/P
that includes the point of
maximum Mn per Code
Case where P=0

Charles Pankow Foundation RGA #04-13
Determination of Yield Strength for Nonprestressed Steel Reinforcement
Final Report – December 31, 2013
Page 34
3. Qualitative assessment for the case P=0 (zero applied axial load), comparing the sectional strengths
produced using code-based calculations and the various reinforcement stress-strain relationships
included in the parametric study. Qualitative assessment is used for this case because strength results
at commonly-used longitudinal reinforcement ratios are little affected by the choice of reinforcement
stress-strain relationship used for calculating sectional strength.
If relative strength ratios are significantly less than 1.0, an additional comparison can be made between
analytical strength and code design strength to assess the margin of safety provided by a particular
section. The strength reduction factor, , is considered for this comparison.
Results and Their Examination
The results of the parametric study on beams are presented graphically in Appendix B for beam sections
and in Appendix C for column sections. The examination of these results according to the examination
methodology described immediately above is summarized in Table 7 for beam sections and in Table 8
through Table 10, inclusive, for column sections. Review of the results reveals the following:
Beam Sections
Referring to the summarized results in Table 7 for beam sections, the results of practical interest are those
sections having longitudinal reinforcement quantity in the range of min<<0.75b (approximately), where
min is the minimum flexural reinforcement specified by ACI 318 and b is the balanced reinforcement
ratio. For all beam sections within this range of practical reinforcement ratios, all normalized
reinforcement stress-strain relationships, whether straight bars (EPSH and RH29 relationships) or coiled
bars (RH22 and RH21 relationships), produce analytical “actual” strengths that equaled or exceeded the
corresponding code-calculated nominal sectional strength. Further examination of the results for beam
sections given graphically in Appendix B reveals that, relative to the analytical results provided by the
EPSH relationship, all other normalized stress-strain relationships produce analytical “actual” strengths
that are at least equal to, and often exceeded, the corresponding EPSH analytical “actual” strength.
Column Sections
For column sections, reinforcement ratio =1 and 2 percent are representative of actual column sections.
Column sections with =3 to 8 percent are less commonly-used sections and might be considered less
economical, with =8 percent being the maximum longitudinal reinforcement ratio permitted by code.
For reasons given in the next chapter of this report, the discussion of columns focuses on the RH stress-
strain behaviors associated with the 0.2 percent offset method.
Case of Maximum Mn. Table 8 to Table 10 summarize relative strength results for cases of constant
effective eccentricity, e=M/P, that include the point of maximum Mn on the nominal strength Pn-Mn
interaction curve, calculated in accord with ACI 318-14 Code provisions. Table 8 is for square columns
with =0.8, Table 9 is for rectangular columns with =0.8, and Table 10 is for rectangular columns with
=0.6. These tables give results for reinforcement stress-strain relationships based on all yield
measurement methods included in the parametric study.
Overall, the square columns provide the smallest relative strength ratios of the three different column
sections included in the parametric study, and rectangular columns with =0.6 provide the largest strength
ratios. However, when all parameters other than sectional shape and are held constant, the difference
between strength ratios is relatively small.

Charles Pankow Foundation RGA #04-13
Determination of Yield Strength for Nonprestressed Steel Reinforcement
Final Report – December 31, 2013
Page 35
Table 7. Summarized Results for Parametric Study of Beam Sections
fy
(psi)
(psi)
Reinforcement Ratio
Range of Interest
(Note 1)
Reinforcement Stress-
Strain Relationship
Range of Strength Ratio
Relative to CODE
(Note 2)
60,000
5,000 0.4% < < 2.5%
EPSH
RH 29 - 0.1% Offset
RH 29 - 0.2% Offset
RH 29 - 0.5% EUL
RH 22 - 0.1% Offset
RH 22 - 0.2% Offset
RH 22 - 0.5% EUL
CODE
1.0 - 1.2
1.1 - 1.4
1.0 - 1.3
1.0 - 1.2
1.0 - 1.4
1.0 - 1.3
1.0 - 1.3
1.0 - 1.0
8,000 0.4% < < 3.5%
EPSH
RH 29 - 0.1% Offset
RH 29 - 0.2% Offset
RH 29 - 0.5% EUL
RH 22 - 0.1% Offset
RH 22 - 0.2% Offset
RH 22 - 0.5% EUL
CODE
1.0 - 1.3
1.1 - 1.4
1.0 - 1.4
1.0 - 1.3
1.1 - 1.4
1.0 - 1.3
1.0 - 1.3
1.0 - 1.0
80,000
5,000 0.3% < < 1.7%
EPSH
RH 29 - 0.35% EUL
RH 29 - 0.1% Offset
RH 29 - 0.2% Offset
RH 21 - 0.1% Offset
RH 21 - 0.2% Offset
CODE
1.0 - 1.1
1.1 - 1.4
1.1 - 1.3
1.0 - 1.3
1.1 - 1.4
1.0 - 1.3
1.0 - 1.0
8,000 0.3% < < 2.3%
EPSH
RH 29 - 0.35% EUL
RH 29 - 0.1% Offset
RH 29 - 0.2% Offset
RH 21 - 0.1% Offset
RH 21 - 0.2% Offset
CODE
1.0 - 1.2
1.1 - 1.4
1.1 - 1.4
1.0 - 1.3
1.0 - 1.5
1.0 - 1.4
1.0 - 1.0
Note 1: The lower end value for the range of interest for longitudinal reinforcement ratio, , is approximately
equal to min, the minimum reinforcement requirement for flexural sections, and the upper end value of the
range is approximately equal to 0.75b.
Note 2: The strength ratio is defined as the analytically-predicted sectional strength of the member using a given
reinforcement stress-strain relationship divided by code-calculated nominal sectional strength.
For column sections with concrete strength =5,000 psi and 8,000 psi, the majority of the normalized
gradually-yielding stress-strain relationships produce analytical sectional strengths that are at least
99 percent of the corresponding code-calculated nominal sectional strengths. For column sections with
concrete strength =12,000 psi, however, all code-calculated nominal strengths exceed the analytical
strengths for all stress-strain relationships included in the parametric study.
The overall “worst case” for the gradually-yielding stress-strain relationships normalized to the
0.2 percent offset yield strength is an analytical strength at 93 percent of the code-calculated nominal
strength; this relative strength ratio is limited to columns with reinforcement ratios of =6 and 8 percent.
Examination of the P-M interaction curve for these cases reveals that this relative strength reduction

Charles Pankow Foundation RGA #04-13
Determination of Yield Strength for Nonprestressed Steel Reinforcement
Final Report – December 31, 2013
Page 36
occurs in the column behavior regime where the strength reduction factor, , is compression-controlled,
resulting in =0.65 (for tied columns). More practical column sections with =1 and 2 percent have
analytical strengths not less than 97 percent of code nominal strength, for gradually-yielding stress-strain
relationships normalized to the 0.2 percent offset yield strength.
Comparison relative to sectional strengths provided by the EPSH relationship is also useful. The
0.2 percent offset gradually-yielding relationships provide sectional strengths that range from 92 to
100 percent of the sectional strength provided by EPSH relationships. The “worst case” ratio of
92 percent is a single instance that involves a square column with =8 percent, =5,000 psi, and
fy=60,000 psi. More practical column sections with =1 and 2 percent have analytical strengths not less
Table 8. Summarized Results (Note 1) for Square (=0.8) Column Sections
fy
(psi)
(psi)
Reinforcement
Stress-Strain
Relationship
Longitudinal Reinforcement Ratio, Longitudinal Reinforcement Ratio,
1% 2% 3% 4% 6% 8% 1% 2% 3% 4% 6% 8%
Strength Ratio Relative to CODE (Note 2) Strength Ratio Relative to EPSH (Note 2)
60
,000
(N
ote
3)
5,0
00
EPSH
RH29-0.1% Offset
RH29-0.2% Offset
RH29-0.5% EUL
CODE
1.04
1.03
1.01
1.01
1.00
1.03
1.00
0.99
0.98
1.00
1.03
0.99
0.97
0.96
1.00
1.02
0.98
0.96
0.94
1.00
1.01
0.97
0.94
0.93
1.00
1.01
0.96
0.93
0.91
1.00
1.00
0.98
0.97
0.97
0.96
1.00
0.97
0.95
0.95
0.97
1.00
0.96
0.94
0.93
0.97
1.00
0.96
0.94
0.92
0.98
1.00
0.96
0.93
0.92
0.99
1.00
0.95
0.92
0.90
0.99
8,0
00
EPSH
RH29-0.1% Offset
RH29-0.2% Offset
RH29-0.5% EUL
CODE
1.07
1.07
1.06
1.06
1.00
1.08
1.05
1.03
1.03
1.00
1.06
1.03
1.01
1.00
1.00
1.05
1.02
0.99
0.98
1.00
1.04
1.00
0.98
0.96
1.00
1.04
1.00
0.97
0.95
1.00
1.00
1.00
0.99
0.99
0.93
1.00
0.97
0.96
0.95
0.93
1.00
0.97
0.96
0.94
0.95
1.00
0.97
0.94
0.94
0.95
1.00
0.96
0.94
0.92
0.96
1.00
0.97
0.94
0.92
0.97
12
,000
EPSH
RH29-0.1% Offset
RH29-0.2% Offset
RH29-0.5% EUL
CODE
0.98
0.97
0.97
0.97
1.00
0.99
0.98
0.98
0.97
1.00
0.99
0.97
0.96
0.95
1.00
0.99
0.96
0.94
0.93
1.00
0.99
0.95
0.93
0.92
1.00
1.00
0.95
0.93
0.92
1.00
1.00
0.99
0.99
0.99
1.02
1.00
0.99
0.99
0.98
1.01
1.00
0.97
0.96
0.96
1.01
1.00
0.97
0.95
0.94
1.01
1.00
0.96
0.94
0.93
1.01
1.00
0.96
0.93
0.92
1.00
80
,000
5,0
00
EPSH
RH29-0.35% EUL
RH29-0.1% Offset
RH29-0.2% Offset
CODE
1.04
1.02
1.01
1.00
1.00
1.02
0.99
0.99
0.97
1.00
1.01
0.99
0.98
0.96
1.00
1.01
0.98
0.97
0.95
1.00
1.00
0.96
0.95
0.93
1.00
1.00
0.96
0.95
0.93
1.00
1.00
0.98
0.98
0.97
0.97
1.00
0.98
0.97
0.95
0.98
1.00
0.98
0.97
0.95
0.99
1.00
0.97
0.96
0.94
0.99
1.00
0.96
0.95
0.93
1.00
1.00
0.96
0.96
0.93
1.00
8,0
00
EPSH
RH29-0.35% EUL
RH29-0.1% Offset
RH29-0.2% Offset
CODE
1.07
1.06
1.06
1.06
1.00
1.08
1.07
1.06
1.05
1.00
1.06
1.03
1.03
1.01
1.00
1.03
1.02
1.01
0.99
1.00
1.04
1.01
1.00
0.98
1.00
1.03
0.99
0.98
0.96
1.00
1.00
1.00
1.00
0.99
0.94
1.00
0.99
0.98
0.97
0.92
1.00
0.98
0.97
0.95
0.95
1.00
0.98
0.97
0.95
0.97
1.00
0.98
0.97
0.95
0.96
1.00
0.97
0.96
0.93
0.97
12
,000
EPSH
RH29-0.35% EUL
RH29-0.1% Offset
RH29-0.2% Offset
CODE
0.98
0.97
0.97
0.97
1.00
0.98
0.97
0.97
0.97
1.00
0.99
0.98
0.98
0.97
1.00
0.99
0.97
0.96
0.95
1.00
0.99
0.96
0.95
0.93
1.00
0.99
0.96
0.95
0.93
1.00
1.00
1.00
0.99
0.99
1.02
1.00
0.99
0.98
0.99
1.02
1.00
0.99
0.98
0.98
1.01
1.00
0.98
0.97
0.96
1.01
1.00
0.97
0.96
0.94
1.01
1.00
0.97
0.96
0.94
1.01
Note 1: The strength ratios given in this table are evaluated at constant eccentricity, e=M/P, which specifically
includes the point of maximum Mn on the nominal strength Pn-Mn interaction curve.
Note 2: The strength ratio is defined as the analytically-predicted sectional strength of the member using a given
reinforcement stress-strain relationship divided by either code-calculated nominal sectional strength (CODE
relationship) or elastic-plastic-strain hardening analytical sectional strength (EPSH relationship).
Note 3: The study of fy=60,000 psi reinforcement does not include results associated with the RH 29-0.35% EUL
stress-strain relationship. Nonetheless, results for this relationship can be estimated by averaging the results
associated with the RH 29-0.1% Offset and RH 29-0.2% Offset relationships. This averaging approach is
applicable only to RH 29 relationships with fy=60,000 psi.

Charles Pankow Foundation RGA #04-13
Determination of Yield Strength for Nonprestressed Steel Reinforcement
Final Report – December 31, 2013
Page 37
than 95 percent of that provided by EPSH stress-strain relationships. Again, these relative strength
reductions occur in the column behavior regime where the strength reduction factor, , is compression-
controlled, resulting in =0.65 (for tied columns).
Case Where M is Greatest for P=Pn,max. The case of the location on the column interaction curve where
M is at a maximum for P=Pn,max, which is representatively illustrated on the P-M curve in Figure 16, is
qualitatively assessed by visual examination of the results given graphically in Appendix C. When
comparing the sectional strengths provided by the various stress-strain relationships for reinforcement,
whether EPSH or RH type, little difference is observed for the more practical column sections having
longitudinal reinforcement ratios of =1 and 2 percent. Regardless of reinforcement stress-strain
relationship, column sections with concrete strength =5,000 psi and 8,000 psi and longitudinal
reinforcement ratio ≤4 percent produced analytical sectional strengths in excess of the code-calculated
nominal sectional strengths, whereas column sections with concrete strength =12,000 psi always
produced analytical sectional strengths less than code-calculated nominal strengths, with a minimum
relative strength on the order of 95 percent.
Table 9. Summarized Results (Note 1) for Rectangular (=0.8) Column Sections
fy
(psi)
(psi)
Reinforcement
Stress-Strain
Relationship
Longitudinal Reinforcement Ratio, Longitudinal Reinforcement Ratio,
1% 2% 3% 4% 6% 8% 1% 2% 3% 4% 6% 8%
Strength Ratio Relative to CODE (Note 2) Strength Ratio Relative to EPSH (Note 2)
60
,000
(N
ote
3)
5,0
00
EPSH
RH29-0.1% Offset
RH29-0.2% Offset
RH29-0.5% EUL
CODE
1.05
1.03
1.03
1.02
1.00
1.03
1.00
0.99
0.98
1.00
1.03
0.99
0.98
0.97
1.00
1.03
0.99
0.97
0.96
1.00
1.02
0.97
0.95
0.94
1.00
1.01
0.98
0.95
0.93
1.00
1.00
0.98
0.98
0.97
0.95
1.00
0.97
0.96
0.96
0.97
1.00
0.97
0.95
0.94
0.97
1.00
0.96
0.94
0.93
0.98
1.00
0.95
0.93
0.92
0.98
1.00
0.96
0.94
0.92
0.99
8,0
00
EPSH
RH29-0.1% Offset
RH29-0.2% Offset
RH29-0.5% EUL
CODE
1.07
1.07
1.07
1.06
1.00
1.08
1.06
1.05
1.04
1.00
1.06
1.03
1.02
1.01
1.00
1.06
1.03
1.01
1.00
1.00
1.05
1.01
0.99
0.98
1.00
1.05
1.01
0.98
0.97
1.00
1.00
1.00
1.00
0.99
0.93
1.00
0.98
0.97
0.96
0.92
1.00
0.97
0.96
0.95
0.94
1.00
0.97
0.95
0.94
0.95
1.00
0.96
0.94
0.93
0.95
1.00
0.96
0.94
0.92
0.96
12
,000
EPSH
RH29-0.1% Offset
RH29-0.2% Offset
RH29-0.5% EUL
CODE
0.97
0.97
0.97
0.97
1.00
0.98
0.98
0.98
0.97
1.00
0.99
0.98
0.97
0.96
1.00
1.00
0.97
0.95
0.94
1.00
1.00
0.96
0.94
0.93
1.00
1.00
0.96
0.94
0.93
1.00
1.00
1.00
1.00
0.99
1.03
1.00
1.00
0.99
0.99
1.02
1.00
0.98
0.97
0.97
1.01
1.00
0.97
0.95
0.94
1.00
1.00
0.96
0.94
0.93
1.00
1.00
0.96
0.94
0.93
1.00
80
,000
5,0
00
EPSH
RH29-0.35% EUL
RH29-0.1% Offset
RH29-0.2% Offset
CODE
1.04
1.03
1.03
1.02
1.00
1.02
1.00
0.99
0.98
1.00
1.01
0.99
0.99
0.97
1.00
1.01
0.98
0.98
0.96
1.00
1.00
0.97
0.96
0.94
1.00
1.00
0.96
0.96
0.93
1.00
1.00
0.99
0.99
0.98
0.96
1.00
0.98
0.97
0.96
0.98
1.00
0.98
0.97
0.96
0.99
1.00
0.97
0.96
0.95
0.99
1.00
0.97
0.96
0.94
1.00
1.00
0.96
0.96
0.93
1.00
8,0
00
EPSH
RH29-0.35% EUL
RH29-0.1% Offset
RH29-0.2% Offset
CODE
1.07
1.06
1.06
1.06
1.00
1.07
1.07
1.06
1.06
1.00
1.06
1.04
1.04
1.02
1.00
1.05
1.03
1.02
1.00
1.00
1.04
1.02
1.01
0.99
1.00
1.03
1.00
0.99
0.97
1.00
1.00
1.00
0.99
0.99
0.94
1.00
0.99
0.99
0.99
0.93
1.00
0.98
0.98
0.96
0.94
1.00
0.98
0.97
0.95
0.95
1.00
0.98
0.97
0.95
0.96
1.00
0.97
0.96
0.94
0.97
12
,000
EPSH
RH29-0.35% EUL
RH29-0.1% Offset
RH29-0.2% Offset
CODE
0.97
0.97
0.97
0.97
1.00
0.98
0.97
0.97
0.97
1.00
0.99
0.98
0.98
0.97
1.00
0.99
0.97
0.97
0.96
1.00
1.00
0.96
0.96
0.94
1.00
0.98
0.96
0.95
0.93
1.00
1.00
1.00
1.00
1.00
1.03
1.00
0.99
0.99
0.99
1.02
1.00
0.99
0.99
0.99
1.01
1.00
0.98
0.98
0.96
1.01
1.00
0.97
0.96
0.95
1.00
1.00
0.97
0.97
0.95
1.02
For Notes 1, 2 and 3, refer to notes for Table 8.

Charles Pankow Foundation RGA #04-13
Determination of Yield Strength for Nonprestressed Steel Reinforcement
Final Report – December 31, 2013
Page 38
Table 10. Summarized Results (Note 1) for Rectangular (=0.6) Column Sections
fy
(psi)
(psi)
Reinforcement
Stress-Strain
Relationship
Longitudinal Reinforcement
Ratio,
Longitudinal Reinforcement
Ratio,
1% 2% 1% 2%
Strength Ratio Relative to
CODE (Note 1)
Strength Ratio Relative to
EPSH (Note 1)
60,000
(Note 2) 5,000
EPSH
RH29-0.1%Offset
RH29-0.2% Offset
RH29-0.5% EUL
CODE
1.05
1.05
1.05
1.04
1.00
1.04
1.02
1.01
1.00
1.00
1.00
1.00
1.00
0.99
0.95
1.00
0.98
0.97
0.96
0.96
80,000 5,000
EPSH
RH29-0.35% EUL
RH29-0.1% Offset
RH29-0.2% Offset
CODE
1.06
1.06
1.06
1.06
1.00
1.04
1.04
1.04
1.03
1.00
1.00
1.00
1.00
1.00
0.95
1.00
1.00
1.00
0.99
0.96
For Notes 1, 2 and 3, refer to notes for Table 8.
Case Where P=0. The case of columns with applied axial load P=0 is again qualitatively assessed by
visual examination of the results given graphically in Appendix C. This is the case of pure flexural
behavior in a column without any applied axial force. It is consistently observed that the EPSH stress-
strain relationship provides analytical section strengths that are essentially identical to code-calculated
nominal strengths. With a few particular exceptions, the various RH stress-strain relationships provide
sectional strengths in excess of code-calculated nominal strengths and also greater than the analytical
sectional strength provided by the EPSH relationship. The exceptions occur only for concrete strength
=5,000 psi at the relatively high reinforcement ratios of =6 and 8 percent, which produced a minimum
relative strength on the order of 95 percent.
Additional Observations. As noted previously, column sections with concrete strength =5,000 psi and
=8,000 psi produced analytical sectional strengths typically in excess of the code-calculated nominal
sectional strengths, regardless of reinforcement stress-strain relationship, whereas column sections with
concrete strength =12,000 psi typically produced analytical sectional strengths less than code-calculated
nominal strengths. This observation has no obvious relationship to the measurement method used to
determine yield strength. This observation instead is likely a result of the equivalent rectangular stress
block used to model concrete. Additional discussion of this observation is given later in this report.
Regarding comparisons among beam sections and column sections having different specified yield
strengths for reinforcement, comparing results for sections with fy=60,000 psi with those with
fy=80,000 psi, while holding all other parameters constant, finds that the specified yield strength of
reinforcement has little effect on the calculated relative strength ratio.

Charles Pankow Foundation RGA #04-13
Determination of Yield Strength for Nonprestressed Steel Reinforcement
Final Report – December 31, 2013
Page 39
SUMMARY DISCUSSION AND RECOMMENDATIONS
Recommended Yield Measurement Method
The reassessment of yield measurement methods as reported herein is in part prompted at the request of
CRSI, who encourage a change in the measurement method specified by ACI 318, to allow for
determination of yield strength in modern reinforcement, and to encourage the use of modern
measurement methods in testing laboratories and steel mills. The request is based in part on the
roundhouse nature of the stress-strain curves of coiled bars and of some higher-grade reinforcing steels.
CRSI requested use of the 0.2 percent offset method because it is the most common method used in
industry for steel products in general in the U.S. and for steel reinforcement world-wide. This change
would align the ACI 318 Code with common industry practice.
As described in the examination of parametric study results, given in the immediately-preceding chapter
of this report, beam sections having practical amounts of longitudinal reinforcement are found to have
analytical “actual” strengths that are always in excess of code-calculated nominal strength, even when
reinforced with gradually-yielding reinforcement normalized to the 0.2 percent offset yield strength.
Also as described in the examination of parametric study results, for column sections with concrete
strength =5,000 psi and 8,000 psi, the majority sections with gradually-yielding reinforcement
normalized to the 0.2 percent offset yield strength produce analytical sectional strengths that are at least
99 percent of the corresponding code-calculated nominal sectional strengths. For column sections of any
concrete strength with longitudinal reinforcement at or near the code-permitted maximum ratio of
=8 percent, which results in columns that are considered less-practical actual columns, are found to have
analytical “actual” strengths as low as 93 percent of code nominal strength when reinforced with
gradually-yielding reinforcement, yield strength again measured using the 0.2 percent offset method.
These same column sections provide a strength ratio of 92 percent relative to strength provided by
reinforcement having an elastic-plastic-strain hardening stress-strain relationship.
Interpretation of the column results is complicated by the observation that all column sections with
concrete strength =12,000 psi, regardless of longitudinal reinforcement ratio and stress-strain
relationship, code-calculated nominal strength always exceeds the analytical strength. As discussed later,
this observation suggests that code nominal strengths may be unconservative at higher concrete strengths.
Approximately one-half of the cases where column section relative strengths are 93 percent of code
nominal strength are for sections with =12,000 psi.
An important additional consideration for columns is the likelihood of occurrence of a gradually-yielding
stress-strain relationship in an actual reinforced concrete column member. As described earlier in this
report, stress-strain curves were reviewed for reinforcing bar tensile tests performed under consistent
research laboratory conditions (such as load rate, instrumentation, and operator qualifications) between
approximately 2003 and 2013. It is observed that less than 2 percent of all curves for straight reinforcing
bars exhibit gradually-yielding stress-strain relationships. Coiled steel bar reinforcement is not
considered for columns because the common maximum size of coiled bar is No. 6; consequently, coiled
reinforcement is unlikely to be used as column longitudinal reinforcement.
For column sections, combining all of these considerations (an analytically calculated strength “loss”
associated with gradually-yielding reinforcement that is at most 7 percent of code-calculated nominal
strength; that this “loss” occurs only for less practical sections with high reinforcement ratios that are not
frequently used; and the gradually-yielding reinforcement producing this “loss” is an infrequent

Charles Pankow Foundation RGA #04-13
Determination of Yield Strength for Nonprestressed Steel Reinforcement
Final Report – December 31, 2013
Page 40
occurrence, estimated to be at most a few percent of currently-produced ASTM A615 and A706 bars)
results in a very small likelihood, probably well less than 1 percent, that the analytical “actual” sectional
strength loss of a column will be at most 7 percent. Additionally, the code-specified factor is 0.65 for
these sections, and the further observation that the average actual yield strength of reinforcement is from
1.06 to 1.14 times the specified minimum yield strength (depending upon the grade of reinforcement),
when taken together, provide for an ample margin of safety.
Based on the cumulative consideration of the factors summarized in the preceding paragraphs of this
section, it is, therefore, recommended that the yield measurement method for gradually-yielding
nonprestressed steel reinforcement as specified by ACI 318-14 become the 0.2 percent offset method. As
demonstrated by the findings of the parametric study of sectional strength as reported herein, the change
would not adversely affect the structural safety of reinforced concrete members.
Recommended Code Change
In September 2013, a proposal that yield strength be measured using the 0.2 percent offset method was
submitted to ACI Committee 318 for their consideration as Code Change Submittal CB006 under Ballot
LB 13-6. Code Change Submittal CB006 was approved with amendments on October 23, 2013. A copy
of the as-approved code change submittal is given in Appendix D.
Additional Considerations Related to Yield Measurement Method
This research study was also asked to comment on a limited number of additional topics, based upon the
particular yield measurement method that is recommended by the study.
What percentages of steel bar reinforcement are likely to exhibit “sharply-yielding” stress-strain
behavior versus “gradually-yielding behavior?” As described earlier in this report, coiled steel bar
reinforcement, which always exhibits gradually-yielding behavior, is estimated to comprise less than
4 percent of the production of ASTM A615 and A706 reinforcement, based on mill certificates for heats
produced in 2011 and 2012. Also as described earlier in this report, based on observed stress-strain curves
for straight ASTM A615 and A706 reinforcing bars, recorded under consistent research laboratory
conditions between 2003 and 2013, approximately 2 percent of stress-strain curves are characterized as
having roundhouse shapes. Simple addition of these two percentage values suggests that at most 6 percent
of the ASTM A615 and A706 steel bar reinforcement will be gradually-yielding. In any event, over the
long term, the industry should undertake a comprehensive research program to rigorously establish this
percentage value.
What is the likely effect on actual yield strengths reported by certified mill test reports? Because the
requirements of the various ASTM standards are specified minimum requirements, the reported values
should always exceed the minimum specified requirement, regardless of yield measurement method.
What is the likely effect on the yield strength statistics for nonprestressed reinforcement as used for the
most recent reliability calibration of the ACI 318 Code? Again, because the requirements of the various
ASTM standards are specified minimum requirements, the reported values should always exceed the
minimum specified requirement, regardless of yield measurement method. For reliability analyses,
consideration also extends to two particular parameters, based on analysis of large quantities of yield
strengths for reinforcement as reported on certified mill test reports: the ratio of average of actual values
to specified minimum value (bias factor), and the standard deviation divided by the mean value
(coefficient of variation). These parameters are commonly established on the basis of a straight line fit

Charles Pankow Foundation RGA #04-13
Determination of Yield Strength for Nonprestressed Steel Reinforcement
Final Report – December 31, 2013
Page 41
(standard normal distribution) to the lower tail of a probability plot of the actual data being considered in
the reliability analysis. For the purposes of the probability plot of actual yield strength data for Grade 60
reinforcement, assume that 6 percent of the data point values are for “gradually-yielding” reinforcement,
where the reported yield strength is subject to change due to change of yield measurement method, and
that the magnitude of the change in reported yield strength is likely to be small, say on the order of
5 percent. Given the relatively small proportion of data subject to change, and the relatively small change
of magnitude, the probability plot of actual data is not likely to change significantly, and so the bias and
coefficients of variation derived from the line fit to the lower tail of the plot also will not change
significantly.
The most recent calibrations of the ACI 318 Code (Nowak et al., 2008) examined yield strength data for a
combined pool of ASTM A615 Grade 60 and ASTM A706 Grade 60 reinforcement. For future code
calibrations, the industry should consider examination of yield strengths separately by grade (Grade 60
and Grade 80) and also by type (ASTM A615 versus ASTM A706) within grade.
Any opinions about the effects of the recommended change to yield measurement method on serviceability
concerns? Serviceability concerns relate to the initial, linearly-elastic portion of the stress-strain
relationship of the reinforcement, not to the portion of the stress-strain relationship where yield is
measured. Two parameters define the initial, linear-elastic portion of the stress-strain relationship: the
initial tangent elastic modulus, and the proportional limit. The proportional limit is the point at which the
stress-strain relationship departs from elastic behavior. Thus it is a factor that might be influential on
deflection and cracking of a reinforced concrete flexural member. The yield measurement methods
considered herein are not good methods for regulating the proportional limit, because yield measurement
methods, by intention, assess the reinforcement at strains that are well outside the range of strains
associated with elastic behavior of the reinforcement.
If it is desired to regulate the proportional limit, then a separate requirement should be established to do
so, instead of relying indirectly (and, arguably, ineffectively) on the requirements for measuring yield
strength. One possible approach to this kind of requirement could be the specification of a minimum
stress at the departure of the stress-strain curve from linear-elastic behavior. This could be measured using
the offset method at a sufficiently small offset strain, such as at an offset strain of 0.0001 (0.01 percent).
However, it is not certain whether it is possible to implement this kind of requirement both effectively and
economically within the industry.
A similar argument can also be made regarding regulation of initial tangent elastic modulus by use of the
yield strength measurement requirement. However, for coiled bars in particular, concerns about
apparently low elastic modulus appear to be in part related to strain measurement instrumentation rather
than actual modulus of elasticity. The reader is referred to the related discussion on this topic given
below.
Collateral Observations
The following additional observations do not pertain directly to yield strength and its measurement
methodology, but were nonetheless observed during the course of this study.
Coiled reinforcement and its apparent initial elastic modulus. The normalization of the stress-strain
curves for coiled bars required the use of a “softened” initial elastic modulus to achieve the desired lower
bound fit to the actual stress-strain curves. While it can be argued that the cold-working of the coiling and

Charles Pankow Foundation RGA #04-13
Determination of Yield Strength for Nonprestressed Steel Reinforcement
Final Report – December 31, 2013
Page 42
subsequent straightening processes can reduce the elastic modulus of coiled steel bars from the
commonly-accepted value of 29,000,000 psi for reinforcing steel, closer examination of the actual stress-
strain curves for coiled bars (refer to the graphs in Appendix A identified as coiled bars) reveals
occurrences also of stress-strain curves with an apparent elastic modulus greater than 29,000,000 psi.
There is also much observed variability with the apparent elastic moduli.
These observations suggest that instrumentation and measurement methods used to collect the stress-
strain curves for coiled bars, which were contributed by the industry for this study, influence the visually-
apparent elastic modulus. For example, the straightened coiled bar that is tested is unlikely to be perfectly
straight when mounted in the test machine. Additionally, the extensometer used to record these stress-
strain curves is likely a single extensometer, which will measure bending strains caused by straightening
of the bar under tensile load, in addition to axial strains associated with the tensile load. As a result, the
stress-strain curves recorded in this manner should not be assumed to provide rigorous measurement of
the elastic modulus of reinforcement, whether for coiled reinforcement or for straight reinforcement.
Refer also to related discussion given immediately below.
Recording and collecting stress-strain curves. Steel mills necessarily record stress-strain curves for the
purpose of yield strength determination. The methods and instrumentation used by the industry for this
purpose, however, are not necessarily appropriate for obtaining stress-strain curves to determine elastic
properties, such as modulus of elasticity. Where a rigorous determination of elastic properties is required,
an arrangement of averaging extensometers should be used to measure elongation of the test samples so
that the bending effect of curved or misaligned test samples is minimized. Measurement of the elastic
modulus should conform to the requirements of ASTM E111, “Standard Test Method for Young’s
Modulus, Tangent Modulus, and Chord Modulus.”
Net tensile strain limit for classification as tension-controlled section. Examination of the Mn- curves
for beam sections reinforced with Grade 80 reinforcement (refer to Appendix B) reveals an anomaly in
the slope of the curve for the transition zone between tension-controlled sections and compression-
controlled sections, as compared to the transition zone for sections having Grade 60 reinforcement.
Diagnosis of this anomaly is beyond the scope of this study, but this anomaly probably arises because the
net tensile strain limit for tension controlled sections is specified at the constant value of 0.005 regardless
of grade of reinforcement (refer to Table 21.2.2 in ACI 318-14). While the history of this value has not
been researched for the purposes of this report, this value is likely established on the basis of Grade 60
reinforcement. Consideration should be given to making the tension controlled strain limit a function
of fy. One approach offered for consideration is to establish the tension limit as (ty+0.0025), where
ty=fy/Es. The constant 0.0025 is derived from the recommended yield measurement offset strain value of
0.002 (0.2 percent) plus an additional 0.0005 strain for a “safety margin.”
Rectangular stress-strain block assumption for concrete with high values of . It is observed in this
study that code-calculated nominal strengths for column sections concrete strength =12,000 psi exceed
analytically-predicted “actual” sectional strengths using an elastic-plastic-strain hardening (EPSH) stress-
strain relationship for reinforcement, whereas for column sections with concrete strengths of 5,000 psi
and 8,000 psi, the code-calculated nominal strengths provide a lower-bound to analytical “actual”
strengths. Code nominal strengths for column sections having =12,000 psi are in the range of 1 to
3 percent “unconservative”, whereas for =5,000 psi and 8,000 psi, code nominal strength is in the range
of 1 to 7 percent “conservative”. While detailed examination into this observation is beyond the scope of
the research reported herein, it is possible that the slightly “unconservative” strengths at =12,000 psi
might be related to the code-permitted assumptions for the equivalent rectangular concrete stress

Charles Pankow Foundation RGA #04-13
Determination of Yield Strength for Nonprestressed Steel Reinforcement
Final Report – December 31, 2013
Page 43
distribution at higher concrete strengths. These code-permitted assumptions were developed at a time
when concrete strengths were commonly on the order of 3,000 psi to 6,000 psi, and as a result, they may
not provide an equivalent stress distribution for concrete having compressive strengths on the order of
12,000 psi.
ACKNOWLEDGEMENTS
This research was funded by the Charles Pankow Foundation (CPF), Vancouver, Washington, under
Research Grant Award (RGA) No. 04-13. Wiss, Janney, Elstner Associates, Inc. (WJE), Pasadena,
California, was awarded the grant to perform the research. Conrad Paulson, Principal, was the Principal
Investigator and Project Manager for the research project. Scott K. Graham and Jeff Rautenberg were
Project Engineers. Gary Klein, Executive Vice president, was the WJE Project Advisor.
Professor David Darwin, Ph.D., P.E., the Deane E. Ackers Distinguished Professor and Chair at the
Department of Civil, Environmental and Architectural Engineering, University of Kansas, Lawrence,
Kansas, was retained by CPF as external peer reviewer for the project. The guidance and comments
offered by Prof. Darwin were critical to the success of this project. Prof. Darwin is thanked for his
efforts.
The scope of work for this research is in general accord with the July 2013 mission statement of the
ACI 318B Task Group on Yield Strength Determination for Nonprestressed Steel Reinforcement. This
task group was convened in April 2013 by Catherine French, Chair of ACI 318 Subcommittee B,
Reinforcement and Development. Task Group members include Conrad Paulson (Task Group Chair),
Neal Anderson, David Darwin, David Gustafson, Cary Kopczynski, and Cathy French (ex officio). The
effort of the task group in developing the mission statement that provided the direction for this research
project is acknowledged.
The Concrete Reinforcing Steel Institute (CRSI) coordinated the collection of industry-recorded stress-
strain curves, which were anonymously contributed by several of its producer members. CRSI also
granted access to its database of mill certificate tensile properties data. The industry is thanked for these
contributions.
REFERENCES
American Concrete Institute (ACI) Standards
The following standards published by the American Concrete Institute (ACI), Farmington Hills,
Michigan, are referenced in this report:
“Building Code Requirements for Structural Concrete (ACI 318) and Commentary,” various editions as
follows: ACI 318-63; ACI 318-71, ACI 318-77, ACI 318-89, ACI 318-08, ACI 318-11, and ACI 318-14
(proposed version as of December 2013).
ASTM International Standards
The following standards published by ASTM International (ASTM) are referenced in this report:
ASTM A15-62T, “Tentative Specifications for Billet-Steel Bars for Concrete Reinforcement”
ASTM A370-11, “Standard Test Methods and Definitions for Mechanical Testing of Steel Products”

Charles Pankow Foundation RGA #04-13
Determination of Yield Strength for Nonprestressed Steel Reinforcement
Final Report – December 31, 2013
Page 44
ASTM A615-12, “Standard Specification for Deformed and Plain Carbon-Steel Bars for Concrete
Reinforcement,” and numerous preceding editions issued since 1968
ASTM A706-09b, “Standard Specification for Low-Alloy Steel Deformed and Plain Bars for Concrete
Reinforcement,” and numerous preceding editions issued since 1976
ASTM A955-11, “Standard Specification for Deformed and Plain Stainless-Steel Bars for Concrete
Reinforcement”
ASTM A431-62T, “Tentative Specification for Deformed Billet Steel Bars for Concrete Reinforcement
with 75,000 PSI Minimum Yield Strength
ASTM A432-67, “Deformed Billet Steel Bars for Concrete Reinforcement with 60,000 PSI Minimum
Yield Strength,” and preceding edition A432-62T
ASTM E8-11, “Standard Test Methods for Tension Testing of Metallic Materials”
ASTM E111-2004, “Standard Test Method for Young’s Modulus, Tangent Modulus, and Chord
Modulus”
General References
ACI Committee 408 (2003). “Bond and Development of Straight Reinforcing Bars in Tension,” Report
ACI 408R-03, American Concrete Institute.
Hognestad, E., (1951). “A Study of Combined Bending and Axial Load in Reinforced Concrete
Members,” Bulletin Series No. 399, University of Illinois Engineering Experiment Station, Urbana, Ill.
Pfister, J. F., and E. Hognestad (1964). “High Strength Bars as Concrete Reinforcement, Part 6, Fatigue
Tests,” Journal of the Portland Cement Association, Vol. 6, No. 1 (Jan.).
Mander, J. B., M. J. N. Priestley, and R. Park (1988a). “Theoretical Stress-Strain Model for Confined
Concrete” Journal of Structural Engineering, ASCE, Vol. 114, No. 8, August, pp. 1804-1826.
Mander, J. B., M. J. N. Priestley, and R. Park (1988b). “Observed Stress-Strain Behavior of Confined
Concrete” Journal of Structural Engineering, ASCE, Vol. 114, No. 8, August, pp. 1827-1849.
Nilson, Arthur H., David Darwin, Charles W. Dolan (2010). Design of Concrete Structures, 14th edition,
McGral-Hill, 795 pp.
Nowak, A.S.; Szerszen, M. M.; Szeliga, E.K.; Szwed, A., and Podhorecki, P.J. (2008). Reliability-Based
Calibration for Structural Concrete, Phase 3, SN2849, Portland Cement Association, Skokie, Illinois,
USA, 115 pages.
Wiss, Janney, Elstner and Associates, Inc. (WJE) (1970). “Final Report on Bar Tests for the Committee
of Concrete Reinforcing Bar Producers, American Iron and Steel Institute,” Project No. 70189, April 30.

APPENDIX A - NORMALIZED VERSUS ACTUAL STRESS-STRAIN CURVES

Charles Pankow Foundation RGA #04-13
Determination of Yield Strength for Nonprestressed Steel Reinforcement
Final Report – December 31, 2013
Page A-1
APPENDIX A - NORMALIZED VERSUS ACTUAL STRESS-STRAIN CURVES
0
10
20
30
40
50
60
70
80
90
100
0.00 0.10 0.20 0.30 0.40 0.50 0.60 0.70 0.80 0.90 1.00 1.10 1.20 1.30 1.40 1.50
Str
ess
(ksi
)
Reference Strain (percent)
0.5
%E
UL
GR60 Code
Actual ASTM A615 Grades 60 and 80
Actual ASTM A706 Grades 60 and 80
Normalized CODE and EPSH Grades 60 and 80
Source: [University and WJE]
0.3
5%
EU
L
GR80 Code
0
10
20
30
40
50
60
70
80
90
100
0.00 0.10 0.20 0.30 0.40 0.50 0.60 0.70 0.80 0.90 1.00
Str
ess
(ksi
)
Reference Strain (percent)
0.5
%E
UL
GR60 Code
Actual ASTM A615 Grade 60
Actual ASTM A706 Grade 60
Normalized RH29 Grade 60
Source: [University and WJE]
Ramberg-Osgood Normalized Parameters:
E = 29,000 ksi
o = 60 ksi
o / E) = 0.001 or 0.002 or 0.002931
n = 10
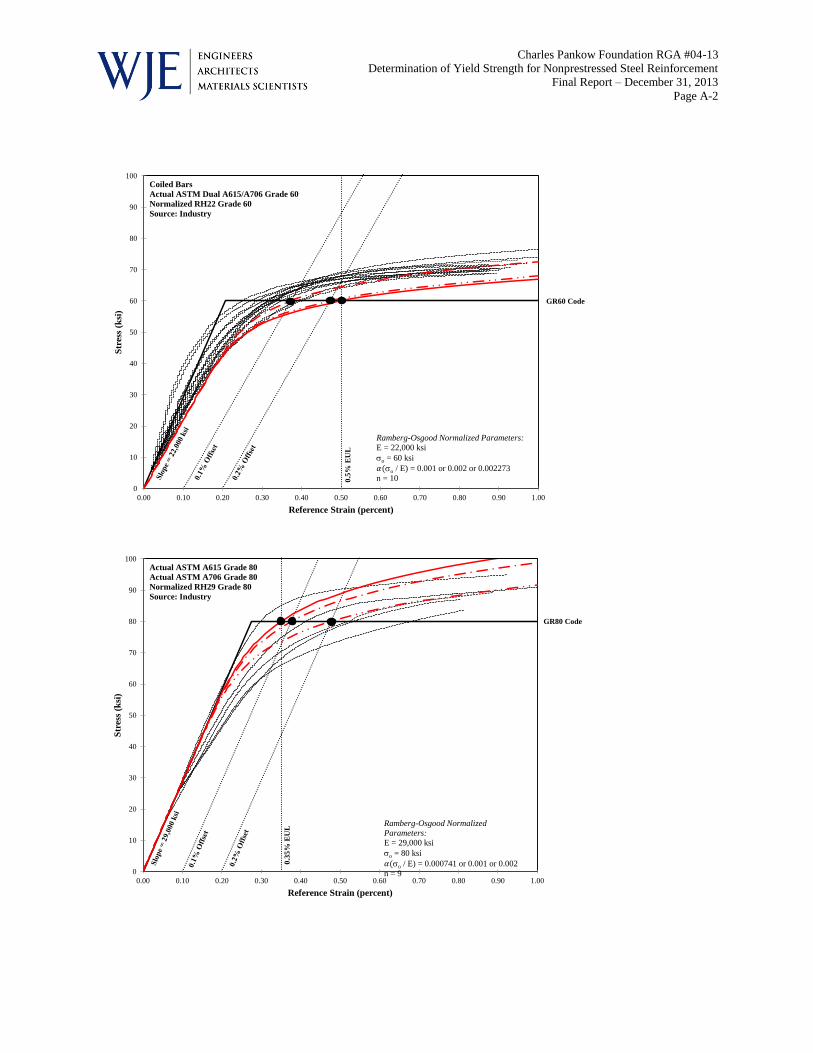
Charles Pankow Foundation RGA #04-13
Determination of Yield Strength for Nonprestressed Steel Reinforcement
Final Report – December 31, 2013
Page A-2
0
10
20
30
40
50
60
70
80
90
100
0.00 0.10 0.20 0.30 0.40 0.50 0.60 0.70 0.80 0.90 1.00
Str
ess
(ksi
)
Reference Strain (percent)
0.5
%E
UL
Ramberg-Osgood Normalized Parameters:
E = 22,000 ksi
o = 60 ksi
o / E) = 0.001 or 0.002 or 0.002273
n = 10
GR60 Code
Coiled Bars
Actual ASTM Dual A615/A706 Grade 60
Normalized RH22 Grade 60
Source: Industry
0
10
20
30
40
50
60
70
80
90
100
0.00 0.10 0.20 0.30 0.40 0.50 0.60 0.70 0.80 0.90 1.00
Str
ess
(ksi
)
Reference Strain (percent)
0.3
5%
EU
L
Ramberg-Osgood Normalized
Parameters:
E = 29,000 ksi
o = 80 ksi
o / E) = 0.000741 or 0.001 or 0.002
n = 9
GR80 Code
Actual ASTM A615 Grade 80
Actual ASTM A706 Grade 80
Normalized RH29 Grade 80
Source: Industry

Charles Pankow Foundation RGA #04-13
Determination of Yield Strength for Nonprestressed Steel Reinforcement
Final Report – December 31, 2013
Page A-3
0
10
20
30
40
50
60
70
80
90
100
0.00 0.10 0.20 0.30 0.40 0.50 0.60 0.70 0.80 0.90 1.00
Str
ess
(ksi
)
Reference Strain (percent)
GR80 Code
Coiled Bars
Actual ASTM Dual A615/A706 Grade 80
Normalized RH21 Grade 80
Source: Industry
Ramberg-Osgood Normalized Parameters:
E = 21,000 ksi
o = 80 ksi
o / E) = 0.001 or 0.002
n = 8
0
10
20
30
40
50
60
70
80
90
100
0.00 0.10 0.20 0.30 0.40 0.50 0.60 0.70 0.80 0.90 1.00
Str
ess
(ksi
)
Reference Strain (percent)
0.5
%E
UL
GR60 Code
Stainless Steel
Actual ASTM A955 Grade 60
Normalized RH29 Grade 60
Source: WJE
Ramberg-Osgood Normalized Parameters:
E = 29,000 ksi
o = 60 ksi
o / E) = 0.001 or 0.002 or 0.002931
n = 10

APPENDIX B - RESULTS OF PARAMETRIC ANALYSES OF BEAM SECTIONS

Charles Pankow Foundation RGA #04-13
Determination of Yield Strength for Nonprestressed Steel Reinforcement
Final Report – December 31, 2013
Page B-1
APPENDIX B - RESULTS OF PARAMETRIC ANALYSES OF BEAM SECTIONS
0.00
0.10
0.20
0.30
0.40
0.0 1.0 2.0 3.0 4.0 5.0 6.0
Mn
/ f'
cb d
2
Reinforcement Ratio, %
Balance RH29 - 0.50% EUL
Mn per Code RH29 - 0.1% Offset
ΦMn per Code RH29 - 0.2% Offset
EPSH
f'c = 5000 psi
fy = 60 ksi
RH29
ρ
0.00
0.10
0.20
0.30
0.40
0.0 1.0 2.0 3.0 4.0 5.0 6.0
Mn
/ f'
cb d
2
Reinforcement Ratio, %
Balance RH22 - 0.50% EUL
Mn per Code RH22 - 0.1% Offset
ΦMn per Code RH22 - 0.2% Offset
EPSH
f'c = 5000 psi
fy = 60 ksi
RH22
ρρ

Charles Pankow Foundation RGA #04-13
Determination of Yield Strength for Nonprestressed Steel Reinforcement
Final Report – December 31, 2013
Page B-2
0.00
0.10
0.20
0.30
0.40
0.0 1.0 2.0 3.0 4.0 5.0 6.0
Mn
/ f'
cb d
2
Reinforcement Ratio, %
Balance RH29 - 0.50% EUL
Mn per Code RH29 - 0.1% Offset
ΦMn per Code RH29 - 0.2% Offset
EPSH
f'c = 8000 psi
fy = 60 ksi
RH29
ρ
0.00
0.10
0.20
0.30
0.40
0.0 1.0 2.0 3.0 4.0 5.0 6.0
Mn
/ f'
cb d
2
Reinforcement Ratio, %
Balance RH22 - 0.50% EUL
Mn per Code RH22 - 0.1% Offset
ΦMn per Code RH22 - 0.2% Offset
EPSH
f'c = 8000 psi
fy = 60 ksi
RH22
ρ

Charles Pankow Foundation RGA #04-13
Determination of Yield Strength for Nonprestressed Steel Reinforcement
Final Report – December 31, 2013
Page B-3
0.00
0.10
0.20
0.30
0.40
0.0 1.0 2.0 3.0 4.0 5.0 6.0
Mn
/ f'
cb d
2
Reinforcement Ratio, %
Balance RH29 - 0.35% EUL
Mn per Code RH29 - 0.1% Offset
ΦMn per Code RH29 - 0.2% Offset
EPSH
f'c = 5000 psi
fy = 80 ksi
RH29
ρ
0.00
0.10
0.20
0.30
0.40
0.0 1.0 2.0 3.0 4.0 5.0 6.0
Mn
/ f'
cb d
2
Reinforcement Ratio, %
Balance EPSH
Mn per Code RH21 - 0.1% Offset
ΦMn per Code RH21 - 0.2% Offset
f'c = 5000 psi
fy = 80 ksi
RH21
ρ

Charles Pankow Foundation RGA #04-13
Determination of Yield Strength for Nonprestressed Steel Reinforcement
Final Report – December 31, 2013
Page B-4
0.00
0.10
0.20
0.30
0.40
0.0 1.0 2.0 3.0 4.0 5.0 6.0
Mn
/ f'
cb d
2
Reinforcement Ratio, %
Balance RH29 - 0.35% EUL
Mn per Code RH29 - 0.1% Offset
ΦMn per Code RH29 - 0.2% Offset
EPSH
f'c = 8000 psi
fy = 80 ksi
RH29
ρ
0.00
0.10
0.20
0.30
0.40
0.0 1.0 2.0 3.0 4.0 5.0 6.0
Mn
/ f'
cb d
2
Reinforcement Ratio, %
Balance EPSH
Mn per Code RH21 - 0.1% Offset
ΦMn per Code RH21 - 0.2% Offset
f'c = 8000 psi
fy = 80 ksi
RH21
ρ

APPENDIX C - RESULTS OF PARAMETRIC ANALYSES OF COLUMN SECTIONS

Charles Pankow Foundation RGA #04-13
Determination of Yield Strength for Nonprestressed Steel Reinforcement
Final Report – December 31, 2013
Page C-1
APPENDIX C - RESULTS OF PARAMETRIC ANALYSES OF COLUMN SECTIONS
0.00
0.25
0.50
0.75
1.00
1.25
1.50
0.00 0.05 0.10 0.15 0.20 0.25
P /
f' c
Ag
M / f'cbh2
Nominal Per Code EPSH RH29 - 0.1% Offset
Design Per Code RH29 - 0.50% EUL RH29 - 0.2% Offset
f'c = 5000 psi
ρg = 1.0%
fy = 60 ksi
RH29
0.00
0.25
0.50
0.75
1.00
1.25
1.50
0.00 0.05 0.10 0.15 0.20 0.25
P /
f' c
Ag
M / f'cbh2
Nominal Per Code EPSH RH29 - 0.1% Offset
Design Per Code RH29 - 0.50% EUL RH29 - 0.2% Offset
f'c = 5000 psi
ρg = 2.0%
fy = 60 ksi
RH29

Charles Pankow Foundation RGA #04-13
Determination of Yield Strength for Nonprestressed Steel Reinforcement
Final Report – December 31, 2013
Page C-2
0.00
0.25
0.50
0.75
1.00
1.25
1.50
0.00 0.05 0.10 0.15 0.20 0.25
P /
f' c
Ag
M / f'cbh2
Nominal Per Code EPSH RH29 - 0.1% Offset
Design Per Code RH29 - 0.50% EUL RH29 - 0.2% Offset
f'c = 5000 psi
ρg = 3.0%
fy = 60 ksi
RH29
0.00
0.25
0.50
0.75
1.00
1.25
1.50
0.00 0.05 0.10 0.15 0.20 0.25
P /
f' c
Ag
M / f'cbh2
Nominal Per Code EPSH RH29 - 0.1% Offset
Design Per Code RH29 - 0.50% EUL RH29 - 0.2% Offset
f'c = 5000 psi
ρg = 4.0%
fy = 60 ksi
RH29

Charles Pankow Foundation RGA #04-13
Determination of Yield Strength for Nonprestressed Steel Reinforcement
Final Report – December 31, 2013
Page C-3
0.00
0.50
1.00
1.50
2.00
0.00 0.10 0.20 0.30 0.40
P /
f'cA
g
M/ f'cbh2
Nominal Per Code EPSH RH29 - 0.1% Offset
Design Per Code RH29 - 0.50% EUL RH29 - 0.2% Offset
f'c = 5000 psiρg = 6.0%fy = 60 ksi
RH29
0.00
0.50
1.00
1.50
2.00
0.00 0.10 0.20 0.30 0.40
P /
f'cA
g
M/ f'cbh2
Nominal Per Code EPSH RH29 - 0.1% Offset
Design Per Code RH29 - 0.50% EUL RH29 - 0.2% Offset
f'c = 5000 psiρg = 8.0%fy = 60 ksi
RH29

Charles Pankow Foundation RGA #04-13
Determination of Yield Strength for Nonprestressed Steel Reinforcement
Final Report – December 31, 2013
Page C-4
0.00
0.25
0.50
0.75
1.00
1.25
1.50
0.00 0.05 0.10 0.15 0.20 0.25
P /
f' c
Ag
M / f'cbh2
Nominal Per Code EPSH RH29 - 0.1% Offset
Design Per Code RH29 - 0.50% EUL RH29 - 0.2% Offset
f'c = 8000 psi
ρg = 1.0%
fy = 60 ksi
RH29
0.00
0.25
0.50
0.75
1.00
1.25
1.50
0.00 0.05 0.10 0.15 0.20 0.25
P /
f' c
Ag
M / f'cbh2
Nominal Per Code EPSH RH29 - 0.1% Offset
Design Per Code RH29 - 0.50% EUL RH29 - 0.2% Offset
f'c = 8000 psi
ρg = 2.0%
fy = 60 ksi
RH29

Charles Pankow Foundation RGA #04-13
Determination of Yield Strength for Nonprestressed Steel Reinforcement
Final Report – December 31, 2013
Page C-5
0.00
0.25
0.50
0.75
1.00
1.25
1.50
0.00 0.05 0.10 0.15 0.20 0.25
P /
f' c
Ag
M / f'cbh2
Nominal Per Code EPSH RH29 - 0.1% Offset
Design Per Code RH29 - 0.50% EUL RH29 - 0.2% Offset
f'c = 8000 psi
ρg = 3.0%
fy = 60 ksi
RH29
0.00
0.25
0.50
0.75
1.00
1.25
1.50
0.00 0.05 0.10 0.15 0.20 0.25
P /
f' c
Ag
M / f'cbh2
Nominal Per Code EPSH RH29 - 0.1% Offset
Design Per Code RH29 - 0.50% EUL RH29 - 0.2% Offset
f'c = 8000 psi
ρg = 4.0%
fy = 60 ksi
RH29

Charles Pankow Foundation RGA #04-13
Determination of Yield Strength for Nonprestressed Steel Reinforcement
Final Report – December 31, 2013
Page C-6
0.00
0.50
1.00
1.50
2.00
0.00 0.10 0.20 0.30 0.40
P /
f'cA
g
M/ f'cbh2
Nominal Per Code EPSH RH29 - 0.1% Offset
Design Per Code RH29 - 0.50% EUL RH29 - 0.2% Offset
f'c = 8000 psiρg = 6.0%fy = 60 ksi
RH29
0.00
0.50
1.00
1.50
2.00
0.00 0.10 0.20 0.30 0.40
P /
f'cA
g
M/ f'cbh2
Nominal Per Code EPSH RH29 - 0.1% Offset
Design Per Code RH29 - 0.50% EUL RH29 - 0.2% Offset
f'c = 8000 psiρg = 8.0%fy = 60 ksi
RH29

Charles Pankow Foundation RGA #04-13
Determination of Yield Strength for Nonprestressed Steel Reinforcement
Final Report – December 31, 2013
Page C-7
0.00
0.25
0.50
0.75
1.00
1.25
1.50
0.00 0.05 0.10 0.15 0.20 0.25
P /
f' c
Ag
M / f'cbh2
Nominal Per Code EPSH RH29 - 0.1% Offset
Design Per Code RH29 - 0.50% EUL RH29 - 0.2% Offset
f'c = 12000 psi
ρg = 1.0%
fy = 60 ksi
RH29
0.00
0.25
0.50
0.75
1.00
1.25
1.50
0.00 0.05 0.10 0.15 0.20 0.25
P /
f' c
Ag
M / f'cbh2
Nominal Per Code EPSH RH29 - 0.1% Offset
Design Per Code RH29 - 0.50% EUL RH29 - 0.2% Offset
f'c = 12000 psi
ρg = 2.0%
fy = 60 ksi
RH29

Charles Pankow Foundation RGA #04-13
Determination of Yield Strength for Nonprestressed Steel Reinforcement
Final Report – December 31, 2013
Page C-8
0.00
0.25
0.50
0.75
1.00
1.25
1.50
0.00 0.05 0.10 0.15 0.20 0.25
P /
f' c
Ag
M / f'cbh2
Nominal Per Code EPSH RH29 - 0.1% Offset
Design Per Code RH29 - 0.50% EUL RH29 - 0.2% Offset
f'c = 12000 psi
ρg = 3.0%
fy = 60 ksi
RH29
0.00
0.25
0.50
0.75
1.00
1.25
1.50
0.00 0.05 0.10 0.15 0.20 0.25
P /
f' c
Ag
M / f'cbh2
Nominal Per Code EPSH RH29 - 0.1% Offset
Design Per Code RH29 - 0.50% EUL RH29 - 0.2% Offset
f'c = 12000 psi
ρg = 4.0%
fy = 60 ksi
RH29

Charles Pankow Foundation RGA #04-13
Determination of Yield Strength for Nonprestressed Steel Reinforcement
Final Report – December 31, 2013
Page C-9
0.00
0.50
1.00
1.50
2.00
0.00 0.10 0.20 0.30 0.40
P /
f'cA
g
M/ f'cbh2
Nominal Per Code EPSH RH29 - 0.1% Offset
Design Per Code RH29 - 0.50% EUL RH29 - 0.2% Offset
f'c = 12000 psiρg = 6.0%fy = 60 ksi
RH29
0.00
0.50
1.00
1.50
2.00
0.00 0.10 0.20 0.30 0.40
P /
f'cA
g
M/ f'cbh2
Nominal Per Code EPSH RH29 - 0.1% Offset
Design Per Code RH29 - 0.50% EUL RH29 - 0.2% Offset
f'c = 12000 psiρg = 8.0%fy = 60 ksi
RH29

Charles Pankow Foundation RGA #04-13
Determination of Yield Strength for Nonprestressed Steel Reinforcement
Final Report – December 31, 2013
Page C-10
0.00
0.25
0.50
0.75
1.00
1.25
1.50
0.00 0.05 0.10 0.15 0.20 0.25
P /
f' c
Ag
M / f'cbh2
Nominal Per Code EPSH RH29 - 0.1% Offset
Design Per Code RH29 - 0.35% EUL RH29 - 0.2% Offset
f'c = 5000 psi
ρg = 1.0%
fy = 80 ksi
RH29
0.00
0.25
0.50
0.75
1.00
1.25
1.50
0.00 0.05 0.10 0.15 0.20 0.25
P /
f' c
Ag
M / f'cbh2
Nominal Per Code EPSH RH29 - 0.1% Offset
Design Per Code RH29 - 0.35% EUL RH29 - 0.2% Offset
f'c = 5000 psi
ρg = 2.0%
fy = 80 ksi
RH29

Charles Pankow Foundation RGA #04-13
Determination of Yield Strength for Nonprestressed Steel Reinforcement
Final Report – December 31, 2013
Page C-11
0.00
0.25
0.50
0.75
1.00
1.25
1.50
0.00 0.05 0.10 0.15 0.20 0.25
P /
f' c
Ag
M / f'cbh2
Nominal Per Code EPSH RH29 - 0.1% Offset
Design Per Code RH29 - 0.35% EUL RH29 - 0.2% Offset
f'c = 5000 psi
ρg = 3.0%
fy = 80 ksi
RH29
0.00
0.25
0.50
0.75
1.00
1.25
1.50
0.00 0.05 0.10 0.15 0.20 0.25
P /
f' c
Ag
M / f'cbh2
Nominal Per Code EPSH RH29 - 0.1% Offset
Design Per Code RH29 - 0.35% EUL RH29 - 0.2% Offset
f'c = 5000 psi
ρg = 4.0%
fy = 80 ksi
RH29

Charles Pankow Foundation RGA #04-13
Determination of Yield Strength for Nonprestressed Steel Reinforcement
Final Report – December 31, 2013
Page C-12
0.00
0.50
1.00
1.50
2.00
0.00 0.10 0.20 0.30 0.40
P /
f'cA
g
M/ f'cbh2
Nominal Per Code EPSH RH29 - 0.1% Offset
Design Per Code RH29 - 0.35% EUL RH29 - 0.2% Offset
f'c = 5000 psiρg = 6.0%fy = 80 ksi
RH29
0.00
0.50
1.00
1.50
2.00
0.00 0.10 0.20 0.30 0.40
P /
f'cA
g
M/ f'cbh2
Nominal Per Code EPSH RH29 - 0.1% Offset
Design Per Code RH29 - 0.35% EUL RH29 - 0.2% Offset
f'c = 5000 psiρg = 8.0%fy = 80 ksi
RH29

Charles Pankow Foundation RGA #04-13
Determination of Yield Strength for Nonprestressed Steel Reinforcement
Final Report – December 31, 2013
Page C-13
0.00
0.25
0.50
0.75
1.00
1.25
1.50
0.00 0.05 0.10 0.15 0.20 0.25
P /
f' c
Ag
M / f'cbh2
Nominal Per Code EPSH RH29 - 0.1% Offset
Design Per Code RH29 - 0.35% EUL RH29 - 0.2% Offset
f'c = 8000 psi
ρg = 1.0%
fy = 80 ksi
RH29
0.00
0.25
0.50
0.75
1.00
1.25
1.50
0.00 0.05 0.10 0.15 0.20 0.25
P /
f' c
Ag
M / f'cbh2
Nominal Per Code EPSH RH29 - 0.1% Offset
Design Per Code RH29 - 0.35% EUL RH29 - 0.2% Offset
f'c = 8000 psi
ρg = 2.0%
fy = 80 ksi
RH29

Charles Pankow Foundation RGA #04-13
Determination of Yield Strength for Nonprestressed Steel Reinforcement
Final Report – December 31, 2013
Page C-14
0.00
0.25
0.50
0.75
1.00
1.25
1.50
0.00 0.05 0.10 0.15 0.20 0.25
P /
f' c
Ag
M / f'cbh2
Nominal Per Code EPSH RH29 - 0.1% Offset
Design Per Code RH29 - 0.35% EUL RH29 - 0.2% Offset
f'c = 8000 psi
ρg = 3.0%
fy = 80 ksi
RH29
0.00
0.25
0.50
0.75
1.00
1.25
1.50
0.00 0.05 0.10 0.15 0.20 0.25
P /
f' c
Ag
M / f'cbh2
Nominal Per Code EPSH RH29 - 0.1% Offset
Design Per Code RH29 - 0.35% EUL RH29 - 0.2% Offset
f'c = 8000 psi
ρg = 4.0%
fy = 80 ksi
RH29

Charles Pankow Foundation RGA #04-13
Determination of Yield Strength for Nonprestressed Steel Reinforcement
Final Report – December 31, 2013
Page C-15
0.00
0.50
1.00
1.50
2.00
0.00 0.10 0.20 0.30 0.40
P /
f'cA
g
M/ f'cbh2
Nominal Per Code EPSH RH29 - 0.1% Offset
Design Per Code RH29 - 0.35% EUL RH29 - 0.2% Offset
f'c = 8000 psiρg = 6.0%fy = 80 ksi
RH29
0.00
0.50
1.00
1.50
2.00
0.00 0.10 0.20 0.30 0.40
P /
f'cA
g
M/ f'cbh2
Nominal Per Code EPSH RH29 - 0.1% Offset
Design Per Code RH29 - 0.35% EUL RH29 - 0.2% Offset
f'c = 8000 psiρg = 8.0%fy = 80 ksi
RH29

Charles Pankow Foundation RGA #04-13
Determination of Yield Strength for Nonprestressed Steel Reinforcement
Final Report – December 31, 2013
Page C-16
0.00
0.25
0.50
0.75
1.00
1.25
1.50
0.00 0.05 0.10 0.15 0.20 0.25
P /
f' c
Ag
M / f'cbh2
Nominal Per Code EPSH RH29 - 0.1% Offset
Design Per Code RH29 - 0.35% EUL RH29 - 0.2% Offset
f'c = 12000 psi
ρg = 1.0%
fy = 80 ksi
RH29
0.00
0.25
0.50
0.75
1.00
1.25
1.50
0.00 0.05 0.10 0.15 0.20 0.25
P /
f' c
Ag
M / f'cbh2
Nominal Per Code EPSH RH29 - 0.1% Offset
Design Per Code RH29 - 0.35% EUL RH29 - 0.2% Offset
f'c = 12000 psi
ρg = 2.0%
fy = 80 ksi
RH29

Charles Pankow Foundation RGA #04-13
Determination of Yield Strength for Nonprestressed Steel Reinforcement
Final Report – December 31, 2013
Page C-17
0.00
0.25
0.50
0.75
1.00
1.25
1.50
0.00 0.05 0.10 0.15 0.20 0.25
P /
f' c
Ag
M / f'cbh2
Nominal Per Code EPSH RH29 - 0.1% Offset
Design Per Code RH29 - 0.35% EUL RH29 - 0.2% Offset
f'c = 12000 psi
ρg = 3.0%
fy = 80 ksi
RH29
0.00
0.25
0.50
0.75
1.00
1.25
1.50
0.00 0.05 0.10 0.15 0.20 0.25
P /
f' c
Ag
M / f'cbh2
Nominal Per Code EPSH RH29 - 0.1% Offset
Design Per Code RH29 - 0.35% EUL RH29 - 0.2% Offset
f'c = 12000 psi
ρg = 4.0%
fy = 80 ksi
RH29

Charles Pankow Foundation RGA #04-13
Determination of Yield Strength for Nonprestressed Steel Reinforcement
Final Report – December 31, 2013
Page C-18
0.00
0.50
1.00
1.50
2.00
0.00 0.10 0.20 0.30 0.40
P /
f'cA
g
M/ f'cbh2
Nominal Per Code EPSH RH29 - 0.1% Offset
Design Per Code RH29 - 0.35% EUL RH29 - 0.2% Offset
f'c = 12000 psiρg = 6.0%fy = 80 ksi
RH29
0.00
0.50
1.00
1.50
2.00
0.00 0.10 0.20 0.30 0.40
P /
f'cA
g
M/ f'cbh2
Nominal Per Code EPSH RH29 - 0.1% Offset
Design Per Code RH29 - 0.35% EUL RH29 - 0.2% Offset
f'c = 12000 psiρg = 8.0%fy = 80 ksi
RH29

Charles Pankow Foundation RGA #04-13
Determination of Yield Strength for Nonprestressed Steel Reinforcement
Final Report – December 31, 2013
Page C-19
0.00
0.25
0.50
0.75
1.00
1.25
1.50
0.00 0.05 0.10 0.15 0.20 0.25
P /
f' c
Ag
M / f'cbh2
Nominal Per Code EPSH RH29 - 0.1% Offset
Design Per Code RH29 - 0.50% EUL RH29 - 0.2% Offset
f'c = 5000 psi
ρg = 1.0%
fy = 60 ksi
RH29
0.00
0.25
0.50
0.75
1.00
1.25
1.50
0.00 0.05 0.10 0.15 0.20 0.25
P /
f' c
Ag
M / f'cbh2
Nominal Per Code EPSH RH29 - 0.1% Offset
Design Per Code RH29 - 0.50% EUL RH29 - 0.2% Offset
f'c = 5000 psi
ρg = 2.0%
fy = 60 ksi
RH29

Charles Pankow Foundation RGA #04-13
Determination of Yield Strength for Nonprestressed Steel Reinforcement
Final Report – December 31, 2013
Page C-20
0.00
0.25
0.50
0.75
1.00
1.25
1.50
0.00 0.05 0.10 0.15 0.20 0.25
P /
f' c
Ag
M / f'cbh2
Nominal Per Code EPSH RH29 - 0.1% Offset
Design Per Code RH29 - 0.50% EUL RH29 - 0.2% Offset
f'c = 5000 psi
ρg = 3.0%
fy = 60 ksi
RH29
0.00
0.25
0.50
0.75
1.00
1.25
1.50
0.00 0.05 0.10 0.15 0.20 0.25
P /
f' c
Ag
M / f'cbh2
Nominal Per Code EPSH RH29 - 0.1% Offset
Design Per Code RH29 - 0.50% EUL RH29 - 0.2% Offset
f'c = 5000 psi
ρg = 4.0%
fy = 60 ksi
RH29

Charles Pankow Foundation RGA #04-13
Determination of Yield Strength for Nonprestressed Steel Reinforcement
Final Report – December 31, 2013
Page C-21
0.00
0.50
1.00
1.50
2.00
0.00 0.10 0.20 0.30 0.40
P /
f'cA
g
M/ f'cbh2
Nominal Per Code EPSH RH29 - 0.1% Offset
Design Per Code RH29 - 0.50% EUL RH29 - 0.2% Offset
f'c = 5000 psiρg = 6.0%fy = 60 ksi
RH29
0.00
0.50
1.00
1.50
2.00
0.00 0.10 0.20 0.30 0.40
P /
f'cA
g
M/ f'cbh2
Nominal Per Code EPSH RH29 - 0.1% Offset
Design Per Code RH29 - 0.50% EUL RH29 - 0.2% Offset
f'c = 5000 psiρg = 8.0%fy = 60 ksi
RH29

Charles Pankow Foundation RGA #04-13
Determination of Yield Strength for Nonprestressed Steel Reinforcement
Final Report – December 31, 2013
Page C-22
0.00
0.25
0.50
0.75
1.00
1.25
1.50
0.00 0.05 0.10 0.15 0.20 0.25
P /
f' c
Ag
M / f'cbh2
Nominal Per Code EPSH RH29 - 0.1% Offset
Design Per Code RH29 - 0.50% EUL RH29 - 0.2% Offset
f'c = 8000 psi
ρg = 1.0%
fy = 60 ksi
RH29
0.00
0.25
0.50
0.75
1.00
1.25
1.50
0.00 0.05 0.10 0.15 0.20 0.25
P /
f' c
Ag
M / f'cbh2
Nominal Per Code EPSH RH29 - 0.1% Offset
Design Per Code RH29 - 0.50% EUL RH29 - 0.2% Offset
f'c = 8000 psi
ρg = 2.0%
fy = 60 ksi
RH29

Charles Pankow Foundation RGA #04-13
Determination of Yield Strength for Nonprestressed Steel Reinforcement
Final Report – December 31, 2013
Page C-23
0.00
0.25
0.50
0.75
1.00
1.25
1.50
0.00 0.05 0.10 0.15 0.20 0.25
P /
f' c
Ag
M / f'cbh2
Nominal Per Code EPSH RH29 - 0.1% Offset
Design Per Code RH29 - 0.50% EUL RH29 - 0.2% Offset
f'c = 8000 psi
ρg = 3.0%
fy = 60 ksi
RH29
0.00
0.25
0.50
0.75
1.00
1.25
1.50
0.00 0.05 0.10 0.15 0.20 0.25
P /
f' c
Ag
M / f'cbh2
Nominal Per Code EPSH RH29 - 0.1% Offset
Design Per Code RH29 - 0.50% EUL RH29 - 0.2% Offset
f'c = 8000 psi
ρg = 4.0%
fy = 60 ksi
RH29

Charles Pankow Foundation RGA #04-13
Determination of Yield Strength for Nonprestressed Steel Reinforcement
Final Report – December 31, 2013
Page C-24
0.00
0.50
1.00
1.50
2.00
0.00 0.10 0.20 0.30 0.40
P /
f'cA
g
M/ f'cbh2
Nominal Per Code EPSH RH29 - 0.1% Offset
Design Per Code RH29 - 0.50% EUL RH29 - 0.2% Offset
f'c = 8000 psiρg = 6.0%fy = 60 ksi
RH29
0.00
0.50
1.00
1.50
2.00
0.00 0.10 0.20 0.30 0.40
P /
f'cA
g
M/ f'cbh2
Nominal Per Code EPSH RH29 - 0.1% Offset
Design Per Code RH29 - 0.50% EUL RH29 - 0.2% Offset
f'c = 8000 psiρg = 8.0%fy = 60 ksi
RH29

Charles Pankow Foundation RGA #04-13
Determination of Yield Strength for Nonprestressed Steel Reinforcement
Final Report – December 31, 2013
Page C-25
0.00
0.25
0.50
0.75
1.00
1.25
1.50
0.00 0.05 0.10 0.15 0.20 0.25
P /
f' c
Ag
M / f'cbh2
Nominal Per Code EPSH RH29 - 0.1% Offset
Design Per Code RH29 - 0.50% EUL RH29 - 0.2% Offset
f'c = 12000 psi
ρg = 1.0%
fy = 60 ksi
RH29
0.00
0.25
0.50
0.75
1.00
1.25
1.50
0.00 0.05 0.10 0.15 0.20 0.25
P /
f' c
Ag
M / f'cbh2
Nominal Per Code EPSH RH29 - 0.1% Offset
Design Per Code RH29 - 0.50% EUL RH29 - 0.2% Offset
f'c = 12000 psi
ρg = 2.0%
fy = 60 ksi
RH29

Charles Pankow Foundation RGA #04-13
Determination of Yield Strength for Nonprestressed Steel Reinforcement
Final Report – December 31, 2013
Page C-26
0.00
0.25
0.50
0.75
1.00
1.25
1.50
0.00 0.05 0.10 0.15 0.20 0.25
P /
f' c
Ag
M / f'cbh2
Nominal Per Code EPSH RH29 - 0.1% Offset
Design Per Code RH29 - 0.50% EUL RH29 - 0.2% Offset
f'c = 12000 psi
ρg = 3.0%
fy = 60 ksi
RH29
0.00
0.25
0.50
0.75
1.00
1.25
1.50
0.00 0.05 0.10 0.15 0.20 0.25
P /
f' c
Ag
M / f'cbh2
Nominal Per Code EPSH RH29 - 0.1% Offset
Design Per Code RH29 - 0.50% EUL RH29 - 0.2% Offset
f'c = 12000 psi
ρg = 4.0%
fy = 60 ksi
RH29

Charles Pankow Foundation RGA #04-13
Determination of Yield Strength for Nonprestressed Steel Reinforcement
Final Report – December 31, 2013
Page C-27
0.00
0.50
1.00
1.50
2.00
0.00 0.10 0.20 0.30 0.40
P /
f'cA
g
M/ f'cbh2
Nominal Per Code EPSH RH29 - 0.1% Offset
Design Per Code RH29 - 0.50% EUL RH29 - 0.2% Offset
f'c = 12000 psiρg = 6.0%fy = 60 ksi
RH29
0.00
0.50
1.00
1.50
2.00
0.00 0.10 0.20 0.30 0.40
P /
f'cA
g
M/ f'cbh2
Nominal Per Code EPSH RH29 - 0.1% Offset
Design Per Code RH29 - 0.50% EUL RH29 - 0.2% Offset
f'c = 12000 psiρg = 8.0%fy = 60 ksi
RH29

Charles Pankow Foundation RGA #04-13
Determination of Yield Strength for Nonprestressed Steel Reinforcement
Final Report – December 31, 2013
Page C-28
0.00
0.25
0.50
0.75
1.00
1.25
1.50
0.00 0.05 0.10 0.15 0.20 0.25
P /
f' c
Ag
M / f'cbh2
Nominal Per Code EPSH RH29 - 0.1% Offset
Design Per Code RH29 - 0.35% EUL RH29 - 0.2% Offset
f'c = 5000 psi
ρg = 1.0%
fy = 80 ksi
RH29
0.00
0.25
0.50
0.75
1.00
1.25
1.50
0.00 0.05 0.10 0.15 0.20 0.25
P /
f' c
Ag
M / f'cbh2
Nominal Per Code EPSH RH29 - 0.1% Offset
Design Per Code RH29 - 0.35% EUL RH29 - 0.2% Offset
f'c = 5000 psi
ρg = 2.0%
fy = 80 ksi
RH29

Charles Pankow Foundation RGA #04-13
Determination of Yield Strength for Nonprestressed Steel Reinforcement
Final Report – December 31, 2013
Page C-29
0.00
0.25
0.50
0.75
1.00
1.25
1.50
0.00 0.05 0.10 0.15 0.20 0.25
P /
f' c
Ag
M / f'cbh2
Nominal Per Code EPSH RH29 - 0.1% Offset
Design Per Code RH29 - 0.35% EUL RH29 - 0.2% Offset
f'c = 5000 psi
ρg = 3.0%
fy = 80 ksi
RH29
0.00
0.25
0.50
0.75
1.00
1.25
1.50
0.00 0.05 0.10 0.15 0.20 0.25
P /
f' c
Ag
M / f'cbh2
Nominal Per Code EPSH RH29 - 0.1% Offset
Design Per Code RH29 - 0.35% EUL RH29 - 0.2% Offset
f'c = 5000 psi
ρg = 4.0%
fy = 80 ksi
RH29

Charles Pankow Foundation RGA #04-13
Determination of Yield Strength for Nonprestressed Steel Reinforcement
Final Report – December 31, 2013
Page C-30
0.00
0.50
1.00
1.50
2.00
0.00 0.10 0.20 0.30 0.40
P /
f'cA
g
M/ f'cbh2
Nominal Per Code EPSH RH29 - 0.1% Offset
Design Per Code RH29 - 0.35% EUL RH29 - 0.2% Offset
f'c = 5000 psiρg = 6.0%fy = 80 ksi
RH29
0.00
0.50
1.00
1.50
2.00
0.00 0.10 0.20 0.30 0.40
P /
f'cA
g
M/ f'cbh2
Nominal Per Code EPSH RH29 - 0.1% Offset
Design Per Code RH29 - 0.35% EUL RH29 - 0.2% Offset
f'c = 5000 psiρg = 8.0%fy = 80 ksi
RH29

Charles Pankow Foundation RGA #04-13
Determination of Yield Strength for Nonprestressed Steel Reinforcement
Final Report – December 31, 2013
Page C-31
0.00
0.25
0.50
0.75
1.00
1.25
1.50
0.00 0.05 0.10 0.15 0.20 0.25
P /
f' c
Ag
M / f'cbh2
Nominal Per Code EPSH RH29 - 0.1% Offset
Design Per Code RH29 - 0.35% EUL RH29 - 0.2% Offset
f'c = 8000 psi
ρg = 1.0%
fy = 80 ksi
RH29
0.00
0.25
0.50
0.75
1.00
1.25
1.50
0.00 0.05 0.10 0.15 0.20 0.25
P /
f' c
Ag
M / f'cbh2
Nominal Per Code EPSH RH29 - 0.1% Offset
Design Per Code RH29 - 0.35% EUL RH29 - 0.2% Offset
f'c = 8000 psi
ρg = 2.0%
fy = 80 ksi
RH29

Charles Pankow Foundation RGA #04-13
Determination of Yield Strength for Nonprestressed Steel Reinforcement
Final Report – December 31, 2013
Page C-32
0.00
0.25
0.50
0.75
1.00
1.25
1.50
0.00 0.05 0.10 0.15 0.20 0.25
P /
f' c
Ag
M / f'cbh2
Nominal Per Code EPSH RH29 - 0.1% Offset
Design Per Code RH29 - 0.35% EUL RH29 - 0.2% Offset
f'c = 8000 psi
ρg = 3.0%
fy = 80 ksi
RH29
0.00
0.25
0.50
0.75
1.00
1.25
1.50
0.00 0.05 0.10 0.15 0.20 0.25
P /
f' c
Ag
M / f'cbh2
Nominal Per Code EPSH RH29 - 0.1% Offset
Design Per Code RH29 - 0.35% EUL RH29 - 0.2% Offset
f'c = 8000 psi
ρg = 4.0%
fy = 80 ksi
RH29

Charles Pankow Foundation RGA #04-13
Determination of Yield Strength for Nonprestressed Steel Reinforcement
Final Report – December 31, 2013
Page C-33
0.00
0.50
1.00
1.50
2.00
0.00 0.10 0.20 0.30 0.40
P /
f'cA
g
M/ f'cbh2
Nominal Per Code EPSH RH29 - 0.1% Offset
Design Per Code RH29 - 0.35% EUL RH29 - 0.2% Offset
f'c = 8000 psiρg = 6.0%fy = 80 ksi
RH29
0.00
0.50
1.00
1.50
2.00
0.00 0.10 0.20 0.30 0.40
P /
f'cA
g
M/ f'cbh2
Nominal Per Code EPSH RH29 - 0.1% Offset
Design Per Code RH29 - 0.35% EUL RH29 - 0.2% Offset
f'c = 8000 psiρg = 8.0%fy = 80 ksi
RH29

Charles Pankow Foundation RGA #04-13
Determination of Yield Strength for Nonprestressed Steel Reinforcement
Final Report – December 31, 2013
Page C-34
0.00
0.25
0.50
0.75
1.00
1.25
1.50
0.00 0.05 0.10 0.15 0.20 0.25
P /
f' c
Ag
M / f'cbh2
Nominal Per Code EPSH RH29 - 0.1% Offset
Design Per Code RH29 - 0.35% EUL RH29 - 0.2% Offset
f'c = 12000 psi
ρg = 1.0%
fy = 80 ksi
RH29
0.00
0.25
0.50
0.75
1.00
1.25
1.50
0.00 0.05 0.10 0.15 0.20 0.25
P /
f' c
Ag
M / f'cbh2
Nominal Per Code EPSH RH29 - 0.1% Offset
Design Per Code RH29 - 0.35% EUL RH29 - 0.2% Offset
f'c = 12000 psi
ρg = 2.0%
fy = 80 ksi
RH29

Charles Pankow Foundation RGA #04-13
Determination of Yield Strength for Nonprestressed Steel Reinforcement
Final Report – December 31, 2013
Page C-35
0.00
0.25
0.50
0.75
1.00
1.25
1.50
0.00 0.05 0.10 0.15 0.20 0.25
P /
f' c
Ag
M / f'cbh2
Nominal Per Code EPSH RH29 - 0.1% Offset
Design Per Code RH29 - 0.35% EUL RH29 - 0.2% Offset
f'c = 12000 psi
ρg = 3.0%
fy = 80 ksi
RH29
0.00
0.25
0.50
0.75
1.00
1.25
1.50
0.00 0.05 0.10 0.15 0.20 0.25
P /
f' c
Ag
M / f'cbh2
Nominal Per Code EPSH RH29 - 0.1% Offset
Design Per Code RH29 - 0.35% EUL RH29 - 0.2% Offset
f'c = 12000 psi
ρg = 4.0%
fy = 80 ksi
RH29

Charles Pankow Foundation RGA #04-13
Determination of Yield Strength for Nonprestressed Steel Reinforcement
Final Report – December 31, 2013
Page C-36
0.00
0.50
1.00
1.50
2.00
0.00 0.10 0.20 0.30 0.40
P /
f'cA
g
M/ f'cbh2
Nominal Per Code EPSH RH29 - 0.1% Offset
Design Per Code RH29 - 0.35% EUL RH29 - 0.2% Offset
f'c = 12000 psiρg = 6.0%fy = 80 ksi
RH29
0.00
0.50
1.00
1.50
2.00
0.00 0.10 0.20 0.30 0.40
P /
f'cA
g
M/ f'cbh2
Nominal Per Code EPSH RH29 - 0.1% Offset
Design Per Code RH29 - 0.35% EUL RH29 - 0.2% Offset
f'c = 12000 psiρg = 8.0%fy = 80 ksi
RH29

Charles Pankow Foundation RGA #04-13
Determination of Yield Strength for Nonprestressed Steel Reinforcement
Final Report – December 31, 2013
Page C-37
0.00
0.25
0.50
0.75
1.00
1.25
1.50
0.00 0.05 0.10 0.15 0.20 0.25
P /
f' c
Ag
M / f'cbh2
Nominal Per Code EPSH RH29 - 0.1% Offset
Design Per Code RH29 - 0.50% EUL RH29 - 0.2% Offset
f'c = 5000 psi
ρg = 1.0%
fy = 60 ksi
RH29
0.00
0.25
0.50
0.75
1.00
1.25
1.50
0.00 0.05 0.10 0.15 0.20 0.25
P /
f' c
Ag
M / f'cbh2
Nominal Per Code EPSH RH29 - 0.1% Offset
Design Per Code RH29 - 0.50% EUL RH29 - 0.2% Offset
f'c = 5000 psi
ρg = 2.0%
fy = 60 ksi
RH29

Charles Pankow Foundation RGA #04-13
Determination of Yield Strength for Nonprestressed Steel Reinforcement
Final Report – December 31, 2013
Page C-38
0.00
0.25
0.50
0.75
1.00
1.25
1.50
0.00 0.05 0.10 0.15 0.20 0.25
P /
f' c
Ag
M / f'cbh2
Nominal Per Code EPSH RH29 - 0.1% Offset
Design Per Code RH29 - 0.35% EUL RH29 - 0.2% Offset
f'c = 5000 psi
ρg = 1.0%
fy = 80 ksi
RH29
0.00
0.25
0.50
0.75
1.00
1.25
1.50
0.00 0.05 0.10 0.15 0.20 0.25
P /
f' c
Ag
M / f'cbh2
Nominal Per Code EPSH RH29 - 0.1% Offset
Design Per Code RH29 - 0.35% EUL RH29 - 0.2% Offset
f'c = 5000 psi
ρg = 2.0%
fy = 80 ksi
RH29
APPENDIX D - ACI 318 CODE CHANGE SUBMITTAL

Charles Pankow Foundation RGA #04-13
Determination of Yield Strength for Nonprestressed Steel Reinforcement
Final Report – December 31, 2013
Page D-1
APPENDIX D - ACI 318 CODE CHANGE SUBMITTAL
NOTE: The code change submittal given below is the final version of the submittal as approved by ACI
Committee 318, during the meeting held on October 23, 2013 in Phoenix, Arizona.
ACI 318 TECHNICAL CHANGE SUBMITTAL (CB006/LB 13-6)
Subject: Code Change for Yield Measurement Method
Code Sections (ACI 318-14): 20.2.1.2, 20.2.1.2.1, 20.2.1.6.1, R20.2.1.2, R20.2.1.2.1, R20.2.1.6.1
Reason for Change: To revise the method by which ACI 318 defines the yield stress of steel
reinforcement for Grades 60, 75 and 80.
Background: The yield measurement methodology specified by ACI 318 Code was established in 1970,
on the basis of actual shapes of the stress-strain curves for Grade 60 and Grade 75 steel bar reinforcement
as manufactured in the late 1960s. Given that Grade 80 steel bar reinforcement is now being
manufactured, and that other types of nonprestressed steel reinforcement are now permitted by the Code,
a comprehensive reassessment was undertaken. The reassessment was driven in part by a request from
CRSI to redefine the method by which yield stress is defined for modern reinforcement and using modern
measurement methods currently available in testing laboratories. CRSI requested use of the 0.2 percent
offset method because it is the most common method used in industry for steel products in general. This
change would align the ACI 318 Code with common industry practice. The request is based on the round-
house nature of the stress-strain curves of coiled bars and of some higher-grade steels. Additionally, the
current 0.35 percent strain method is an impediment to the development of higher strength reinforcing
steels, because the 0.35 percent proof strain becomes unduly restrictive at specified yield strengths greater
than Grade 75; this has limited current production of Grade 80 reinforcement, and effective blocks further
development of carbon steel reinforcement beyond Grade 80. The reassessment was also urged by the
Charles Pankow Foundation (CPF), which has interest in leading a major research effort on use of higher
strength reinforcement, for the purpose of extending the range of reinforcement permitted by ACI 318.
A task group (TG) was formed under ACI 318B to reassess yield measurement methodologies in light of
the actual stress-strain behavior of currently-produced nonprestressed steel reinforcement products. The
TG developed a mission statement with a comprehensive list of tasks to be performed for the
reassessment. The Charles Pankow Foundation (CPF) commissioned the firm of Wiss, Janney, Elstner
Associates, Inc. (WJE), to implement the tasks and to prepare a report on the reassessment. The
reassessment was led by Conrad Paulson, Member of ACI 318B and Chair of the yield measurement TG.
Gary Klein, Member of ACI 318, 318C and 318E, was the WJE internal advisor, and David Darwin,
Member of ACI 318B, was retained by CPF as external peer reviewer. The reassessment is complete and
the final report is available (refer to reference cited in proposed commentary change). The lead author is
committed to preparing a technical journal article for the reassessment.
The reassessment examined actual stress-strain curves for ASTM A615 (Grade 60, Grade 75 and Grade
80), A706 (Grade 60 and Grade 80), straight bars and coiled bars, and A955 (Grade 60). Actual curves
were characterized as sharply-yielding or gradually-yielding, and normalized stress-strain relationships
were developed for Grade 60 and Grade 80 reinforcement, both sharply-yielding and gradually-yielding,
based on observed actual stress-strain behavior. A series of normalized, gradually-yielding relationships
were developed, with one relationship developed for each of the different yield measurement methods

Charles Pankow Foundation RGA #04-13
Determination of Yield Strength for Nonprestressed Steel Reinforcement
Final Report – December 31, 2013
Page D-2
(0.35% EUL, 0.50% EUL, 0.1% offset, and 0.2% offset) being considered for each of Grade 60 and
Grade 80. As used here, “normalized” means that the gradually-yielding stress-strain curve develops
exactly the specified yield strength when yield is measured according to the method being considered.
Sharply-yielding, normalized stress-strain relationships that included realistic strain hardening were also
developed, as also were gradually-yielding stress-strain curves with softened initial elastic modulus to
represent coiled reinforcing bars.
These various normalized stress-strain relationships for both Grade 60 and Grade 80 reinforcement were
included in a parametric study that performed analytical predictions of “actual” sectional strength for
numerous beams and columns. Beam sections considered were singly-reinforced with longitudinal =0%
to =6% by 0.5% increments and additionally at b, and =5,000 psi and 8,000 psi. The beam studies
also considered the softened gradually-yielding stress-strain relationships for coiled bars. Column sections
considered had: longitudinal reinforcement uniformly distributed across all faces; values for longitudinal
=1%, 2%, 3%, 4%, 6% and 8%; square shapes with =0.8 and rectangular shapes (2:1 aspect ratio) with
=0.8; and concrete =5,000 psi, 8,000 psi, and 12,000 psi. A limited consideration was given to a
rectangular shape (2:1 aspect ratio) with =0.6, =1% and 2%, and =5,000 psi.
The parametric analytical sectional strength calculations were based on strain compatibility and
equilibrium methods, and employed a non-linear stress-strain relationship for concrete. Moment
capacities, including the moment values for P-M interaction curves of columns, were established as the
maximum value extracted from the moment-curvature curve for a given section under a given axial load
(beams assumed to have zero axial load). Results were presented graphically in the form of versus
moment curves for beams, and P-M interaction curves for columns.
Also included in the parametric study were code-based nominal sectional strengths and design
(×nominal) sectional strengths. Nominal strengths were based on the assumptions permitted in Section
9.2 of ACI 318-14. Code-based nominal and design strengths were plotted as curves on the same graphs
as the analytical “actual” sectional strengths for comparative purposes.
For beam sections, the results of practical interest are those sections having longitudinal reinforcement
quantity in the range of 0.3%<<0.75b (approximately). For all beam sections within this range of
practical reinforcement ratios, all normalized reinforcement stress-strain relationships (including those
stress-strain relationships normalized to the 0.2% offset yield strength, whether straight bars or coiled
bars) provided predicted analytical “actual” strengths that equaled or exceeded the corresponding code-
calculated nominal sectional strength.
Column sections of practical interest have longitudinal =1% and =2%, while a section reinforced at
=4% or greater is heavily-reinforced and might be considered less economical. For commonly-used
column sections having =1% and =2%, the lowest analytical strengths were 97 percent of code-
calculated nominal strength for stress-strain relationships normalized to the 0.2% offset yield strength.
The overall “worst case” (for stress-strain relationships normalized to the 0.2% offset yield strength) had
analytical strengths at 93 percent of code-calculated nominal strength; this 7 percent relative strength
reduction is limited to nine cases involving columns with the larger reinforcement ratios of =6% and
=8%. Examination of the P-M interaction curves for these cases reveals that these relative strength
reductions occur in the column behavior regime where the strength reduction factor, , is compression-
controlled, resulting in =0.65 for tied columns.

Charles Pankow Foundation RGA #04-13
Determination of Yield Strength for Nonprestressed Steel Reinforcement
Final Report – December 31, 2013
Page D-3
An important additional consideration is the likelihood of occurrence of a gradually-yielding stress-strain
relationship in an actual reinforced concrete member. Two sources of information were considered in
assessing this likelihood: one source identifying quantities of coiled steel reinforcing bar, and another
source characterizing shapes of stress-strain curves for straight (never coiled) steel reinforcing bar. It is
well-known that coiled reinforcement is always gradually-yielding. The authors of the reassessment
study were given access to the CRSI database of certified mill test report data for the production years of
2011 and 2013. For ASTM A615 Grade 60 and A706 Grade 60 reinforcement, this database includes
entries for approximately 131,700 mill test reports. Of these 131,700 reports, approximately 1,100
reports are for coiled bar products. This represents less than 1 percent of production of steel bar
reinforcement. Another source of information is observed shape of stress-strain curves on tensile tests
performed under consistent research laboratory conditions (such as load rate, instrumentation, and
operator qualifications) at the WJE laboratories between approximately 2003 and 2013. For
approximately 200 samples of ASTM A615 and A706 reinforcement of Grades 60, 75 and 80 that were
tested, less than 2 percent of all curves exhibited gradually-yielding stress-strain relationships.
Combining these two independent observations, it can be concluded that approximately 3 percent1 of
ASTM A615 and A706 steel reinforcing bars as currently being produced might exhibit a gradually-
yielding stress-strain relationship.
As summarized earlier in this background matter, beam members were found to have predicted analytical
strengths that were always in excess of code-calculated nominal strength, even when reinforced with
gradually-yielding reinforcement.
Also as summarized earlier, only certain heavily-reinforced sections (=6% and 8%, those that would be
less-practical actual columns) were found to have predicted strengths as low as 93 percent of code
nominal strength when reinforced with gradually-yielding reinforcement. Combing these two
considerations (a less practical section that is not frequently used, and a predicted strength “loss” that is at
most 7 percent) with the further observation that gradually-yielding reinforcement is an infrequent
occurrence (estimated to be at most a few percent of currently-produced ASTM A615 and A706 bars),
results in a very small likelihood, probably well less than 1 percent, that the predicted “actual” strength
loss of a column will be at most 7 percent. Additionally, the code-specified factor for these sections is
typically =0.65, providing for a still ample margin of safety.
On this basis, therefore, it is proposed that the yield measurement method for gradually-yielding
nonprestressed steel reinforcement become the offset method using an offset of 0.2 percent. The
0.2 percent method is selected because it is the most common method used in the steel products
manufacturing industry. This change would align the ACI 318 Code with common industry practice,
while at the same time the change would not affect the safety of reinforced concrete structures.
Ballot Results: This change proposal has not been previously balloted.
Code Changes:
Insert a new Section 20.2.1.2, before existing Section 20.2.1.2:
1 Subsequent to the approval of the code change provision given here, revised statistics of mill test reports as
summarized on Page 20 find that coiled bars make up approximately 4 percent of all heats produced during 2011
and 2012, leading to a revised finding that approximately 6 percent of ASTM A615 and A706 steel reinforcing bars
might exhibit a gradually-yielding stress-strain relationship.

Charles Pankow Foundation RGA #04-13
Determination of Yield Strength for Nonprestressed Steel Reinforcement
Final Report – December 31, 2013
Page D-4
20.2.1.2 — Yield strength of nonprestressed bars and wires shall be determined by either (a) or (b):
(a) the offset method, using an offset of 0.2 percent; or
(b) the yield point by the halt -of-force method, provided the nonprestrssed bar or wire has a
sharp-kneed or well-defined type of yield point.
Delete existing Code Sections 20.2.1.2.1 and 20.2.1.6.1.
Renumber existing Code Sections 20.2.1.2, 20.1.2.3, 20.2.1.4, 20.2.1.5 and 20.2.1.6 and their sub-
sections.
Within the Chapter 2 definition for “yield strength”, change the referenced Code section from 3.5 to
20.2.1.2.
Commentary Changes:
Insert new Commentary Section R20.2.1.2:
R20.2.1.2 - The majority of nonprestressed steel bar reinforcement exhibits actual stress-strain behavior
that is sharply yielding or sharp-kneed (elasto-plastic stress-strain behavior). However, reinforcement
products such as bars of higher strength grade, steel wire, coiled steel bar, and stainless steel bars and
wire, generally do not exhibit sharply-yielding stress-strain behavior, but instead are gradually-yielding.
The method used to measure yield strength of reinforcement needs to provide for both types of
reinforcement stress-strain relationships.
A study20.XX
considering reinforcement manufactured during 2008 through 2012 found that the offset
method, using an offset of 0.2%, provides for a reasonable estimate of the strength of reinforced concrete
structures.
The yield strength is determined by the manufacturer during tensile tests performed at the mill on samples
of reinforcement. Test methods for determining yield strength of steel, including the offset method and
yield point by halt-of-force method, are referenced in the ASTM standards for nonprestressed bars and
wire.
Delete existing Commentary R20.2.1.2.1 and Commentary R20.2.1.6.1.
Renumber existing Commentary Sections R20.2.1.2, R20.1.2.3, R20.2.1.5 and R20.2.1.6 and their sub-
sections.
Add the following reference2 to Commentary References:
20.XX. Paulson, C.; Graham, S.K.; and Rautenberg, J.M., “Determination of Yield Strength for
Nonprestressed Steel Reinforcement,” Charles Pankow Foundation RGA #04-13, WJE No. 2013.4171,
Wiss, Janney, Elstner Associates, Inc., Pasadena, California, October 2, 2013, 88 pp.
2 The referenced report dated October 2, 2013 has been superseded by the present report dated December 31, 2013.