30 - NELSON MANDELA BAY MUNICIPALITY 71 2 20130001.pdf1,170,470817,065 817,065 1,170,470507,590...
13
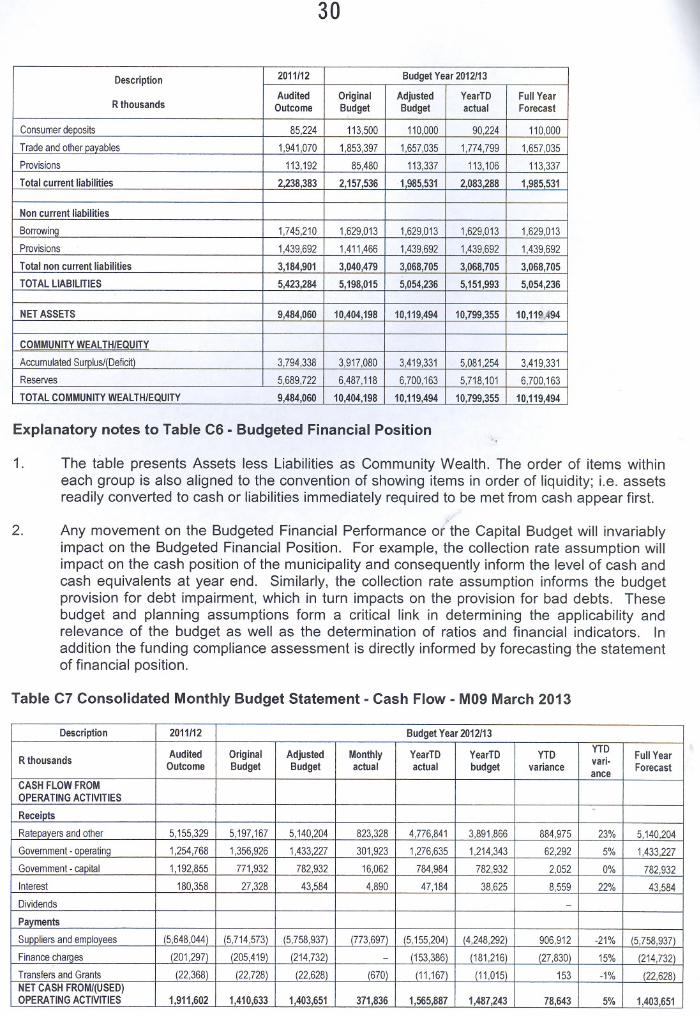
30 Description 2011/12 Budget Year 2012/13 Original Adjusted YearTD Full Year Outcome Budget Budget actual Forecast 85,224 113,500 110,000 90,224 110,000 1,941,070 1,853,397 1,657,035 1,774,799 1,657,035 113,192 85,480 113,337 113,106 113,337 2,238,383 2,157,536 1,985,531 2,083,288 1,985,531 Borrowing 1,745,210 1,629,013 1,629,013 1,629,013 1,629,013 1,439,692 1,411,466 1,439,692 1,439,692 1,439,692 3,184,901 3,040,479 3,068,705 3,068,705 3,068,705 5,423,284 5,198,015 5,054,236 5,151,993 5,054,236 9,484,060 10,404,198 10,119,494 10,799,355 10,119.494 Accumulated Surplus/(Deficit) 3,794,338 3,917,080 3,419,331 5,081,254 3,419,331 5,689,722 6,487,118 6,700,163 5,718,101 6,700,163 9,484,060 10,404,198 10,119,494 10,799,355 10,119,494 Explanatory notes to Table C6 - Budgeted Financial Position 1. The table presents Assets less Liabilities as Community Wealth. The order of items within each group is also aligned to the convention of showing items in order of liquidity; i.e. assets readily converted to cash or liabilities immediately required to be met from cash appear first. ;: 2. Any movement on the Budgeted Financial Performance or the Capital Budget will invariably impact on the Budgeted Financial Position. For example, the collection rate assumption will impact on the cash position of the municipality and consequently inform the level of cash and cash equivalents at year end. Similarly, the collection rate assumption informs the budget provision for debt impairment, which in turn impacts on the provision for bad debts. These budget and planning assumptions form a critical link in determining the applicability and relevance of the budget as well as the determination of ratios and financial indicators. In addition the funding compliance assessment is directly informed by forecasting the statement of financial position. Table C7 Consolidated Monthly Budget Statement - Cash Flow - M09 March 2013 Description 2011/12 Budget Year 2012/13 Original Adjusted Monthly YearTD YearTD YTD YTD Full Year Outcome Budget Budget actual actual budget variance vari· Forecast OPERATING ACTIVITIES - Ratepayers and other 5,155,329 5,197,167 5,140,204 823,328 4,776,841 3,891,866 884,975 23% 5,140,204 1,254,768 1,356,926 1,433,227 301,923 1,276,635 1,214,343 62,292 5% 1,433,227 1,192,855 771,932 782,932 16,062 784,984 782,932 2,052 0% 782,932 180,358 27,328 43,584 4,890 47,184 38,625 8,559 22% 43,584 - Suppliers and employees (5,648,044) (5,714,573) (5,758,937) (773,697) (5,155,204) (4,248,292) 906,912 -21% (5,758,937) (201,297) (205,419) (214,732) - (153,386) (181,216) (27,830) 15% (214,732) (22,368) (22,728) (22,628) (670) (11,167) (11,015) 153 -1% (22,6281 OPERATING ACTIVITIES 1,911,602 1,410,633 1,403,651 371,836 1,565,887 1,487,243 78,643 5% 1,403,651
Transcript of 30 - NELSON MANDELA BAY MUNICIPALITY 71 2 20130001.pdf1,170,470817,065 817,065 1,170,470507,590...
30
Description2011/12
Budget Year 2012/13
Audited
OriginalAdjustedYearTDFull YearR thousands OutcomeBudgetBudgetactualForecast
Consumer deposits
85,224113,500110,00090,224110,000
Trade and other payables
1,941,0701,853,3971,657,0351,774,7991,657,035
Provisions
113,19285,480113,337113,106113,337
Total current liabilities
2,238,3832,157,5361,985,5312,083,2881,985,531
Non current liabilitiesBorrowing
1,745,2101,629,0131,629,0131,629,0131,629,013
Provisions
1,439,6921,411,4661,439,6921,439,6921,439,692
Tolal non current liabilities
3,184,9013,040,4793,068,7053,068,7053,068,705
TOTAL LIABILITIES
5,423,2845,198,0155,054,2365,151,9935,054,236~NET ASSETS
9,484,06010,404,19810,119,49410,799,35510,119.494
COMMUNITY WEALTH/EQUITY
Accumulated Surplus/(Deficit)
3,794,3383,917,0803,419,3315,081,2543,419,331
Reserves
5,689,7226,487,1186,700,1635,718,1016,700,163
TOTAL COMMUNITY WEALTH/EQUITY
9,484,06010,404,19810,119,49410,799,35510,119,494
Explanatory notes to Table C6 - Budgeted Financial Position
1. The table presents Assets less Liabilities as Community Wealth. The order of items withineach group is also aligned to the convention of showing items in order of liquidity; i.e. assetsreadily converted to cash or liabilities immediately required to be met from cash appear first.
;:
2. Any movement on the Budgeted Financial Performance or the Capital Budget will invariablyimpact on the Budgeted Financial Position. For example, the collection rate assumption willimpact on the cash position of the municipality and consequently inform the level of cash andcash equivalents at year end. Similarly, the collection rate assumption informs the budgetprovision for debt impairment, which in turn impacts on the provision for bad debts. Thesebudget and planning assumptions form a critical link in determining the applicability andrelevance of the budget as well as the determination of ratios and financial indicators. Inaddition the funding compliance assessment is directly informed by forecasting the statementof financial position.
Table C7 Consolidated Monthly Budget Statement - Cash Flow - M09 March 2013
Description 2011/12 Budget Year 2012/13
Audited
OriginalAdjustedMonthlyYearTDYearTDYTDYTD
Full YearR thousands OutcomeBudgetBudgetactualactualbudgetvariancevari·
ForecastanceCASH FLOW FROM OPERATING ACTIVITIES -Receipts
Ratepayers and other
5,155,3295,197,1675,140,204823,3284,776,8413,891,866884,97523%5,140,204
Govemment - operating
1,254,7681,356,9261,433,227301,9231,276,6351,214,34362,2925%1,433,227
Government - capital
1,192,855771,932782,93216,062784,984782,9322,0520%782,932
Interest
180,35827,32843,5844,89047,18438,6258,55922%43,584
Dividends
-Payments
Suppliers and employees
(5,648,044)(5,714,573)(5,758,937)(773,697)(5,155,204)(4,248,292)906,912-21%(5,758,937)
Finance charqes
(201,297)(205,419)(214,732)-(153,386)(181,216)(27,830)15%(214,732)
Transfers and Grants
(22,368)(22,728)(22,628)(670)(11,167)(11,015)153-1%(22,6281
NET CASH FROM/{USED) OPERATING ACTIVITIES1,911,6021,410,6331,403,651371,8361,565,8871,487,24378,6435%1,403,651

31
Description 2011/12 Budget Year 2012/13
Audited
OriginalAdjustedMonthlyYearTDYearTDYTDYTD
Full YearR thousands OutcomeBudgetBudgetactualactualbudgetvariancevari·
Forecastance
CASH FLOWS FROMINVESTING ACTIVITIESReceiptsProceeds on disoosal of PPE
-Decrease (Increase) in non- current debtors
-Decrease (increase) other non- current receivables
19,77713,315 -13,315
Decrease (increase) in non- current investments
-Payments
Caoital assets
(1,191,440)(1,115,084)(1,456,987)(61,084)(712,667)(779,909)(67,242)9%(1,456,987)
NET CASH FROM/(USED) (1,171,663)(1,115,084)(1,443,672)(61,084) (1,443,672)INVESTING ACTIVITIES (712,667)(779,909)(67,242)9%
CASH FLOWS FROM
FINANCING ACTIVITIESReceiptsShort term loans
-Borrowina lona term/refinancina
-Increase (decrease) in consumer (3,275)
(3,500) (3,500)deposits "-
PaymentsRepayment of borrowing
(77,058)(97,444)(112,444) (74,993)(92,726)(17,733)19%(112,444)
NET CASH FROM/(USED) (115,944)
FINANCING ACTIVITIES (77,058)(100,719)(115,944)-(74,993)(92,726)(17,733)19%
NET INCREASE/ (DECREASE)
,.
IN CASH HELD662,880194,830(155,965)310,752778,227614,608 (155,965)
Cash/cash equivalents at beqinninq:507,590817,0651,170,470 1,170,470817,065 1,170,470
Cash/cash equivalents at month/year end:1,170,4701,011,8951,014,505 1,948,6971,431,673 1,014,505
Explanatory notes to Table C7 - Budgeted Cash Flow Statement
1. The budgeted cash flow statement represents the first measurement in determining whetherthe budget is funded.
2. It reflects the expected cash in-flows versus cash outflows that are likely to result from theimplementation of the budget.
1.7.2 Monthly Budget Supporting Tables - NMBM
The supporting budget reporting tables, as required in terms of the Municipal Budget and ReportingRegulations, are included in this section of the report. The table below sets out the materialvariances relating to the Municipality's financial performance for the period July 2012 to March 2013.
Supporting Table SC1 Material variance explanations - M09 March 2013
Below budget due to the rate at which vacant
positions are filled. Also influenced by the factthat TASK has not yet been implemented I No remedial action required.
Description
R thousands
Revenue By Source
Emplovee related costs
Reasons for material deviations
Actual accrued revenue is in line with the
Adjustments Budae!.
Remedial or corrective steps/remarks
No remedial action required.

32
1.8 ANALYSIS OF THE MUNICIPALITY'S BALANCE SHEET
In this section the Municipality's Debtors, Creditors and Investments will be analysed.These components have a significant impact on the Municipality's financial position.
1.8.1 Overview of Outstanding Consumer Debtors (Inclusive of VAT)
Below is an analysis of the outstanding consumer debtors as at 31 March 2013 compared to theposition as at 30 June 2012.
Debtors' Age Analysis (Inclusive of VAT) as at June 2012
Debtors Age Principal0-30 DaysArrange31 - 6061 - 90Above 91Total%
Total%Analysis by
-mentDaysDaysDaysOverdue DebtOverdue
DebtTotalIncome source Debt
Debt
RandsRandsRandsRandsRandsRandsRands Rands
Water Tariffs
NIL36,602,97210,563,15123,548,30514,097,278281,309,864329,518,59826.32%366,121,57023.00%
Electricity Tariffs
NIL191,334,48810,230,13375,702,49543,025,180134,625,451263,583,25921.05%454,917,74728.58%
Rates (PropertyR9,002,637
55,764,9802,933,51812,542,9155,932,731222,160,769243,569,93319.45%308,337,55019.37%Rates)'
Sewerage!
NIL22,986,1775,560,3799,250,8435,385,095109,875,028130,071,34510.39%153,057,5229.62%Sanitation Tariffs
Refuse RemovalNIL12,136,4883,460,2024,570,3263,029,39990,085,063101,144,9908.08%113,281,4787.12%Tariffs '.
Housing (Rental NIL559,27590,519299,060360,36715,201,96815,951,9141.27%16,511,1891.04%Income)
Other
309,70811,077,8537,834,3945,351,9473,659,407151,284,390168,130,13813.43%179,517,69911.28%
Total By Income9,312,345
330,462,23340,672,29631,265,89175,489,457,004,542,5331,251,970,177100.00%1,591,744,75!100.00%Source
Prihci-0-30 Days
Arrange-31 - 6061 - 90Above 91Total Total Debt%pal
%By Customer
mentDaysDaysDaysOverdue DebtOverdue
Total
Debt
Debt
Rands
RandsRandsRandsRandsRandsRands Rands
Government
NIL9,524,179NIL6,630,0153,122,65331,087,71040,840,3773.26%50,364,5563.16%
Business
2,250,26975,092,01610,913,89529,578,96816,680,223227,197,484284,370,57022.71%361,712,85522.72%
Households
,062,076245,846,03829,758,40195,056,90855,686,582746,257,339926,759,22974.02%1,179,667,34474.11%
Total By
9,312,345330,462,23340,672,296131,265,89175,489,4571,004,542,5331,251,970,177100.00%1,591,744,755100.00%
Customer Group
Debtors' Age Analysis (Inclusive of VAT) as at March 2013
Debtors Age Princi·0-30 Days
Arrange-31 - 6061 - 90Above 91Total Total Debt%Analysis by
pal mentDaysDaysDaysOverdue%TotalIncome source Overdue
Debt DebtDebt
Rands
RandsRandsRandsRandsRandsRands Rands
Water Tariffs
NIL48,727,0096,423,59628,809,28420,674,003321,874,047377,780,93023.88%426,507,93919.82%
Electricity Tariffs
NIL183,439,22512,512,56351,381,69618,338,754286,567,099368,800,11223.31%552,239,33725.66%-Rates (Property 217,804,32164,509,8955,580,57619,287,6559,177,781286,636,319320,682,33120.27%602,996,54728.02%Rates)'
Sewerage!
NIL4,315,6232,488,92315,591,67411,155,822142,104,071171,340,49010.83%205,656,1139.55%Sanitation TariffsRefuse Removal
NIL1,545,9291,534,7506,287,5134,397,712115,219,530127,439,5058.06%140,985,4346.55%TariffsHousing (Rental
NIL723,56857,202465,208351,40222,484,76323,358,5751.48%24,082,1431.12%Income)
Other
739,2406,719,8113,722,9884,437,4415,184,844179,076,431192,421,70412.16%199,880,7559.29%
Total By Income218,543,561
351,981,06032,320,598126,260,47169,280,3181,353,962,26(1,581,823,647100.00%2,152,348,268100.00%Source

33
Princi-Arrange-
61 - 90Above 91 Total Debt%pal 0-30 Days 31 - 60 Days Total Overdue%
By CustomermentDaysDaysDebt
Overdue Total
GroupRands
Rands RandsDebt Debt
Rands
RandsRandsRands Rands
Government
52,0378,749,679NIL14,319,2016,879,22529,459,53850,657,9643.20%59,459,6802.76%
Business
46,958,38471,297,12111,792,75121,317,87311,454,875272,208,18616,773,68520.03%435,029,18920.21%
Households
171,533,141271,934,26020,527,84790,623,39750,946,2181,052,294,53E1,214,391,99876.77%1,657,859,39877.03%
Total ByCustomer
218,543,561351,981,06032,320,598126,260,47169,280,3181,353,962,26C1,581,823,647100.00%2,152,348,268100.00%Group
The aforementioned analysis indicates that the overdue consumer debts have increased toR329.9 million from June 2012 to March 2013 as follows:
By Income source 30 June 201231 March 2013Difference
Water Tariffs
R 329,518,598R 377,780,930R 48,262,332
Electricity Tariffs
R 263,583,259R 368,800,112R105,216,853
Rates (Property Rates)
R 243,569,933R 320,682,331R 77,112,398
Seweraqe / Sanitation Tariffs
R 130,071,345R 171,340,490R 41,269,145
Refuse Removal Tariffs
R 101,144,990R 127,439,505R 26,294,515
Housing (Rental Income)
R15,951,914 R23,358,575 R7,406,661
Other
R168,130,138 R 192,421,704R 24,291,566
Total By Income Source
R1 ,251 ,970,177R1,581,823,647R329, 853,4 70
By Customer Group-.
GovernmentR40,840,377 R50,657,964 R9,817,587
Business
R 284,370,570R 316,773,685R 32,403,115
Households
R 926,759,229R1,214,391,998R287,632,768
Total By Customer Group
R1,251,970,177R1 ,581 ,823,647R329,853,470
/')-
The credit control policy is being implemented to its fullest extent 'except for the component dealingwith the sale in execution of both movable and immovable assets. The Municipality is currentlyimplementing the Debt Relief Programme, as previously approved by Council.
1.8.2 Overview of Creditors position
Below is an analysis of the status of the major creditors:
Supporting Table SC4 Monthly Budget Statement - aged creditors - M09 March 2013
0- 30 Days31-60 days61 - 90 daysAbove 91 daysTotalDetail
%R'OOO
R '000R '000R '000R '000
Bulk Electricity
--- --
Bulk Water
--- --0.0
PAVE deductions
164264 164264-38.4
VAT (output less input)
--- --0.0
Pensions / Retirementdeductions
78315-- -7831518.3
Loan Repayments
--- --0.0
Trade Creditors
17302910902443129018566443.3
Auditor-General
--- 0.0
Other
--- --0.0
Total
415608109024431290428243100.0
34
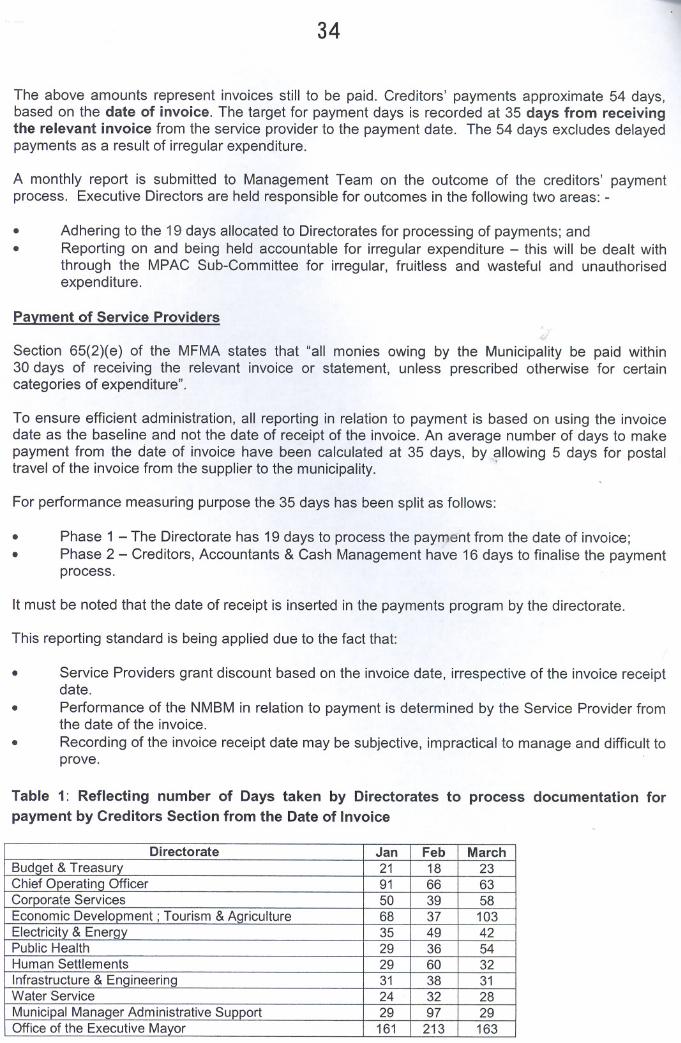
The above amounts represent invoices still to be paid. Creditors' payments approximate 54 days,based on the date of invoice. The target for payment days is recorded at 35 days from receivingthe relevant invoice from the service provider to the payment date. The 54 days excludes delayedpayments as a result of irregular expenditure.
A monthly report is submitted to Management Team on the outcome of the creditors' paymentprocess. Executive Directors are held responsible for outcomes in the following two areas: -
• Adhering to the 19 days allocated to Directorates for processing of payments; and• Reporting on and being held accountable for irregular expenditure - this will be dealt with
through the MPAC Sub-Committee for irregular, fruitless and wasteful and unauthorisedexpenditure.
Payment of Service Providers
Section 65(2)(e) of the MFMA states that "all monies owing by the Municipality be paid within30 days of receiving the relevant invoice or statement, unless prescribed otherwise for certaincategories of expenditure".
To ensure efficient administration, all reporting in relation to payment is based on using the invoicedate as the baseline and not the date of receipt of the invoice. An average number of days to makepayment from the date of invoice have been calculated at 35 days, by .allowing 5 days for postaltravel of the invoice from the supplier to the municipality ..
For performance measuring purpose the 35 days has been split as follows:
• Phase 1 - The Directorate has 19 days to process the payment from the date of invoice;• Phase 2 - Creditors, Accountants & Cash Management have 16 days to finalise the payment
process.
It must be noted that the date of receipt is inserted in the payments program by the directorate.
This reporting standard is being applied due to the fact that:
• Service Providers grant discount based on the invoice date, irrespective of the invoice receiptdate.
• Performance of the NMBM in relation to payment is determined by the Service Provider fromthe date of the invoice.
• Recording of the invoice receipt date may be subjective, impractical to manage and difficult toprove.
Table 1: Reflecting number of Days taken by Directorates to process documentation for
payment by Creditors Section from the Date of Invoice
Directorate JanFebMarchBudqet & Treasury
211823
Chief Operatinq Officer916663
Corporate Services503958
Economic Development; Tourism & Aqriculture6837103
Electricity & Energy354942
Public Health293654
Human Settlements296032
Infrastructure & Engineering313831
Water Service243228
Municipal Manager Administrative Support299729
Office of the Executive Mayor161213163

35
Directorate JanFebMarchSafety & Security
4110525Sanitation
315136
Special Projects & Proqrammes646016
Recreational & Cultural Services215069
Average for all Directorates394243
Table 1 above illustrates by Directorate the number of days taken to process paymentdocumentation from the date of the invoice. The Directorates are still lagging in efforts to meet the19 days turnaround time assigned to them in Phase 1.
The following Directorates have improved for the latest month (March):
Directorate No. of DaysNo. of DaysTarget for(February)
(March), DirectorateHuman Settlements
603219
Municipal Manager Administrative Support972919
Safety and Security1052519
Sanitation513619
Special projects and programmes601619
During March 2013, the number of days to process payment documentation increased for thefollowing Directorates: "
Directorate No. of DaysNo. of DaysTarget for(February)
(March)DirectoratePublic Health
365419
Corporate Services39
;.<58 19Recreational & Cultural Services
506919
Economic Development Tourism & Agricultural3710319
The number of days taken by the Directorates to process documentation for payment remainsunacceptably high and impacts negatively on the NMBM's compliance with Section 65(2)(e) of theMFMA Compliance with Section 65(2)(e) of the MFMA is dependant on all role players within thepayment value chain adhering to their respective timeframes.
Table 2: Reflecting Average number of Days taken by the NMBM to pay Service Providersfrom the date that the EFT is available for release
Month Number of DaysNumber of DaysDelay inTotal No. of daystaken by
taken by Creditorsrelease offrom dateAccountant to sign
to process & finalEFT'sDirectorate approvesoff documentation
Sign Off of EFT invoiceJanuary
513624
February37111-March 36110
Table 2 above reflects the Phase 2 process payment cycle where the target has been set at 16 days.This phase of processing is consistently within the target number of days, except for the month ofJanuary 2013 where it amounted to 24.
Upon combining Phase 1 and Phase 2 of the payment process, the number of days taken to paycreditors from the date of the invoice compares as follows with the target of 35 days.
January 2013February 2013March 2013
- 63 days- 53 days- 54 days
36
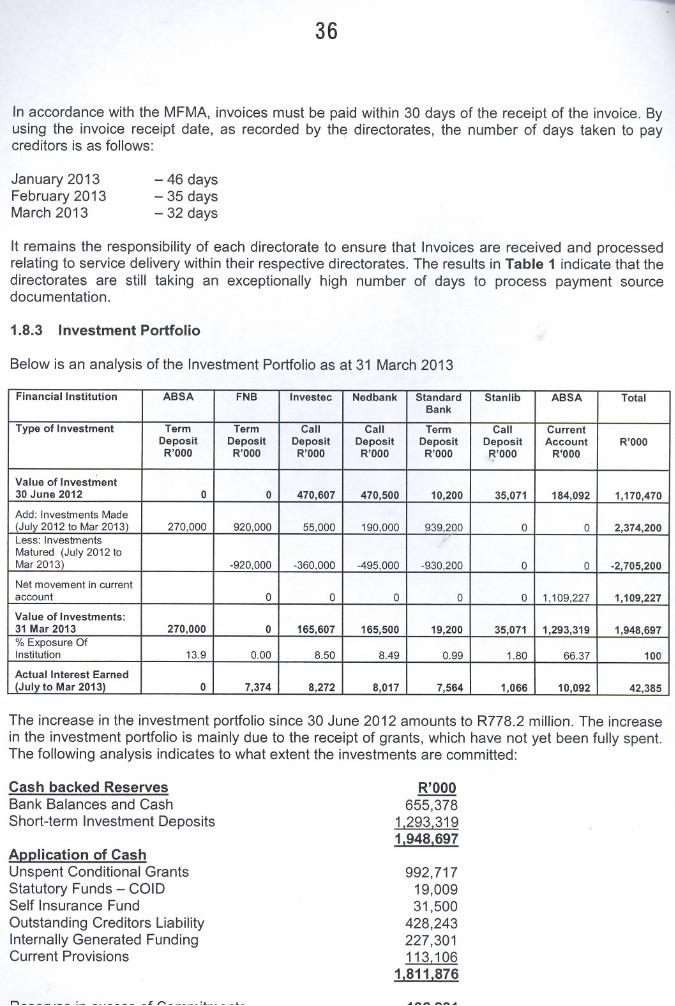
In accordance with the MFMA, invoices must be paid within 30 days of the receipt of the invoice. Byusing the invoice receipt date, as recorded by the directorates, the number of days taken to paycreditors is as follows:
January 2013February 2013March 2013
- 46 days- 35 days- 32 days
It remains the responsibility of each directorate to ensure that Invoices are received and processedrelating to service delivery within their respective directorates. The results in Table 1 indicate that thedirectorates are still taking an exceptionally high number of days to process payment sourcedocumentation.
1.8.3 Investment Portfolio
Below is an analysis of the Investment Portfolio as at 31 March 2013
Financial Institution ABSAFNBInvestecNedbankStandardStanlibABSATotalBank
Type of Investment
TermTermCallCallTermCallCurrentDeposit
DepositDepositDepositDepositDepositAccountR'OOOR'OOO
R'OOOR'OOOR'OOOR'OOOR'OOOR'OOO"
Value of Investment30 June 2012
00470,607470,50010,20035,071184,0921,170,470
Add: Investments Made (July 2012 to Mar 2013)270,000920,00055,000190,000939,200002,374,200
Less: Investments
,:
Matured (July 2012 to Mar 2013)-920,000-360,000-495,000-930,20000-2,705,200
Net movement in currentaccount
000001,109,227 1,109,227
Value of Investments:31 Mar 2013
270,0000165,607165,50019,20035,0711,293,3191,948,697% Exposure Of Institution
13.90.008.508.490.991.8066.37100
Actual Interest Earned(July to Mar 2013)
07,3748,2728,0177,5641,06610,09242,385
The increase in the investment portfolio since 30 June 2012 amounts to R778.2 million. The increasein the investment portfolio is mainly due to the receipt of grants, which have not yet been fully spent.The following analysis indicates to what extent the investments are committed:
Cash backed ReservesBank Balances and CashShort-term Investment Deposits
Application of CashUnspent Conditional GrantsStatutory Funds - COlDSelf Insurance Fund
Outstanding Creditors LiabilityInternally Generated FundingCurrent Provisions
r"""\_ ,.,.... '.
R'OOO
655,3781,293,3191.948.697
992,71719,00931,500
428,243227,301113,106
1.811.876
37
The cash reserves exceed the commitments mainly due to the receipt of grant funding and the fuellevy during March 2013. As these funds are committed towards funding expenditure during theperiod April to June 2013, the Municipality remains in a position where all commitments are not yetfully covered by cash reserves.
The sustainability of the Municipality will remain under pressure until sufficient working capital levelshave been established. The following financial strategies are being implemented to address thissituation:
• Operating and Capital expenditure funded from the Municipality's own revenue sources havebeen reduced to the revised financial affordability levels established in terms of the 2012/13Adjustments Budget.
• Optimisation of all revenue streams.
• Increasing collection rates above the targeted percentage utilising the credit control policy ofCouncil and the Debt Relief Programme, integrated with the Masakhane Programme.
• Disposal of serviced land in order to boost the depleted Capital Replacement Reserve.• No capital projects will be funded from the Municipality's own revenue sources until such time
as sufficient funds are available to cover the commitments not yet funded.
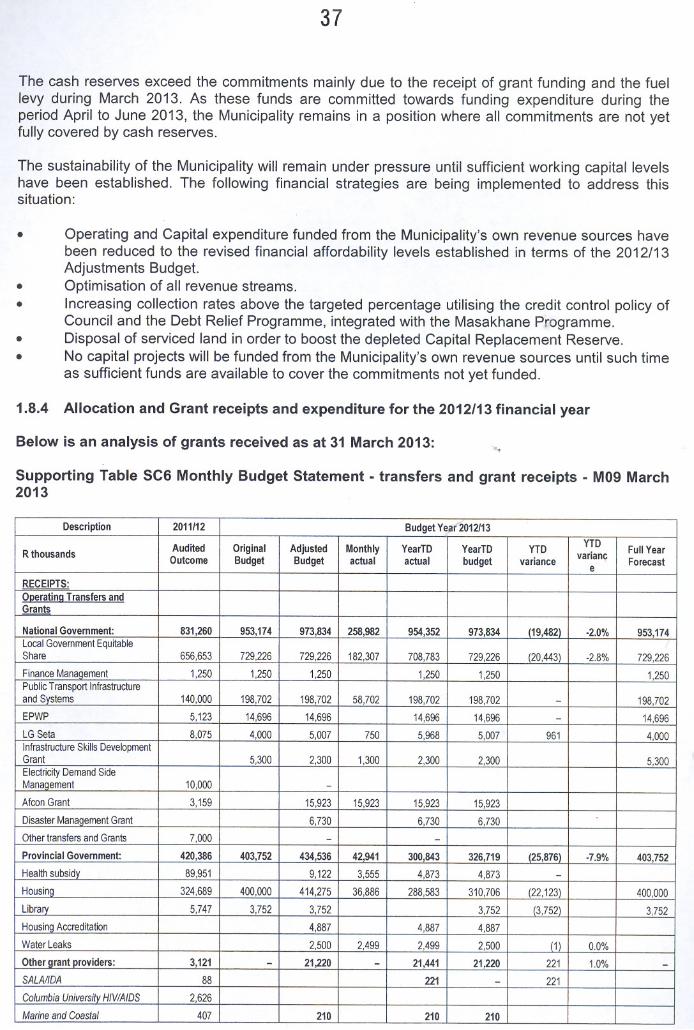
1.8.4 Allocation and Grant receipts and expenditure for the 2012/13 financial year
Below is an analysis of grants received as at 31 March 2013: 1;".,
Supporting Table Se6 Monthly Budget Statement - transfers and grant receipts - M09 March2013
Description 2011/12 Budget Year 2012113
Audited
OriginalAdjustedMonthlyYearTDYearTDYTDYTD
Full YearR thousands OutcomeBudgetBudgetactualactualbudgetvariancevarianc
ForecasteRECEIPTS: Operatina Transfers andGrants
National Government:
831,260953,174973,834258,982954,352973,834(19,482)·2.0%953,174Local Govemment Equitable Share
656,653729,226729,226182,307708,783729,226(20,443)-2.8%729,226
Finance Manaqement
1,2501,2501,250 1,2501,250 1,250Public Transport Infrastructure and Systems
140,000198,702198,70258,702198,702198,702-198,702
EPWP
5,12314,69614,696 14,69614,696-14,696
LG Seta
8,0754,0005,0077505,9685,007961 4,000Infrastructure Skills Development Grant
5,3002,3001,3002,3002,300 5,300Electricity Demand Side Management
10,000-Afcon Grant
3,15915,92315,92315,92315,923
Disaster Manaqement Grant
6,7306,7306,730-
Other transfers and Grants
7,000--Provincial Government:
420,386403,752434,53642,941300,843326,719(25,876)-7.9%403,752
Health subsidy
89,9519,1223,5554,8734,873-Housing
324,689400,000414,27536,886288,583310,706(22,123) 400,000
Library
5,7473,7523,752 3,752(3,752) 3,752
Housing Accreditation
4,8874,8874,887
Water Leaks
2,5002,4992,4992,500(1)0.0%
Other arant providers:
3,121-21,220 -21,44121,2202211.0% -
SALA/IDA88 221-221
Columbia University HIV/AIDS
2,626
Marine and Coastal
407210210210
38
Description 2011/12 Budget Year 2012/13
Audited
OriginalAdjustedMonthlyYearTDYearTDYTDYTD
Full YearR thousands OutcomeBudgetBudgetactualactualbudgetvariancevarianc
ForecasteDevelopment
EU 3RD TRANCHE
21,01021,01021,010
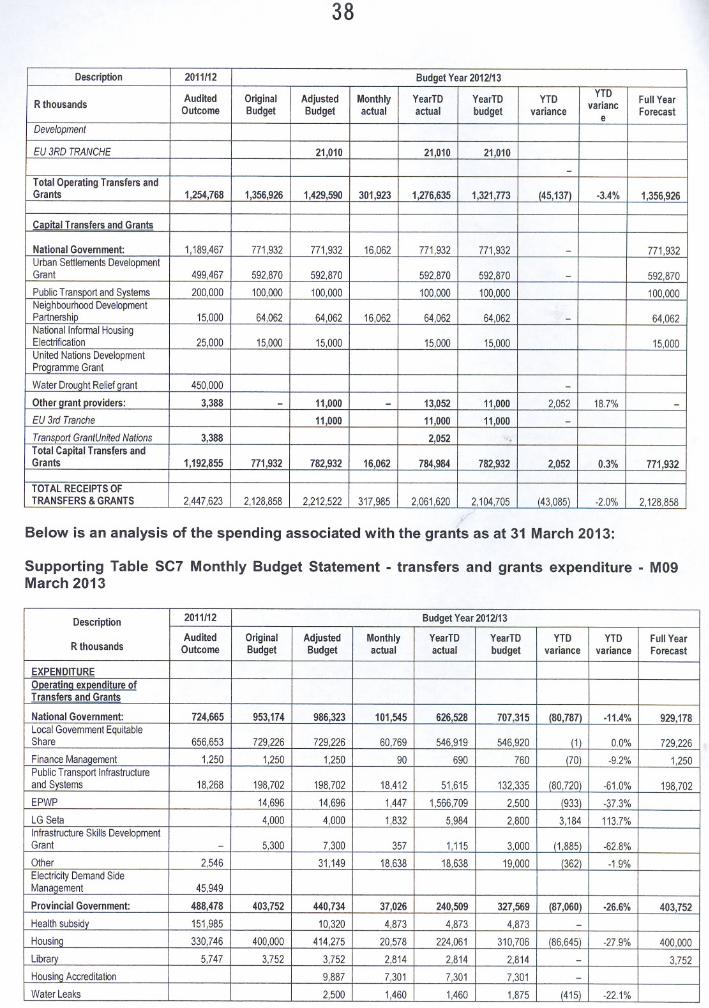
-Total Operating Transfers and Grants1,254,7681,356,9261,429,590301,9231,276,6351,321,773(45,137)-3.4%1,356,926
Capital Transfers and GrantsNational Government:
1,189,467771,932771,93216,062771,932771,932-771,932
Urban Settlements Development Grant499,467592,870592,870 592,870592,870-592,870
Public Transport and Systems
200,000100,000100,000 100,000100,000 100,000Neig hbourhood Development Partnership
15,00064,06264,06216,06264,06264,062-64,062
National Informal Housing Electrification25,00015,00015,000 15,00015,000 15,000
United Nations Development PrOQramme GrantWater Drought Relief grant
450,000 -Other arant providers:
3,388-11,000 -13,05211,0002,05218.7% -
EU 3rd Tranche11,00011,00011,000-
Transport GrantUnited Nations3,388 2,052'.
Total Capital Transfers and Grants1,192,855771,932782,93216,062784,984782,9322,0520.3%771,932
TOTAL RECEIPTS OF
TRANSFERS & GRANTS2,447,6232,128,8582,212,522317,9852,061,6202,104,705(43,085)-2.0%2,128,858
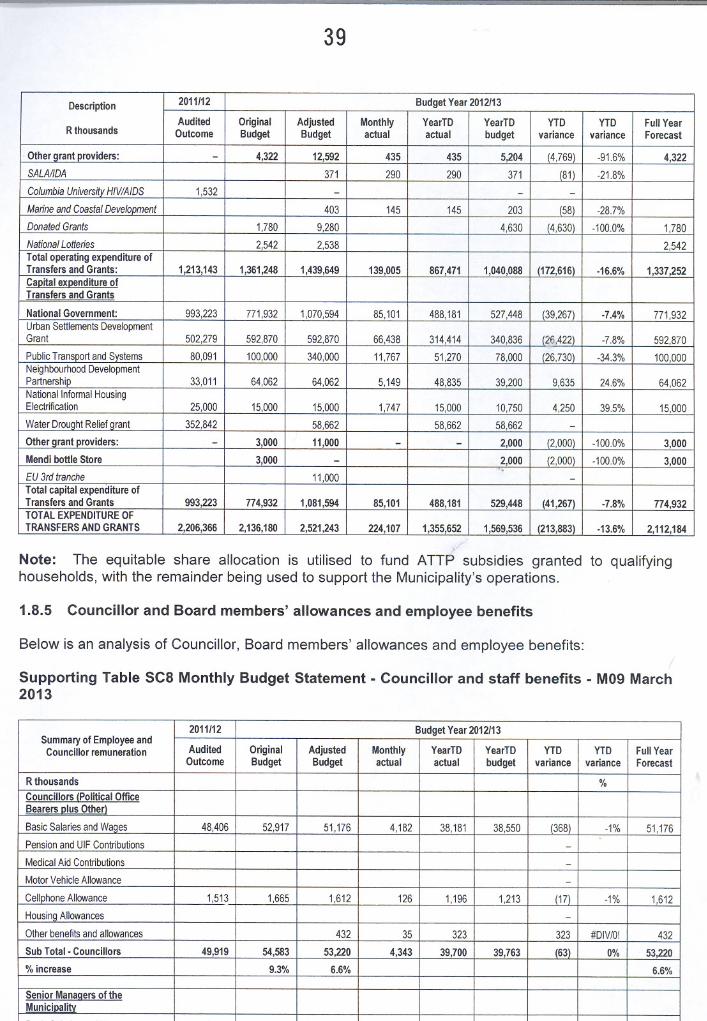
Below is an analysis of the spending associated with the grants as at 31 March 2013:
Supporting Table SC7 Monthly Budget Statement - transfers and grants expenditure - M09March 2013
Description2011/12
Budget Year 2012/13
Audited
OriginalAdjustedMonthlyYearTDYearTDYTDYTDFull YearR thousands OutcomeBudgetBudgetactualactualbudgetvariancevarianceForecast
EXPENDITUREOperatina expenditure ofTransfers and GrantsNational Government:
724,665953,174986,323101,545626,528707,315(80,787)-11.4%929,178Local Govemment Equitable Share
656,653729,226729,22660,769546,919546,920(1)0.0%729,226
Finance Management
1,2501,2501,25090690760(70)-9.2%1,250
Public Transport Infrastructure and Systems18,268198,702198,70218,41251,615132,335(80,720)-61.0%198,702
EPWP
14,69614,6961,4471,566,7092,500(933)-37.3%
LG Seta
4,0004,0001,8325,9842,8003,184113.7%
Infrastructure Skills Development Grant
-5,3007,3003571,1153,000(1,885)-62.8%
Other
2,54631,14918,63818,63819,000(362)-1.9%Electricity Demand Side Management
45,949
Provincial Government:
488,478403,752440,73437,026240,509327,569(87,060)-26.6%403,752
Health subsidy
151,98510,3204,8734,8734,873-Housinq
330,746400,000414,27520,578224,061310,706(86,645)-27.9%400,000
Library
5,7473,7523,7522,8142,8142,814- 3,752
Housinq Accreditation
9,8877,3017,3017,301-Water Leaks
2,5001,4601,4601,875(415)-22.1%
39
Description2011/12
Budget Year 2012/13
Audited
OriginalAdjustedMonthlyYearTDYearTDYTDYTDFull YearR thousands OutcomeBudgetBudgetactualactualbudgetvariancevarianceForecast
. Other grant providers:
-4,32212,5924354355,204(4,769)-91.6%4,322
SALA/IDA
371290290371(81)-21.8%
Columbia University HIV/AIDS
1,532- --Marine and Coastal DeveloDment
403145145203(58)-28.7%
Donated Grants
1,7809,280 4,630(4,630)-100.0%1,780
National Lotteries
2,5422,538 2,542Total operating expenditure of Transfers and Grants:
1,213,1431,361,2481,439,649139,005867,4711,040,088(172,616)-16.6%1,337,252Capital expenditure of Transfers and Grants
National Government:
993,223771,9321,070,59485,101488,181527,448(39,267)-7.4%771,932Urban Settlements Development Grant
502,279592,870592,87066,438314,414340,836(26,422)-7.8%592,870
Public Transport and Systems
80,091100,000340,00011,76751,27078,000(26,730)-34.3%100,000Neighbourhood Development Partnership
33,01164,06264,0625,14948,83539,2009,63524.6%64,062National Informal Housing Electrification
25,00015,00015,0001,74715,00010,7504,25039.5%15,000
Water Drouqht Relief qrant
352,84258,66258,66258,662-Other grant providers:
-3,00011,000--2,000(2,000)-100.0%3,000
Mendi bottle Store
3,000- 2,000(2,000)-100.0%3,000.EU 3rd tranche 11,000-Total capital expenditure of
Transfers and Grants
993,223774,9321,081,59485,101488,181529,448(41,267)-7.8%774,932TOTAL EXPENDITURE OF TRANSFERS AND GRANTS
2,206,3662,136,1802,521,243224,1071,355,6521,569,536(213,883)-13.6%2,112,184
"
Note: The equitable share allocation is utilised to fund ATTP subsidies granted to qualifyinghouseholds, with the remainder being used to support the Municipality's operations.
1.8.5 Councillor and Board members' allowances and employee benefits
Below is an analysis of Councillor, Board members' allowances and employee benefits:
Supporting Table SC8 Monthly Budget Statement - Councillor and staff benefits - M09 March2013
2011/12Budget Year 2012/13
Summary of Employee and AuditedOriginalAdjustedMonthlyYearTDYearTDYTDYTDFull YearCouncillor remuneration
OutcomeBudgetBudgetactualactualbudgetvariancevarianceForecast
R thousands
%
Councillors (Political Office Bearers plus Other)Basic Salaries and Waaes
48,40652,91751,1764,18238,18138,550(368)-1%51,176-Pension and UIF Contributions -Medical Aid Contributions
-Motor Vehicle Allowance
-Cellphone Allowance
1,5131,6651,6121261,1961,213(17)-1%1,612
Housinq Allowances
-Other benefits and allowances
43235323 323#DIV/O! 432
Sub Total· Councillors
49,91954,58353,2204,34339,70039,763(63)0%53,220
% increase
9.3%6.6% 6.6%
Senior Manaaers of the
Municioalitv

40
2011/12 Budget Year 2012/13Summary of Employee and Audited
OriginalAdjustedMonthlyYearTDYearTDYTDYTDFull YearCouncillor remunerationOutcome
BudgetBudgetactualactualbudgetvariancevarianceForecast
Performance Bonus
7402,2562,068 1,504(1,504)-100%2,068
Sub Total· Senior Managers of Municipalitv9,89020,18015,1147405,60513,454(7,849)·58%15,114
% increase
104.0%52.8% 52.8%
Other Municioal StaffBasic Salaries and Waqes
1,138,7311,231,6671,199,40186,200839,616821,11118,5042%1,199,401
Pension and UIF Contributions
182,738189,387178,22315,357138,702126,25812,44310%178,223
Medical Aid Contributions
101,94997,369101,5359,93279,08364,91314,17022%101,535
Overtime
74,03856,88473,1695,88157,16937,92319,24651%73,769
Performance Bonus
18,91613,35319,7021,45614,0858,9025,18358%19,102
Motor Vehicle Allowance
52,87747,37053,9374,95842,17531,58010,59534%53,937
Housinq Allowances
8,0467,4477,2816195,6074,96564313%7,281
Other benefits and allowances
129,07056,84876,2737,75077,01837,89839,119103%76,273
Lona service awards
38430,24125,8296535120,161(19,809)-98%25,829
Post-retirement benefit obligations
135,72642,22742,227 -42,227
Sub Total- Other Municipal Staff
1,842,4741,772,7931,778,177132,2171,253,8051,153,711100,0949%1,778,177
% increase
·3.8%·3.5% .,·3.5%
Total Parent Municipalitv
1,902,2841,847,5561,846,511137,3001,299,1111,206,92792,1838%1,846,511·2.9%
·2.9% ·2.9%
Unpaid salary, allowances & benefits in arrears:,.
Senior Manaaers of EntitiesBasic Salaries and Waaes
2,5353,349,0003,8293192,6712,871(200)-7%3,829
Pension and UIF Contributions
260408,000 48040360360- 480
Medical Aid Contributions
68109,000 129119797- 129
Performance Bonus
360480,000 39633297297- 396
Motor Vehicle Allowance
108108,000 10898181- 108
Other benefits and allowances
439 --Sub Total· Senior Managers of Entities
3,7704,4544,9424123,5063,706(200)·5%4,942
% increase
18.1%31.1% 31.1%
Other Staff of EntitiesBasic Salaries and Wages
2,0742,5742,8742341,8412,156(315)-15%2,874
Pension and UIF Contributions
30722840834307307- 408
Medical Aid Contributions
14627031026233233- 310
Other benefits and allowances
147126126109494- 126
Sub Total· Other Staff of Entities
2,6743,1983,7183042,4742,789(315)-11%3,718
% increase
19.6%39.1% 39.1%
Total Municipal Entities
6,4447,6528,6607165,9806,496(515)·8%8,660
TOTAL SALARY, ALLOWANCES
& BENEFITS1,908,7281,855,2081,855,171138,0161,305,0911,213,42391,6688%1,855,171
% increase
·2.8%-2.8% ·2.8%
TOTAL MANAGERS AND STAFF
1,858,8091,800,6251,801,951133,6731,265,3911,173,66091,7318%1,801,951
The expenditure on salaries, allowances and benefits is lower than projected mainly due to TASKnot yet being implemented.
- __ m • _
41
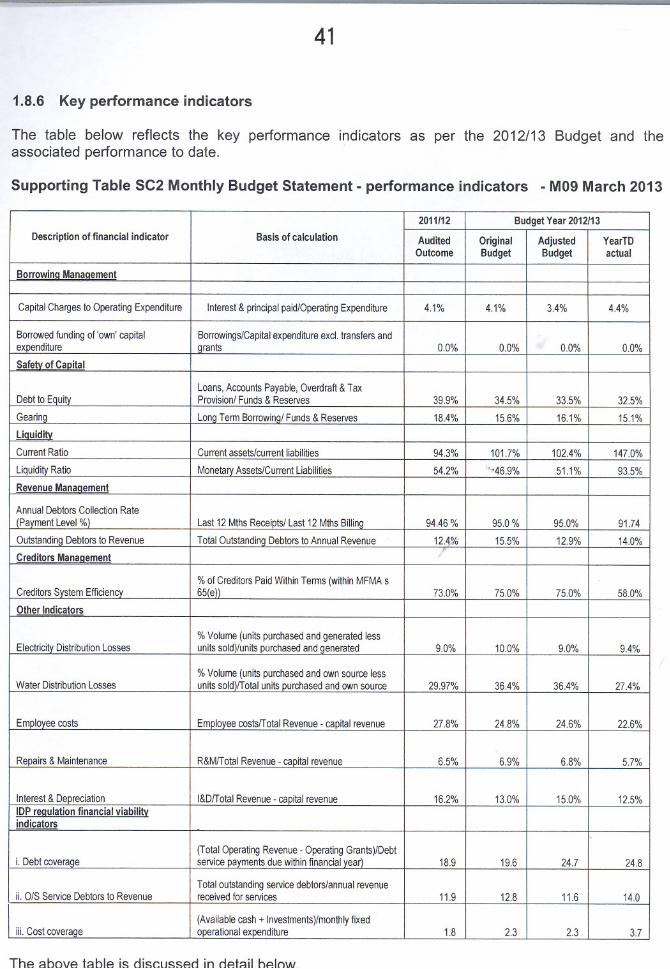
1.8.6 Key performance indicators
The table below reflects the key performance indicators as per the 2012/13 Budget and theassociated performance to date.
Supporting Table SC2 Monthly Budget Statement - performance indicators - M09 March 2013
2011/12Budget Year 2012/13
Description of financial indicator
Basis of calculationAuditedOriginalAdjustedYearTD
OutcomeBudgetBudgetactual
BorrowinQ ManaQement
Capital Charges to Operating Expenditure
Interest & principal paid/Operating Expenditure4.1%4.1%3.4%4.4%
Borrowed funding of 'own' capital
Borrowings/Capital expenditure excl. transfers andexpend iture
qrants 0.0%0.0%0.0%0.0%
Safety of CaoitalLoans, Accounts Payable, Overdraft & Tax
Debt to Equity
Provision/ Funds & Reserves39.9%34.5%33.5%32.5%
Gearinq
Lonq Term Borrowinq/ Funds & Reserves18.4%15.6%16.1%15.1%
Llcluidjty Current Ratio
Current assets/current liabilities94.3%101.7%102.4%147.0%
Liquidity Ratio
Monetarv Assets/Current Liabilities54.2%"'46.9%51.1%93.5%
Revenue ManaoemimtAnnual Debtors Collection Rate(Pavment Level %)
Last 12 Mths Receipts/ Last 12 Mths Billing94.46 %95.0%95.0%91.74
Outstandinq Debtors to Revenue
Total Outstandinq Debtors to Annual Revenue12.4%15.5%12.9%14.0%,Creditors Manaqement
% of Creditors Paid Within Terms (within MFMA s
Creditors System Efficiency65(e)) 73.0%75.0%75.0%58.0%
Other Indicators
% Volume (units purchased and generated less
Electricity Distribution Lossesunits soldl/units purchased and generated9.0%10.0%9.0%9.4%
% Volume (units purchased and own source less
Water Distribution Lossesunits sold)fTotal units purchased and own source29.97%36.4%36.4%27.4%
Employee costs
Employee costsfTotal Revenue - capital revenue27.8%24.8%24.6%22.6%
Repairs & Maintenance
R&MfT otal Revenue - capital revenue6.5%6.9%6.8%5.7%
Interest & Depreciation
I&DfTotal Revenue - capital revenue16.2%13.0%15.0%12.5%
IDP reQulation financial viability indicators-
(Total Operating Revenue - Operating Grants)/Debti. Debt coveraqe
service payments due within financial year)18.919.624.724.8
Total outstanding service debtors/annual revenueii. O/S Service Debtors to Revenue
received for services11.912.811.614.0
(Available cash + Investments)/monthly fixediii. Cost coverage
operational expenditure1.82.32.33.7
ThA ::!hnvA t::!hlA i~ rli~r.II~~Arlin rlAt::!il hAlmA!

42
1.8.6.1 Borrowing Management
1.8.6.1.1 Borrowinq to Asset Ratio
This ratio assesses to what extent there are adequate assets to cover the amount of outstandinglong-term borrowing (refer figure 1).
The ratio is determined as follows:
Long-Term Borrowing / Total Assets
The risk that the Municipality might not be able to settle its long term borrowing becomes greater ifthis ratio is high. The Municipality must therefore exercise due caution, so that its assets are notoverburdened by raising excessive borrowing. The careful and judicious management of borrowingis considered very critical, in order to ensure the Municipality's continued financial viability.
As at the end of March 2013, the borrowing to asset ratio was at 0.102:1, compared to anadjustments budget target of 0.107: 1. The actual ratio as at 30 June 2012 was 0.117: 1. As no furtherborrowing is planned over the 2012/13 MTREF, this ratio is expected to reduce. A ratio of 0.107: 1 asreflected in the 2012/13 Adjustments Budget appears to be appropriate for the Municipality from afinancial affordability and sustainability perspective. External borrowing should only be utilised forthe creation of economic assets that will generate future revenue streams for the Municipality.
"
Figure 1: BorrowinQ to Asset Ratio
0.25
0.2
0.15
0.1
0.05
o
2005/2006 2006/2007 2007/2008 2008/2009 2009/2010 2010/2011 2011/2012
0.2
0.15
0.1
0.05
o
I-+- Actual - Target I
---
...--.- ~~-
.
....Mar-12 Apr-12 May-12 Jun-12 Jul-12 Aug-12 Sep-12 Oct-12 Nov-12 Dec-12 Jan-13 Feb-13 Mar-13
I-+- Actual - Target I