30 June 2017 REPORT ON G20 TRADE MEASURES · 30 June 2017 . REPORT ON G20 TRADE MEASURES ... This...
109
30 June 2017 REPORT ON G20 TRADE MEASURES (MID-OCTOBER 2016 TO MID-MAY 2017) Table of contents KEY FINDINGS ................................................................................................................. 2 EXECUTIVE SUMMARY ...................................................................................................... 6 1 INTRODUCTION .......................................................................................................... 8 2 RECENT ECONOMIC AND TRADE DEVELOPMENTS ...................................................... 10 2.1 Overview..................................................................................................................10 2.2 Economic Developments ............................................................................................10 2.3 Merchandise Trade ....................................................................................................13 2.4 Trade in Commercial Services ......................................................................................16 2.5 Trade Forecast and Economic Outlook ...........................................................................19 3 TRADE AND TRADE-RELATED POLICY DEVELOPMENTS .............................................. 22 3.1 Overview of trends identified during the period under review ...........................................22 3.2 Trade Remedies .........................................................................................................29 3.3 Sanitary and Phytosanitary Measures (SPS) ...................................................................40 3.4 Technical Barriers to Trade ..........................................................................................43 3.5 Policy Developments in Agriculture ...............................................................................46 3.6 General Economic Support ...........................................................................................53 3.7 Other Selected Trade Policy Issues ...............................................................................54 4 POLICY DEVELOPMENTS IN TRADE IN SERVICES ...................................................... 62 5 POLICY DEVELOPMENTS IN TRADE AND INTELLECTUAL PROPERTY .......................... 65 ANNEX 1: MEASURES FACILITATING TRADE .................................................................. 68 ANNEX 2: TRADE REMEDIES ........................................................................................... 75 ANNEX 3: OTHER TRADE AND TRADE-RELATED MEASURES ............................................ 87 ANNEX 4: MEASURES AFFECTING TRADE IN SERVICES .................................................. 95
-
Upload
nguyenthien -
Category
Documents
-
view
239 -
download
2
Transcript of 30 June 2017 REPORT ON G20 TRADE MEASURES · 30 June 2017 . REPORT ON G20 TRADE MEASURES ... This...

30 June 2017
REPORT ON G20 TRADE MEASURES
(MID-OCTOBER 2016 TO MID-MAY 2017)
Table of contents
KEY FINDINGS ................................................................................................................. 2 EXECUTIVE SUMMARY ...................................................................................................... 6 1 INTRODUCTION .......................................................................................................... 8 2 RECENT ECONOMIC AND TRADE DEVELOPMENTS ...................................................... 10 2.1 Overview ..................................................................................................................10 2.2 Economic Developments ............................................................................................10 2.3 Merchandise Trade ....................................................................................................13 2.4 Trade in Commercial Services ......................................................................................16 2.5 Trade Forecast and Economic Outlook ...........................................................................19 3 TRADE AND TRADE-RELATED POLICY DEVELOPMENTS .............................................. 22 3.1 Overview of trends identified during the period under review ...........................................22 3.2 Trade Remedies .........................................................................................................29 3.3 Sanitary and Phytosanitary Measures (SPS) ...................................................................40 3.4 Technical Barriers to Trade ..........................................................................................43 3.5 Policy Developments in Agriculture ...............................................................................46 3.6 General Economic Support ...........................................................................................53 3.7 Other Selected Trade Policy Issues ...............................................................................54 4 POLICY DEVELOPMENTS IN TRADE IN SERVICES ...................................................... 62 5 POLICY DEVELOPMENTS IN TRADE AND INTELLECTUAL PROPERTY .......................... 65 ANNEX 1: MEASURES FACILITATING TRADE .................................................................. 68 ANNEX 2: TRADE REMEDIES ........................................................................................... 75 ANNEX 3: OTHER TRADE AND TRADE-RELATED MEASURES ............................................ 87 ANNEX 4: MEASURES AFFECTING TRADE IN SERVICES .................................................. 95


Box 1 About the WTO Monitoring Report on G20 Trade Measures
This seventeenth WTO Monitoring Report reviews trade and trade-related measures implemented by G20 economies during the period from 16 October 2016 to 15 May 2017. These reports have been prepared in response to the request by G20 Leaders in 2008 to the WTO, together with the OECD and UNCTAD, to monitor and report publicly on trade and investment measures taken by the G20. The previous WTO Monitoring Report on G20 trade measures was issued on 10 November 2016. This Report is issued under the sole responsibility of the Director-General of the WTO. The Trade Monitoring Report is first and foremost a transparency exercise. It is intended to be purely factual and has no legal effect on the rights and obligations of WTO Members. It is without prejudice to Members' negotiating positions and has no legal implication with respect to the conformity of any measure noted in the report with any WTO Agreement or any provision thereof. The Monitoring Report aims to shed light on the latest trends in the implementation of a broad range of policy measures that facilitate as well as restrict the flow of trade and to provide an update of the state of global trade. The Monitoring Report neither seeks to pronounce itself on whether a trade measure is protectionist, nor does it question the explicit right of Members to take certain trade measures. The Reports continue to evolve in terms of the coverage and analysis of trade-related issues and seek to take into account discussions among G20 economies. This seventeenth G20 Report introduces a separate annex for trade remedy measures consistent with the practice followed since November 2012 for the separate Monitoring Reports which cover all WTO Members. Originally, the G20 and the WTO-wide Reports both included trade remedies in the restrictive/facilitating calculations. However, in 2012 WTO Members decided that such measures should be dealt with separately. While this has been the approach in the WTO-wide Reports since then, the G20 version continued to list trade remedies as either facilitating or restrictive. A harmonization of the methodology applied in both the G20 and the WTO-wide monitoring reports would therefore be both logical and practical. The current Report covers and crystalizes the same measures and factual information as previously. This Report will highlight the change in methodology in the relevant sections. Although the restrictive trade measures covered by the Monitoring Report have a restraining impact on the flow of trade, almost all such measures appear to have been taken within the flexibilities provided for in the multilateral trading system. With respect to the tariff increases included in the reports, it is equally important to stress that the overwhelming majority of these measures are taken within bound ceilings and do not appear to break WTO rules. With respect to trade remedy actions, it has been highlighted in discussions among G20 economies, as well as more broadly in the WTO, that several of these measures are taken to address what is perceived by some as a market distortion resulting from trade practices of entities in another trading partner. The WTO Antidumping and Subsidies Agreements permit WTO Members to impose antidumping (AD) or countervailing (CVD) duties to offset what is perceived to be injurious dumping or subsidization of products exported from one Member to another. The Monitoring Reports are not in a position to establish if, where or when such perceived distortive practices have taken place. The WTO Monitoring Reports have never categorized the use of trade remedies as protectionist, WTO-inconsistent or criticized governments for utilizing them. The main objective of monitoring these measures is to provide added transparency and to identify emerging trends in the application of trade policy measures. With respect to sanitary and phytosanitary (SPS) and technical barriers to trade (TBT) measures covered in the Reports, it is important to emphasize that they are neither classified nor counted as trade-restrictive or trade facilitating, and the increasing trend with respect to the number of notifications of such measures is carefully linked to the transparency provisions of the Agreements only. The Reports have consistently underlined the basic premise that an increased number of SPS and TBT notifications do not automatically imply greater use of protectionist or unnecessarily trade-restrictive measures, but rather enhanced transparency regarding these measures. Finally, the Reports clearly emphasize that the SPS and TBT Agreements specifically allow Members to take measures in the pursuit of a number of legitimate policy objectives. The WTO Secretariat strives to ensure that the Trade Monitoring Reports constitute factual and objective accounts of recent trends in trade policy making. Since 2008, the Reports have sought to provide a wider and more nuanced perspective to developments in the area of international trade. For example, the Reports have consistently drawn attention to the fact that although the number of specific and often long-term restrictive trade measures remains a source of continuous concern, other key factors such as the general economic downturn have played a significant role in the slow-down of trade. With respect to both, vigilance is required.

2
KEY FINDINGS
• G20 economies applied 42 new trade-restrictive measures during the review period (mid-October 2016 to mid-May 2017), including new or increased tariffs, customs regulations and rules of origin restrictions. This equates to an average of six measures per month which is slightly higher than in 2016, but below the longer-term trend observed from 2009-2015 of seven per month.
• G20 economies also applied 42 measures aimed at facilitating trade over this review period,
including eliminated or reduced tariffs and simplified customs procedures. This equates to an average of six new measures per month which is similar to the previous period and in line with the declining trend in the application of trade facilitating measures observed in 2016.
• During the review period, the estimated trade coverage for import-facilitating measures (US$163 billion) significantly exceeded the estimated trade coverage of import-restrictive measures (US$47 billion).
• This Report harmonizes the approach taken to trade remedies in the G20 Monitoring Report with that of the WTO-wide Report by introducing a separate annex for trade remedy measures. It is of interest to note that initiations of trade remedy investigations represented 50% of the total trade measures taken during the review period; although the amount of trade covered is relatively small (US$25 billion for trade remedy initiations and US$6 billion for terminations).
• Transparency and predictability in trade policy remains vital for all actors in the global economy. The G20 should show leadership in reiterating their commitment to open and mutually beneficial trade as a key driver of economic growth and a major engine for prosperity.
• Faced with continuing global economic uncertainties, the G20 should seek to continue
improving the global trading environment, including by implementing the WTO Trade Facilitation Agreement, which entered into force in February this year, and working together to achieve a successful outcome at the 11th WTO Ministerial Conference in December.

3
G20 Trade-restrictive measures
(average per month)
6 6
9
7 7
6
8
5 5
6
0
5
10
2009 2010 2011 2012 2013 2014 2015 2016 mid-May16 tomid-Oct16
mid-Oct16 tomid-May17
Note: Values are rounded.
Source: WTO Secretariat.
G20 Trade-facilitating measures
(average per month)
5
9 9 9
7 7
8
6 6 6
0
5
10
2009 2010 2011 2012 2013 2014 2015 2016 mid-May16 tomid-Oct16
mid-Oct16 tomid-May17
Note: Values are rounded.
Source: WTO Secretariat.

4
G20 Trade remedy trends – initiations and terminations
(average per month)
17
23 22
18
22
25
21
13 13 14
13
11 11
9
-
5
10
15
20
25
30
2012 2013 2014 2015 2016 mid-May16mid-Oct16
mid-Oct16mid-May17
Initiations avg per month Terminations avg per month
Note: Values are rounded.
Source: WTO Secretariat.
Overview of G20 measures (mid-October 2016 to mid-May 2017)
(by number)
146 62 42 42
Trade remedy initiations Trade remedy terminations
Measures facilitating trade Trade-restrictive measures
292
Source: WTO Secretariat.

5
Trade coverage of G20 import measures (mid-October 2016 to mid-May 2017)
(US$ billions)
25 6 163 47
Trade remedy initiations Trade remedy terminations
Measures facilitating trade Trade-restrictive measures
US$241
Source: WTO Secretariat.
6
EXECUTIVE SUMMARY
This is the seventeenth WTO monitoring Report on G20 trade measures.1 It covers the period from 16 October 2016 to 15 May 2017.2 The Report continues to demonstrate the importance of transparency and predictability for all actors in the global economy. The rules-based global trading system, under-pinned by the WTO, remains a key pillar in the global economy to create the conditions for improved economic growth and prosperity. During the review period, a total of 42 new trade-restrictive measures, including new or increased tariffs, customs regulations and rules of origin restrictions, were recorded for G20 economies, amounting to a monthly average of six measures. This represents a slight increase over the previous period, but still remains lower than the longer-term trend observed from 2009-2015 of seven per month. The G20 also implemented 42 measures aimed at facilitating trade in the review period, including eliminated or reduced tariffs and simplified customs procedures. At six trade-facilitating measures per month, this is similar to the previous period and in line with the deceleration trend observed in 2016. The trade covered by the import-facilitating measures (US$163 billion) is more than three times higher than the estimated trade coverage of import-restrictive measures ($47 billion), and more than six times higher than those estimated for trade remedy initiations ($25 billion). In addition, liberalization associated with the 2015 expansion of the WTO's Information Technology Agreement continues to feature as an important contributor to trade facilitation. The larger trade coverage of import-facilitating measures during the review period is a very positive development. It is encouraging that G20 economies collectively continue to show moderation and restraint in the recourse to trade restrictions despite the persistent uncertainty facing the global economy. This Report harmonizes the approach taken to trade remedies in the G20 Monitoring Report with that of the WTO-wide Report by introducing a separate annex for trade remedy measures. The current Report continues to cover and crystalize the same measures and factual information as previously. The change in methodology is highlighted in the relevant sections of this Report. Box 1 also provides a fuller explanation of this change. Initiations of trade remedy investigations in the review period represented 50% of the total trade measures taken, with the initiations of anti-dumping investigations accounting for around 85% of all trade remedy investigation initiations. The main sectors affected by trade remedy initiations during the review period were wood and articles of wood; vehicles; and furniture, bedding material, lamps. The main sectors where trade remedy duties were terminated were articles of iron and steel; machinery and mechanical appliances; and aluminium and articles thereof. The trade coverage of trade remedy initiations and terminations recorded in this Report is estimated at US$25 billion and US$6 billion respectively. A range of other subjects are also covered by this Report. In the context of the Sanitary and Phytosanitary (SPS) Committee, G20 economies remained active in notifying their SPS measures, accounting for 68% of all regular notifications. Almost three-quarters of all specific trade concerns (STCs) raised to date have addressed measures maintained by G20 economies. During the review period, the top ten targets of concerns were about G20 measures. Similarly, G20 economies are the most frequent users of the Technical Barriers to Trade (TBT) Committee's transparency mechanisms, submitting almost half of all new regular TBT notifications since 1995. Regulations of G20 members represent 80% of all measures discussed in the TBT Committee since 1995. During the review period, 74% of new STCs and more than three-quarters of previously raised STCs concerned measures maintained by G20 economies. In both the SPS and TBT Committees G20 economies have spent a significant amount of time discussing STCs,
1 The WTO trade monitoring reports have been prepared by the WTO Secretariat since 2009. G20
members are: Argentina; Australia; Brazil; Canada; China; European Union; France; Germany; India; Indonesia; Italy; Japan; Korea, Republic of; Mexico; the Russian Federation; the Kingdom of Saudi Arabia; South Africa; Turkey; the United Kingdom; and the United States.
2 Unless otherwise indicated in the relevant Section.

7
suggesting that G20 economies increasingly see the TBT and SPS Committees as fora in which trade concerns may be effectively resolved non-litigiously. In the area of agriculture, the majority of questions under the review process of the Committee on Agriculture (CoA) were on policies maintained by G20 economies, e.g. 34 out of 40 implementation-related issues concerned policies implemented by G20 members. More than half of the new issues concerning policies implemented by G20 members related to domestic support policies. G20 economies have shown a high level of compliance with their transparency obligations under the Agreement on Agriculture and, in recent years, have made efforts to bring their agriculture-related notifications up-to-date. General economic support measures played an important role in many economies in the immediate aftermath of the 2008 financial crisis. The trade monitoring reports have consistently reported on these measures which included domestic bailouts, substantial measures targeting the financial sector, state aid programmes and large-scale multi-sector and sometimes economy-wide stimulus packages. Recent years have seen fewer such support programmes, with measures appearing to be increasingly sector-specific and export-oriented, including various trade finance programmes, often to assist SMEs or start-up enterprises. The number of G20 economies that provided information on general economic support measures implemented during the current review period remained, again, disappointingly low. Work on the implementation of the WTO's Trade Facilitation Agreement (TFA) continued to make progress and reached an important milestone on 22 February 2017 when a sufficient number of ratifications were received for the Agreement to enter into force. Eighteen ratifications were received since the end of the last reporting period.
On trade in services, the review period saw a number of significant and diverse policy developments in several G20 economies. As in the past, the majority of the measures covered either provide for additional liberalization or aim to strengthen or clarify regulatory frameworks. At the same time, however, several services measures implemented during the review period appear to be trade restrictive. The Amendment to the Agreement on Trade-Related Aspects of Intellectual Property Rights (TRIPS) entered into force on 23 January 2017. A key milestone, this marked the first amendment to a multilateral trade agreement since the creation of the WTO in 1995. The Amendment addresses health-related needs of developing and least developed country WTO Members (LDCs), by providing a legal pathway for the export of low-cost medicines produced under compulsory licences. G20 economies are at the forefront of this trend and several of them adopted new national and regional policies related to IP and the digital economy.
During the review period, slower growth in world trade and output partly reflected weak investment spending. Although some trade indicators were up in the first quarter of 2017, underlying risk factors remain significant. World merchandise trade volume growth slowed to 1.3% in 2016, down from 2.6% in 2015, as weak economic growth and low commodity prices had a negative impact on import demand in both developed and developing economies. World GDP growth also slowed to 2.3% in 2016, down from 2.7% in 2015. The WTO's most recent trade forecast of 12 April 2017, estimated that world merchandise trade would grow by 2.4% in 2017, within a range from 1.8% to 3.6%. For 2018, world merchandise trade growth is expected to be between 2.1% and 4%.
Faced with continuing global economic uncertainties, the G20 should show leadership in reiterating their commitment to open and mutually beneficial trade, and continuing to strengthen the rules-based multilateral trading system. G20 members should seek to continue improving the global trading environment, including by implementing in full the WTO Trade Facilitation Agreement, and working together to achieve a successful outcome at the 11th WTO Ministerial Conference in December.

8
1 INTRODUCTION
1.1. This seventeenth G20 Monitoring Report reviews trade and trade-related measures implemented by G20 economies during the period 16 October 2016 to 15 May 2017.3 The G20 Trade Monitoring Reports have been prepared in response to the request by G20 Leaders to the WTO, together with the OECD and UNCTAD, to monitor and report trade and investment measures implemented by G20 economies consistent with their undertakings on resisting trade and investment protectionism. The previous monitoring report on G20 economies was issued on 10 November 2016.
1.2. This Report is issued under the sole responsibility of the Director-General of the WTO. The Monitoring Report is first and foremost a transparency exercise. It is intended to be purely factual and has no legal effect on the rights and obligations of WTO Members. It is without prejudice to Members' negotiating positions and has no legal implication with respect to the conformity of any measure noted in the Report with any WTO Agreement or any provision thereof.
1.3. The Report seeks to shed light on the latest trends in the implementation of a broad range of policy measures that facilitate as well as restrict the flow of trade. It provides an update on the main indicators of the world economy and on the state of global trade. It neither seeks to pronounce itself on whether a trade measure is protectionist, nor does it question the explicit right of Members to take certain trade measures. Reflecting discussions among G20 economies over the years the Reports have continued to evolve in terms of the coverage and analysis of trade-related issues so as to provide the best possible regular updates on developments in trade and trade policy-making.
1.4. This time, the G20 Report introduces a separate annex for trade remedy measures consistent with the practice followed for the WTO-wide Monitoring Reports since November 2012. The adoption of the methodology utilized by the WTO-wide Reports represents a harmonization of the reports and will hopefully facilitate a broader substantive debate on recent trends in the implementation of trade measures and on the merits of transparency and predictability in trade policy-making. Further details on this, as well as other background information, are covered in more detail in Box 1.
1.5. Section 2 of the Report provides an overview of recent economic and trade developments in G20 economies. Section 3 presents an overview of selected trade and trade-related policy trends during the period under review. Overviews of policy developments in trade in services and trade-related aspects of intellectual property rights are included in Sections 4 and 5, respectively.
1.6. The four annexes to this Report comprise new measures recorded for G20 economies during the review period. Measures implemented outside this period are not included in these annexes. As a result of the very limited information provided by G20 economies on their programmes of global economic support, it has not been possible to establish a separate annex on such measures. A summary table, listing all trade measures recorded since the beginning of the trade monitoring exercise in October 2008 with an indication of their status, as updated by G20 delegations, is made available separately, and can be downloaded from the WTO's website.4 This information is also publicly available through the Trade Monitoring Data Base (TMDB).5
1.7. Information on measures included in this report has been collated from inputs submitted by G20 economies and from other official and public sources. Initial responses to the Director-General's request for information were received from all G20 delegations. These data, as well as information collected from other sources, were returned for verification. All G20 economies participated in the verification process. In a number of cases, however, the Secretariat received only partial responses and often significantly after the indicated deadline. While this may in some cases have prevented the Secretariat from fully taking into account information submitted, such information will be reflected in the Director-General's Annual Report for the Overview of Developments in the International Trading Environment in November 2017. Where it has not been possible to confirm the information, this is noted in the Annexes.
3 Unless otherwise indicated in the relevant Section. 4 https://www.wto.org/english/tratop_e/tpr_e/trade_monitoring_e.htm 5 http://tmdb.wto.org/
9
1.8. The OECD has contributed four topical boxes to this report. The first looks at trade facilitation and the global economy and provides an update of the OECD Trade Facilitation Indicators. The second identifies measures that affect government procurement. The third develops a typology to analyse and measure digital trade and the last, discusses SMEs and the cost of services trade restrictions.

10
2 RECENT ECONOMIC AND TRADE DEVELOPMENTS
2.1 Overview
2.1. World merchandise trade growth in 2016 was the lowest since the global financial crisis, just 1.3% in volume terms as measured by the average of exports and imports. The pace of expansion was half as strong as in 2015, when trade grew 2.6%, and well below the 4.7% average rate since 1980.
2.2. Sluggish trade volume growth in 2016 was accompanied by world real GDP growth of 2.3% at market exchange rates, down from 2.6% in the previous year and below the 2.8% average since 1980.
2.3. Reasons for the lacklustre performance of trade and output growth last year are multi-faceted, including cyclical and structural factors. The most trade-intensive components of GDP were weak in 2016, as investment spending slumped in the United States and as China continued to rebalance its economy away from investment and towards consumption. Primary commodity prices also remained low compared to their levels of a few years ago, depriving oil-based economies in particular of export revenues needed to purchase imports.
2.4. Export volumes grew at around the same rate in both developed economies (1.4%) and developing economies (1.3%) in 2016. Import growth was modest in developed countries (2%) and stagnant in developing economies (0.2%). Developing economies suffered a sharp 3% quarter-on-quarter decline in their volume of imports in the first quarter of 2016, equivalent to an annual rate of -11.6%, but growth resumed in the second quarter and losses were recovered by the end of the year. Meanwhile imports of developed economies were flat throughout the year.
2.5. Despite weak but positive growth in volume terms, the dollar value of world merchandise trade declined for the second year in a row due to falling export and import prices. World merchandise exports were valued at US$15.46 trillion in 2016, down 3.3% from the previous year. The pace of contraction was slower than in 2015, when export values fell 13.5% due to a strong appreciation of the U.S. dollar and plunging oil prices.
2.6. The value of world commercial services exports was nearly unchanged in 2016, increasing by just 0.1% to $4.77 trillion. As with merchandise trade, nominal trade values for commercial services are strongly affected by changes in prices and exchange rates and should be interpreted with caution.
2.7. Trade is expected to strengthen globally in 2017 and 2018, but only if governments pursue an appropriate mix of policies and the global economic recovery proceeds as expected. In its most recent forecast of 12 April, the WTO Secretariat projected merchandise trade volume growth of 2.4% in 2017, but due to a high level of economic and policy uncertainty this is placed within a range from 1.8% to 3.6%. Trade growth should pick up slightly in 2018 to between 2.1% and 4%.
2.2 Economic Developments
2.8. The volume of world merchandise trade has generally grown faster than world real GDP at market exchange rates since the Second World War (about 1.5 times on average), although in the 1990s trade grew more than twice as fast as output. However, since the onset of the global financial crisis in 2008, trade and output have grown at roughly the same rate, with a 1:1 ratio prevailing between the two indicators. Last year marked the first time since 2001 that the ratio of trade growth to GDP growth dipped below 1, falling to 0.6. This ratio is expected to recover partly in 2017, but the continued weakness of trade growth relative to GDP growth remains a source of concern.
2.9. Global economic activity picked up gradually during the review period, although growth remains unsteady and unbalanced. GDP strengthened in major economies in the third and fourth quarters of 2016 before slowing in the first quarter of 2017. Output in the United States grew at an average rate of 2.8% (seasonally adjusted and annualized) in the second half of 2016, up from 1.1% in the first half, but the pace of expansion slowed to 0.7% in the first quarter of 2017.

11
Unemployment has continued to decline, falling to 4.4% in April from 4.9% in the second quarter of last year.
2.10. GDP growth was steady in the European Union in 2016, increasing slightly from 1.8% on average in the first half of the year to 2% in the second half, and remained at 2% in the first quarter of 2017. Unemployment in the European Union has declined gradually to 8% in March from 8.5% in the first half of 2016, but jobless rates vary considerably across EU Member countries. For example, Germany’s unemployment rate was 3.9% in the latest period while the rate for France was 10.1%.
2.11. Japan’s GDP growth remained weak but positive in the second half of 2016, averaging 1.2% in Q3 and Q4. This is down slightly from the 2% average rate observed in the first half of the year. Figures for GDP growth in the first quarter of 2017 are not available yet. The country's unemployment rate is low by developed country standards and continues to decline, falling to 2.8% in March 2017 from 3% at the start of the year.
2.12. China’s GDP growth rose to approximately 7.2% (annualized and seasonally adjusted) in the second half of 2016 from around 6.6% in the first half of the year. No comparable harmonized employment rates are available for China, but economic activity and presumably employment continues to shift gradually away from manufacturing and toward services.
2.13. The economic situation in South and Central America remained deeply negative, as Brazil's economy continued to contract (-3.1% annual rate) in the second half of 2016. In contrast, GDP growth in Argentina picked up to 1.1% in the second half of last year after falling 5.3% in the first half.
2.14. Significant fluctuations in exchange rates in recent years have strongly influenced nominal trade and economic statistics, most of which are denominated in current U.S. dollars. These developments are illustrated by Chart 2.1, which shows nominal effective exchange rate indices for selected economies from the Bank for International Settlements (BIS) through April 2017. In 2016, the U.S. dollar appreciated 4.4% on average against the currencies of US trading partners (i.e. in "nominal effective" terms) after having risen nearly 13% in 2015. Dollar appreciation contributes to lower dollar prices for commodities since it allowed the same quantity of goods to be purchased with fewer units of currency.
2.15. Other exchange rate developments in 2016 included a 4.6% average depreciation of China’s yuan against the currencies of its trading partners and a 10% decline in the average value of sterling. The yuan had risen 9.5% in 2015 so the devaluation in 2016 could be seen as a correction. Meanwhile, the nominal effective exchange rate of the euro remained stable in 2016, with a modest rise of 1.9%. The nominal effective exchange rate of the U.S. dollar is up around 20% since the start of 2015, while sterling is down around 8%.
2.16. Dollar appreciation can cause trade denominated in other currencies (e.g. intra-EU trade) to be undervalued when measured in dollar terms. As a result, trade statistics in nominal dollar terms should be interpreted with caution under current circumstances.

12
Chart 2.1 Nominal effective exchange rate indices for selected G20 economies, January 2014 - April 2017 a
(index, January 2014 = 100)
60
70
80
90
100
110
120
130
United States Japan China Brazil Euro area United Kingdom
a Nominal effective exchange rate indices against a broad basket of currencies.
Source: BIS.
2.17. Monthly primary commodity prices have risen steadily since the start of last year, although growth for the whole of 2016 (i.e. the 12 months of 2016 compared to the previous 12 months) remained negative. Fuels saw the biggest decline in prices of any category of primary commodities year-on-year, falling 16.5%. Smaller declines were recorded for agricultural raw materials (-5.7%) and metals (-5.4%). In contrast, food prices increased slightly (1.3%). Commodity prices overall fell around 10% in 2016, i.e. considerably less than the 35% drop recorded in 2015, but still significant, particularly for resource-producing countries whose export earnings have continued to fall (albeit at a slower pace).
2.18. Commodity prices are up in 2017 for the year-to-date (i.e. January-April). For example, fuel prices are up 48.3% compared to the same period in 2016, but they are still down 47.8% compared to their level at the start of 2014 (Chart 2.2).
2.19. The persistent weakness of fuel prices is partly explained by the resilience of oil production in the United States, including production from non-traditional sources such as shale. According to the US Energy Information Administration, oil output declined in the first half of 2016 but rose in the second half, limiting the year-on-year decline in output to 5.5%. Production for the whole of 2016 was still 77% higher than the level recorded in 2008. Despite a firming of oil prices since the start of 2016, a return to prices in the neighbourhood of US$100 oil/barrel is unlikely at current production levels.

13
Chart 2.2 Prices of primary commodities, January 2014 - April 2017
(index, January 2014 = 100)
20
40
60
80
100
120
Food and beverages Agricultural raw materials Metals Fuel
y
Source: IMF Primary Commodity Prices. 2.3 Merchandise Trade
2.20. Chart 2.3 shows year-on-year growth in the dollar value of merchandise trade (red line), as well as relative contributions to nominal trade growth from developed and developing economies (stacked bars). Year-on-year growth in the dollar value of world trade returned to positive values in the fourth quarter of 2016 after eight months of contraction. Developing economies have been a greater drag on world import demand since the fourth quarter of 2015. This stands in contrast to the period during and immediately following the global financial crisis, when imports of emerging markets in particular helped cushion the global downturn. Higher oil prices and reduced financial volatility in Asia may boost imports of developing economies in 2017 and beyond.

14
Chart 2.3 Contributions to year-on-year growth in world merchandise exports and imports, 2014Q1 - 2016Q4
(% change in US$ values)
1.8 0.8 0.6
-2.1
-6.7 -6.3 -6.0 -5.3
-2.4-0.1 -0.2
1.2-0.4
1.2 1.6
-2.0
-5.8 -6.9-8.6
-6.9
-6.3
-3.6-1.9
0.9
1.42.0 2.2
-4.1
-12.5-13.2
-14.6
-12.2
-8.7
-3.7
-2.1
2.0
-20
-15
-10
-5
0
5
10
2014Q1 2014Q2 2014Q3 2014Q4 2015Q1 2015Q2 2015Q3 2015Q4 2016Q1 2016Q2 2016Q3 2016Q4
Developed economies Developing economiesa
World, year-on-year percentage change
2.1 2.31.1
-2.3
-6.7-6.8
-6.7-5.1
-2.6-0.4 -0.2 0.4-0.1 -0.3
0.5
-0.8
-5.4 -5.7-6.7
-6.5
-5.6
-3.1-2.1
0.7
2.0 2.0 1.7
-3.1
-12.1 -12.5-13.3
-11.6
-8.2
-3.5-2.3
1.1
-20
-15
-10
-5
0
5
10
2014Q1 2014Q2 2014Q3 2014Q4 2015Q1 2015Q2 2015Q3 2015Q4 2016Q1 2016Q2 2016Q3 2016Q4
Exports
Imports
a Includes significant re-exports. Also includes the Commonwealth of Independent States (CIS).
Note: Due to scarce data availability, Africa and Middle East are under-represented in world totals.
Source: WTO Secretariat estimates based on data compiled from IMF International Financial Statistics; Eurostat Comext Database; Global Trade Atlas; and national statistics.

15
Chart 2.4 Volume of exports and imports of selected economies, 2012Q1 - 2016Q4
(seasonally adjusted volume indices, 2012Q1 = 100)
70
80
90
100
110
120
130
2012
Q1
Q2
Q3
Q4
2013
Q1
Q2
Q3
Q4
2014
Q1
Q2
Q3
Q4
2015
Q1
Q2
Q3
Q4
2016
Q1
Q2
Q3
Q4
70
80
90
100
110
120
130
2012
Q1
Q2
Q3
Q4
2013
Q1
Q2
Q3
Q4
2014
Q1
Q2
Q3
Q4
2015
Q1
Q2
Q3
Q4
2016
Q1
Q2
Q3
Q4
Exports
Imports
Japan
EU-extra trade EU-intra tradeUnited States
Developing Asia
Brazil
Note: Data for the United States, Japan and the European Union were obtained from national statistical
sources while figures for Brazil and Developing Asia are seasonally adjusted Secretariat estimates.
Source: WTO and UNCTAD Secretariats.
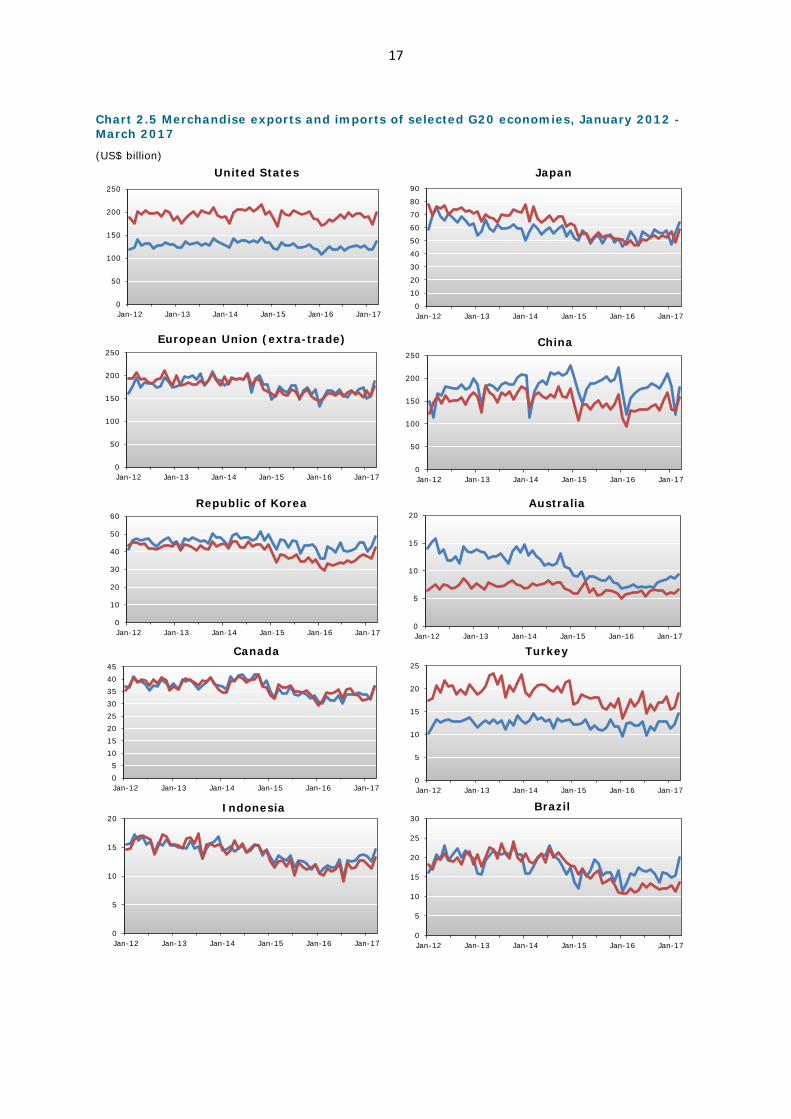
2.21. Merchandise trade in volume terms grew moderately in leading economies in the second half of 2016, Brazil's exports and extra-EU imports being notable exceptions. Exports and imports of the United States were up 2.7% and 2.6%, respectively, in 2016Q4 compared to 2016Q2. Extra-EU exports were up 3.5% and extra-EU imports down 1.2% over the same period, with intra-EU trade up by 1.0%. Japan's exports rose 4% between 2016Q2 and 2016Q4, while the
16
country's imports only increased slightly (0.2%) over the same interval. Exports of developing Asia (including China) were only up 1.8% during this period, but imports rose 4%. Finally, Brazil's exports fell 8.6% (albeit from a high level), while imports remained deeply depressed, dropping a further 0.9% between Q2 and Q4.
2.22. Growth in most countries has continued to strengthen in the first quarter of 2017, although the fact that data are reported in nominal U.S. dollar terms means that exchange rate fluctuations have to be taken into account when considering developments for particular economies.
2.4 Trade in Commercial Services
2.23. Year-on-year growth in world exports of commercial services strengthened in 2016Q3 before weakening in 2016Q4. Weakness in the last period was mostly due to falling services trade in Europe, since export and import growth in North America and Asia remained relatively strong through to the end of the year. The diminished performance in Europe may have been due to increased uncertainty and exchange rate fluctuations following the Brexit referendum and the United Kingdom's decision to leave the European Union. The United Kingdom is a major exporter of commercial services, accounting for 12% of total EU exports and 17% of EU imports in 2015. It remains to be seen whether this weakness will be persistent or temporary.
2.24. Chart 2.5 shows year-on-year growth in the U.S. dollar value of commercial services trade for selected economies through 2016Q4. The strongest export growth in the fourth quarter was recorded by India (11%) followed by Japan (9%). The biggest declines were registered by China (-5%) and the Russian Federation (-4%). EU exports to the rest of the world, i.e. extra-EU exports, were down 4% in Q4. Although not shown in this Chart, exports of the United Kingdom were down 10.1%, including trade with the rest of the European Union.
2.25. Asian economies recorded strong year-on-year import growth in the fourth quarter of 2016, including India (17%), China (13%) and Japan (6%). Growth also turned positive in Brazil (5%) following steep declines earlier in the year. Extra-EU imports declined by 5% in Q3 and by 6% in Q4, partly due to falling imports of the United Kingdom, which dropped 14%. Large declines in EU countries could reflect exchange rate fluctuations. Unfortunately, there is no volume indicator for services trade akin to the WTO's merchandise trade indices to gauge the quantity of services transactions.
17
Chart 2.5 Merchandise exports and imports of selected G20 economies, January 2012 - March 2017
(US$ billion)
United States Japan
European Union (extra-trade) China
Canada Turkey
0
50
100
150
200
250
Jan-12 Jan-13 Jan-14 Jan-15 Jan-16 Jan-170
10
20
30
40
50
60
70
80
90
Jan-12 Jan-13 Jan-14 Jan-15 Jan-16 Jan-17
0
50
100
150
200
250
Jan-12 Jan-13 Jan-14 Jan-15 Jan-16 Jan-170
50
100
150
200
250
Jan-12 Jan-13 Jan-14 Jan-15 Jan-16 Jan-17
0
10
20
30
40
50
60
Jan-12 Jan-13 Jan-14 Jan-15 Jan-16 Jan-170
5
10
15
20
Jan-12 Jan-13 Jan-14 Jan-15 Jan-16 Jan-17
AustraliaRepublic of Korea
05
1015202530354045
Jan-12 Jan-13 Jan-14 Jan-15 Jan-16 Jan-170
5
10
15
20
25
Jan-12 Jan-13 Jan-14 Jan-15 Jan-16 Jan-17
0
5
10
15
20
Jan-12 Jan-13 Jan-14 Jan-15 Jan-16 Jan-17
Indonesia
0
5
10
15
20
25
30
Jan-12 Jan-13 Jan-14 Jan-15 Jan-16 Jan-17
Brazil

18
Russian Federation India
GermanyItaly
United Kingdom Argentina
Imports Exports
0
10
20
30
40
50
60
Jan-12 Jan-13 Jan-14 Jan-15 Jan-16 Jan-1705
101520253035404550
Jan-12 Jan-13 Jan-14 Jan-15 Jan-16 Jan-17
0
2
4
6
8
10
12
Jan-12 Jan-13 Jan-14 Jan-15 Jan-16 Jan-17
South Africa
0
10
20
30
40
50
60
70
Jan-12 Jan-13 Jan-14 Jan-15 Jan-16 Jan-17
France
0
20
40
60
80
100
120
140
160
Jan-12 Jan-13 Jan-14 Jan-15 Jan-16 Jan-170
10
20
30
40
50
60
Jan-12 Jan-13 Jan-14 Jan-15 Jan-16 Jan-17
0
10
20
30
40
50
60
70
Jan-12 Jan-13 Jan-14 Jan-15 Jan-16 Jan-170
1
2
3
4
5
6
7
8
9
Jan-12 Jan-13 Jan-14 Jan-15 Jan-16 Jan-17
Mexico
0
10
20
30
40
50
Jan-12 Jan-13 Jan-14 Jan-15 Jan-16 Jan-17
Note: Data not available for the Kingdom of Saudi Arabia.
Source: IMF International Financial Statistics, Global Trade Information Services, Global Trade Atlas database, national statistics.

19
Chart 2.6 Commercial services exports and imports of selected G20 economies, 2015Q4 - 2016Q4
(year-on-year % change in current US$ values)
-35
-30
-25
-20
-15
-10
-5
0
5
10
15
20
25
United States European Union(extra)
Japan China India Brazil RussianFederation
-30
-25
-20
-15
-10
-5
0
5
10
15
20
25
30
United States European Union(extra)
Japan China India Brazil RussianFederation
Exports
Imports
2016Q32015Q4 2016Q1 2016Q2 2016Q4
Source: WTO and UNCTAD Secretariats.
2.5 Trade Forecast and Economic Outlook
2.26. Several leading indicators of world merchandise trade volumes were up sharply in the first quarter of 2017, including container shipping, air freight and export orders. This could point to stronger global trade growth, at least in the short-run. Balanced against these positive signals are

20
several clear and significant downside risks. Unexpected inflation could force central banks to tighten monetary policy more quickly than they would like, undercutting economic growth and trade. Changes in fiscal policy could also have unintended consequences for economic activity and trade flows. Uncertainty due to the United Kingdom's withdrawal from the European Union could also have an impact on regional and global trade growth. Finally, increased use of restrictive trade measures could affect demand and investment over the longer term. In light of these considerations, the likelihood of downside risks emerging in 2017 and beyond is considerable.
2.27. The WTO's most recent trade forecast of 12 April 2017 predicted merchandise trade volume growth of 2.4% in 2017. Due to the presence of significant downside risks and the prolonged weak trade growth in recent years, this estimate is placed within a range of 1.8% to 3.6%. The central estimate depends on developed economies maintaining generally accommodative fiscal and monetary policies, on economic recovery proceeding as expected in emerging economies, and on restrictive trade measures not proliferating. World trade growth could be as low as 1.8% in 2017 if downside risks emerge, or it could be as high as 3.6% if economic conditions strengthen. In 2018 trade volume growth should be between 2.1% and 4% (Table 2.1).
Table 2.1 Merchandise trade volume and real GDP growth, 2013-2018
(annual % change)
2013 2014 2015 2016 2017d 2018d Volume of world merchandise tradea 2.4 2.7 2.6 1.3 2.4 (1.8-3.6) 2.1-4.0
Exports Developed economies 1.7 2.4 2.7 1.4 2.8 (1.9-4.0) 2.1-4.2 Developing economiesb 4.0 3.0 2.0 1.3 2.2 (1.8-3.4) 2.0-4.0 North America 2.7 4.2 0.7 0.5 3.2 (2.7-4.0) 3.7-4.7 South and Central America 1.7 -2.2 2.5 2.0 1.4 (1.3-1.6) 2.2-2.6 Europe 1.7 2.0 3.6 1.4 2.8 (2.0-4.2) 1.9-4.1 Asia 5.4 4.3 1.1 1.8 2.5 (1.7-3.9) 1.9-4.4 Other regionsc 0.5 0.9 4.3 0.3 0.8 (1.1-2.0) 1.0-3.0 Imports Developed economies 0.0 3.6 4.7 2.0 3.0 (2.2-4.4) 2.0-4.0 Developing economiesb 4.6 1.7 0.5 0.2 2.2 (1.8-3.3) 2.5-4.3 North America 1.3 4.8 6.7 0.4 3.0 (1.8-4.8) 2.5-5.1 South and Central America 4.5 -2.4 -5.8 -8.7 0.1 (-0.6-1.0) 1.0-3.0 Europe -0.2 3.2 4.3 3.1 2.9 (2.0-4.2) 1.6-3.6 Asia 4.8 3.0 2.9 2.0 3.2 (3.2-4.1) 2.8-4.6 Other regionsc 1.8 -0.9 -5.1 -2.4 0.5 (-0.4-1.8) 2.5-3.0 Real GDP at market exchange rates 2.2 2.6 2.6 2.3 2.7 2.8
Developed economies 1.1 1.7 2.2 1.6 2.0 2.0 Developing economiesb 4.6 4.2 3.5 3.5 4.0 4.2 North America 1.7 2.4 2.5 1.6 2.3 2.7 South and Central America 3.3 0.6 -0.9 -2.0 1.0 2.0 Europe 0.5 1.6 2.2 1.9 1.8 1.7 Asia 4.4 4.0 4.2 4.1 4.3 4.0 Other regionsc 2.7 2.5 1.1 1.7 2.4 3.0
a Average of exports and imports. b Includes the CIS, including associate and former member States. c Other regions comprise Africa, Middle East and CIS, including associate and former member States. d Figures for 2017 and 2018 are projections.
Source: WTO Secretariat (for trade); consensus estimates for GDP, with data source from the International Monetary Fund (IMF), OECD, the United Nations, the Economist Intelligence Unit (EIU) and national sources.

21
Box 2.1 The WTO World Trade Outlook Indicator
In 2016 the WTO launched the World Trade Outlook Indicator (WTOI), which is designed to provide “real time” information on the current trajectory of world trade and clues about its direction in the near future. The WTOI combines 6 component indices of trade-related data into an overall index that signals trade conditions 3-4 months ahead of quarterly trade volume data. Index values of 100 indicate trade growth in line with medium-term trends, while readings greater or less than 100 suggest above or below trend growth. The WTOI’s component indices are either leading with respect to world trade or coincide with trade data but are available earlier. These include: - export orders reported by manufacturers in purchasing managers indices; - international air freight in freight tonne kilometres (FTKs) from the International Air Transport Association (IATA); - container throughput of major ports, in twenty-foot equivalent (TEU) units; - automobile sales and/or production in selected economies; - customs data on electronic components trade in physical units; and - customs data on agricultural raw materials trade in physical units. The latest WTOI release of 15 May 2017 had an overall reading of 102.2, which is up slightly from 102.0 in the previous release of 14 February 2017. These values suggest that trade volume growth will likely be above trend in the first and second quarters of 2017 once complete data for these periods are available. These results are broadly in line with the WTO trade forecast issued on 12 April, which foresaw a return to moderate trade growth this year after sluggish expansion last year. Increased strength in the overall index is tempered by weakness in certain component indices. Export orders, container shipping and air freight have all recorded strong gains in recent months, but these upward trends are balanced by weaker demand for automotive products, electronics and agricultural raw materials.
World Trade Outlook Indicator 102.2 Drivers of trade(Index, trend = 100) Level of Direction
Index of change
Merchandise trade volume (Q2) 98.6
Export orders 104.2
International air freight (IATA) 104.4
Container port throughput 104.1
Automobile production and sales 99.7
Electronic components 97.9
Agricultural raw materials 98.6
The main contribution of the WTOI is to identify turning points and to gauge momentum in world trade. It has performed well since its launch in July of last year, correctly signalling weak trade growth in 2016 and acceleration in the first quarter of 2017. Although is not a forecast per se, it complements trade statistics and forecasts from the WTO and other organizations and contributes to better monitoring of global trade developments. The WTO will continuously evaluate the indicator going forward and make adjustment from time to time as necessary to enhance its performance.
Source: WTO Secretariat.

22
3 TRADE AND TRADE-RELATED POLICY DEVELOPMENTS
3.1. The following Sections seek to provide in-depth analysis of selected trade and trade-related policy developments during the period from mid-October 2016 to mid-May 2017.
3.1 Overview of trends identified during the period under review
3.2. This G20 Report introduces a separate annex for trade remedy measures consistent with the practice followed for the WTO-wide trade monitoring reports since November 2012. Up until now, the G20 Report included trade remedies in the analysis of trade-restrictive as well as trade-facilitating measures, i.e. the initiation of a trade remedy investigation was considered as being trade-restrictive and the termination of a trade remedy action was considered facilitating. This approach has proved controversial and over the past few years several G20 economies have voiced concerns similar to those which were at the core of the changes made to the WTO-wide methodology in 2012.6
3.3. The introduction of a separate annex for trade remedy measures and the separate treatment and analysis of trends in this area have important implications for the numbers and conclusions of this Report, particularly given the generally very significant share of trade remedy actions in the overall number of trade measures. At the same time, despite the changes in several headline numbers, this Report covers and crystalizes the same factual information as previously.7 To facilitate comparisons, this Report will provide the findings for the present and previous review periods, as well as the annual figures from 2012-2016, using the new methodology.
3.4. The trade monitoring exercise is first and foremost about transparency, intended to be purely factual and without prejudice to the rights and obligations of WTO Members. It is hoped that this change will facilitate and focus the substantive debate on recent trends in the implementation of trade measures and on the merits of transparency and predictability in trade policy-making.
3.5. A total of 292 trade measures were recorded for the G20 economies by this Report for the review period.8 This overall figure includes measures facilitating trade, trade remedy measures and other trade and trade-related measures (restrictive measures).
3.1.1 Measures Facilitating Trade
3.6. Annex 1 to this Report lists measures which may be considered as trade facilitating.
3.7. During the review period, 42 measures aimed at facilitating trade were recorded for G20 economies (Table 3.1) which represent just over 14% of the total number of measures recorded. This figure does not include terminations of trade remedy actions. The monthly average of six trade facilitating-measures recorded for the period is similar to the average recorded for the previous period, but below the averages recorded over the past few years. More importantly, however, is the fact that the estimated trade coverage9 of the import-facilitating measures recorded for the review period (US$162.6 billion) is more than three times higher than the estimated trade coverage of import-restrictive measures (US$47 billion). More detailed information on these numbers is provided below.
6 According to many WTO Members, trade remedy measures are taken to address market distortions
resulting from trade practices in another trading partner. The WTO Antidumping and Subsidies Agreements permit WTO Members to impose duties to offset what is perceived to be injurious dumping or subsidization of products exported from one Member to another. The Monitoring Reports are not in a position to establish if, where or when such perceived distortive practices have taken place.
7 A single methodology applied to the counting of anti-dumping and countervailing investigations is being applied across sections 3.1 and 3.2, i.e. on the basis of the number of exporting countries or customs territories affected by an investigation or by a termination. Thus, one anti-dumping or countervailing investigation involving imports from n countries/customs territories is counted as n investigations. Similarly, the termination of an anti-dumping or countervailing action is counted as n terminations.
8 See annexes 1-3. These annexes do not include SPS, TBT and services measures, which are dealt with in Sections 3.3, 3.4, and 4 and Annex 4
9 The value of trade is calculated using the UNSD Comtrade database, and is counted at the six-digit tariff line level. In cases where the same product is subject to more than one restrictive measure against the same partner, the trade coverage is counted only once. When the relevant HS codes were not provided or could not be clearly identified, no calculation was done.

23
3.8. From Table 3.1 it can also be seen that among trade facilitating measures, the reduction or elimination of import tariffs continues to represent the vast majority.10 Simplified customs procedures for imports were also recorded for some G20 economies. On the export side, the elimination and simplification of customs procedures, as well as the reduction or abolishment of export duties were recorded. No elimination or easing of quantitative restrictions on exports were recorded for the present review period.
Table 3.1 Measures facilitating trade (Annex 1)
Type of measure 2012 2013 2014 2015 2016
Mid
-May
16
to
mid
-Oct
16
(5 m
onth
s)
Mid
-Oct
16
to
m
id-M
ay 1
7
(7 m
onth
s)
Import 96 71 77 74 61 26 34 - Tariff 77 55 63 58 49 24 29 - Customs procedures 12 15 8 12 8 2 5 - Tax 1 1 0 3 3 0 0 - QRs 6 0 6 1 1 0 0 Export 9 10 5 25 12 4 8 - Duties 4 3 2 10 6 1 2 - QRs 3 6 1 3 0 0 0 - Other 2 1 2 12 6 3 6 Other 4 1 1 2 2 0 0 - Othera 4 1 1 2 2 0 0 - Local content 0 0 0 0 0 0 0 Total 109 82 83 101 75 30 42 Average per month 9.1 6.8 6.9 8.4 6.3 6.0 6.0
a Other than local content measures.
Source: WTO Secretariat.
3.9. The trade coverage of the import-facilitating measures introduced during the review period was US$162.6 billion, i.e. 1.29% of the value of G20 merchandise imports or 0.99% of the value of world merchandise imports.11 The HS Chapters within which the majority of trade facilitating measures were taken include mineral fuels and oils (HS27) 40.0%, machinery and mechanical appliances (HS84) 19.6%, electrical machinery and parts thereof (HS85) 6.8% and animal and vegetable fats and oils (HS15) 4.1%.12
10 For example: reduction or elimination of import tariffs on capital goods, telecommunication and
informatics. 11 The trade coverage of a measure is calculated to be the value of imports of the specific product
concerned from countries affected by the measure as a share of either the value of merchandise imports of G20 economies or the value of total world merchandise imports. Highly-traded goods may significantly influence trade coverage estimates.
12 These figures do not include import-facilitating measures implemented in the context of the ITA Expansion Agreement (see Box 3.1).
24
Box 3.1 Trade coverage of the ITA Expansion Agreement
The review period covered by this 17th WTO Report on G20 Trade Measures covers measures resulting from the implementation of the ITA Expansion Agreement.
According to preliminary Secretariat estimates the trade coverage of the import-facilitating measures implemented during the review period in the context of the ITA Expansion Agreement amounted to US$88.1 billion or around 0.7% of the value of G20 merchandise imports.a These measures were implemented by Australia and the Republic of Korea and are reflected in Annex 1.
Given the very significant trade coverage value of these measures, they have not been included in the figures evaluating the trade coverage of the trade-facilitating measures in Section 3.1 as it would undermine the value of any comparison with previous reports.
For more details on the ITA Expansion Agreement see Section 3.7. ______________ a Calculated at HS six-digit level and using 2015 import figures.
Source: WTO Secretariat.
3.1.2 Trade Remedy Actions
3.10. In this G20 Report, trade remedy actions are listed separately. A detailed overview of these measures is contained in Annex 2. This Section now applies the same methodology to the counting of anti-dumping and countervailing investigations as in Section 3.2, i.e. on the basis of the number of exporting countries or customs territories affected by an investigation or a termination. Thus, one anti-dumping or countervailing investigation involving imports from n countries/customs territories is counted as n investigations.13 Similarly, a termination of an imposed measure on imports from n countries/customs territories is counted as n terminations.
3.11. During the review period, 208 trade remedy actions were recorded for G20 economies (Table 3.2), i.e. 71% of the total of all trade measures recorded for the period under review. As can be seen from the table, G20 economies historically have initiated a significantly higher number of new trade remedy investigations compared to the number of terminations of trade remedy actions.14 In fact, during the review period, initiations of trade remedy investigations represented 50% of the total trade measures taken. At the same time, the period under review witnessed a deceleration of the monthly average of initiations compared to the previous period. Similarly, the monthly average of terminations also fell.
3.12. Initiations of anti-dumping investigations continue to be the most frequent trade remedy action, accounting for around 85% of all initiations. The monthly average of anti-dumping investigations fell slightly compared to the previous period, but remained broadly at the level detected in 2016.
13 The coverage of trade remedy actions in this report in no way prejudges the right of WTO Members to
take trade remedy actions. See also Box 1. 14 Termination means either the termination of the investigation (without imposition of a measure) or
elimination of the imposed measure.

25
Table 3.2 Trade remedy actions (Annex 2)
Type of measure 2012 2013 2014 2015 2016
Mid
-May
16
to
mid
-Oct
16
(5 m
onth
s)a
Mid
-Oct
16
to
mid
-May
17
(7
mon
ths)
Initiations 201 278 258 211 264 125 146 - AD 166 238 208 176 228 112 124 - CVD 22 33 37 31 30 9 20 - SG 13 7 13 4 6 4 2 Average per month 16.8 23.2 21.5 17.6 22.0 25.0 20.9 Terminations 159 153 171 151 129 53 62 - AD 128 135 144 122 113 45 54 - CVD 21 15 21 19 9 6 7 - SG 10 3 6 10 7 2 1 Average per month 13.3 12.8 14.3 12.6 10.8 10.6 8.9
a After the last G20 report was published on 10 November, India notified four AD investigations with initiation dates falling in the review period (before 16 November 2016).
Note: The information on trade remedy actions for 2012-2016 is based on the semi-annual notifications by G20 economies. For mid-October 2016 to mid-May 2017, the information is based on the responses and the verification received directly from G20 economies during the preparations for the present Report. Anti-circumvention measures are not included in the above numbers.
Source: WTO Secretariat.
3.13. The trade remedy actions taken during the review period covered a wide range of products. In the case of initiations of investigations, the main sectors (HS Chapters) were wood and articles of wood (HS44) 27.9%, vehicles (HS87) 19.7%, furniture, bedding material, lamps (HS94) 14.7%, articles of iron and steel (HS73) 10%. For terminations, the main sectors were articles of iron and steel (HS73) 29.5%, machinery and mechanical appliances (HS84) 27.4%, aluminium and articles thereof (HS76) 12.4% and electrical machinery and parts thereof (HS85) 6.5%.
3.14. The trade coverage of all trade remedy investigations introduced during the review period was US$25.1 billion, i.e. 0.20% of the value of G20 merchandise imports or 0.15% of the value of world merchandise imports (Table 3.3).
Table 3.3 Share of trade covered by trade remedy initiations
Mid
- N
ov 1
3 t
o m
id-
May
14
a
M
id-
May
to
mid
- O
ct 1
4b
Mid
- O
ct 1
4 t
o m
id-
May
15
b
Mid
-May
to
mid
- O
ct 1
5c
Mid
-Oct
15
to
mid
-May
16c
Mid
-May
to
mid
-Oct
16
d
Mid
-Oct
16
to
m
id-M
ay 1
7
(7 m
onth
s)d
Share in G20 imports
0.08 0.13 0.11 0.10 0.47 0.11 0.20
Share in total world imports
0.06 0.10 0.08 0.08 0.36 0.08 0.15
a Based on 2012 import data. b Based on 2013 import data. c Based on 2014 import data. d Based on 2015 import data.
Note: Calculations are based on restrictions implemented since October 2008 and still in place. These percentages represent rough estimates of the trade coverage of the restrictive measures.
Source: WTO Secretariat.
26
3.1.3 Other Trade and Trade-Related Measures15
3.15. Annex 3 to this Report lists measures which may be considered to have a trade-restrictive effect.
3.16. A total of 42 new trade-restrictive measures were recorded for G20 economies during the review period, amounting to a monthly average of six measures. This represents a slight increase over the previous period, but still remains lower than most monthly averages recorded in recent years. As mentioned above, although the monthly average of trade-restrictive measures is identical to the average of trade facilitating measures recorded during the review period, the estimated trade coverage of the import-restrictive measures (US$47 billion) is significantly lower than the trade coverage of the import-facilitating measures (US$162.6 billion).
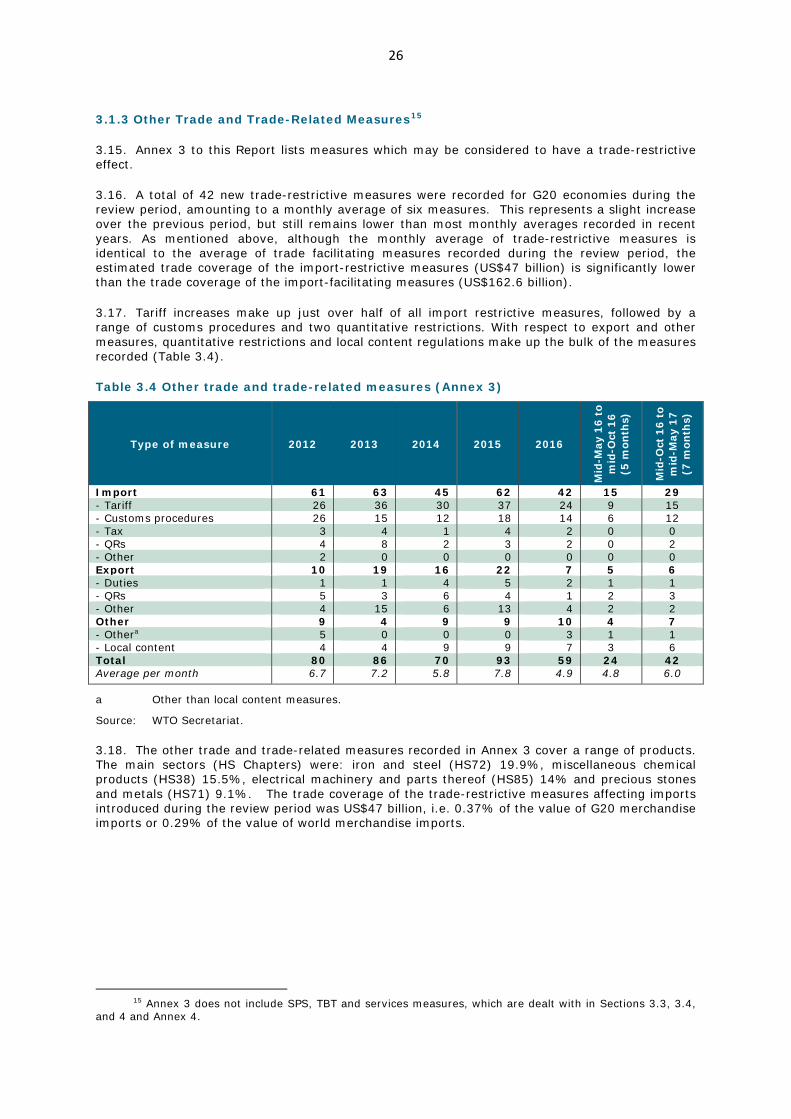
3.17. Tariff increases make up just over half of all import restrictive measures, followed by a range of customs procedures and two quantitative restrictions. With respect to export and other measures, quantitative restrictions and local content regulations make up the bulk of the measures recorded (Table 3.4).
Table 3.4 Other trade and trade-related measures (Annex 3)
Type of measure 2012 2013 2014 2015 2016
Mid
-May
16
to
mid
-Oct
16
(5 m
onth
s)
Mid
-Oct
16
to
mid
-May
17
(7 m
onth
s)
Import 61 63 45 62 42 15 29 - Tariff 26 36 30 37 24 9 15 - Customs procedures 26 15 12 18 14 6 12 - Tax 3 4 1 4 2 0 0 - QRs 4 8 2 3 2 0 2 - Other 2 0 0 0 0 0 0 Export 10 19 16 22 7 5 6 - Duties 1 1 4 5 2 1 1 - QRs 5 3 6 4 1 2 3 - Other 4 15 6 13 4 2 2 Other 9 4 9 9 10 4 7 - Othera 5 0 0 0 3 1 1 - Local content 4 4 9 9 7 3 6 Total 80 86 70 93 59 24 42 Average per month 6.7 7.2 5.8 7.8 4.9 4.8 6.0
a Other than local content measures.
Source: WTO Secretariat.
3.18. The other trade and trade-related measures recorded in Annex 3 cover a range of products. The main sectors (HS Chapters) were: iron and steel (HS72) 19.9%, miscellaneous chemical products (HS38) 15.5%, electrical machinery and parts thereof (HS85) 14% and precious stones and metals (HS71) 9.1%. The trade coverage of the trade-restrictive measures affecting imports introduced during the review period was US$47 billion, i.e. 0.37% of the value of G20 merchandise imports or 0.29% of the value of world merchandise imports.
15 Annex 3 does not include SPS, TBT and services measures, which are dealt with in Sections 3.3, 3.4,
and 4 and Annex 4.

27
Table 3.5 Share of trade covered by import-restrictive measures (Annex 3)
Mid
- N
ov 1
3 t
o m
id-
May
14
a
Mid
- M
ay
to m
id-
Oct
14
b
M
id-
Oct
14
to
mid
- M
ay 1
5b
Mid
-M
ay t
o m
id-
Oct
15
c
Mid
-Oct
15
to m
id-
May
16c
Mid
-M
ay t
o m
id-
Oct
16
d
Mid
-Oct
16
to m
id-
May
17d
Share in G20 imports
0.23 0.69 0.93 0.27 0.51 0.11 0.37
Share in total world imports
0.18 0.54 0.72 0.21 0.40 0.08 0.29
a Based on 2012 import data. b Based on 2013 import data. c Based on 2014 import data. d Based on 2015 import data.
Note: Calculations are based on restrictions implemented since October 2008 and still in place. These percentages represent rough estimates of the trade coverage of the import-restrictive measures.
Source: WTO Secretariat.
Chart 3.1 Smoothed averages of G20 trade-restrictive measures
(12-month averages)
Note: The smoothed averages were calculated as simple averages of the trade-restrictive measures
recorded over a period covering the 12 past months. For example, the September 2009 entry corresponds to the average number of trade-restrictive measures implemented from October 2008 to September 2009. Data were sourced from the TMDB and cover the period from October 2008 to May 2017.
Source: WTO Secretariat.
3.19. Chart 3.1 presents a complementary approach in the analysis of the trade-restrictive measures by introducing smoothed averages of measures over time. The purpose of the smoothed averages technique is to reduce the effects of random variations and to reveal underlying trends, including seasonal and cyclical components.

28
3.20. The smoothed averages of the number of trade-restrictive measures implemented by G20 economies indicate limited variation despite what appears to be a certain cyclical pattern of about two years. The initiation of every cycle sees a reduction in the pace of implementation of new trade restrictions; followed by a renewed upturn after about one year. The last cycle started in 2016 and seems to have reached its bottom in the first months of 2017.
3.21. Although parity was recorded between the number of trade-facilitating and trade-restrictive measures (Charts 3.2 and 3.3), the corresponding estimate of the imports covered by these measures reveals a different picture. The Charts show that of the 292 trade and trade-related measures recorded in this Report, the trade coverage of the import-facilitating measures is considerably larger (US$163 billion) than the trade coverage of the import-restrictive measures (US$47 billion). The trade coverage of trade remedy initiations and terminations amounts to approximately US$25 billion and US$6 billion, respectively.16
Chart 3.2 Overview of G20 measures, mid-October 2016 to mid-May 2017
(by number)
146 62 42 42
Trade remedy initiations Trade remedy terminations
Measures facilitating trade Trade-restrictive measures
292
Source: WTO Secretariat.
Chart 3.3 Trade coverage of G20 import measures, mid-October 2016 to mid-May 2017
(US$ billion)
Source: WTO Secretariat.
3.22. The above Section has provided detailed information on the latest trends among G20 economies in trade policy making and has confirmed several of the findings of previous reports. For example, the numerical importance of trade remedy measures and anti-dumping in particular
16 These trade coverage estimates should be treated with caution, as they may be influenced by
highly-traded goods, exchange rates effects and availability of import statistics and detailed HS codes.

29
in the overall number of trade measures introduced by G20 economies, is fully consistent with previous reports. At the same time, despite the numerical parity between the monthly averages of trade facilitating and trade-restrictive measures identified in this Report, the estimated trade coverage of import-facilitating measures significantly exceeds the estimated trade coverage of import-restrictive measures. This is an important finding because it suggests that despite the persistent uncertainty facing the global economy and fears about protectionist pressures, G20 economies collectively continue to show moderation and restraint in taking recourse to trade restrictions.
3.23. The following Sections seek to provide in-depth analysis of selected trade and trade-related policy developments during the period from mid-October 2016 to mid-May 2017.
3.2 Trade Remedies17
3.24. This Section provides an assessment of trends in trade remedies during the following periods: January–June 2015, July–December 2015, January–June 2016 and July–December 2016. It also includes an evaluation of these periods on a six-month and 12 month basis, in order to show trends over time.
Anti-Dumping (AD) Measures18
3.25. The period covering July-December 2016 shows an 11% increase in the number of AD investigations initiated by G20 members compared to the previous six-month period (January-June 2016). Table 3.6 shows that G20 members initiated 120 AD investigations during that period, compared with 108 during the previous six months, and 96 in the six months before that.
3.26. In 2016, there were notable decreases in the number of investigations initiated by Brazil, China, Mexico, and the United States compared to 2015. In the same period, a significant increase was seen in the number of investigations initiated by Argentina (from 6 to 25), as well as Canada (from 3 to 14), and India (from 30 to 69).
Table 3.6 Initiations of AD investigations
G20 Member Jan-June 2015
July-Dec 2015
Jan-June 2016
July-Dec 2016
Jan-Dec 2015
Jan-Dec 2016
Argentina 4 2 6 19 6 25 Australia 3 7 11 6 10 17 Brazil 12 11 4 7 23 11 Canada 2 1 3 11 3 14 China 3 8 2 3 11 5 European Union 4 8 5 9 12 14 India 12 18 48 21 30 69 Indonesia 4 2 0 7 6 7 Japan 2 0 0 1 2 1 Korea, Rep. of 1 3 4 4 4 Mexico 5 4 1 5 9 6 Russian Federationa 1 0 0 1 1 1 Saudi Arabia, Kingdom ofb
0 1 0 0 1 0
Turkey 12 4 4 13 16 17 United States 15 27 24 13 42 37 Total 80 96 108 120 176 228
a Notified by the Russian Federation; investigations are initiated by the Eurasian Economic Union on behalf of all of its members collectively.
b Notified by the Kingdom of Saudi Arabia; investigations are initiated by the Cooperation Council for the Arab States of the Gulf on behalf of all of its members collectively.
17 This Section is without prejudice to the right of Members to take trade-remedy actions under
the WTO. 18 Anti-dumping and countervailing investigations are counted on the basis of the number of exporting
countries or customs territories affected by an investigation. Thus, one anti-dumping or countervailing investigation involving imports from n countries/customs territories is counted as n investigations.

30
Source: WTO Secretariat.
3.27. In terms of product breakdown, metal products accounted for the largest share of initiations over the four reporting periods. Metal products were affected by between 30-50% of all investigations in each six-month period. This sector accounted for 26 initiations in the first half of 2015 and increased significantly to 49 initiations in the following period. This number dropped to 41 initiations in the first half of 2016 and increased again to 53 initiations in the second half of the year. Steel products (goods classified under HS Chapters 72 and 73) accounted for 93% of these investigations (157 out of 169 during the same period). In many instances, a single importing Member initiated investigations on the same steel product from a number of different sources simultaneously – 10 steel products account for 92 of the investigations over these periods. China continues to be the most frequent subject of investigations on metal products with 23 investigations in 2016, followed by the Republic of Korea with 8 and India with 7. The United States initiated 21 investigations in this sector during January – December 2016, followed by India and Canada with 13 investigations each and the European Union with 12.
3.28. Chemical products accounted for the second-largest share of initiations over the four reporting periods and were also the second most frequent target of AD investigations in all periods. The number of initiations into chemical products significantly increased from 31 during January – December 2015 to 42 during January – December 2016. India was the principal driver behind these initiations, accounting for more than half of the 73 new investigations of products in this sector over the 24 months examined. China was again the most frequent subject of initiations of investigations in this sector in 2016 (13 out of 42), with the remainder targeting a wide range of exporting countries or customs territories.
3.29. Plastics and rubber ranked third over the reporting periods, accounting for 11% of all initiations during the first 12-month period and 13% in the second. The United States accounted for 12 of the 48 new initiations in this sector over the 24 months.
3.30. While AD investigations do not necessarily lead to the imposition of measures, a rise in the number of investigations initiated is an early indicator suggesting a likely rise in the number of measures imposed. Over the 24 months, a total of 308 AD measures were imposed (as shown in Table 3.7). However, as it can take up to 18 months for an AD investigation to be concluded once initiated, these measures may not necessarily be the result of initiations in the same period.
Table 3.7 Number of AD measures imposed by G20 economies
Jan-June
2015 July-Dec
2015 Jan-June
2016 July-Dec
2016 Jan-Dec
2015 Jan-Dec
2016
Measures imposed 97 71 64 76 168 140
Source: WTO Secretariat.

31
Chart 3.4 AD duty initiations by product
January - June 2015 July - December 2015
Chemicals23%
Plastics15%
Metals33%
Other15%
Metals51%
Plastics7%
Textiles5%
Other17%
Glass/Ceramics5%
Paper10%
Chemicals10%
Machinery6%
July - December 2016January - June 2016
Paper5%
Plastics10%
Metals38%
Other19%
Metals44%
Chemicals19%
Glass/Ceramics6%
Other10%
Plastics15%
Chemicals18%
Machinery6%
Textiles11%
Note: Values are rounded.
Source: WTO Secretariat.
3.31. Since the first trade monitoring report was circulated in September 2009, AD activities of G20 members initially declined through 2011, then rebounded, peaking in 2013, with 238 new investigations initiated (Chart 3.5).19 Following a downward trend in 2014 and 2015, the number of initiations increased again in 2016 reaching 228.
19 While 2013 shows an important increase in activity, the number of initiations is still significantly lower
than the peaks of activity seen in 1999-2002.

32
Chart 3.5 AD investigations by G20 economies, 2009–2016
161
137127
166
238
208
176
228
0
50
100
150
200
250
2009 2010 2011 2012 2013 2014 2015 2016
Source: WTO Secretariat.
Countervailing Measures (CVD)
3.32. As shown in Table 3.8, the countervailing activities of G20 members decreased in the most recent period (July – December 2016) compared with the three preceding six-month periods.
Table 3.8 Initiations of CVD duty investigations
G20 Member January – June 2015
July – December
2015
January – June 2016
July – December
2016
January -December
2015
January -December
2016 Australia 0 2 3 5 2 8 Brazil 0 0 0 1 0 1 Canada 2 1 1 1 3 2 China 0 0 1 0 0 1 European Union 1 1 1 0 2 1 India 0 0 1 0 0 1 Turkey 1 0 0 0 1 0 United States 11 12 12 4 23 16 Total 15 16 19 11 31 30
Source: WTO Secretariat.
3.33. A number of different sectors were affected by countervailing investigations over the four periods, with metal products remaining the most targeted, accounting for 39 of the 61 initiations by G20 Members over the 24 months examined. Thirty-seven of these investigations involving the metals sector were in relation to steel products. Almost all of the countervailing investigations involving the metal sectors were conducted concurrently with an AD investigation on the same product.
3.34. Plastics accounted for the next largest number of investigations with eight initiations, followed by the paper sector with five initiations. The remaining investigations covered a range of goods including chemicals, foodstuffs, live animals and wood products.

33
Chart 3.6 CVD duty initiations by product
July - December 2015January - June 2015
Metals60%
Metals94%
Paper20%
Plastics20%
Animal Products
6%
January - June 2016 July - December 2016
Metals42%
Metals73%
Other16%
Plastics21%
Wood products
18%
Chemicals11%
Paper11%
Other9%
Note: Values are rounded.
Source: WTO Secretariat.

34
AD and CVD Measures by Trading Partner
3.35. Chart 3.7 shows the top six trading partners affected by trade remedy initiations (excluding safeguards) reported by each G20 member between 2008 and 2016. China remained, by far, the exporter most frequently the subject of initiations reported during this period – accounting for one-third of the reported initiations. The second most affected exporter during this period – the Republic of Korea - accounted for 7% of total initiations. The share of G20 initiations involving products from other G20 members accounted for approximately 70% of total initiations. In all reporting periods, initiations on products from other G20 members accounted for at least 50% of each individual G20 member's total initiations.

35
Chart 3.7 AD and CVD initiations, by trading partner, 2008-2016
(number of initiations)
Argentina Australia
Brazil Canada
India Indonesia
0 20 40 60 80 100 120
G-20
Peru
Korea, Rep. of
United States
India
Brazil
China
G-20 as share of total: 78%
0 20 40 60 80 100
G-20
Indonesia
Malaysia
Thailand
Chinese Taipei
Korea, Rep. of
China
G-20 as share of total: 63%
0 50 100 150 200 250
G-20
Germany
Chinese Taipei
India
United States
Korea, Rep. of
China
G-20 as share of total: 72%
0 10 20 30 40 50 60 70 80
G-20
Indonesia
Chinese Taipei
Turkey
India
Korea, Rep. of
China
G-20 as share of total: 70%
0 20 40 60 80 100
G-20
India
Thailand
Korea, Rep. of
Japan
EU
United States
G-20 as share of total: 87%
0 10 20 30 40 50 60 70 80 90 100 110 120
G-20
Russian Fed.
Indonesia
Turkey
United States
India
China
G-20 as share of total: 76%
European UnionChina
0 20 40 60 80 100 120 140 160 180 200 220
G-20
Japan
Chinese Taipei
Thailand
Korea, Rep. of
EU
China
G-20 as share of total: 66%
0 5 10 15 20 25 30 35 40
G-20
India
Thailand
Korea, Rep. of
Malaysia
Chinese Taipei
China
G-20 as share of total: 52%
0 1 2 3 4 5
G-20
Indonesia
Korea, Rep. of
China
G-20 as share of total: 100%
Japan
0 5 10 15 20 25
G-20
India
United States
Thailand
Malaysia
Japan
China
G-20 as share of total: 66%
Korea, Rep. of

36
Mexico Russian Federation
United States
0 10 20 30 40 50 60
G-20
Brazil
Korea, Rep. of
Spain
United States
India
China
G-20 as share of total: 89%
0 5 10 15 20
G-20
Brazil
Chinese Taipei
Macao, China
Hong Kong, China
Ukraine
China
G-20 as share of total: 50%
0 5 10 15 20
G-20
Belgium
Netherlands
Malaysia
India
Brazil
China
G-20 as share of total: 72%
South Africa
0 10 20 30 40 50 60 70
G-20
Israel
Korea, Rep. of
Malaysia
Indonesia
India
China
G-20 as share of total: 66%
Turkey
0 50 100 150 200 250 300
G-20
Viet Nam
Turkey
Chinese Taipei
India
Korea, Rep. of
China
G-20 as share of total: 78%
Note: Argentina; Indonesia; Japan; Korea, Rep. of and Mexico initiated AD investigations only. The
Kingdom of Saudi Arabia initiated one AD investigation (at the GCC level) during this period.
Source: WTO Secretariat.
Sunset Reviews
3.36. This Section examines the effect the global financial crisis may have had on AD and CVD, by analyzing the extent to which measures imposed following the financial crisis have been extended or have expired (or have otherwise been terminated) - possibly suggesting that the financial crisis could have been a factor that contributed to the imposition of the measure. This Section, therefore, examines measures imposed as a result of investigations initiated in 2008, before the financial crisis, as well as 2009 and 2010, when the full effects of the financial crisis were being felt.20
3.37. The relevant WTO Agreements stipulate that AD and CVD measures can remain in force only for as long as necessary to counteract injury caused by dumped or subsidized imports, and must expire no later than five years after their imposition unless it is determined, through a review, that removal of a measure would likely lead to a continuation or recurrence of dumping or subsidization and injury. In such a case, the measure can be extended for up to a further five years. This review process is often referred to as a sunset review. Investigating authorities generally invite applications for a sunset review before a measure expires, and in the absence of a review, they allow the measure to lapse.
20 It is assumed that investigations in response to the financial crisis would not have been initiated
before January 2009.

37
3.38. As of 31 December 2016, measures imposed as a result of investigations initiated in 2008-2010 are in various stages of their lifecycle. Some measures are still within the initial five-year imposition period, some are under review21, some have been extended and some have expired.
3.39. Chart 3.8 shows the status of AD and CVD measures resulting from investigations initiated in 2008, 2009 and 2010 by G20 members as at 31 December 2016.
Chart 3.8 Status of measures resulting from AD and CVD investigations initiated in 2008, 2009 and 2010 for G20 members as at 31 December 2016
0
20
40
60
80
100
120
140
160
180
2008 2009 2010
Original measure Under review Extended No longer in effect
Source: WTO Secretariat.
3.40. All of the 154 and 134 measures resulting from investigations initiated in 2008 and 2009, respectively, by G20 members have now been subject to expiry action (either a sunset review or termination). However, one third of measures resulting from investigations initiated in 2010 (33 out of 100) have not yet been subject to any expiry action.
3.41. Table 3.9 shows the proportion of measures that were due to expire for which a sunset review has been conducted; noting that measures not reviewed will automatically expire. For measures resulting from investigations initiated in 2009 ("the 2009 measures"), 71% were reviewed, slightly higher than the 64% found for 2008 ("the 2008 measures"). Thus, a similar proportion of the 2008 measures (investigations started before the financial crisis) and 2009 measures (investigations started after the financial crisis had begun) expired without review. It is still too early to draw conclusions in relation to the measures based on investigations initiated in 2010.
21 A sunset review must be initiated prior to the expiration date of the measure, but the measure may
remain in force after this date pending the outcome of the review.

38
Table 3.9 Proportion of expiring measures that were subject to a sunset review for G20 members (based on the year the investigation was initiated)
Expiring measures Investigation initiated in
2008 2009 2010a Not reviewed 36% 29% 24% Reviewed 64% 71% 76%
a Only 67 measures resulting from investigations initiated in 2010 have so far expired or been subject to review.
Source: WTO Secretariat.
3.42. As at 31 December 2016, 99 sunset reviews had been completed for measures resulting from investigations initiated in 2008, 77 for 2009 and 30 for 2010, as shown in Table 3.10. The relevant Member found that the expiry of the measure would lead to a continuation or recurrence of dumping/subsidization and injury and extended the measures for 90% of all the measures imposed - showing no significant change after the financial crisis began.
3.43. Based on the data currently available, there is no discernible change in extension versus expiry of measures coinciding with the financial crisis. As further time passes and additional data become available, other trends may appear.
Table 3.10 Results from completed reviews (based on the year the investigation was initiated)
Investigation initiated in 2008 2009 2010 Number of completed reviews 99 77 30 Measure extended 90% 90% 90% Expiry of measure 10% 10% 10%
Source: WTO Secretariat.
Safeguard Measures (SG)
3.44. Unlike AD and CV measures, SG measures are intended to be temporary measures taken in response to increased imports of goods that are causing serious injury and are imposed on products from all sources. Thus, safeguards are subject to different rules and timelines than AD and CV measures and are, therefore, not directly comparable to these (see Box 3.2 below).
3.45. Table 3.11 shows the SG initiations by G20 Members, and Table 3.12 shows the SG impositions by G20 Members. In terms of initiation of investigations, on a one-year period basis, initiations have increased by 50% from four to six. On a six-month period basis, the figures remain relatively high, with three initiations for two consecutive six-month periods. In terms of imposition, the figures seem to indicate that the trend is now declining.
Table 3.11 SG Initiations by G20 economies
G20 member Jan – June 2015
July – Dec 2015
Jan – June 2016
July – Dec 2016
Jan – Dec 2015
Jan – Dec 2016
China 0 0 0 1 0 1 India 0 2 1 0 2 1 Indonesia 0 1 0 0 1 0 Saudi Arabia, Kingdom ofa
0 0 1 1 0 2
South Africab 0 0 1 1 0 2 Turkey 1 0 0 0 1 0 Total 1 3 3 3 4 6 a Notified by the Kingdom of Saudi Arabia; investigations are initiated by the Gulf Cooperation Council (GCC) on
behalf of all of its members collectively.
b Notified by South Africa; investigations are initiated by the Southern African Customs Union on behalf of all of its members collectively.
Source: WTO Secretariat.

39
Table 3.12 SG Impositions by G20 Members
G20 member Jan – June 2015
July – Dec 2015
Jan – June 2016
July – Dec 2016
Jan – Dec 2015
Jan – Dec 2016
India 0 0 1 1 0 2 Indonesia 1 2 0 0 3 0 Turkey 1 0 0 0 1 0 Total 2 2 1 1 4 2
Source: WTO Secretariat.
Box 3.2 Comparing SGs with AD and Countervailing Duties (CVD) The three trade remedy instruments – safeguards ("SG"), AD and CVD – share many characteristics. Most importantly, all three instruments are designed to address a situation where (i) the domestic industry of the country importing a product is suffering injury ("material injury" in the case of AD and countervailing duty; and "serious injury" in the case of SGs), and (ii) there is a causal relationship between such injury and certain imports. The pertinent determinations need to be made in an investigation undertaken by the importing Member in accordance with the relevant WTO Agreement. There are, however, also many differences between the three instruments. Some of the more significant ones are highlighted below: First, the imposition of AD or countervailing measures depends upon a finding that certain "unfair" practices exist. In the case of AD, the importing Member must find that the exported product is sold at dumped prices, as defined under the AD Agreement, while for countervail it must find that the exported product is subsidized within the meaning of the Subsidies Agreement. By contrast, for SGs, the importing Member need only to show that imports of the product have increased in certain ways, and that this increase is a result of unforeseen developments and the effect of WTO obligations. Thus, the imposition of an SG measure does not depend upon a finding of the existence of an "unfair" practice. Second, the imported products examined, and the scope of the resulting measure, are different. An SG investigation examines all imports of a product, irrespective of source, and (with the exception of special and differential provisions for developing countries with small import shares), the SG measure also applies to all imports irrespective of source. By contrast, AD and countervailing investigations relate to imports from particular countries, and the measures apply only to imports from that country. (This does not mean that Members cannot impose AD or CVD on the same product being exported from multiple countries, but each country gets its own distinct measures). The broader scope of SG measures needs to be kept in mind when comparing the imposition and initiation figures of AD and countervailing measures with those for SG measures. A single SG measure may affect imports from many countries, while it would require multiple AD and/or countervailing measures to imports from all those sources. In this sense, a single SG measure will likely have greater trade implications than a single AD or countervailing measure. Third, while AD and countervailing measures can only take the form of a duty, SG measures may also take the form of a quota or a tariff rate quota. Fourth, because SG measures do not depend upon a finding that there has been an "unfair" practice, the Safeguards Agreement obliges an imposing Member to offer compensation or face the suspension of equivalent concessions (trade retaliation). There are detailed rules governing compensation and suspension.
Source: WTO Secretariat.
Committee on Subsidies and Countervailing Measures
3.46. At its 25 October 2016 and 25 April 2016 meetings, the Committee on Subsidies and Countervailing Measures22 reviewed Members' notifications of specific subsidies, notifications of countervailing duty legislation, semi-annual reports of countervailing actions and ad hoc notifications of preliminary and final countervailing measures taken.
3.47. Transparency in respect of subsidies emerged as a major topic at the both meetings. The Committee discussed the importance of transparency, shortcomings in compliance with subsidy notification obligations, and ways to improve the timeliness and completeness of such notifications under the SCM Agreement. In this regard, the Committee discussed a proposal regarding the Committee's review procedures, as well as a proposal about fisheries subsidies transparency.
3.48. At both meetings, the Chairs also drew attention to the 31 December 2015 deadline for the elimination of export subsidies by Members that received a final two-year extension under Article 27.4. They reminded beneficiary Members that they should have made their final transparency notifications by 30 June 2016. The Committee reviewed the final notifications that had been received, and discussed the status of notifications by the Members that had not yet made their final notifications. As of 31 May 2017, only nine of 19 beneficiary Members had provided their final transparency notifications.
22 Minutes G/SCM/M/98, G/SCM/M/99, G/SCM/M/100 and G/SCM/M/101 (to be circulated).

40
3.3 Sanitary and Phytosanitary Measures (SPS)23
3.49. Under the SPS Agreement, WTO Members are obliged to provide an advance notice of intention to introduce new or modified SPS measures24, or to notify immediately when emergency measures are imposed. The main objective of complying with the SPS notification obligations is to inform other Members about new or changed regulations that may significantly affect trade. Therefore, an increased number of notifications does not automatically imply greater use of restrictive measures, but rather enhanced transparency regarding these measures.
3.50. G20 members rank amongst the main "notifiers" of SPS measures, accounting for 68% of total regular notifications (including addenda), and 32% of emergency notifications, submitted to the WTO from 1 January 1995 until 30 April 2017.
3.51. For the period 1 October 2016 to 30 April 201725, Canada was the G20 economy with the most notifications to the WTO, accounting for around 21% of notifications submitted by all G20 economies in that period.
3.52. Many G20 economies are following the recommendation to notify SPS measures, even when these are based on a relevant international standard, thereby substantially increasing the transparency regarding SPS measures. Of the 302 regular notifications (excluding addenda) made by G20 members from 1 October 2016 to 30 April 2017, 41% indicated that an international standard, guideline or recommendation was relevant to the notified measure (Chart 3.9) (out of which 80% had referred to Codex, 13% to IPPC and 7% to OIE). Furthermore, the notification formats include an entry asking whether the notified regulation conforms to the relevant international standard. Around 66% of the notifications indicated that the measure was in conformity with the existing international standard, guideline or recommendation. For the remaining 34% of notifications, which did not indicate that the measure was in conformity with the existing international standard, Codex was identified as the relevant international standard-setting body. Regarding emergency notifications for the same period, 93% of the emergency measures notified by G20 members were indicated as being in conformity with a relevant international standard, guideline or recommendation.
23 Information presented in this section has been retrieved from the SPS Information Management
System (SPS IMS: http://spsims.wto.org). This section is based on notifications to the WTO for the period 1 October 2016 to 30 April 2017, and builds on the previous G20 report (10 November 2016), which covered notifications up until end-September 2016. Specific trade concerns (STCs) are only raised at SPS Committee meetings. The information in this section summarizes the STCs raised at the October 2016 and March 2017 SPS Committee meetings.
24 Transparency obligations are contained in Article 7 and Annex B of the SPS Agreement. Annex B of the SPS Agreement requires that Members notify measures whose content is not substantially the same as that of an international standard, guideline or recommendation, and when the measure may have a significant effect on trade. However, the Recommended Procedures for Implementing the Transparency Provisions of the SPS Agreement, adopted by the SPS Committee in 2008 (G/SPS/7/Rev.3), recommend that Members also notify measures which are based on the relevant international standards and provide a broad interpretation of effects on trade.
25 For the SPS Section, the review period covers 1 October 2016 to 30 April 2017.

41
Chart 3.9 Regular SPS notifications and international standards
Codex80%
OIE7%
IPPC13%
None59%
Relevant international
standard41%
Note: Codex Alimentarius (Codex), World Organisation for Animal Health (OIE) and International Plant Protection Convention (IPPC).
Source: WTO Secretariat.
3.53. The most frequently identified objective in the SPS measures notified by G20 members during the reviewed period is food safety, accounting for 77% of notifications.26 Food safety is a predominant objective in the G20 members' notifications with the vast majority of notified measures related to Maximum Residue Limits (MRLs) or pesticides, and in many notifications both were identified.
3.54. Measures maintained by G20 members are often discussed in the SPS Committee. In addition, the top ten targets of complaints about measures maintained are all G20 members. The specific trade concerns (STCs) raised in the SPS Committee on the basis of measures maintained by G20 economies account for 73% of all STCs raised to date.
3.55. A total of 21 out of 26 STCs were raised or discussed in relation to measures maintained by G20 members in the SPS Committee meetings of October 2016 and March 2017. Seven were raised for the first time, and 14 had been discussed in previous Committee meetings (whereas 10 were discussed in both meetings). Two STCs raised for the first time in October 2016 were discussed again in March 2017 (STC 415 and STC 416).
3.56. The new STCs raised at the October 2016 and March 2017 SPS Committee meetings regarding measures applied by G20 economies relate to:
• European Union's MRLs for bitertanol, tebufenpyrad and chlormequat (G/SPS/N/EU/168) (raised by India, October 2016 (STC 412));
• Indonesia's food safety measures affecting horticultural products and animal products (raised by the Philippines, October 2016 (STC 414));
• United States' seafood import monitoring programme (raised by China, October 2016 (STC 415));
• China's import ban on fresh mangosteen (raised by Indonesia, October 2016 (STC 416));
26 The objective of an SPS measure falls under one or more of the following categories: (i) food safety; (ii) animal health; (iii) plant protection; (iv) protect humans from animal/plant pest or disease; and (v) protect territory from other damages from pests. Members are required to identify the purpose of the measure in their notifications. It is not uncommon for more than one objective to be identified for a measure.

42
• India's import requirements for teak tree wood (raised by Panama, October 2016 (STC 417));
• The United States' MRLs for clorpyrifos (G/SPS/N/USA/2912) (raised by Israel, March 2017 (STC 419)); and
• The European Union's non–recognition of regionalization for avian influenza (raised by the Russian Federation, March 2017 (STC 420)).
3.57. Of the 14 previously raised STCs regarding measures applied by G20 members discussed in the October 2016 or March 2017 meetings, several addressed persistent problems that have been discussed in the SPS Committee at least five times, with some going back over a decade:
• General import restrictions due to Bovine Spongiform Encephalopathy (BSE) applied by certain Members, specifically Australia, China, Japan and the Republic of Korea. This STC (193) was initially raised by the European Union in the June 2004 meeting and subsequently by the United States in February 2007. It has been discussed 29 times in the Committee, gathering the support of three other Members.
• The application and modification of the European Union's regulation on Novel Foods. This STC (238) was first raised by Peru in the March 2006 meeting and subsequently by Colombia and Ecuador. It has been discussed 22 times in the Committee, and has gathered the support of 21 Members.
• United States' measures on catfish (raised by China and Viet Nam, October 2009). This STC (289) has been discussed eight times in the Committee.
• China's import restrictions in response to the Japanese nuclear power plant accident (raised by Japan, June 2013). This STC (354) has been discussed ten times in the Committee.
• European Union's revised proposal for categorization of compounds as endocrine disruptors (raised by the United States, March 2014). This STC (382) has been discussed seven times in the Committee and has gathered the support of 38 Members.
• The Russian Federation's import restrictions on processed fishery products from Estonia and Latvia (raised by the European Union, July 2015). This STC (390) has been discussed five times in the Committee.
• China's import restrictions due to African swine fever (raised by the European Union, July 2015). This STC (392) has been discussed five times in the Committee.
• The Republic of Korea's import restrictions due to African swine fever (raised by the European Union, July 2015). This STC (393) has been discussed five times in the Committee.
• China's proposed amendments to the implementation regulations on safety assessment of agricultural GMOs (raised by Paraguay and the United States, July 2015). This STC (395) has been discussed five times in the Committee.
3.58. For the reviewed period, ten out of 21 STCs raised or discussed due to measures implemented by G20 members concerned measures covering food safety, six concerned animal health, four related to other types of concerns (i.e. control, inspection and approval procedures), and one concerned plant health.

43
Box 3.3 Enhancing Monitoring and Transparency in SPS and TBT Accessing relevant information on SPS or TBT product requirements in export markets can be a huge challenge, especially for SMEs. The WTO helps tackling this potential trade barrier through the combination of transparency requirements included in the SPS and TBT agreements and two online tools that make information easily accessible: the SPS and TBT Information Management Systems (SPS/TBT IMSs). WTO Members are required to notify proposed SPS and TBT measures if they may significantly affect international trade. Each year the WTO receives more than 3,500 notifications. Publicly available online tools help stakeholders find notifications of relevance to their trade: - the SPS IMS www.spsims.wto.org, - the TBT IMS www.tbtims.wto.org, and - the new ePing www.epingalert.org. The SPS/TBT IMSs are search-platforms that help among others find SPS or TBT notifications by using parameters such as products, notifying Member and objective. ePing is an online alert system allowing users to receive daily or weekly email alerts about SPS and TBT notifications covering products and markets of interest to them. ePing helps stakeholders track, discuss and adapt to new regulatory conditions, avoiding trade disruption by addressing potential frictions at an early stage.
Source: WTO Secretariat.
3.4 Technical Barriers to Trade (TBT)27
3.59. The G20 economies are the most frequent users of TBT Committee's transparency mechanisms. Together, they have submitted almost half of all new (regular) TBT notifications since 1995.28 Regulations of G20 members also represent the vast majority (80%) of all measures discussed in the TBT Committee since 1995.29
3.60. Under the TBT Agreement, WTO Members are required to notify their intention to introduce new or modified TBT measures, or to notify adopted emergency measures immediately upon their adoption. The main objective of complying with the TBT notification obligations is to inform other Members about new or changed regulations that may significantly affect trade.30 Therefore, an increased number of notifications does not necessarily imply greater use of unnecessarily trade-restrictive measures. Rather, TBT notification obligations are meant to promote enhanced transparency regarding measures taken to address legitimate policy objectives, e.g. the protection of human, animal or plant life or health or the environment.
3.61. From 1 October 2016 to 30 April 2017, G20 economies continued their strong commitment to implementing and reviewing TBT measures by submitting a significant share (42%) of all new regular notifications of these measures.31 This is the same share of G20 notifications verified during the previous equivalent period.32 The five G20 members notifying the most new regulations during this period were the United States (86), European Union (75), Republic of Korea (44),
27 For the TBT Section, "review period" covers 1 October 2016 to 30 April 2017. 28 Since 1995, over 22,000 new (regular) notifications of TBT measures have been submitted by WTO
Members, around 10,000 of which (45%) by G20 members. Overall, more than 29,000 new (regular) and follow-up (revisions, addenda etc.) notifications of TBT measures have been submitted by WTO Members since 1995, around 14,000 of which (almost 50%) by G20 economies.
29 WTO Members use the TBT Committee as a forum to discuss trade issues related to specific measures (technical regulations, standards or conformity assessment procedures) maintained by other Members. These are referred to as STCs and normally relate to proposed draft measures notified to the TBT Committee or to the implementation of existing measures. Issues raised range from simple requests for additional information and clarifications to questions on the consistency of measures with TBT Agreement disciplines. Since 1995, 412 out of 530 (or 78%) new STCs discussed in TBT Committee meetings concerned measures maintained by G20 economies.
30 Under the TBT Agreement, WTO Members are not required to notify all proposed TBT measures (technical regulations or conformity assessment procedures). Rather, they are only required to notify those measures that may have a significant effect on trade of other Members and are not in accordance with a relevant international standard. However, the TBT Committee in its Sixth Triennial Review encouraged Members, "for the purpose of enhancing predictability and transparency in situations where it is difficult to establish or foresee whether a draft technical regulation or conformity assessment procedure may have a 'significant effect on trade of other Members', to notify such measures."
31 More precisely, 388 G20 regular notifications out of 931 notifications by all Members. 32 A 41.24% share of G20 regular notifications (412 out of 999) during the previous seven-month period
from 1 March to 30 September 2016 as compared to a 41.67% share (388 out of 931) during current review period from 1 October 2016 to 30 April 2017.

44
Mexico (30) and Canada (23). For the review period, consistent with previous periods, the majority of notified new regulations from G20 economies had as their stated objectives either the protection of human health or safety (44%) or environmental protection (21%) – or both.33 In addition, G20 economies submitted the vast majority (71%) of all follow-up notifications34 made by Members during the review period, representing an important increase as compared to the previous equivalent period, when only 63% of all follow-up notifications were submitted by G20 countries.35
3.62. Regulations of G20 members also continue to represent the majority of measures discussed during the two TBT Committee meetings that fell within this period36, both as new STCs as well as previously-raised STCs. During the review period, the vast majority of the new STCs (14 out of 19) concerned measures of G20 members, namely: European Union or its member States (4)37; the Russian Federation (3); China (2); the Republic of Korea (2); and Brazil, India and Mexico (1 each). As seen in Table 3.13, these new STCs covered measures regulating a wide range of products, including tobacco and alcoholic beverages, information and communication technology products (including with respect to "e-waste"), agricultural and food products, pharmaceuticals, medical equipment, toys, vehicles and chemicals.
Table 3.13 New STCs involving G20 economies' measures (raised at the November 2016 and March 2017 TBT Committee meetings)
New STCs involving G20 economies' measures
Brazil: concerning Regulation RDC No 123 on food additives and processing aids authorized for use in wine of 4 November 2016 (raised by the European Union); China: concerning Tentative Administrative Rules on Enterprises Average Fuel Consumption and New Energy Vehicle Credits and Administration Regulation on the Access of New Energy Vehicle Manufactures and Products (raised by the United States and the European Union); China: concerning Cyber Security Law (raised by the United States, Japan, European Union and Australia); European Union: concerning Country of Origin Labelling (ID 523) (raised by New Zealand and the United States); European Union: concerning Organic production and labelling - Maté (erva-mate) (raised by Brazil); European Union: concerning Radio Equipment Directive (raised by China); Italy: concerning Labelling requirements of the origin of grains used in the preparation of dried pasta (raised by Mexico, United States and Canada); India: concerning the E-waste (Management) Rules, 2016 (ID 515) (raised by Japan, Republic of Korea and the United States); Korea, Rep. of: concerning Household Chemical and Biocidal Products (raised by United States and Japan); Korea, Rep. of: concerning Amendment of the Notifications on Warning Messages on Smoking and Drinking (ID 518) (raised by Australia, Canada, Japan, Mexico, New Zealand and the United States); Mexico: concerning Official Standard PROY-NOM-199-SCFI-2015: Alcoholic beverages - Designations, physicochemical specifications, commercial information and test methods (ID 522) (raised by the European Union); Russian Federation: concerning Medical devices (ID 520) (raised by the United States and the European Union); Russian Federation: concerning Pharmaceutical products - Resolution 1314 of the Government of the Russian Federation on determining compliance of medicinal products' manufacturers with the requirements of Good Manufacturing Practice (non-notified); draft decisions of the Board of the Eurasian Economic Union (ID 521) (raised by the United States and the European Union); Russian Federation and Kazakhstan: concerning the amendments No. 2 to the Technical Regulation of the Customs Union on Safety of Toys (TP MC 008/2011) (ID 514) (raised by Ukraine, United States and the European Union);
Source: WTO Secretariat.
3.63. Ongoing concerns with existing regulations of the G20 economies were also discussed. Overall, 37 previously-raised STCs on existing regulations of G20 members were brought to the attention of the Committee, representing 77% of all ongoing concerns raised in the period. As
33 Notifications may state more than one objective. 34 These notifications are called "addenda", "corrigenda", or "supplements". They can also be in the form
of "revisions" when the original measure has been substantially re-drafted prior to adoption or entry into force. A revision replaces the original notification. They are linked to the original notification of a new regulation and include additional pertinent information, such as updated deadlines for entry into force, access to the final adopted text, withdrawal or cancellation, unofficial translations or other updates with respect to notified regulations.
35 421 follow-up notifications were submitted during the review period, 297 of which from G20 countries. In contrast, 574 follow-up notifications were submitted during the previous seven-month period from 1 March to 30 September 2016, 364 of which from G20 economies.
36 The 10-11 November 2016 meeting and 29-30 March 2017 meeting. 37 2 EU-wide and 1 from Italy, also a G20 member. There was also an STC raised with respect to a
measure by Ireland, an EU member state but not a G20 economy.
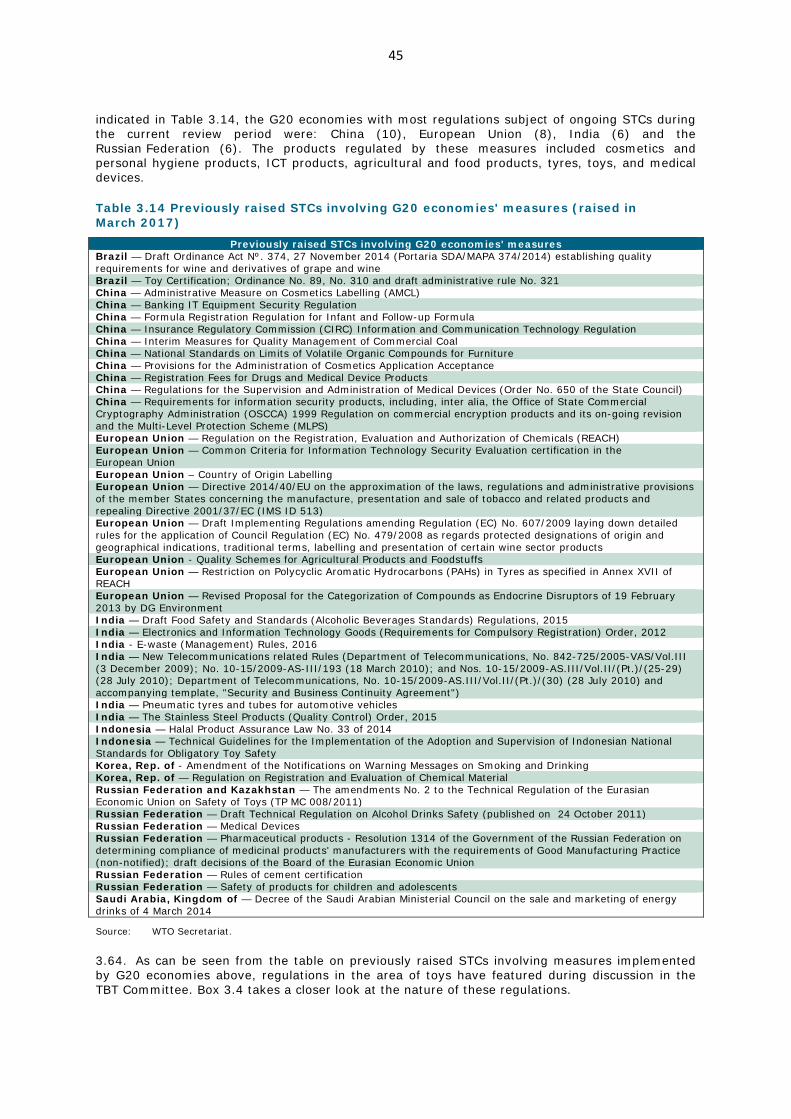
45
indicated in Table 3.14, the G20 economies with most regulations subject of ongoing STCs during the current review period were: China (10), European Union (8), India (6) and the Russian Federation (6). The products regulated by these measures included cosmetics and personal hygiene products, ICT products, agricultural and food products, tyres, toys, and medical devices.
Table 3.14 Previously raised STCs involving G20 economies' measures (raised in March 2017)
Previously raised STCs involving G20 economies' measures Brazil — Draft Ordinance Act Nº. 374, 27 November 2014 (Portaria SDA/MAPA 374/2014) establishing quality requirements for wine and derivatives of grape and wine Brazil — Toy Certification; Ordinance No. 89, No. 310 and draft administrative rule No. 321 China — Administrative Measure on Cosmetics Labelling (AMCL) China — Banking IT Equipment Security Regulation China — Formula Registration Regulation for Infant and Follow-up Formula China — Insurance Regulatory Commission (CIRC) Information and Communication Technology Regulation China — Interim Measures for Quality Management of Commercial Coal China — National Standards on Limits of Volatile Organic Compounds for Furniture China — Provisions for the Administration of Cosmetics Application Acceptance China — Registration Fees for Drugs and Medical Device Products China — Regulations for the Supervision and Administration of Medical Devices (Order No. 650 of the State Council) China — Requirements for information security products, including, inter alia, the Office of State Commercial Cryptography Administration (OSCCA) 1999 Regulation on commercial encryption products and its on-going revision and the Multi-Level Protection Scheme (MLPS) European Union — Regulation on the Registration, Evaluation and Authorization of Chemicals (REACH) European Union — Common Criteria for Information Technology Security Evaluation certification in the European Union European Union – Country of Origin Labelling European Union — Directive 2014/40/EU on the approximation of the laws, regulations and administrative provisions of the member States concerning the manufacture, presentation and sale of tobacco and related products and repealing Directive 2001/37/EC (IMS ID 513) European Union — Draft Implementing Regulations amending Regulation (EC) No. 607/2009 laying down detailed rules for the application of Council Regulation (EC) No. 479/2008 as regards protected designations of origin and geographical indications, traditional terms, labelling and presentation of certain wine sector products European Union - Quality Schemes for Agricultural Products and Foodstuffs European Union — Restriction on Polycyclic Aromatic Hydrocarbons (PAHs) in Tyres as specified in Annex XVII of REACH European Union — Revised Proposal for the Categorization of Compounds as Endocrine Disruptors of 19 February 2013 by DG Environment India — Draft Food Safety and Standards (Alcoholic Beverages Standards) Regulations, 2015 India — Electronics and Information Technology Goods (Requirements for Compulsory Registration) Order, 2012 India - E-waste (Management) Rules, 2016 India — New Telecommunications related Rules (Department of Telecommunications, No. 842-725/2005-VAS/Vol.III (3 December 2009); No. 10-15/2009-AS-III/193 (18 March 2010); and Nos. 10-15/2009-AS.III/Vol.II/(Pt.)/(25-29) (28 July 2010); Department of Telecommunications, No. 10-15/2009-AS.III/Vol.II/(Pt.)/(30) (28 July 2010) and accompanying template, "Security and Business Continuity Agreement") India — Pneumatic tyres and tubes for automotive vehicles India — The Stainless Steel Products (Quality Control) Order, 2015 Indonesia — Halal Product Assurance Law No. 33 of 2014 Indonesia — Technical Guidelines for the Implementation of the Adoption and Supervision of Indonesian National Standards for Obligatory Toy Safety Korea, Rep. of - Amendment of the Notifications on Warning Messages on Smoking and Drinking Korea, Rep. of — Regulation on Registration and Evaluation of Chemical Material Russian Federation and Kazakhstan — The amendments No. 2 to the Technical Regulation of the Eurasian Economic Union on Safety of Toys (TP MC 008/2011) Russian Federation — Draft Technical Regulation on Alcohol Drinks Safety (published on 24 October 2011) Russian Federation — Medical Devices Russian Federation — Pharmaceutical products - Resolution 1314 of the Government of the Russian Federation on determining compliance of medicinal products' manufacturers with the requirements of Good Manufacturing Practice (non-notified); draft decisions of the Board of the Eurasian Economic Union Russian Federation — Rules of cement certification Russian Federation — Safety of products for children and adolescents Saudi Arabia, Kingdom of — Decree of the Saudi Arabian Ministerial Council on the sale and marketing of energy drinks of 4 March 2014
Source: WTO Secretariat.
3.64. As can be seen from the table on previously raised STCs involving measures implemented by G20 economies above, regulations in the area of toys have featured during discussion in the TBT Committee. Box 3.4 takes a closer look at the nature of these regulations.

46
Box 3.4 Regulation on toys
Regulation on toys:1 World trade in toys is worth around US$50 billion (2015) and has been steadily growing since at least 2010. The top importers and exporters of toys are G20 economies.2 Toys are frequently subject to regulations addressing in particular health or safety risks they may present to children and youth. Since 1995, WTO Members have notified 200 toy-specific regulations to the TBT Committee.3 The highest number of toy specific notifications was submitted in 2008.4 The vast majority (almost 89%) of these notifications concerned toy specific "technical regulations", with the rest mostly concerning "conformity assessment procedures" (CAPs).5 Most notifications (almost 65%) have been submitted by developing Members. Individually, the main notifying Members are Israel (35), China (25), the United States (24) and the European Union (11).6 The great majority (around 70%)7 of notified toy specific regulations address the protection of human health or safety.8 Among these, the most prominent specific objective is the protection against risks arising from chemical, toxic or hazardous substances, followed by the protection against risks of physical injuries.9
Since 2000, and increasingly from 2013, Members have been raising STCs in the TBT Committee with respect to toy specific measures. To date, a total of 21 toy-related concerns have been raised and discussed in the Committee. These concerns mainly focused on three areas: labelling, standards, and CAPs. In this respect, although the vast majority of toy specific notifications are on "technical regulations" (e.g. prescribing or prohibiting the use of certain chemicals in the manufacturing of toys), most concerns raised in the Committee involve instead CAPs, i.e. procedures to assess whether the toy conforms with the specifications prescribed in toy-specific regulations.10 With respect to the latter, WTO Members are more specifically concerned with: duplicative local testing, non-acceptance of foreign test results or certificates from accredited laboratories, testing methodologies applied, as well as sampling, inspection and registration requirements. With respect to labelling, and international standards on toys, concerns revolve mostly around: excessive and burdensome labelling and marking rules, deviations from relevant international and regional standards on restricting toxic substances, as well as on the scientific evidence upon which the measure's adoption was based. The 21 toy-related trade concerns have been raised in roughly equal numbers by both developed and developing Members. On the other hand, toy specific measures from developing Members are slightly more often targeted in STCs than those from developed Members; this seems to correlate with the trend identified above that most toy-specific measures are notified by developing Members. _______________
1 This box only takes into account notifications and STCs concerning TBT regulations and standards addressing toys specifically. Apart from such measures, toys can, and commonly are, also subject to other regulations covering a variety of products and/or situations, for instance: general food packaging and labelling regulations inter alia prohibiting toys to be attached to certain food products considered to be unhealthy for children; general tobacco-control measures that, among other requirements, prohibit the manufacture and/or sale of toys, or any other objects resembling or in the form of tobacco products; or, conversely, general tobacco-control measures prohibiting tobacco products to be manufactured or sold with the appearance of candies or toys. Toys can also be affected and covered by certain general regulations concerning the recycling of plastic-made products, or the use of chemicals in the manufacture of consumer products. The universe of TBT measures affecting trade in toys may therefore be significantly broader than those covered in this box.
2 Toy trade has been growing by an average 3% per year since 2010. China and the European Union (28 member States) are by far the largest toy exporters (more than 85% of all exports in 2015), with the United States and the European Union being by far the largest toy importers (more than 70% of all imports in 2015).
3 Notifications submitted from January 1995 to 30 April 2017. Source: http://tbtims.wto.org/ 4 Twenty-four toy-specific notifications were submitted in 2008 (well above the average of 9.5 per year since 1995). This may
also explain the high number of toy-related STCs discussed in the TBT Committee in 2008. See e.g. https://www.wto.org/english/news_e/news08_e/tbt_20march08_e.htm
5 177 toy-specific technical regulations. 6 Counting both EU-wide notifications as well as notifications by certain EU member States. 7 143 out of 200 notifications.
8 Additionally, but to a much lesser extent (41 out of 200 notifications), another important objective addressed by these measures is the prevention of deceptive practices and consumer protection.
9 56% of these notifications simply concern health/safely measures addressing "general protection", while 26% specifically address toxicity in toys, 11% physical injury, with the remaining 7% addressing a variety of other specific risks.
10 70% (14 out of 20 STCs concerned toy-specific CAPs).
Source: WTO Secretariat.
3.5 Policy Developments in Agriculture
3.65. During the November 2016 and March 2017 meetings of the Committee on Agriculture (CoA), 34 out of 40 implementation-related issues (Art. 18.6) raised concerned policies implemented by G20 members.38 Chart 3.10 shows an increasing trend since 2011 in the average number of questions raised per meeting under Article 18.6 concerning policies maintained by G20 economies. This trend has continued in the two CoA meetings covered by this report, with an average of 28 implementation-related questions posed to G20 members at those meetings. These
38 Questions and responses to the issues raised under the review process in the CoA meetings on 9 November 2016 and 27 March 2017 are available in G/AG/W/159 issued on 13 December 2016 and G/AG/W/160 (questions only) issued on 17 March 2017.

47
numbers include questions that were repeated from one meeting to the next because responses were not provided within the relevant timeframes.
Chart 3.10 Average number of questions posed to G20 members under Article 18.6 a
0
5
10
15
20
25
30
35
a Data for 2017 relating to the CoA's March 2017 meeting.
Source: WTO Secretariat.
3.66. Some of the issues raised were discussed for the first time, whereas others had been discussed one or more times in previous years. Table 3.15 indicates the specific measures relating to implementation commitments that were discussed for the first time during the November 2016 and March 2017 CoA meetings.39
3.67. Out of the 34 implementation-related issues concerning policies implemented by G20 members, 19 were discussed for the first time during the November 2016 and March 2017 CoA meetings. More than half of these issues related to domestic support policies. Several G20 economies were questioned on measures benefiting producers of dairy, rice, livestock, oilseeds and wheat. Similarly, questions were also raised regarding agricultural policies of a general scope such as the EU's intervention programmes and Canada's agri-marketing programme. In addition, questions were raised in relation to measures that restricted, or had the potential to restrict, trade of agricultural products (e.g. Indonesia's draft regulation on supply and distribution of milk products and Russian Federation's higher applied tariffs than bound rates on some agricultural products). There was one question seeking clarification in the area of export subsidies and one in the area of export restrictions and prohibitions (India's export subsidies for onions and India's export restrictions on sugar, respectively). For the first time, the subject of how trade policies may be affected by the exit of the United Kingdom from the European Union was raised in the CoA.
39 The complete questions and answers can be accessed through the Agriculture Information
Management System at http://agims.wto.org by using the ID numbers (Table 3.15) in the function "Search Q&A Submitted Since 1995".

48
Table 3.15 Article 18.6 new issues
Question Summary Question raised by Products Number of questions
CoA meetings ID number
Canada's Market price support for dairy products
New Zealand Dairy, milk, milk powders, butter, cheese, other
2 82, 83 83001, 82058
India's minimum support price for Kharif crops
United States Rice, oil seeds, fats and oils, seeds, vegetable oils and fats, fats/oils of animal origin, other fats and oils, cotton
2 82, 83 83043, 82005
Australia's wine equalization tax
European Union Alcoholic 1 83 83006
Canada's Agri-Marketing Program
Indonesia 1 83 83067
European Union intervention programmes
Australia 1 82 82023
European Union's support for livestock sector
New Zealand Live animals, bovine, swine, sheep and goat, poultry, horses, other
1 83 83055
European Union (Greece) coffee tax
Viet Nam Coffee 1 82 82003
India - minimum price for sugar cane in Uttar Pradesh
European Union Cane or beet sugar 1 83 83010
India's buffer stocks of pulses
Canada Processed vegetables
1 83 83122
India's export restriction on sugar
European Union Sugar, cane or beet sugar, other
1 82 82033
India's export subsidies for onions
European Union Fresh vegetables 1 82 82032
India's minimum support price for wheat
Australia Wheat 1 83 83106
India's support price for Rabi crops
European Union Wheat 1 83 83009
India's trade statistics United States 1 83 83044 Indonesia's draft regulation on supply and distribution of milk products
European Union Milk 1 83 83011
Japan's mark-up on imported rice
China Rice 1 83 83035
Russian Federation's higher applied tariffs than bound rates
European Union 1 83 83012
United States Federal Milk Marketing Order (FMMO)
Canada Milk 1 83 83124
European Union (United Kingdom) Modification of agricultural schedule of commitments
Indonesia 1 83 83069
Source: WTO Secretariat.
3.68. Other measures discussed relate to follow-up questions on persistent areas of concern. For example, Brazil's domestic support programmes have been raised in 17 CoA meetings, and India's sugar export subsidies have been the subject of questioning in the CoA fourteen times. Canada's wine sale policy, its tariff-rate quota for cheese and its new milk ingredient class continued to receive scrutiny in the CoA. Other recurrent issues include India's importation of apples, U.S. purchase of cheese stocks, and Argentina's tax policies (Table 3.16).

49
Table 3.16 Questions previously raised under Article 18.6
Question Summary
Question raised by Products Number of
questions
Number of CoA
meetings in which the issue
was discussed
CoA meetings ID number
India's sugar export subsidies
Australia, Brazil, Colombia, European Union, Thailand
Sugar, cane or beet sugar, other
25 14 50, 51, 52, 73, 74, 75, 76, 77, 78, 79, 80, 81, 82, 83
83105, 82024, 81025, 81062, 80011, 80037, 79023, 79047, 78016, 78017, 77035, 77044, 76016, 76025, 76050, 75028, 74007, 74055, 73036, 73055, 73067, 73068, 52005, 51001, 50003
Brazil's domestic support programmes
United States Wheat, corn, rice, malt, coarse grains, cotton
17 17 65, 66, 68, 69, 70, 71, 72, 73, 74, 75, 76, 77, 78, 79, 80, 81, 83
83038, 81008, 80024, 79001, 78002, 77066, 76039, 75023, 74021, 73026, 72051, 71028, 70007, 69027, 68007, 66002, 65011
Canada's New Milk Ingredient Class
Australia, India, New Zealand, United States
Dairy, milk, milk powders, butter, cheese, other
16 5 79, 80, 81, 82, 83
83054, 83039, 82012, 82059, 82013, 82001, 81001, 81009, 81049, 81054, 81055, 81056, 80003, 80005, 80006, 80025, 79035
Canada's wine sale policy
Australia, European Union, New Zealand, United States
Alcoholic 14 5 79, 80, 81, 82, 83
83007, 83041, 83104, 83135, 82057, 82002, 81003, 81011, 81024, 81046, 81047, 81097, 80008, 80009, 80094, 80095, 79003
Canada's tariff-rate quota for cheese
New Zealand, Norway, Switzerland, United States
Cheese 8 6 75, 76, 77, 80, 81, 83
83003, 83004, 83005, 81004, 81051, 81052, 80001, 80002, 80007, 77037, 77001, 76023, 75026
European Union's agriculture policies
Australia, India, New Zealand
Dairy, milk, milk powders, butter, cheese, other, bovine, swine,
7 3 80, 81, 82 82027, 82028, 81005, 81058, 81060, 81061, 80010
India's wheat stocks and exports
Canada, United States
Wheat 7 4 72, 73, 74, 83
83042, 72061, 72008, 73039, 73003, 74048, 74001
India's importation of apples
Chile, European Union, New Zealand, United States
Fruit 6 6 78, 79, 80, 81, 82, 83
83056, 82060, 81006, 80014, 79067, 78084, 78085, 78086, 78088

50
Question Summary
Question raised by Products Number of
questions
Number of CoA
meetings in which the issue
was discussed
CoA meetings ID number
India's new crop insurance scheme
Canada, European Union
4 3 79, 80, 82 82031, 80068, 79024, 79051
Turkey's subsidies aimed at incentivizing the use of domestic dairy
New Zealand Dairy, milk, milk powders, butter, cheese, other
3 3 81, 82, 83 83058, 82067, 81065
United States purchase of cheese stock
Australia, Canada
Cheese 3 2 81, 82 82061, 82025, 81066
China's regional assistance programmes
Australia 2 2 81, 82 81053, 82014
Turkey's domestic support policies
Canada 2 2 81, 82 82056, 81064
United States Price Loss Coverage and Agriculture Risk Coverage programmes
India 2 2 81, 82 82026, 81070,
Argentina's tax policies
Ukraine 2 2 80, 82 80059, 82041
Source: WTO Secretariat.
3.69. Regarding the review of notifications, timely and complete notifications are fundamental for effective monitoring of the implementation of commitments. Twelve distinct notification requirements are applicable in agriculture covering the following areas: market access, domestic support, export subsidies, export prohibitions or restrictions and the follow-up to the Marrakesh NFIDC Decision. The applicability of a notification requirement to a Member is largely dependent on its specific commitments under the Agreement on Agriculture (AoA). Out of the 12 notification requirements the following five are "regular" or "annual" notification requirements: (i) imports under tariff and other quotas (MA:2); (ii) special safeguards (MA:5); (iii) domestic support (DS:1); (iv) export subsidies (ES:1); and (v) total exports (ES:2). Annual notifications are required to be submitted no later than a certain number of days following the end of the year in question, in accordance with the deadlines set out in document G/AG/2.
3.70. G20 members have shown a high level of compliance with their transparency obligations under the AoA and have submitted 90% of their expected 1,244 notifications for the period 1995-2015. All expected notifications regarding 1995 to 2000 have been submitted (Chart 3.11). Furthermore, as seen in Chart 3.12, in recent years G20 economies have frequently submitted notifications that cover more than one implementation year which indicates an effort to bring their notifications up-to-date.
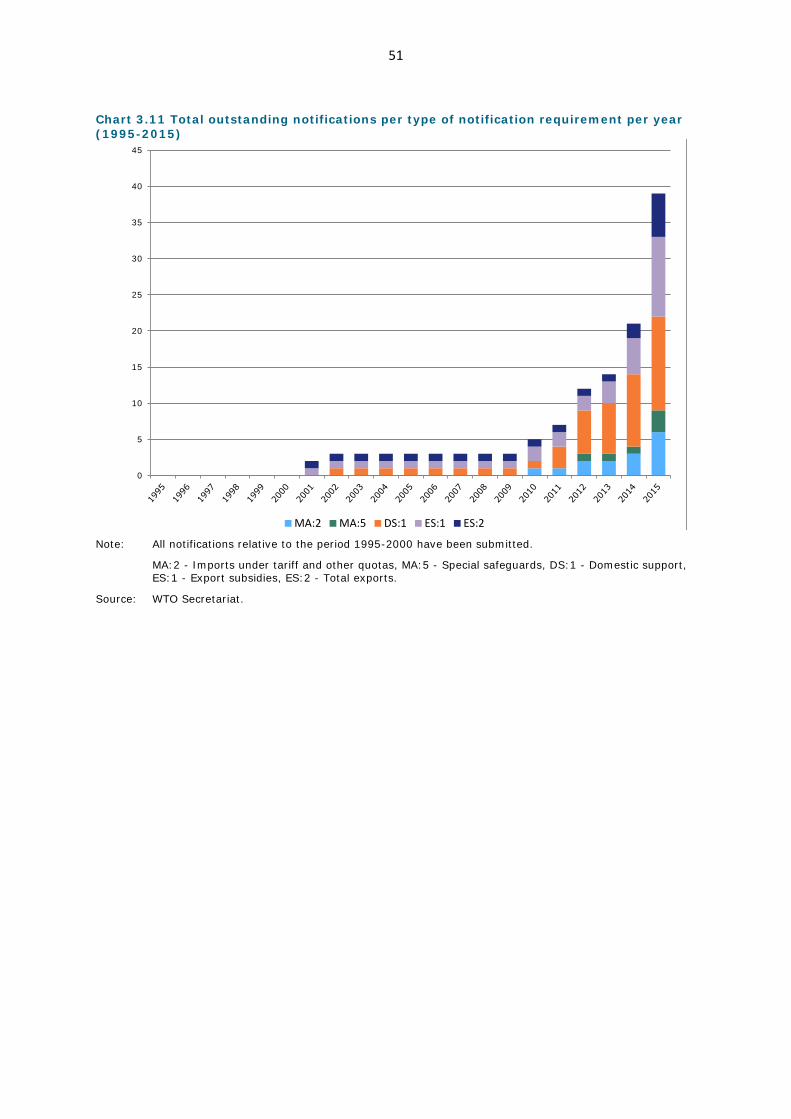
51
Chart 3.11 Total outstanding notifications per type of notification requirement per year (1995-2015)
0
5
10
15
20
25
30
35
40
45
MA:2 MA:5 DS:1 ES:1 ES:2
Note: All notifications relative to the period 1995-2000 have been submitted.
MA:2 - Imports under tariff and other quotas, MA:5 - Special safeguards, DS:1 - Domestic support, ES:1 - Export subsidies, ES:2 - Total exports.
Source: WTO Secretariat.

52
Chart 3.12 Number of years reported in regular notifications by G20 members (1995-2017a)
0
20
40
60
80
100
120
140
Number of regular notifications
Total number of years reported
a Until 16 March 2017.
Note: For example, in 2009 the G20 economies submitted 44 notifications covering 127 years. Mexico for instance submitted one Table MA:2 notification reporting in-quota imports for eight years (2000, 2001, 2002, 2003, 2004, 2005, 2006 and 2007). For the purpose of this table, this means that Mexico reported eight implementation years.
Source: WTO Secretariat.
3.71. From 15 September 2016 to 15 April 2017, G20 economies submitted 49 notifications (including addenda and corrigenda). A total of 75 questions were posed during the November 2016 and March 2017 CoA meetings concerning these and previously submitted notifications. These questions accounted for more than 64% of all questions raised in the CoA in that period. As seen in Chart 3.13, during the review period all but four questions concerning notifications related to domestic support (95%). In particular, domestic support notifications by the United States, the European Union and the Russian Federation were the subject of a considerable number of questions. There were nine questions raised concerning the lack of notifications by some G20 members.
Chart 3.13 Number of questions raised per section (mid-October 2016 - mid-May 2017) Overdue
Notifications(9)
Market access(4)
Article 18.6(56)
Individual notifications
(75)
Domestic support
(71)
Source: WTO Secretariat.

53
3.72. Further to the Nairobi Ministerial Decisions, the Committee held its first annual dedicated discussion in the field of export competition at its June 2016 meeting. The discussion was held on the basis of the Secretariat's background document40 which included the answers to a questionnaire sent to WTO Members, relevant information from export subsidy (ES:1) and food aid (ES:3) notifications, and relevant notifications to the Working Party on State Trading Enterprises. More than half of the questions were directed at G20 members regarding policies in such areas as export subsidies; export credits, export credit guarantees or insurance programmes; agricultural exporting State Trading Enterprises and international food aid (Table 3.17).41 A number of questions posed to G20 members requested clarification on how they intended to ensure compliance of their policies with the relevant provisions of the Nairobi Decision on Export Competition.42
Table 3.17 Questions asked to G20 members in the context of the CoA annual dedicated discussion in the field of export competition held in June 2016
Question answered by Question raised by Areas Brazil European Union Export subsidies; export credits, export credit
guarantees or insurance programmes Canada European Union Export subsidies China European Union Export credits, export credit guarantees or insurance
programmes India Australia, Canada Agricultural exporting state trading enterprises;
export credits, export credit guarantees or insurance programmes
Indonesia European Union Export subsidies Japan Canada International food aid Mexico European Union Export subsidies Russian Federation Australia, European Union International food aid; agricultural exporting State
Trading Enterprises South Africa European Union Export subsidies Turkey European Union Export subsidies; international food aid United States Australia, Canada,
European Union Export credits, export credit guarantees or insurance programmes; international food aid
Source: WTO Secretariat.
3.6 General Economic Support
3.73. In the immediate aftermath of the 2008 financial crisis, general economic support measures played an important role in many economies. These measures included very significant domestic bailouts, substantial measures targeting the financial sector, state aid programmes and large-scale multi-sector and sometimes economy-wide stimulus packages.
3.74. Subsequent years saw a significant decrease in the number of such support programmes with measures appearing to be increasingly sector-specific and export-oriented, including various trade finance programmes, often to assist SMEs or start-up enterprises. Over the years, the Annex covering general economic support measures in the trade monitoring report has covered a wide variety of programmes and sectors that have benefitted from general economic support measures which may have had potentially important trade-related effects. Whereas several of the general economic support measures and subsidy programmes which were implemented almost immediately following the onset of the financial crisis included features which had real potential to curb or distort international trade, it has often been very difficult to ascertain the impact of certain measures on trade flows. As a result, and even if reporting these measures provided an important element of transparency, the WTO trade monitoring reports neither classified nor counted such measures as trade-restrictive.
3.75. The November 2016 Monitoring Report on G20 Trade Measures provided a brief historical overview of trends in the area of general economic support measures taken by G20 economies since 2008. Of particular interest was the apparent recent plateauing of such measures, albeit at a
40 G/AG/W/125/Rev. 4 and addenda. 41 G/AG/W/155 42 WT/MIN(15)/45

54
higher level than anything seen between 2010 and 2014 and considerable lower than 2008-09. Another important development was the increasing number of instances where G20 economies appeared to have reduced or eliminated economic support programmes, e.g. a reduction of fuel subsidies or the elimination of financial aid and local content preferences for energy related equipment.
3.76. However, collecting and verifying information on general economic support measures has continued to represent a significant challenge in the preparation of the reports. While there seems to be a recognition among G20 economies that general economic support and subsidies at the national as well as sub-national level often can have an important impact on trade, the lack of active participation by several G20 economies in providing relevant information in this area has been a problem since the beginning of the exercise. In addition, the fact that some G20 economies are relatively transparent regarding general economic support measures compared to others has meant that on several occasions one G20 economy accounted for more than half of all reported general economic support measures. This, combined with the insistence of others to have their support programs excluded from the Report, has effectively compromised the balance in the reporting of such measures.
3.77. The number of G20 economies that provided information on general economic support measures implemented during the current review period remained again disappointingly low. Yet, it is widely known that several large-scale bailout packages in the dairy and the energy sectors have been implemented by some G20 economies over the past six months. This reinforces the conclusion of previous reports that the universe of general economic support measures is much greater than what this exercise has managed to capture and that such programmes will remain attractive policy tools to governments, particularly for strategic sectors, despite the often significant financial cost of such programmes.
3.78. At this juncture, and based on the information provided on general economic support measures, there is little basis for maintaining an annex for this type of policies which would provide a credible and transparent account of recent developments across G20 economies.
3.7 Other Selected Trade Policy Issues
3.79. The following Section provides a concise overview of other selected trade policy issues where important developments took place during the review period.
Trade Facilitation
3.80. Work on the implementation of the Trade Facilitation Agreement (TFA) continued to make progress and reached an important milestone on 22 February 2017 when a sufficient number of ratifications43 was received for the Agreement to enter into force. The required number of 110 acceptances was reached – and even surpassed - with a total of 112 instruments having been deposited by the end of that day. This marked an increase of 18 ratifications since the end of the last reporting period (mid-October 2016).
3.81. Advances were also made on the notification side. Members provided a series of submissions informing of:
(i) the provisions they will implement as of the TFA's entry into force (the so-called "category A commitments"); (ii) the provisions they consider to require additional time (the so-called "category B commitments"); (iii) the provisions they consider to require both additional time and capacity-building support (the so-called "category C commitments").
43 See http://www.tfafacility.org/ratifications.

55
3.82. Over 90 WTO Members had submitted related notifications when the TFA entered into force.44 Ninety-two of them covered category A, with some also designating provisions under categories B (9) and C (8). In addition, six WTO Members45 committed to implement the entire TFA as of its entry into force, which makes the number of WTO Members with complete A, B and C records is even higher.
3.83. Work continued with respect to technical assistance and capacity-building initiatives. In 2014 the Director-General launched a WTO Trade Facilitation Facility46 (the Facility) to assist developing and LDC Members in implementing the TFA that became operational on 27 November 2014. The Facility works closely with individual Members to ensure they are receiving the information and support needed. It also provides information on assistance programmes and, where needed, it can conduct match-making between donors and recipients. The Facility supports Members' efforts to implement the Agreement by acting as a repository for training materials, case studies and best practices on implementation of the measures. It provides training programmes and support materials to assist Members to fully understand their obligations. This year the Facility assisted Members to prepare their notifications and build the capacity of the national trade facilitation committees by conducting national and sub-regional workshops. It also offered an advanced course for chairs of national trade facilitation committees, with the cooperation of partner organizations. Two courses were conducted in English in 2016 with courses in French and Spanish planned for early 2017.
44 See http://www.tfafacility.org/notifications. 45 Of the G20 economies the Republic of Korea and Mexico implemented the entire TFA as of its entry
into force. 46 Viewed at www.TFAFacility.org.

56
Box 3.5 Trade facilitation and the global economy: 2017 OECD Trade Facilitation Indicators update Implementation of the WTO Trade Facilitation Agreement (TFA), which entered into force on 22 February 2017, is expected to generate reductions in trade costs of between 12% and 18%1 for countries (depending on level of development and ambition of implementation) and provide a much needed boost to global growth.2
The OECD Trade Facilitation Indicators (TFIs)3 measure progress on the full range of issues covered under the TFA for more than 160 countries. They provide a targeted tool for monitoring and benchmarking country performance on trade facilitation, for highlighting areas where further reform would bring benefits, and for assessing the impact of reforms. While not designed to assess compliance with specific TFA provisions, at the moment of entry into force of the TFA, the TFIs offer a snapshot of the state of play on trade facilitation around the world, highlighting best practices and the main advances and challenges that countries will need to address on their path to implementing measures in areas covered by the Agreement.
"Trade Facilitation and the Global Economy” (forthcoming) provides updated TFIs to 2017 and important new evidence on the gains from trade facilitation reforms in an interconnected global economy, including how fast and efficient border procedures and improved delivery times affect the operation of supply chains. Enhanced transparency, predictability and simplification of border procedures have the potential not only to reduce trade costs and promote economic efficiency but also to remove both the incentives and opportunities for corruption.
The updated TFIs show that, in early 2017 implementation of a wide range of trade facilitation measures falling under the scope of the TFA is well under way (Figure 1). For example, such good progress can be highlighted in the areas of advance rulings, fees and charges and simplification and harmonization of documents. Significant improvements have also been achieved since 2015 in other areas such as involvement of trade community, automation or streamlining of procedures. The biggest challenges lie in co-operation among all the agencies involved in border processes, both domestically, and across borders.
Overall, performance within income groups is far from homogeneous in most policy areas, as both high and low performers can be found within all groups. That said, a number of policy areas, such as advance rulings or automation, appear to be closely associated with income, which suggests that aid for trade investments in capacity building in these areas are likely to yield significant benefits.
Figure 1. TFIs 2017: full sample snapshot, income groupings
Note: The shaded area depicts measures that go beyond the mandatory provisions of the TFA. The dotted portion of the grey line highlights the fact that all TFA provisions for external border agency co-operation are “best endeavours”. _______________
1 OECD (2015), “Implementation of the WTO Trade Facilitation Agreement: The Potential Impact on Trade Costs”, http://www.oecd.org/tad/tradedev/WTO-TF-Implementation-Policy-Brief_EN_2015_06.pdf. 2 OECD (forthcoming), “Economy-wide effects of trade facilitation: a METRO model simulation”. 3 http://www.oecd.org/trade/facilitation/indicators.htm
Source: OECD.
Government Procurement
3.84. At present, the Agreement on Government Procurement (GPA) has 19 parties comprising 47 WTO members. Another 29 WTO members participate in the GPA Committee as observers. Out of

57
these, 9 Members are in the process of acceding to the Agreement. Among the G20 economies, nine of them (Canada, European Union, France, Germany, Italy, Japan, the Republic of Korea, United Kingdom and United States) are formally covered by the GPA while another eight (Argentina, Australia, China, India, Indonesia, Russian Federation, Kingdom of Saudi Arabia and Turkey) are observers in the WTO Committee on Government Procurement. Substantive discussions on the accession of Australia have taken place since the last report. A constructive dialogue also took place regarding accession by China. During the review period, the Russian Federation initiated its GPA accession.
3.85. Significant work was done by the Committee in relation to its agreed Work Programmes which were adopted at the time of the conclusion of the renegotiation of the Agreement in 2012. The Work Programmes are intended, broadly to: (i) promote transparency with respect to Parties' implementation of the Agreement; (ii) facilitate, where relevant, improvements in the administration of the Agreement; and (iii) contribute, where appropriate, to preparations for future negotiations that are called for in the revised GPA. Activity focused, in particular on the Work Programmes dealing with: (i) access to government procurement activities by SMEs; (ii) the collection and reporting of statistical data; (iii) exclusions and restrictions in Parties' Annexes; and (iv) the promotion of sustainability in Parties' procurement processes. An important input to the latter work programme was a Symposium which took place on 22 February 2017 and in which civil society representatives offered relevant suggestions for consideration by the Committee (see Box 3.6).
Box 3.6 Symposium on Sustainable Public Procurement (SPP) The Symposium on Sustainable Procurement, organized by the WTO Secretariat at the request of the Committee on Government Procurement, took place on 22 February 2017. It featured inputs from diverse non-governmental experts on sustainability issues in addition to national experts and representatives of other international organizations.1 In the course of the Symposium:
• the scope for promotion of sustainability objectives under the revised GPA (adopted in 2012) was highlighted;
• the experience of several WTO Members in successfully implementing SPP projects was discussed; • the following dimensions of SPP were considered: (i) protection of the environment; (ii) social dimensions
(e.g. human rights, working conditions) and (iii) economic opportunities (e.g. innovation research/investment, open competition, supply chain competitiveness and the promotion of small business).
• SPP was defined as a strategic tool, regarding which prioritization and assessment are important at every stage of a procurement process.
_______________ 1 All presentations are available at: https://www.wto.org/english/tratop_e/gproc_e/gp_symp_22feb17_e.htm#fnt-1.
Source: WTO Secretariat.
3.86. The Secretariat launched an enhanced version of its e-GPA web portal to better service the information needs of GPA Parties, accession candidates and their suppliers (https://e-gpa.wto.org/). The system is intended to provide user-friendly access to Parties' market access schedules and other information that Parties provide pursuant to the Agreement, in a modern and interactive format. It synergizes importantly with particular elements of the revised GPA text that are aimed at promoting the use of electronic tools in Parties' procurement systems. Separately, interest has been expressed by some Parties in exploring possibilities for expanded use of electronic tools for exchanging information on actual procurement opportunities and statistical data.
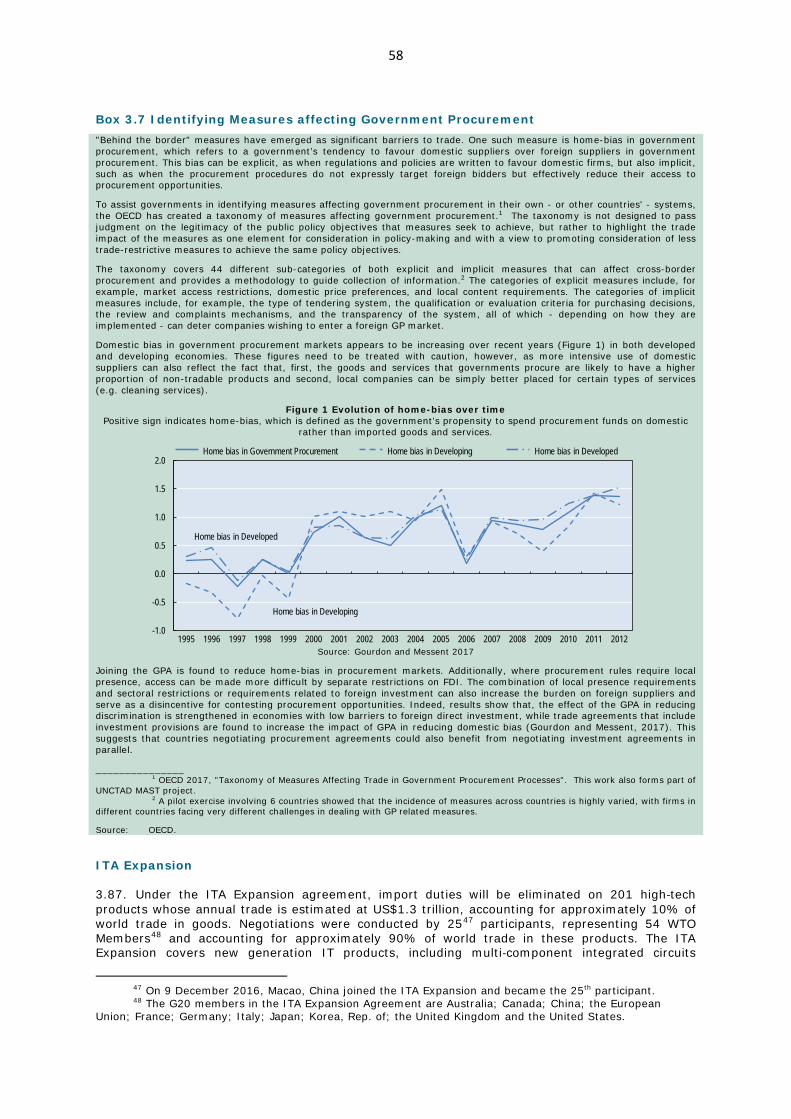
58
Box 3.7 Identifying Measures affecting Government Procurement "Behind the border" measures have emerged as significant barriers to trade. One such measure is home-bias in government procurement, which refers to a government’s tendency to favour domestic suppliers over foreign suppliers in government procurement. This bias can be explicit, as when regulations and policies are written to favour domestic firms, but also implicit, such as when the procurement procedures do not expressly target foreign bidders but effectively reduce their access to procurement opportunities.
To assist governments in identifying measures affecting government procurement in their own - or other countries' - systems, the OECD has created a taxonomy of measures affecting government procurement.1 The taxonomy is not designed to pass judgment on the legitimacy of the public policy objectives that measures seek to achieve, but rather to highlight the trade impact of the measures as one element for consideration in policy-making and with a view to promoting consideration of less trade-restrictive measures to achieve the same policy objectives.
The taxonomy covers 44 different sub-categories of both explicit and implicit measures that can affect cross-border procurement and provides a methodology to guide collection of information.2 The categories of explicit measures include, for example, market access restrictions, domestic price preferences, and local content requirements. The categories of implicit measures include, for example, the type of tendering system, the qualification or evaluation criteria for purchasing decisions, the review and complaints mechanisms, and the transparency of the system, all of which - depending on how they are implemented - can deter companies wishing to enter a foreign GP market.
Domestic bias in government procurement markets appears to be increasing over recent years (Figure 1) in both developed and developing economies. These figures need to be treated with caution, however, as more intensive use of domestic suppliers can also reflect the fact that, first, the goods and services that governments procure are likely to have a higher proportion of non-tradable products and second, local companies can be simply better placed for certain types of services (e.g. cleaning services).
Figure 1 Evolution of home-bias over time Positive sign indicates home-bias, which is defined as the government’s propensity to spend procurement funds on domestic
rather than imported goods and services.
Home bias in Developing
Home bias in Developed
-1.0
-0.5
0.0
0.5
1.0
1.5
2.0
1995 1996 1997 1998 1999 2000 2001 2002 2003 2004 2005 2006 2007 2008 2009 2010 2011 2012
Home bias in Government Procurement Home bias in Developing Home bias in Developed
Source: Gourdon and Messent 2017
Joining the GPA is found to reduce home-bias in procurement markets. Additionally, where procurement rules require local presence, access can be made more difficult by separate restrictions on FDI. The combination of local presence requirements and sectoral restrictions or requirements related to foreign investment can also increase the burden on foreign suppliers and serve as a disincentive for contesting procurement opportunities. Indeed, results show that, the effect of the GPA in reducing discrimination is strengthened in economies with low barriers to foreign direct investment, while trade agreements that include investment provisions are found to increase the impact of GPA in reducing domestic bias (Gourdon and Messent, 2017). This suggests that countries negotiating procurement agreements could also benefit from negotiating investment agreements in parallel.
_______________ 1 OECD 2017, "Taxonomy of Measures Affecting Trade in Government Procurement Processes". This work also forms part of UNCTAD MAST project. 2 A pilot exercise involving 6 countries showed that the incidence of measures across countries is highly varied, with firms in different countries facing very different challenges in dealing with GP related measures.
Source: OECD.
ITA Expansion 3.87. Under the ITA Expansion agreement, import duties will be eliminated on 201 high‐tech products whose annual trade is estimated at US$1.3 trillion, accounting for approximately 10% of world trade in goods. Negotiations were conducted by 2547 participants, representing 54 WTO Members48 and accounting for approximately 90% of world trade in these products. The ITA Expansion covers new generation IT products, including multi‐component integrated circuits
47 On 9 December 2016, Macao, China joined the ITA Expansion and became the 25th participant. 48 The G20 members in the ITA Expansion Agreement are Australia; Canada; China; the European
Union; France; Germany; Italy; Japan; Korea, Rep. of; the United Kingdom and the United States.

59
(MCOs), touch screens, GPS navigation equipment, portable interactive electronic education devices, video game consoles, and medical equipment, such as magnetic resonance imaging products and ultra‐sonic scanning equipment.
3.88. The first tariff cut took place on 1 July 2016 for the majority of participants, subject to the completion of domestic procedural requirements.49 According to preliminary estimates by the WTO Secretariat, 95.4% of Participants' imports of these products will be fully eliminated by 2019, with longer implementation periods (five or seven years) for a very limited number of sensitive products. The ITA Expansion agreement is open to any other WTO Member wishing to join it.50 The new tariff commitments will be recorded in each Participant's WTO Schedule of concessions and applied on an MFN basis, which means that all 164 WTO Members will benefit from duty-free market access for the covered products.
Regional Trade Agreements (RTAs) 3.89. The G20 economies account for a major share of today's RTA activities. As of May 2017, 274 RTAs had been notified to the WTO and were in force. All WTO Members are now party to at least one RTA.51 Of these RTAs more than half (63%) involve at least one G20 economy. In addition, like other WTO Members, G20 economies continue to negotiate new RTAs. Several G20 members are also involved in negotiating large plurilateral agreements: the Trans-Pacific Partnership (TPP) Agreement was originally negotiated between 12 partners, of which Australia, Canada, Japan, Mexico and the United States are G20 members (although the United States has since withdrawn); negotiations for a Regional Comprehensive Economic Partnership (RCEP) include G20 members such as Australia, China, India, Japan and the Republic of Korea; the Pacific Alliance includes Mexico; the Trans-Atlantic Trade and Investment Partnership (TTIP) negotiations are between the EU and the United States, EU-MERCOSUR, which includes Argentina, Brazil and the European Union; and the Tripartite Agreement which includes South Africa. In addition the Russian Federation is party to the Eurasian Economic Union involving five parties. Thus a significant number of G20 members are already party to or involved in negotiating plurilateral RTAs.
Trade financing
3.90. Unmet global demand for trade finance, as measured annually by the Asian Development Bank (ADB), with the support of several institutions, remained high and stable at US$1.6 trillion, in 2015, or 10-15% of the total value of trade finance markets. Disproportionally affecting SMEs and developing countries, most of the gap is recorded in developing Asia, as well as in Latin America, Africa and the CIS countries. According to the 2016 Global Enabling Trade Report by the World Economic Forum, trade finance features among the top three obstacles to exporting for more than half of the countries in the world. Globally, 58% of SMEs saw their trade finance requests rejected, against 10% for multinational companies, according to the ADB. While new types of trade finance providers are entering the market, banks are digitizing their internal processes to reduce costs. Nevertheless, 70% of 800 surveyed firms from 91 countries were unfamiliar with digital finance.
3.91. With the support of WTO Members, the Director-General outlined in 2016 a number of possible measures aimed at addressing the challenges of accessing trade finance52, i.e. enhancing trade finance facilitation programmes, helping local banking sectors to grow by improving training, better monitoring of problems, and maintaining a closer dialogue with regulators.
3.92. Progress has being recorded in the past year. Multilateral development banks are in the process of adapting trade finance facilitation programmes, with a view to better respond to the needs of SMEs. For example, supply chain finance for SMEs has been made available by the ADB, and plans to increase current exposure are being discussed. The World Bank's International Financial Corporation (IFC) has been increasing trade finance in Africa. The Board of the African Development Bank decided to lift the four-year sunset clause on the Bank's trade finance
49 Members implementing the ITA Expansion agreement are reflected in Annex 1. 50 G20 members in the ITA Expansion agreement are Australia; Canada; China; the European Union;
France; Germany; Italy; Japan; Korea, Rep. of; the United Kingdom; and the United States. 51 Before the entry into force of its agreement with Japan in June 2016, Mongolia was the only WTO
member with no RTAs in force. 52 "Trade Finance and SMEs: Bridging the Gaps in Provision", see at
https://www.wto.org/english/res_e/booksp_e/tradefinsme_e.pdf

60
programme, introduced in 2013, to make trade finance a regular activity of the Bank. The Islamic Development Bank has increased the amount of trade supported in its geographical area from US$5 to US$7 billion annually, particularly in the poorest countries of its membership. The EBRD has continued to expand its trade finance facilitation programme in North Africa. Also, synergies are being explored by multilateral development banks. The IFC and ADB have been exploring co-risk sharing arrangements to provide more trade finance in Viet Nam and such partnerships are being considered by other multilateral institutions. It is estimated that up to 8,000 trade transactions, involving mainly SMEs in the developing world are being facilitated by multilateral development banks.
3.93. Part of the trade finance gap reflects a knowledge gap, notably in developing countries. To address this, professional organizations from the private sector are strengthening their cooperation with multilateral development banks. For example, the International Chamber of Commerce e-learning Academy has started to cooperate with the Factoring International Association and other professional institutions, while obtaining support from the ADB. Private sector organizations are in a better position to engage now that the WTO has helped increase awareness of issues and promoted the development of the international trade finance registry.

61
Box 3.8 Developing a typology to analyze and measure digital trade In some ways, digital trade is not new. Digitally related transactions -- in relation to goods or services -- have been part of the landscape for many years and often raise the same, or similar, issues as non-digital transactions. But what is new is the scale of transactions, the pace of change and the emergence of new players transforming production processes and industries. In this fast-evolving environment, governments are facing growing regulatory challenges, not just in managing digital disruption, but also in ensuring that the opportunities and benefits from digital trade can be realized and shared in an inclusive manner. The digital transformation is increasingly changing how and what we trade. Digitally enabled trade is not just about digitally delivered services, it is also about supply-chain trade in goods and services enabled through growing digital connectivity increasing access to foreign markets for firms, not least SMEs, in a way that would previously have been unimaginable. It is also about more bundled goods (packages of goods or services or both and services embodied in goods); growing trade in smaller, often lower value physical packages and in digitally delivered services; and increased trade in emerging ‘information industries’ providing at-a-distance ‘big data’ analytics or quantum computing services.1 Digital trade is underpinned by data flows. In addition to being at the core of innovations such as cloud computing, the Internet of Things and Additive manufacturing (including 3D printing), data flows also underpin trade less directly by enabling control and coordination along global value chains (GVCs) or by enabling trade facilitation measures. Data flows are thus a means of production, an asset that can be traded, a way of delivering some services, and the means of organizing GVCs. Broadly cast, digital trade encompasses digitally enabled transactions in goods and services which can be either digitally or physically delivered and which involve consumers, firms and governments. A flexible and modular typology can help unpack the How (physically or digitally delivered); the What (good or service) and the Who (the actors) of digital trade, and serve as a tool for thinking through trade policy and measurement issues (Figure 1).
Figure 1: Towards a flexible typology of digital trade
Digital trade raises a number of trade policy issues. For example, the significant growth in trade in small packages ordered online poses challenges from both a trade facilitation and revenue point of view, with countries looking again at de minimis thresholds and the management of parcel trade. A range of issues for market openness can arise from the combination of goods and services trade along the digital trade supply chain. And with the movement of data across borders to digital trade, the organisation of GVCs and trade facilitation, policy-makers face new challenges in finding policy approaches that combine the need for privacy and security with the significant benefits of open markets. Critically, more needs to be done to ensure that countries at different stages of development are able to fully benefit from the new opportunities from digitalization. Measuring digital trade is also challenging. The flow of funds across a border may be classified differently from the service provided; for example, the flow of funds from a ride-sharing platform operating cross-border may appear as a financial or an intermediation service, while the service delivered is a transport service. Other issues can arise for social media platforms which earn revenue through advertising services, based on data from consumers to whom they are providing a "free" service (i.e. the flows from their clients do not result in a monetary transaction but can support one). Progress has been made, and further efforts are underway to better identify which goods and services transactions are digitally ordered, platform enabled or digitally delivered. _______________ 1 Lopez-Gonzalez, J and Jouanjean, MA. (2017) « Digital Trade : developing a framework for analysis” OECD Trade Policy Papers, OECD publishing, Paris.
Source: OECD.

62
4 POLICY DEVELOPMENTS IN TRADE IN SERVICES
4.1. This report captures new measures affecting trade in services introduced by Argentina, Australia, Brazil, Canada, China, the European Union, France, India, Indonesia, the Republic of Korea, the Russian Federation, the United Kingdom, and the United States. Most of the new measures are either horizontal in nature – relating to measures affecting the supply of services through commercial presence and the movement of natural persons – or pertain to financial services and the communication sector. While the majority of the measures covered either provide for additional liberalization or aim to strengthen or clarify regulatory frameworks, certain other measures appear more trade-restrictive. Annex 4 provides additional information on all these measures.
4.2. Some G20 economies made modifications to their foreign investment policies that affect various services sectors. For example, China adopted a number of distinct measures aiming to promote investment in several sectors and regions. This includes the creation of new free trade zones providing for better treatment of foreign investment, as well as the adoption of revised rules with respect to priority industries for foreign investment in the Central and Western regions. Brazil introduced amendments in relation to registration and other requirements related to foreign direct investments.
4.3. A number of G20 members adopted new measures affecting the supply of services through the movement of natural persons. For example, Australia announced in April 2017 that its "457 visa" for temporary work by skilled foreign workers would be abolished in March 2018 and replaced by a new Temporary Skill Shortage (TSS) visa. Implementation of this reform is taking place in different stages. As of 19 April 2017, the occupation lists that underpin the 457 visa have been condensed from 651 to 435 occupations.
4.4. France has adopted new measures in relation to intra-corporate transferees, providing in particular for the creation of "ICT Mobile Permits", which allow foreign nationals holding an intra-corporate transferee permit in one EU Member State to work temporarily in France without the need to obtain a new work permit. India introduced improvements to its visa schemes. It expanded the number of countries eligible under its e-Visa programme, which allows to enter the country for up to 60 days for business visits and other specific activities, and launched a new "intern visa" category. For its part, the Republic of Korea issued new guidelines that limit the use of the Short Term Travellers Visa to non-profit activities. All for-profit activities, including the supply of services pursuant to a contract, require an employment visa before entry.
4.5. Several Members have adopted new measures in relation to the communication sector or broader frameworks relating to electronic transactions and data. For instance, Argentina established rules and standards with respect to the convergence between television, telecommunication, and information technology services, the European Union adopted a new Directive on security of network and information systems, and the United States adopted a new measure easing the capacity of Internet Service Providers to commercialize user data. Indonesia, for its part, issued a new regulation on data protection, which, among other things, requires electronic system providers to have data centres located in Indonesia and sets out procedures for cross-border data transfers, which are subject to coordination with the responsible Ministry.
4.6. In China, a new Cybersecurity Law, effective from 1 June 2017, requires "personal information and important data" collected and generated in China to be stored domestically. Security assessments by authorities will be conducted in relation to information and data transferred abroad because of business requirements. China also adopted a new Film Industry Promotion Law, effective since 1 March 2017, that sets out new requirements and procedures in relation to the production, distribution, review, and exhibition of feature films in China. For instance, the law requires local theatre operators to ensure that the screening time for Chinese films is no less than 2/3 of the annual screening time of all films.
4.7. The Russian Federation adopted, on 1 May 2017, a law that limits foreign participation in certain audiovisual services. The new measure applies to systems that provide online distribution of collections of audiovisual works that have more than 100,000 users per day in the Russian Federation and that offer content for a fee or conditional on viewing advertising targeted at residents of the Russian Federation. The law provides that only a Russian legal entity or a Russian

63
Federation citizen that does not hold the citizenship of another state can own such systems. Foreign persons that own an information resource used for online distribution of collections of audiovisual works that has less than 50% of its users in the Russian Federation are not allowed to own more than 20% of the capital of such Russian legal entities, unless permission is received from a government commission. The law will not apply to Internet search systems or information resources that primarily distribute content posted by individual Internet users.
4.8. Various policy changes took place in the financial services sector. For instance, as regards insurance, Argentina adopted a new resolution easing limits on the cross-border supply of reinsurance and retrocession services. Insurance companies will be allowed to place their risks directly with Admitted Reinsurers (cross-border reinsurers) according to the following scheme: up to 50% of their ceded premiums for contracts beginning 1 July 2017; up to 60% of their ceded premiums for contracts beginning on 1 July 2018; up to 75% of ceded premiums for contracts beginning on 1 July 2019. Brazil also introduced new liberalization measures for the reinsurance market. Regulations increased to 70% the percentage of risks that can be ceded to foreign reinsurers. This figure will continue to increase each year until it reaches 85% in 2020. Previously, reinsurance allocation required preferential offers to the local market.
4.9. Indonesia announced that it will limit foreign ownership in insurance companies to 80%. The amended regulations will be applied to established companies with foreign ownership below 80% and to new insurance companies. For existing insurance companies where foreign ownership currently exceeds 80%, adjustments would not be required, except in the context of new capital injections. Since 16 January 2017, every insurer in India must comply with the order of preference for cessions by Indian insurers prescribed by Regulation 28(9) of the Branch Office Regulations. The order of preference contained in the regulation sets out the hierarchy between the various entities with which an Indian insurer can place its reinsurance business. The regulations specify that an Indian insurer first has to approach India's official reinsurer GIC Re before reaching out to the branch operations of foreign reinsurers. After exhausting these two channels, insurers are allowed to approach reinsurers located in Special Economic Zones (SEZs), Indian primary insurers, and, lastly, reinsurers located outside the country.
4.10. With respect to banking and other financial services, China eased approval requirements for foreign-owned banks to supply some investment banking services in the country and to invest in domestic banking institutions. Approval from the China Banking Regulation Commission (CBRC) is no longer required for foreign-invested banks (which include foreign-invested legal entity banks and onshore branches of foreign banks) to provide the following services: underwriting of treasury bonds, custodian services, and financial advisory and consultancy services (beyond that which is only related to traditional banking). Instead, foreign-invested banks are now only required to report to CBRC within five days upon commencement of the relevant business, subject to the administrative approval of other regulatory authorities where applicable. For its part, Indonesia imposes since 15 November 2016 a 20% limit on foreign ownership of enterprises that supply electronic payment processing services. The limit applies to (1) new enterprises in the electronic payment services sector, (2) existing enterprises that expand into this sector, and (3) enterprises already active in the sector that experience a change of ownership.

64
Box 4.1 SMEs and the cost of services trade restrictions Smaller and less experienced exporters face a heavier cost burden in more restrictive regulatory environments. Fixed trade costs are difficult to absorb for firms that export modest amounts, as such costs cannot be spread over a large volume of foreign sales. Yet more and more often, small and young firms seek growth opportunities abroad in response to lower domestic demand and rising scale economies in the digital world.
A common way of quantifying the impact of trade policies is to convert indicators such as the OECD’s Services Trade Restrictiveness Index (STRI) into ad valorem trade cost equivalents. For cross-border exports, an average level of services trade-restrictiveness represents larger trade costs for smaller firms - - up to an additional 14% relative to large firms with turnovers of EUR 400 million and over (Figure 1a). Establishing an affiliate abroad involves an even wider range of sunk and fixed costs. For instance, for a medium-sized firm of EUR 5 million in turnover selling specialised services through foreign affiliates, an average level of services trade-restrictiveness is estimated to be equivalent to an additional 19% tariff compared to large firms (Figure 1b).
Opening up services markets would primarily benefit SMEs, which are responsible for the greater part of new job creation. Reducing the costs of market entry would therefore help improve the inclusiveness of services trade by allowing more SMEs to take up global opportunities.
Figure 1. Additional trade cost of regulatory restrictions for SMEs
Estimated additional tariff equivalent of an STRI of 0.2 compared to large firms of EUR 400 million or more
Notes: The numbers indicate the ad valorem tariff equivalent of an STRI score of 0.2 for small and medium-sized enterprises on top of what is paid by firms of EUR 400 million and more in turnover. Specialised services correspond to an import demand elasticity of -1.5, and standardised services to an import demand elasticity of -5.
Source: OECD; see OECD (2017), Services Trade Policies and the Global Economy, OECD Publishing, Paris. http://dx.doi.org/10.1787/9789264275232-en and Rouzet, D., S. Benz and F. Spinelli (2017), “Trading firms and trading costs in services”, OECD Trade Policy Papers, forthcoming.

65
5 POLICY DEVELOPMENTS IN TRADE AND INTELLECTUAL PROPERTY
Amendment to the TRIPS Agreement
5.1. The period under review saw some important developments in the area of TRIPS.
5.2. The Amendment to the TRIPS Agreement entered into force on 23 January 2017, adding Article 31bis, as well as an Annex and an Appendix to the text of the Agreement. This is a key milestone, marking the first amendment to a multilateral trade agreement, since the creation of the WTO in 1995. The Amendment follows the 2005 Decision to amend the TRIPS Agreement in order to address public health needs of developing and least-developed country Members by providing an additional legal pathway for the export of low-cost generic medicines under a compulsory licence tailored specifically for export.
5.3. The period under review saw some important developments in the area of TRIPS. The Amendment to the TRIPS Agreement entered into force on 23 January 2017, adding Article 31bis, as well as an Annex and an Appendix to the text of the Agreement. This is a key milestone, marking the first amendment to a multilateral trade agreement, since the creation of the WTO in 1995. The Amendment follows the 2005 Decision53 to amend the TRIPS Agreement in order to address public health needs of developing and least-developed country Members by providing an additional legal pathway for the export of low-cost generic medicines under a compulsory licence tailored specifically for export.
5.4. The amended TRIPS Agreement applies to all WTO Members who have currently accepted the Amendment.54 Members who are yet to accept the Amendment have until 31 December 2017 to do so; in the meantime the Decision of 200355 continues to apply.
5.5. During the review period, the linkage between intellectual property (IP) and trade continued to consolidate, as evidenced by the implementation and further development of national policies aimed at streamlining IP into the economy (see an example in Box 5.1). Technological innovation, new business models and the need to enforce intellectual property rights in the e-commerce ecosystem are consolidating the relation of IP with trade and economic development.
Box 5.1 Policy Initiatives – an example
South Africa's IP National Policy – Recent Developments1 South Africa is in the process of developing a National IP Policy with the objective of ensuring a coordinated and balanced approach to provide effective protection of intellectual property rights and, at the same time, respond to the country’s socio-economic dynamics and developmental objectives. _______________ 1 Submission by South Africa to the WTO trade monitoring report.
Source: WTO Secretariat.
5.6. The network of bilateral and regional trade agreements that contain specific IP provisions continues to expand. As of May 2017, the WTO RTA Database contains 151 RTAs that incorporate IP-related provisions56, including for example, on: enforcement measures applied at the border or covering the online environment; examination and administration of industrial property rights; the scope of rights accorded to IP holders; and the substantive standards defining the eligibility for protection of certain forms of IP subject matter. Substantive provisions in RTAs continue to evolve, as some recent agreements also cover e-commerce, exhaustion of IP rights and provide for competition policy measures that may have implications for the IP system.
TRIPS Council
5.7. Health-related issues took prominence in the meetings of the TRIPS Council meetings in November 2016 and in January and March 2017. The January 2017 meeting was dedicated to the
53 WT/L/641 54 See https://www.wto.org/english/tratop_e/trips_e/amendment_e.htm. 55 WT/L/540 and its Corr.1. 56 This total includes CETA, as it is already in the WTO RTA DB list of early announcements.
66
entry into force of the Amendment of the TRIPS Agreement. Members welcomed the entry into force and encouraged those Members that had not yet accepted the Amendment to do so, as soon as possible.
5.8. At the November 2016 and March 2017 meetings, Members exchanged views on the United Nations High Level Panel Report on Access to Medicines.57 Some Members referenced the recommendations in this Report, including making full use of TRIPS flexibilities, while others highlighted the need for a coherent and holistic approach recognizing the role of intellectual property rights in the development of new medicines. Additionally, Members acknowledged the need to focus work on how to effectively implement the Amendment to the TRIPS Agreement.
5.9. Debate continued on the possibility of non-violation and situation complaints under the TRIPS Agreement, as per the directions of 10th Ministerial Conference58 and Article 63.3 of the Agreement itself. Members expressed their long-standing positions and also discussed the need to engage in factual analysis and work towards a permanent solution.
5.10. Discussions on the Work Programme on Electronic Commerce continued, at the request of Canada59; as well as Brazil and other co-sponsors.60 Members highlighted the importance of IP in ecommerce and its benefits for innovative technologies, ideas and business models, including its role in trade and development. Some Members expressed support for focused e-commerce discussions on the protection of copyrights and related rights, trademarks and access to technology.
5.11. The TRIPS Council has always given importance to the work on transparency. During the review period, four G20 Members61 notified legislative measures under Article 63.2. Some of these measures were briefly introduced during the meetings and provided insights into recent legislative changes in the areas, for instance, of: copyrights and related rights; trademarks; geographical indications; protection of specific agricultural, forestry and fishery products; plant variety protection; and accession to WIPO Treaties.
5.12. As part of the review of national implementing legislation, the European Union and the United States presented their respective trade secret legislation, highlighting the vital role of trade secrets to foster innovation and to protect the exchange of knowledge between different economic actors.
5.13. Members continued to share their experiences on the relation between intellectual property and innovation. At the November 2016 meeting, Members engaged in a constructive discussion on regional innovation models, noting the importance of better understanding the economic links between the IP regime and innovation; providing legal certainty for businesses and investors; cross-border collaboration in R&D; fostering academic-public-private partnerships; and the role of open trade and investment regimes in support of innovation and economic growth. In March 2017, Members focused their dialogue on their national and regional experiences to strengthen collaboration between micro, small and medium enterprises (MSMEs) and other companies, universities and government entities. This collaboration aimed to support inclusive innovation and foster participation of MSMEs in trade. Delegations converged on the need for transparent and predictable rules on intellectual property to foster partnerships between small businesses and other parties; recognizing IP as a key factor in collaborative innovation and cross-sectoral partnerships. Some Members highlighted the priority given to MSMEs in their national IP policies.
TRIPS-related Discussions in Trade Policy Reviews
5.14. During the review period, the Trade Policy Reviews of three G20 economies62 included detailed discussions on a wide range of intellectual property issues with bearing on trade policy. In particular, the discussion touched upon copyrights and related rights; copyright protection in the digital environment; statutory licences; collective management of copyright trademarks;
57 See at http://www.unsgaccessmeds.org/final-report/ 58 WT/MIN/(15)/41 and WT/L/976. 59 IP/C/W/613/Add.1. 60 JOB/IP/19 to JOB/IP/22. 61 Canada, China, Japan and Mexico. 62 United States of America, Japan and Mexico.

67
geographical marks; opposition procedures; implementation of standard essential patents; patent quality; compulsory licences; trade secrets; protection of plant varieties; anticompetitive practices; enforcement measures online and at the border; ex officio border procedures; adjudication procedures; judicial review of administrative decisions; national IP strategies; and ratification of WIPO Treaties.

68
ANNEX 1
MEASURES FACILITATING TRADE1
(MID-OCTOBER 2016 to MID-MAY 2017)
Confirmed information2
Measure Source/Date Status
Argentina Temporary reduction of import tariffs (to 2%) on disperse dyes and preparations based thereon (NCM 3204.11.00), under an import quota of 1,000 tonnes; and on paper and paperboard of the kind used for writing, printing or other graphic purposes, of which more than 10% by weight of the total fibre content consists of fibres obtained by a mechanical or chemi-mechanical process (NCM 4810.19.90), under an import quota of 2,500 tonnes
Permanent Delegation of Argentina to the WTO (21 April 2017)
Effective 7 December 2016 for 12 months
Further extension of the deadlines (from 1,825 calendar days to 3,650 calendar days) for exporters to register foreign currency originating from export operations (all NCM Chapters) with the financial system
Permanent Delegation of Argentina to the WTO (30 May 2017); Resolución Secretaría de Comercio No. 47-E/2017 Ministerio de Producción (19 January 2017); and WTO document WT/TPR/OV/19, 21 November 2016
Effective 19 January 2017
Elimination of import tariffs on 72 informatics and telecommunication tariff lines (NCM 8443; 8471; 8473; 8517; 8523; 8531; 8541; 8542; 8543; 8471)
Permanent Delegation of Argentina to the WTO (30 May 2017) and Decreto No. 117/2017 Comercio Exterior (17 February 2017)
Elimination of export duties on hydrocarbons Permanent Delegation of Argentina to the WTO (30 May 2017)
Effective 7 January 2017
Termination on 4 May 2017 of "reference values" for exports of natural honey (NCM 0409.00.00), to certain specified destinations (effective 24 November 2015)
Permanent Delegation of Argentina to the WTO (21 April 2017) and Administración Federal de Ingresos Públicos - Resolución General No. 4038-E (2 May 2017)
Effective 4 May 2017
Australia Reduction of import tariffs under the Expansion of the Information Technology Agreement (ITA) (136 tariff lines at 6-digit level, in HS Chapters 32; 35; 37; 39; 49; 59; 84; 85; 88; 90; 95)
WTO document G/MA/W/117/Add.1-24, 26 January 2016
Effective 1 January 2017, with all covered tariffs to be phased out by no later than 1 July 2019
1 The inclusion of any measure in this Annex implies no judgement by the WTO Secretariat on whether
or not such measure, or its intent, is protectionist in nature. Moreover, nothing in the Annex implies any judgement, either direct or indirect, on the consistency of any measure referred to with the provisions of any WTO agreement.
2 This Section includes information which has either been provided by the Member concerned or has been confirmed at the request of the Secretariat.
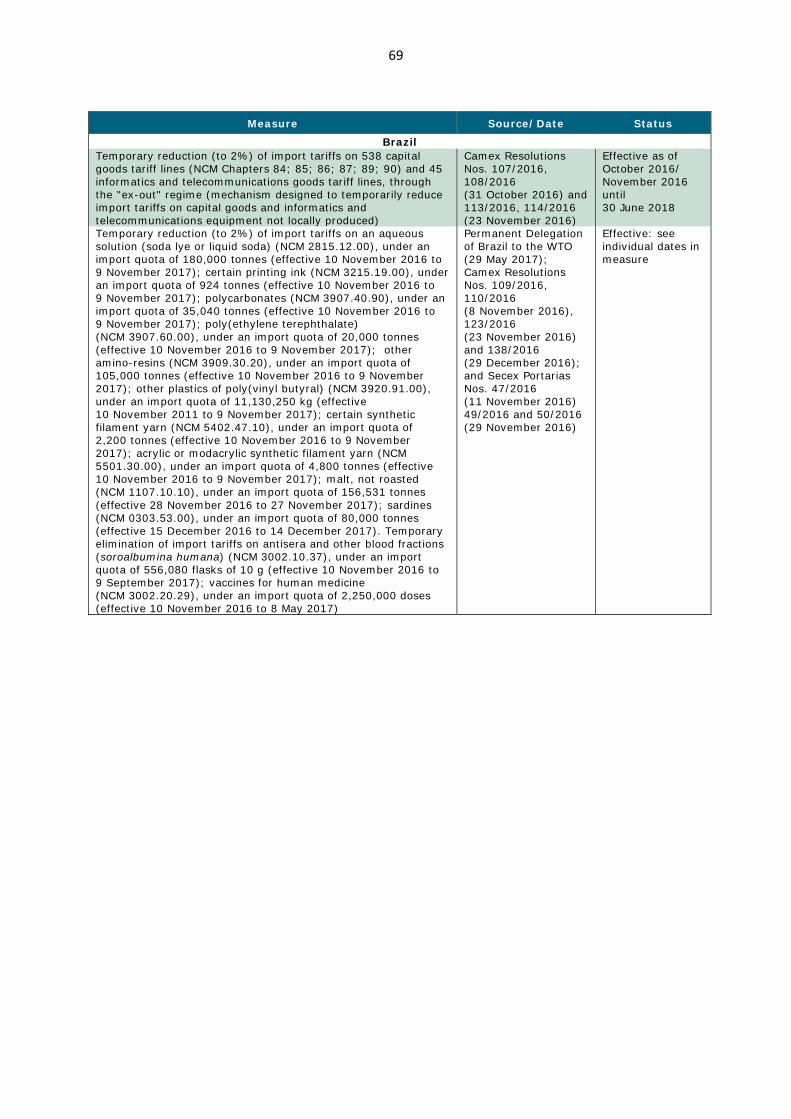
69
Measure Source/Date Status Brazil
Temporary reduction (to 2%) of import tariffs on 538 capital goods tariff lines (NCM Chapters 84; 85; 86; 87; 89; 90) and 45 informatics and telecommunications goods tariff lines, through the "ex-out" regime (mechanism designed to temporarily reduce import tariffs on capital goods and informatics and telecommunications equipment not locally produced)
Camex Resolutions Nos. 107/2016, 108/2016 (31 October 2016) and 113/2016, 114/2016 (23 November 2016)
Effective as of October 2016/ November 2016 until 30 June 2018
Temporary reduction (to 2%) of import tariffs on an aqueous solution (soda lye or liquid soda) (NCM 2815.12.00), under an import quota of 180,000 tonnes (effective 10 November 2016 to 9 November 2017); certain printing ink (NCM 3215.19.00), under an import quota of 924 tonnes (effective 10 November 2016 to 9 November 2017); polycarbonates (NCM 3907.40.90), under an import quota of 35,040 tonnes (effective 10 November 2016 to 9 November 2017); poly(ethylene terephthalate) (NCM 3907.60.00), under an import quota of 20,000 tonnes (effective 10 November 2016 to 9 November 2017); other amino-resins (NCM 3909.30.20), under an import quota of 105,000 tonnes (effective 10 November 2016 to 9 November 2017); other plastics of poly(vinyl butyral) (NCM 3920.91.00), under an import quota of 11,130,250 kg (effective 10 November 2011 to 9 November 2017); certain synthetic filament yarn (NCM 5402.47.10), under an import quota of 2,200 tonnes (effective 10 November 2016 to 9 November 2017); acrylic or modacrylic synthetic filament yarn (NCM 5501.30.00), under an import quota of 4,800 tonnes (effective 10 November 2016 to 9 November 2017); malt, not roasted (NCM 1107.10.10), under an import quota of 156,531 tonnes (effective 28 November 2016 to 27 November 2017); sardines (NCM 0303.53.00), under an import quota of 80,000 tonnes (effective 15 December 2016 to 14 December 2017). Temporary elimination of import tariffs on antisera and other blood fractions (soroalbumina humana) (NCM 3002.10.37), under an import quota of 556,080 flasks of 10 g (effective 10 November 2016 to 9 September 2017); vaccines for human medicine (NCM 3002.20.29), under an import quota of 2,250,000 doses (effective 10 November 2016 to 8 May 2017)
Permanent Delegation of Brazil to the WTO (29 May 2017); Camex Resolutions Nos. 109/2016, 110/2016 (8 November 2016), 123/2016 (23 November 2016) and 138/2016 (29 December 2016); and Secex Portarias Nos. 47/2016 (11 November 2016) 49/2016 and 50/2016 (29 November 2016)
Effective: see individual dates in measure

70
Measure Source/Date Status Temporary reduction (to 2%) of import tariffs on isocyanates (NCM 2929.10.10), under an import quota of 23,000 tonnes (effective 11 January 2017 to 10 January 2018); hop cones, ground, powdered or in the form of pellets, lupulin (NCM 1210.20.10), under an import quota of 1,800 tonnes (effective 23 January 2017 to 22 January 2018); methylamine, di or trimethylamine and their salts (NCM 2921.11.21), under an import quota of 12,000 tonnes (effective 23 January 2017 to 22 January 2018); certain isocyanates (NCM 2929.10.30), under an import quota of 1,000 tonnes (effective 23 January 2017 to 22 January 2018); disodium sulphate (NCM 2833.11.10), under an import quota of 910,000 tonnes (effective 23 January 2017 to 22 January 2018); black printing ink (NCM 3215.11.00), under an import quota of 396 tonnes (effective 23 January 2017 to 22 January 2018); polyamide-6 or 6,6 (NCM 3908.10.24), under an import quota of 5,400 tonnes (effective 23 January 2017 to 22 January 2018); other yarn, single, of viscose rayon, untwisted or with a twist not exceeding 120 turns per metre (NCM 5403.31.00), under an import quota of 625 tonnes (effective 22 February 2017 to 21 August 2017); unwrought nickel, not alloyed (catodos) (NCM 7502.10.10), under an import quota of 3,600 tonnes (effective 23 January 2017 to 22 July 2017); rectangular (including square) plates, sheets and strip of a thickness exceeding 0.2 mm of aluminium alloys (NCM 7606.12.90), under an import quota of 600 tonnes (effective 23 January 2017 to 22 July 2017); aluminium foil, not backed, rolled but not further worked (NCM 7607.11.90), under an import quota of 2,137 tonnes (effective 1 February 2017 to 31 January 2018); certain rectangular plates, sheets and strip of a thickness exceeding 0.2 mm of aluminium alloys (NCM 7606.12.90), under an import quota of 2,937 tonnes (effective 1 February 2017 to 31 January 2018); coffee, not roasted and not decaffeinated (variedade Conilon) (NCM 0901.11.10), under an import quota of 60,000 tonnes. Temporary elimination of import tariffs on vaccines for human medicine (Hepatite A) (NCM 3002.20.29), under an import quota of 2,250,000 doses (effective 10 May 2017 to 9 November 2017); vaccines for human medicine (Papilomavirus Humano) (NCM 3002.20.29), under an import quota of 3,000,000 doses (effective 22 February 2017 to 21 August 2017); vaccines for human medicine (tetano) (NCM 3002.20.27), under an import quota of 2,500,000 doses (effective 22 February 2017 to 21 August 2017); cotton, not carded or combed (NCM 5201.00.20), under an import quota of 75,000 tonnes (effective 21 February 2016 to 31 July 2017)
Permanent Delegation of Brazil to the WTO (29 May 2017); Camex Resolutions Nos. 123/2016 (23 November 2016), 1/2017 (19 January 2017), 14/2017 and 15/2017 (17 February 2017); and Secex Portarias Nos. 2/2017 (10 January 2017) 5/2017, 6/2017, 7/2017, 8/2017 (24 January 2017) and 11/2017 (22 February 2017)
Effective: see individual dates in measure
Temporary reduction (to 2%) of import tariffs on 1,022 capital goods tariff lines (NCM Chapters 84; 85; 86; 90; 94) and 66 informatics and telecommunications goods tariff lines, and temporary elimination of import tariffs on 3 capital goods tariff lines, through the "ex-out" regime
Permanent Delegation of Brazil to the WTO (29 May 2017), Camex Resolutions Nos. 133/2016, 134/2016 (22 December 2016), 18/2017, 19/2017 (17 February 2017) 27/2017, 28/2017 (29 March 2017) and 37/2017, 38/2017 (5 May 2017)
Effective as of December 2016/ February 2017/ March 2017 until 31 December 2018
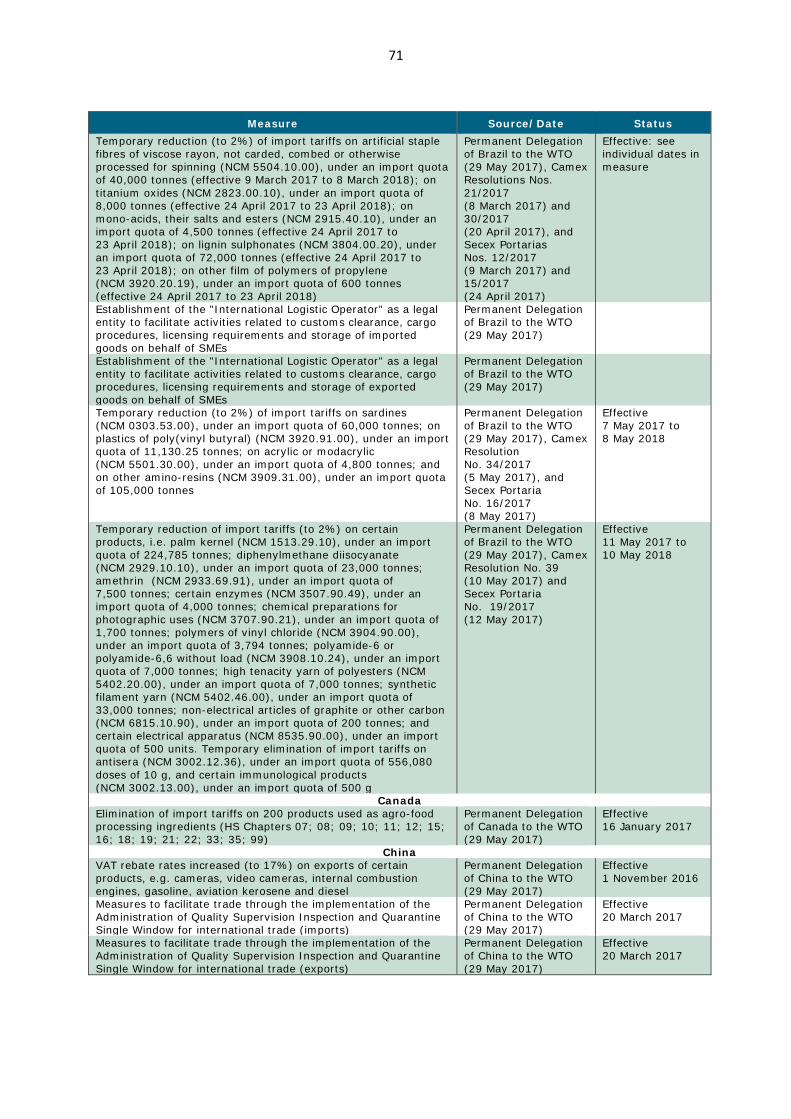
71
Measure Source/Date Status Temporary reduction (to 2%) of import tariffs on artificial staple fibres of viscose rayon, not carded, combed or otherwise processed for spinning (NCM 5504.10.00), under an import quota of 40,000 tonnes (effective 9 March 2017 to 8 March 2018); on titanium oxides (NCM 2823.00.10), under an import quota of 8,000 tonnes (effective 24 April 2017 to 23 April 2018); on mono-acids, their salts and esters (NCM 2915.40.10), under an import quota of 4,500 tonnes (effective 24 April 2017 to 23 April 2018); on lignin sulphonates (NCM 3804.00.20), under an import quota of 72,000 tonnes (effective 24 April 2017 to 23 April 2018); on other film of polymers of propylene (NCM 3920.20.19), under an import quota of 600 tonnes (effective 24 April 2017 to 23 April 2018)
Permanent Delegation of Brazil to the WTO (29 May 2017), Camex Resolutions Nos. 21/2017 (8 March 2017) and 30/2017 (20 April 2017), and Secex Portarias Nos. 12/2017 (9 March 2017) and 15/2017 (24 April 2017)
Effective: see individual dates in measure
Establishment of the "International Logistic Operator" as a legal entity to facilitate activities related to customs clearance, cargo procedures, licensing requirements and storage of imported goods on behalf of SMEs
Permanent Delegation of Brazil to the WTO (29 May 2017)
Establishment of the "International Logistic Operator" as a legal entity to facilitate activities related to customs clearance, cargo procedures, licensing requirements and storage of exported goods on behalf of SMEs
Permanent Delegation of Brazil to the WTO (29 May 2017)
Temporary reduction (to 2%) of import tariffs on sardines (NCM 0303.53.00), under an import quota of 60,000 tonnes; on plastics of poly(vinyl butyral) (NCM 3920.91.00), under an import quota of 11,130.25 tonnes; on acrylic or modacrylic (NCM 5501.30.00), under an import quota of 4,800 tonnes; and on other amino-resins (NCM 3909.31.00), under an import quota of 105,000 tonnes
Permanent Delegation of Brazil to the WTO (29 May 2017), Camex Resolution No. 34/2017 (5 May 2017), and Secex Portaria No. 16/2017 (8 May 2017)
Effective 7 May 2017 to 8 May 2018
Temporary reduction of import tariffs (to 2%) on certain products, i.e. palm kernel (NCM 1513.29.10), under an import quota of 224,785 tonnes; diphenylmethane diisocyanate (NCM 2929.10.10), under an import quota of 23,000 tonnes; amethrin (NCM 2933.69.91), under an import quota of 7,500 tonnes; certain enzymes (NCM 3507.90.49), under an import quota of 4,000 tonnes; chemical preparations for photographic uses (NCM 3707.90.21), under an import quota of 1,700 tonnes; polymers of vinyl chloride (NCM 3904.90.00), under an import quota of 3,794 tonnes; polyamide-6 or polyamide-6,6 without load (NCM 3908.10.24), under an import quota of 7,000 tonnes; high tenacity yarn of polyesters (NCM 5402.20.00), under an import quota of 7,000 tonnes; synthetic filament yarn (NCM 5402.46.00), under an import quota of 33,000 tonnes; non-electrical articles of graphite or other carbon (NCM 6815.10.90), under an import quota of 200 tonnes; and certain electrical apparatus (NCM 8535.90.00), under an import quota of 500 units. Temporary elimination of import tariffs on antisera (NCM 3002.12.36), under an import quota of 556,080 doses of 10 g, and certain immunological products (NCM 3002.13.00), under an import quota of 500 g
Permanent Delegation of Brazil to the WTO (29 May 2017), Camex Resolution No. 39 (10 May 2017) and Secex Portaria No. 19/2017 (12 May 2017)
Effective 11 May 2017 to 10 May 2018
Canada Elimination of import tariffs on 200 products used as agro-food processing ingredients (HS Chapters 07; 08; 09; 10; 11; 12; 15; 16; 18; 19; 21; 22; 33; 35; 99)
Permanent Delegation of Canada to the WTO (29 May 2017)
Effective 16 January 2017
China VAT rebate rates increased (to 17%) on exports of certain products, e.g. cameras, video cameras, internal combustion engines, gasoline, aviation kerosene and diesel
Permanent Delegation of China to the WTO (29 May 2017)
Effective 1 November 2016
Measures to facilitate trade through the implementation of the Administration of Quality Supervision Inspection and Quarantine Single Window for international trade (imports)
Permanent Delegation of China to the WTO (29 May 2017)
Effective 20 March 2017
Measures to facilitate trade through the implementation of the Administration of Quality Supervision Inspection and Quarantine Single Window for international trade (exports)
Permanent Delegation of China to the WTO (29 May 2017)
Effective 20 March 2017

72
Measure Source/Date Status India
Elimination of import tariffs (from 10%) on wheat (HS 1001) Permanent Delegation of India to the WTO (30 May 2017) and Notification Customs, Ministry of Finance - Department of Revenue No. 60/2016 (8 December 2016)
Effective 8 December 2016
Reduction of import tariffs (from 7.5%-10% to 5%) on all items of machinery, including instruments, apparatus and appliances, transmission equipment and auxiliary equipment (including those required for testing and quality control) and components required for: (i) initial setting-up of fuel cell based system for generation of power or for demonstration purposes; or (ii) balance of systems operating using bio-gas or bio-methane or hydrogen by-product
Permanent Delegation of India to the WTO (30 May 2017) and Notification Customs, Ministry of Finance - Department of Revenue No. 5/2017 (2 February 2017)
Effective 2 February 2017
Reduction of import tariffs (from 5% to 2.5%) on liquified natural gas (LNG) (HS 2711.11.00); (from 7.5% to 2.5%) on wattle extract and myrobalan fruit extract (HS 3201.20.00; 3201.90.20); (from 15% to 5%) on catalysts and resins for use in the manufacture of cast components of wind operated electricity generators (HS 3815.90.00; 3909.40.90). Elimination of import tariffs on toughened glass with low iron content and transmissivity of minimum 91%, for use in solar thermal collectors or heaters (HS Chapter 70) (from 2.5%) on nickel and articles thereof (HS Chapter 75); and (from 10%) on o-xylene (HS 2902.41.00)
Permanent Delegation of India to the WTO (30 May 2017) and Notification Customs, Ministry of Finance - Department of Revenue No. 6/2017 (2 February 2017)
Temporary reduction of import tariffs (from 30% to 10%) on sunflower seeds (HS 1206.00.90) for the purpose of extraction and refining of oil
Permanent Delegation of India to the WTO (30 May 2017) and Notification No. 9/2017-Customs (23 March 2017)
Effective 1 April 2017 to 30 September 2017
Temporary elimination of import tariffs on raw sugar (HS 1701) under an import quota of 5 lakh metric tonnes. The importer shall convert the raw sugar into white/refined sugar within a period not exceeding two months from the date of filing of bill of entry or the date of entry inwards, whichever is later
Permanent Delegation of India to the WTO (30 May 2017), Notifications Nos. 12/2017-Customs (5 April 2017) and 13/2017-Customs (13 April 2017)
Effective 5 April 2017 to 1 July 2017
Elimination of the minimum export price "MEP" on the export of potatoes (US$450/metric tonne FOB) (HS 0701.90.00) (originally implemented on 26 June 2014)
Permanent Delegation of India to the WTO (30 May 2017)
Effective 27 December 2016
Elimination of the temporary minimum import price "MIP" (c.i.f. basis/metric tonne) for 66 iron and steel tariff lines (HS Chapter 72) (originally implemented on 1 February 2016, for 6 months and re-implemented in December 2016 for another 2 months)
Permanent Delegation of India to the WTO (30 May 2017)
Effective 5 February 2017
Elimination of import tariffs (from 7.5%) on palm stearin, whether crude, RBD or other, having free fatty acids (FFA) of 20% or more for the manufacture of oleochemicals (HS 1511)
Permanent Delegation of India to the WTO (30 May 2017) and Notification Customs, Ministry of Finance - Department of Revenue No. 18/2017 (9 May 2017)
Effective 9 May 2017
Reduction of import tariffs on natural rubber (HS 4001) Permanent Delegation of India to the WTO (30 May 2017)
Japan Elimination of import tariffs on p-nitrochlorobenzene, m-aramid, synthetic filament tow, certain toys and sanitary articles (HS 2904.99; 3908.90; 5501.10; 9503.00; 9619.00)
Permanent Delegation of Japan to the WTO (30 May 2017)
Effective 1 April 2017

73
Measure Source/Date Status Korea, Rep. of
Reduction of import tariffs under the Expansion of the Information Technology Agreement (ITA) (522 tariff lines at 10-digit level in HS Chapters 32; 35; 37; 39; 59; 63; 84; 85; 88; 90)
Permanent Delegation of the Republic of Korea to the WTO (30 May 2017) and WTO document G/MA/W/117/Add.13, 28 January 2016
Effective 1 December 2016, with all covered tariffs to be phased out by no later than 1 July 2023
Temporary reduction or elimination of import tariffs on 132 items, e.g. whey, modified whey (for feeding) (HS 0404.10) (under an import quota of 25,000 metric tonnes); manioc (cassava) (pellets for feeding) (HS 0714.10) (all imported); oil-cake and other solid residues, whether or not ground or in the form of pellets, resulting from the extraction of soyabean oil (for feeding) (HS 2304.00) (under an import quota of 2,451,000 metric tonnes); cotton seeds (for feeding) (HS 1207.29); artificial graphite (for manufacturing secondary batteries) (HS 3801.10); machines and apparatus for the manufacture of flat panel displays (for manufacturing organic light emitting diodes (OLED)) (HS8486.30); microscopes other than optical microscopes; diffraction apparatus (focused ion beam system for OLED manufacturing) (HS9012.10)
Permanent Delegation of the Republic of Korea to the WTO (20 April 2017)
Effective 1 January 2017 to 31 December 2017 for 122 items. Effective 4 January 2017 to 30 June for 8 items (HS 0407.21; 0407.90; 0408.11; 0408.19; 0408.91; 0408.99; 3502.11; 3502.19). Effective 1 January 2017 to 31 March 2017 for 2 items
Mexico Elimination of import tariffs on potatoes, tomatoes, onions and shallots, fresh and dried chili and apples, (HS 0701.90.99; 0702.00.99; 0703.10.01; 0709.60.99; 0808.10.01; 0904.21.01; 0904.21.99; 0904.22.01; 0904.22.99), under certain import quotas
Permanent Delegation of Mexico to the WTO (29 May 2017) and Diario Oficial de la Federación (Official Journal), 20 January 2017
Effective 21 January 2017
Temporary elimination of import tariffs on beans (frijol) (HS 0713.33.02; 0713.33.03; 0713.33.99), under an import quota of 100,000 metric tonnes
Permanent Delegation of Mexico to the WTO (29 May 2017) and Diario Oficial de la Federación (Official Journal), 14 April 2017
Effective 16 April 2017 to 30 November 2017
Russian Federation (for Eurasian Economic Union) Temporary elimination of import tariffs on oranges, seed of anise, badian, coriander, cumin or caraway, juniper berries, precious metal ores and concentrates, silver, gold and platinum (effective 2 January 2017 to 31 December 2017); on waste and scrap of precious metals or of metals clad with precious metals, artificial staple fibres of viscose rayon (effective 2 January 2017 to 31 December 2019); on organic surface-active agents (effective 1 March 2017 to 28 February 2019); on apple purée including compotes (effective 2 January 2017 to 31 December 2018); on halides and halide oxides of non-metals, hydrides, nitrides, and other organo-inorganic compounds (effective 22 January 2017 to 31 December 2019); and on polyethylene (effective 1 January 2017 to 31 December 2017). Reduction of import tariffs (to 5%) on paper and paper board (effective 3 March 2017)
Permanent Delegation of the Russian Federation to the WTO (30 May 2017)
Effective: see individual dates in measure
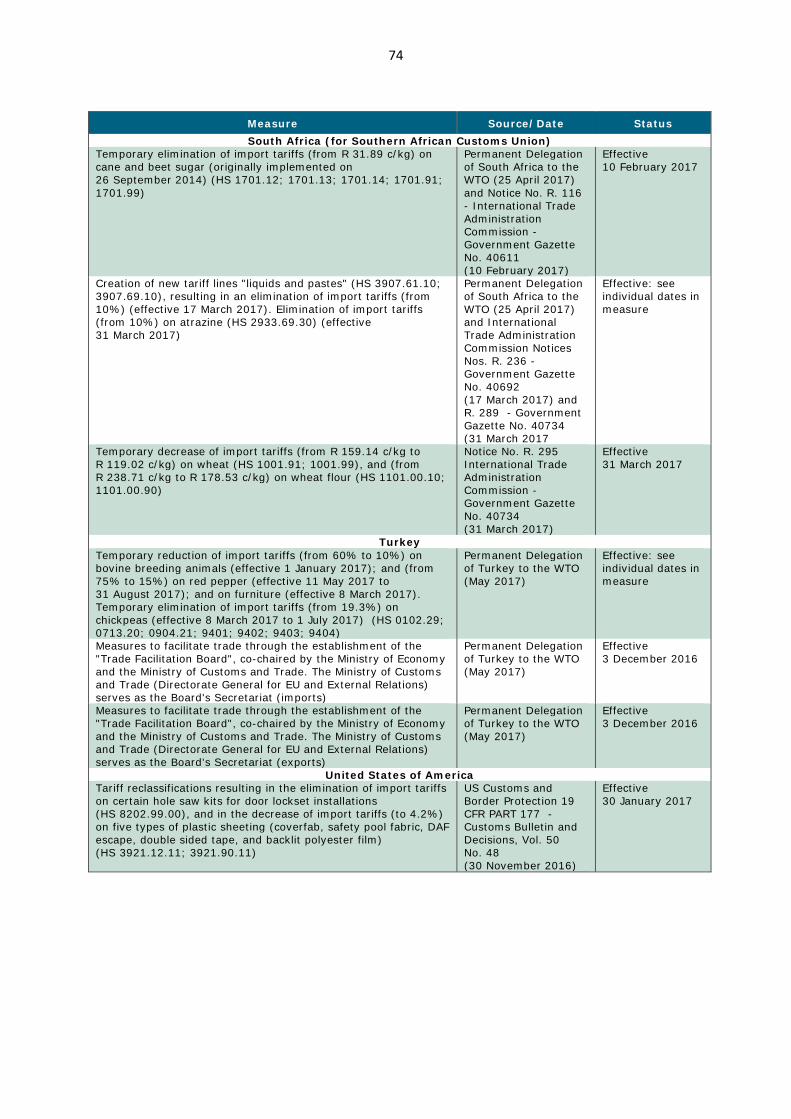
74
Measure Source/Date Status South Africa (for Southern African Customs Union)
Temporary elimination of import tariffs (from R 31.89 c/kg) on cane and beet sugar (originally implemented on 26 September 2014) (HS 1701.12; 1701.13; 1701.14; 1701.91; 1701.99)
Permanent Delegation of South Africa to the WTO (25 April 2017) and Notice No. R. 116 - International Trade Administration Commission - Government Gazette No. 40611 (10 February 2017)
Effective 10 February 2017
Creation of new tariff lines "liquids and pastes" (HS 3907.61.10; 3907.69.10), resulting in an elimination of import tariffs (from 10%) (effective 17 March 2017). Elimination of import tariffs (from 10%) on atrazine (HS 2933.69.30) (effective 31 March 2017)
Permanent Delegation of South Africa to the WTO (25 April 2017) and International Trade Administration Commission Notices Nos. R. 236 -Government Gazette No. 40692 (17 March 2017) and R. 289 - Government Gazette No. 40734 (31 March 2017
Effective: see individual dates in measure
Temporary decrease of import tariffs (from R 159.14 c/kg to R 119.02 c/kg) on wheat (HS 1001.91; 1001.99), and (from R 238.71 c/kg to R 178.53 c/kg) on wheat flour (HS 1101.00.10; 1101.00.90)
Notice No. R. 295 International Trade Administration Commission - Government Gazette No. 40734 (31 March 2017)
Effective 31 March 2017
Turkey Temporary reduction of import tariffs (from 60% to 10%) on bovine breeding animals (effective 1 January 2017); and (from 75% to 15%) on red pepper (effective 11 May 2017 to 31 August 2017); and on furniture (effective 8 March 2017). Temporary elimination of import tariffs (from 19.3%) on chickpeas (effective 8 March 2017 to 1 July 2017) (HS 0102.29; 0713.20; 0904.21; 9401; 9402; 9403; 9404)
Permanent Delegation of Turkey to the WTO (May 2017)
Effective: see individual dates in measure
Measures to facilitate trade through the establishment of the "Trade Facilitation Board", co-chaired by the Ministry of Economy and the Ministry of Customs and Trade. The Ministry of Customs and Trade (Directorate General for EU and External Relations) serves as the Board's Secretariat (imports)
Permanent Delegation of Turkey to the WTO (May 2017)
Effective 3 December 2016
Measures to facilitate trade through the establishment of the "Trade Facilitation Board", co-chaired by the Ministry of Economy and the Ministry of Customs and Trade. The Ministry of Customs and Trade (Directorate General for EU and External Relations) serves as the Board's Secretariat (exports)
Permanent Delegation of Turkey to the WTO (May 2017)
Effective 3 December 2016
United States of America Tariff reclassifications resulting in the elimination of import tariffs on certain hole saw kits for door lockset installations (HS 8202.99.00), and in the decrease of import tariffs (to 4.2%) on five types of plastic sheeting (coverfab, safety pool fabric, DAF escape, double sided tape, and backlit polyester film) (HS 3921.12.11; 3921.90.11)
US Customs and Border Protection 19 CFR PART 177 - Customs Bulletin and Decisions, Vol. 50 No. 48 (30 November 2016)
Effective 30 January 2017
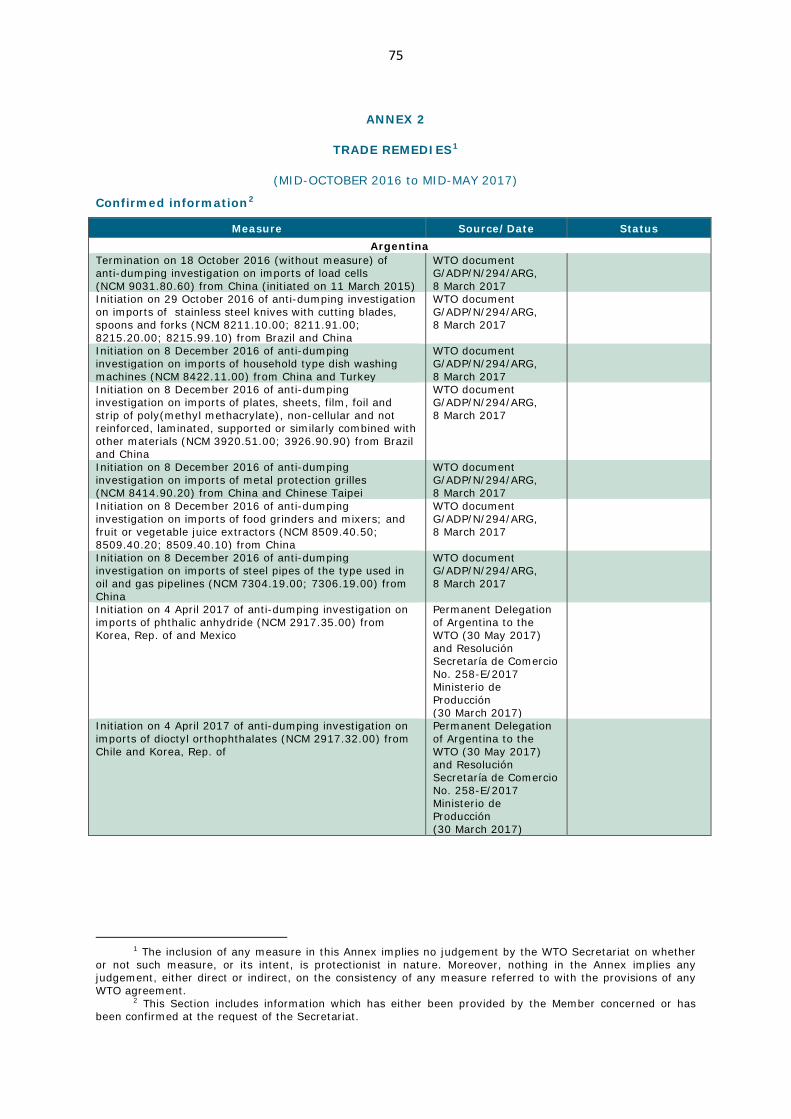
75
ANNEX 2
TRADE REMEDIES1
(MID-OCTOBER 2016 to MID-MAY 2017)
Confirmed information2
Measure Source/Date Status Argentina
Termination on 18 October 2016 (without measure) of anti-dumping investigation on imports of load cells (NCM 9031.80.60) from China (initiated on 11 March 2015)
WTO document G/ADP/N/294/ARG, 8 March 2017
Initiation on 29 October 2016 of anti-dumping investigation on imports of stainless steel knives with cutting blades, spoons and forks (NCM 8211.10.00; 8211.91.00; 8215.20.00; 8215.99.10) from Brazil and China
WTO document G/ADP/N/294/ARG, 8 March 2017
Initiation on 8 December 2016 of anti-dumping investigation on imports of household type dish washing machines (NCM 8422.11.00) from China and Turkey
WTO document G/ADP/N/294/ARG, 8 March 2017
Initiation on 8 December 2016 of anti-dumping investigation on imports of plates, sheets, film, foil and strip of poly(methyl methacrylate), non-cellular and not reinforced, laminated, supported or similarly combined with other materials (NCM 3920.51.00; 3926.90.90) from Brazil and China
WTO document G/ADP/N/294/ARG, 8 March 2017
Initiation on 8 December 2016 of anti-dumping investigation on imports of metal protection grilles (NCM 8414.90.20) from China and Chinese Taipei
WTO document G/ADP/N/294/ARG, 8 March 2017
Initiation on 8 December 2016 of anti-dumping investigation on imports of food grinders and mixers; and fruit or vegetable juice extractors (NCM 8509.40.50; 8509.40.20; 8509.40.10) from China
WTO document G/ADP/N/294/ARG, 8 March 2017
Initiation on 8 December 2016 of anti-dumping investigation on imports of steel pipes of the type used in oil and gas pipelines (NCM 7304.19.00; 7306.19.00) from China
WTO document G/ADP/N/294/ARG, 8 March 2017
Initiation on 4 April 2017 of anti-dumping investigation on imports of phthalic anhydride (NCM 2917.35.00) from Korea, Rep. of and Mexico
Permanent Delegation of Argentina to the WTO (30 May 2017) and Resolución Secretaría de Comercio No. 258-E/2017 Ministerio de Producción (30 March 2017)
Initiation on 4 April 2017 of anti-dumping investigation on imports of dioctyl orthophthalates (NCM 2917.32.00) from Chile and Korea, Rep. of
Permanent Delegation of Argentina to the WTO (30 May 2017) and Resolución Secretaría de Comercio No. 258-E/2017 Ministerio de Producción (30 March 2017)
1 The inclusion of any measure in this Annex implies no judgement by the WTO Secretariat on whether
or not such measure, or its intent, is protectionist in nature. Moreover, nothing in the Annex implies any judgement, either direct or indirect, on the consistency of any measure referred to with the provisions of any WTO agreement.
2 This Section includes information which has either been provided by the Member concerned or has been confirmed at the request of the Secretariat.

76
Measure Source/Date Status Termination on 10 May 2017 of anti-dumping duties on imports of steel spring lock washers (NCM 7318.21.00) from China (investigation initiated on 2 April 2016 and provisional duty imposed on 7 December 2016)
Permanent Delegation of Argentina to the WTO (30 May 2017) and Resolución No. 193-E/2017 Ministerio de Producción (10 May 2017)
Australia Termination on 17 October 2016 (without measure) of anti-dumping investigation on imports of certain crystalline silicon photovoltaic modules or panels (HS 8501.61.00; 8501.62.00; 8501.63.00; 8501.64.00; 8541.40.00) from China (investigation initiated on 14 May 2014. Terminated on 6 October 2015, but investigation resumed on 8 January 2016)
WTO document G/ADP/N/294/AUS, 27 February 2017
Termination on 19 October 2016 (without measure) of countervailing investigation on imports of steel reinforcing bar (HS 7214.20.00; 7228.30.90: 7213.10.00; 7227.90.10; 7227.90.90; 7228.30.10; 7228.60.10) from China (initiated on 23 December 2015)
WTO document G/SCM/N/313/AUS, 1 March 2017
Termination on 19 October 2016 (without measure) of countervailing investigation on imports of rod in coils (HS 7213.91.00; 7227.90.90) from China (initiated on 17 February 2016)
WTO document G/SCM/N/313/AUS, 1 March 2017
Termination on 24 November 2016 (without measure) of anti-dumping investigation on imports of quicklime (HS 2522.10.00) from Malaysia, Thailand and Viet Nam (initiated on 18 April 2016)
WTO document G/ADP/N/294/AUS, 27 February 2017
Initiation on 10 January 2017 of anti-dumping investigation on imports of alloy round steel bars (HS 7228.20.10; 7228.20.90; 7228.30.10; 7228.30.90; 7228.60.10; 7228.60.90) from China
Permanent Delegation of Australia to the WTO (29 May 2017) and Australia Customs Dumping Notice No. 2017/2 (10 January 2017)
Initiation on 23 January 2017 of anti-dumping investigation on imports of cooling tower water treatment controllers (HS 9032.89.80) from the United States
Permanent Delegation of Australia to the WTO (29 May 2017) and Australia Customs Dumping Notices Nos. 2017/5 (23 January 2017) and 2017/54 (18 April 2017)
Provisional duty imposed on 19 April 2017
Termination on 17 February 2017 of anti-dumping investigation on imports of resealable can end closures (RTFs) (HS 8309.90.00) from India (investigation initiated on 18 May 2016 and provisional duty imposed on 5 October 2016)
Permanent Delegation of Australia to the WTO (29 May 2017) and Australia Customs Dumping Notice No. 2017/16 (17 February 2017)
Termination on 23 February 2017 (without measure) of anti-dumping investigation on imports of steel shelving units (HS 9403.10.00; 9403.20.00) from China (investigation initiated on 4 July 2016)
Permanent Delegation of Australia to the WTO (29 May 2017) and Australia Customs Dumping Notice No. 2017/19 (23 February 2017)
Termination on 23 February 2017 (without measure) of countervailing investigation on imports of steel shelving units (HS 9403.10.00; 9403.20.00) from China (investigation initiated on 4 July 2016)
Permanent Delegation of Australia to the WTO (29 May 2017) and Australia Customs Dumping Notice No. 2017/19 (23 February 2017)

77
Measure Source/Date Status Anti-dumping investigation resumed on 15 March 2017 on imports of hollow structural sections "HSS" (HS 7306.30.00; 7306.50.00; 7306.61.00; 7306.69.00; 7306.90.00) from India and the United Arab Emirates (investigation initiated on 22 December 2015 and provisional duty imposed on 22 February 2016. Terminated on 25 July 2016)
Permanent Delegation of Australia to the WTO (29 May 2017), Australia Customs Dumping Notices Nos. 2016/154, 2017/23 (22 February 2017) and 2017/25 (15 March 2017)
Termination on 17 March 2017 (without measure) of countervailing investigation on imports of A4 copy paper (HS 4802.56.10) from Indonesia (initiated on 12 April 2016)
Permanent Delegation of Australia to the WTO (29 May 2017) and Australia Customs Dumping Notice No. 2017/34 (17 March 2017)
Initiation on 26 April 2017 of anti-dumping investigation on imports of certain wire rope (HS 7312.10.00) from South Africa
Permanent Delegation of Australia to the WTO (29 May 2017) and Australia Customs Dumping Notice No. 2017/58 (26 April 2017)
Brazil Termination on 18 November 2016 (without measure) of anti-dumping investigation on imports of polyurethane (PU) synthetic leather (NCM 3921.13.90; 3921.90.19; 3921.90.90; 5603.14.10; 5603.14.20; 5603.14.30; 5603.14.40; 5603.14.90; 5603.94.10; 5603.94.20; 5603.94.30; 5603.94.90; 5903.20.00) from China (initiated on 21 July 2016)
WTO document G/ADP/N/294/BRA, 24 February 2017
Initiation on 21 November 2016 of countervailing investigation on imports of hot-rolled steel (NCM 7208.10.00; 7208.25.00; 7208.26.10; 7208.26.90; 7208.27.10; 7208.27.90; 7208.36.10; 7208.36.90; 7208.37.00; 7208.38.10; 7208.38.90; 7208.39.10; 7208.39.90; 7208.40.00; 7208.53.00; 7208.54.00; 7208.90.00; 7225.30.00; 7225.40.90) from China
WTO document G/SCM/N/313/BRA, 28 February 2017
Termination on 9 February 2017 (without measure) of anti-dumping investigation on imports of analogical or digital panoramic x-ray systems for dental use (NCM 9022.12.00; 9022.13.11) from Germany (initiated on 22 October 2015)
Permanent Delegation of Brazil to the WTO (21 April 2017) and Secex Circular No. 9/2017 (8 February 2017)
Temporary suspension on 20 November 2016 of anti-dumping duties on imports of cold polymerized emulsion styrene-butadiene rubber (E-SBR) (NCM 4002.19.11; 4002.19.19) from the European Union (investigation initiated on 27 May 2014 and duty imposed on 20 November 2015)
Permanent Delegation of Brazil to the WTO (29 May 2017) and Camex Resolution No. 96/2016 (10 October 2016)
Initiation on 24 April 2017 of anti-dumping investigation on imports of steamed tubes of austenitic stainless steel (HS 7306.40.00; 7306.90.20) from Malaysia, Thailand and Viet Nam
Permanent Delegation of Brazil to the WTO (29 May 2017)
Canada Termination on 25 January 2017 (without measure) of anti-dumping investigation on imports of certain fabricated industrial steel components (HS 7216.99.00; 7301.20.00; 7308.40.00; 7308.90.00; 7326.90.90; 8421.99.90; 8428.31.00; 8428.32.00; 8428.33.00; 8428.39.00) from the United Arab Emirates and the United Kingdom (initiated on 12 September 2016)
WTO document G/ADP/N/294/CAN, 21 March 2017

78
Measure Source/Date Status Initiation on 20 February 2017 of anti-dumping investigation on imports of certain silicon metals (HS 2804.69.00) from Brazil, Kazakhstan, Lao People's Democratic Republic, Malaysia, Norway, Russian Federation and Thailand
Permanent Delegation of Canada to the WTO (29 May 2017) and Canada Border Service Agency Notice SM2 2017 IN (20 February 2017)
Initiation on 20 February 2017 of countervailing investigation on imports of certain silicon metals (HS 2804.69.00) from Brazil, Kazakhstan, Malaysia, Norway and Thailand
Permanent Delegation of Canada to the WTO (29 May 2017) and Canada Border Service Agency Notice SM2 2017 IN (20 February 2017)
China Initiation on 24 October 2016 of anti-dumping investigation on imports of polyformaldehyde copolymer (HS 3907.10.10) from Korea, Rep. of; Malaysia and Thailand
WTO document G/ADP/N/294/CHN, 15 March 2017
Termination on 22 March 2017 of anti-dumping duties on imports of photographic paper and paper board (HS 3703.10.10; 3703.20.10; 3703.90.10) from the European Union and the United States (investigation initiated on 23 December 2010. Provisional and definitive duties imposed on 10 August 2011 and 23 March 2012)
Permanent Delegation of China to the WTO (29 May 2017) and MOFCOM Announcement No. 61/2016 (7 November 2016)
Initiation on 13 February 2017 of anti-dumping investigation on imports of aniline derivatives and their salts (HS 2921.42.00) from India
Permanent Delegation of China to the WTO (29 May 2017) and MOFCOM Announcement No. 4/2017 (15 February 2017)
Initiation on 13 February 2017 of countervailing investigation on imports of aniline derivatives and their salts (HS 2921.42.00) from India
Permanent Delegation of China to the WTO (29 May 2017) and MOFCOM Announcement No. 5/2017 (15 February 2017)
Initiation on 6 March 2017 of anti-dumping investigation on imports of bisphenol A (HS 2907.23.00) from Thailand
Permanent Delegation of China to the WTO (29 May 2017) and MOFCOM Announcement No. 13/2017 (7 March 2017)
Initiation on 27 March 2017 of anti-dumping investigation on imports of 4-methylpentan-2-one (methyl isobutyl ketone) (HS 2914.13.00) from Japan; Korea, Rep. of and South Africa
Permanent Delegation of China to the WTO (29 May 2017) and MOFCOM Announcement No. 16/2017 (30 March 2017)

79
Measure Source/Date Status
European Union Termination on 12 November 2016 of anti-dumping duties on imports of saturated fatty alcohols with a carbon chain length of C8, C10, C12, C14, C16 or C18 (not including branched isomers) including single saturated fatty alcohols (also referred to as "single cuts") and blends predominantly containing a combination of carbon chain lengths C6-C8, C6-C10, C8-C10, C10-C12 (commonly categorized as C8-C10), blends predominantly containing a combination of carbon chain lengths C12-C14, C12-C16, C12-C18, C14-C16 (commonly categorized as C12-C14) and blends predominantly containing a combination of carbon chain lengths C16-C18 (HS 2905.16.85; 2905.17.00; 2905.19.00; 3823.70.00) from India, Indonesia and Malaysia (investigation initiated on 13 August 2010, provisional and definitive duties imposed on 11 May and 11 November 2011)
Commission Notice 2016/C 418/03 (12 November 2016)
Termination on 5 December 2016 (without measure) of anti-dumping investigation on imports of certain manganese oxides (HS 2602.00.00; 2820.90.90) from Brazil, Georgia, India and Mexico (initiated on 17 December 2015)
WTO document G/ADP/N/294/EU, 11 April 2017
Initiation on 9 December 2016 of anti-dumping investigation on imports of certain corrosion resistant steels "CRS" (HS 7210.41.00; 7210.49.00; 7210.61.00; 7210.69.00; 7212.30.00; 7212.50.61; 7212.50.69; 7225.92.00; 7225.99.00; 7226.99.30; 7226.99.70) from China
WTO document G/ADP/N/294/EU, 11 April 2017
Initiation on 10 December 2016 of anti-dumping investigation on imports of certain cast iron articles (HS 7325.10.00; 7325.99.10) from China and India
WTO document G/ADP/N/294/EU, 11 April 2017
Termination on 8 January 2017 of anti-dumping duties on imports of certain stainless steel fasteners and parts thereof (HS 7318.12.10; 7318.14.10; 7318.15.30; 7318.15.51; 7318.15.61; 7318.15.70) from China and Chinese Taipei (imposed on 19 November 2005)
Commission Notice 2017/C 5/02 (7 January 2017)
Termination on 8 January 2017 of anti-dumping duties on imports of certain stainless steel fasteners and parts thereof (HS 7318.12.10; 7318.14.10; 7318.15.30; 7318.15.51; 7318.15.61; 7318.15.70) from Philippines (investigation initiated on 14 June 2012 and definitive duty imposed on 12 March 2013)
Commission Notice 2017/C 5/02 (7 January 2017)
Termination on 7 February 2017 of anti-dumping duties on imports of certain polyethylene terephthalate (PET) (HS 3907.60.20) from China (imposed on 19 August 2004)
Commission Decision 2017/206 (6 February 2017)
Termination on 10 February 2017 of anti-dumping duties on imports of steel ropes and cables (steel wire ropes) (HS 7312.10.81; 7312.10.83; 7312.10.85; 7312.10.89; 7312.10.98) from Moldova (imposed on 24 April 2004) and Ukraine (imposed on 16 November 2005)
Commission Notice 2017/C 41/05 (8 February 2017)
India Termination on 24 November 2016 of anti-dumping duties on imports of flat products of stainless steel, hot-rolled (HS 7219.11; 7219.12; 7219.13; 7219.14; 7219.21; 7219.22; 7219.23; 7219.24; 7220.11; 7220.12) from the European Union; Korea, Rep. of; South Africa; Chinese Taipei and the United States (investigation initiated on 12 April 2010 and definitive duty imposed on 25 November 2011)
WTO document G/ADP/N/294/IND, 11 April 2017
Termination on 16 December 2016 (without measure) of safeguard investigation on imports of unwrought aluminium (aluminium, not alloyed, and aluminium alloys) (HS 7601) (investigation initiated on 19 April 2016)
Permanent Delegation of India to the WTO (30 May 2017) and WTO document G/SG/N/8/IND/ 29/Suppl.1, 20 December 2016

80
Measure Source/Date Status Initiation on 2 February 2017 of anti-dumping investigation on imports of non-dyed polyester staple fibre "PSF" ranging from 0.6 to 6 deniers (excluding recycled PSF and speciality fibres, namely cationic dyeable, fire/flame retardant, low melt and bi-component fibres) (HS 5503.20.00) from China, Indonesia, Malaysia and Thailand
Permanent Delegation of India to the WTO (30 May 2017) and Notification No. 14/49/2016-DGAD, Ministry of Commerce and Industry - Directorate General of Anti-Dumping and Allied Duties (2 February 2017)
Initiation on 9 February 2017 of anti-dumping investigation on imports of methyl ethyl ketone "MEK" (HS 2914.12.00) from China, Japan, South Africa and Chinese Taipei
Permanent Delegation of India to the WTO (30 May 2017) and Notification No. 14/26/2016-DGAD, Ministry of Commerce and Industry - Directorate General of Anti-Dumping and Allied Duties (9 February 2017)
Initiation on 17 February 2017 of anti-dumping investigation on imports of veneered engineered wooden flooring (HS 44) from China, the European Union, Indonesia and Malaysia
Permanent Delegation of India to the WTO (30 May 2017) and Notification No. 14/34/2016-DGAD, Ministry of Commerce and Industry - Directorate General of Anti-Dumping and Allied Duties (17 February 2017)
Initiation on 17 March 2017 of anti-dumping investigation on imports of dimethylacetamide (HS 2924.19.00; 2902.11.00; 2905.19.90; 2911.00.90; 2915.29.90; 2915.39.90; 2921.11.10; 2921.11.90; 2921.29.90; 2922.50.90; 2924.19.00; 2924.21.90; 2924.29.90; 2926.90.00; 2042.00.90) from China and Turkey
Permanent Delegation of India to the WTO (30 May 2017) and Notification No. 14/41/2016-DGAD, Ministry of Commerce and Industry - Directorate General of Anti-Dumping and Allied Duties (17 March 2017)
Initiation on 17 March 2017 of anti-dumping investigation on imports of phosphorus pentaoxide (HS 2809.10.00) from China
Permanent Delegation of India to the WTO (30 May 2017) and Notification No. 14/47/2016-DGAD, Ministry of Commerce and Industry - Directorate General of Anti-Dumping and Allied Duties (17 March 2017)
Initiation on 28 March 2017 of anti-dumping investigation on imports of glassware (HS 7013.29; 7013.37; 7013.39; 7013.49; 7014.99) from China and Indonesia
Permanent Delegation of India to the WTO (30 May 2017) and Notification No. 14/45/2016-DGAD, Case No. OI-20/2017 - Ministry of Commerce and Industry - Directorate General of Anti-Dumping and Allied Duties (28 March 2017)
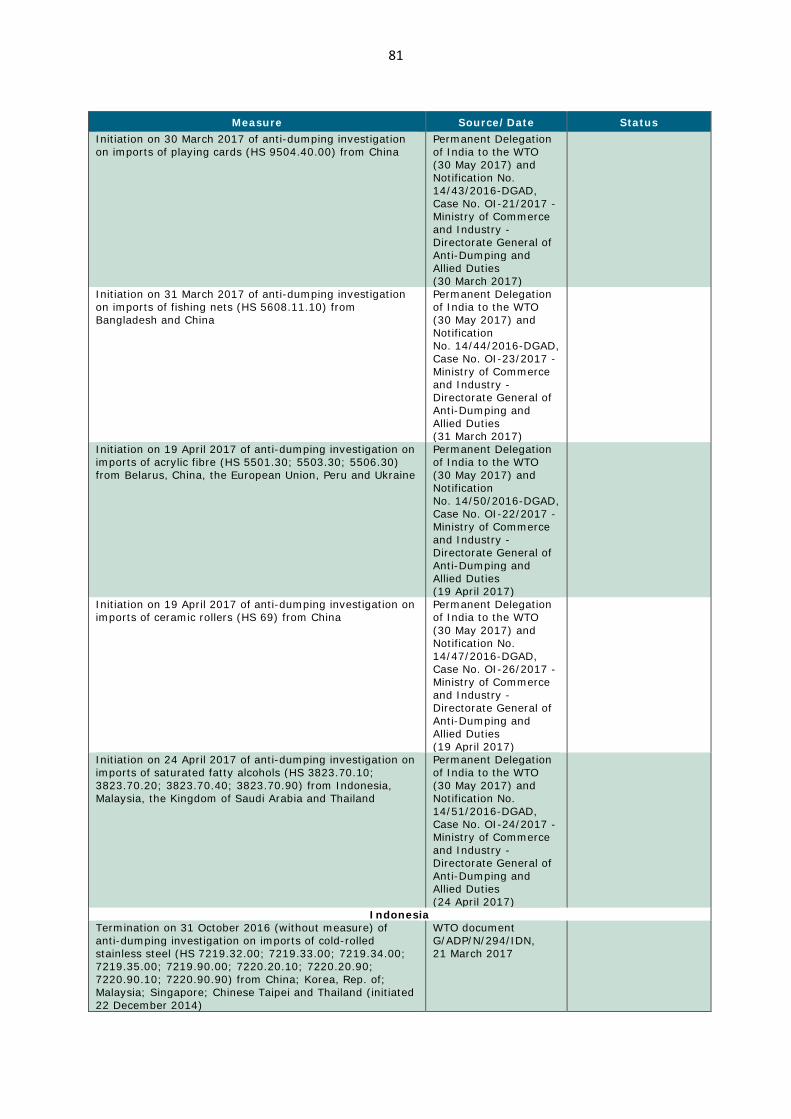
81
Measure Source/Date Status Initiation on 30 March 2017 of anti-dumping investigation on imports of playing cards (HS 9504.40.00) from China
Permanent Delegation of India to the WTO (30 May 2017) and Notification No. 14/43/2016-DGAD, Case No. OI-21/2017 - Ministry of Commerce and Industry - Directorate General of Anti-Dumping and Allied Duties (30 March 2017)
Initiation on 31 March 2017 of anti-dumping investigation on imports of fishing nets (HS 5608.11.10) from Bangladesh and China
Permanent Delegation of India to the WTO (30 May 2017) and Notification No. 14/44/2016-DGAD, Case No. OI-23/2017 - Ministry of Commerce and Industry - Directorate General of Anti-Dumping and Allied Duties (31 March 2017)
Initiation on 19 April 2017 of anti-dumping investigation on imports of acrylic fibre (HS 5501.30; 5503.30; 5506.30) from Belarus, China, the European Union, Peru and Ukraine
Permanent Delegation of India to the WTO (30 May 2017) and Notification No. 14/50/2016-DGAD, Case No. OI-22/2017 - Ministry of Commerce and Industry - Directorate General of Anti-Dumping and Allied Duties (19 April 2017)
Initiation on 19 April 2017 of anti-dumping investigation on imports of ceramic rollers (HS 69) from China
Permanent Delegation of India to the WTO (30 May 2017) and Notification No. 14/47/2016-DGAD, Case No. OI-26/2017 - Ministry of Commerce and Industry - Directorate General of Anti-Dumping and Allied Duties (19 April 2017)
Initiation on 24 April 2017 of anti-dumping investigation on imports of saturated fatty alcohols (HS 3823.70.10; 3823.70.20; 3823.70.40; 3823.70.90) from Indonesia, Malaysia, the Kingdom of Saudi Arabia and Thailand
Permanent Delegation of India to the WTO (30 May 2017) and Notification No. 14/51/2016-DGAD, Case No. OI-24/2017 - Ministry of Commerce and Industry - Directorate General of Anti-Dumping and Allied Duties (24 April 2017)
Indonesia Termination on 31 October 2016 (without measure) of anti-dumping investigation on imports of cold-rolled stainless steel (HS 7219.32.00; 7219.33.00; 7219.34.00; 7219.35.00; 7219.90.00; 7220.20.10; 7220.20.90; 7220.90.10; 7220.90.90) from China; Korea, Rep. of; Malaysia; Singapore; Chinese Taipei and Thailand (initiated 22 December 2014)
WTO document G/ADP/N/294/IDN, 21 March 2017

82
Measure Source/Date Status Initiation on 23 December 2016 of anti-dumping investigation on imports of coloured steel, coated (HS 7210.70.10; 7212.40.10; 7212.40.20) from China and Viet Nam
WTO document G/ADP/N/294/IDN, 21 March 2017
Japan Initiation on 31 March 2017 of anti-dumping investigation on imports of carbon steel butt welding fittings (HS 7307.93) from China and Korea, Rep. of
Permanent Delegation of Japan to the WTO (30 May 2017)
Korea, Rep. of Initiation on 7 December 2016 of anti-dumping investigation on imports of ferro-silico-manganese (HS 7202.30) from India, Ukraine and Viet Nam
WTO document G/ADP/N/294/KOR, 15 February 2017
Termination on 19 December 2016 of anti-dumping duties on imports of polyester filament draw textured yarn (HS 5402.33) from China, Malaysia and Chinese Taipei (imposed on 20 October 2006)
WTO document G/ADP/N/294/KOR, 15 February 2017
Initiation on 17 April 2017 of anti-dumping investigation on imports of poly(ethylene terephthalate) (HS 3920.62.00; 3920.69.00) from Chinese Taipei, Thailand and the United Arab Emirates
Permanent Delegation of the Republic of Korea to the WTO (20 April 2017)
Mexico Initiation on 7 December 2016 of anti-dumping investigation on imports of carbon and alloy steel tubing with longitudinal seams and a circular, square or rectangular cross-section (HS 7306.61.01; 7306.19.99; 7306.30.99; 7306.30.01) from China
WTO document G/ADP/N/294/MEX, 28 February 2017
Initiation on 15 December 2016 of anti-dumping investigation on imports of seamless carbon steel tubing (HS 7304.19.01; 7304.19.02; 7304.19.99; 7304.39.05; 7304.39.06; 7304.39.99) from India; Korea, Rep. of; Spain and Ukraine
WTO document G/ADP/N/294/MEX, 28 February 2017
Termination on 15 December 2016 of anti-dumping duties on imports of multilayer paper sacks for lime and cement (HS 4819.30.01) from Brazil (imposed on 26 January 2006)
WTO document G/ADP/N/294/MEX, 28 February 2017
Termination on 3 April 2017 of anti-dumping duties on imports of mushrooms of the genus Agaricus (HS 2003.10.01) from Chile (imposed on 18 May 2006)
Permanent Delegation of Mexico to the WTO (29 May 2017) and Diario Oficial de la Federación (Official Journal), 3 April 2017
Russian Federation (for Eurasian Economic Union) Initiation on 16 January 2017 of anti-dumping investigation on imports of herbicides (HS 3808.93) from the European Union
Permanent Delegation of the Russian Federation to the WTO (30 May 2017)
Turkey Termination on 28 October 2016 (without measure) of countervailing investigation on imports of seamless tubes, pipes and hollow profiles of iron (other than cast iron) or steel (HS 7304) from China (initiated on 15 May 2015)
WTO document G/SCM/N/313/TUR, 8 March 2017
Initiation on 30 October 2016 of anti-dumping investigation on imports of unbleached kraftliner paper (HS 4804.11.11; 4804.11.15; 4804.11.90) from Brazil, Finland, Poland and the Russian Federation
WTO document G/ADP/N/294/TUR, 2 March 2017
Termination on 30 October 2016 (without measure) of anti-dumping investigation on imports of cold-rolled stainless steel flats (HS 7219.31.00; 7219.32.10; 7219.32.90; 7219.33.10; 7219.33.90; 7219.34.10; 7219.34.90; 7219.35.10; 7219.35.90; 7220.20.21; 7220.20.29; 7220.20.41; 7220.20.49; 7220.20.81; 7220.20.89) from China and Chinese Taipei (investigation initiated on 22 August 2015)
WTO document G/ADP/N/294/TUR, 2 March 2017
Initiation on 23 November 2016 of anti-dumping investigation on imports of dioctyl terephthalate (HS 2917.39.95) from Korea, Rep. of
WTO document G/ADP/N/294/TUR, 2 March 2017

83
Measure Source/Date Status Termination on 29 November 2016 of anti-dumping duties on dioctyl phthalate "DOP" (HS 2917.32.00) from Romania (investigation initiated on 19 February 2011 and definitive duty imposed on 29 November 2011)
WTO document G/ADP/N/294/TUR, 2 March 2017
Initiation on 21 December 2016 of anti-dumping investigation on imports of heavy plate (HS 7208.51.20; 7208.90.80; 7211.13.00; 7211.14.00; 7225.40.40; 7225.99.00) from China
WTO document G/ADP/N/294/TUR, 2 March 2017
Termination on 31 January 2017 of anti-dumping duties on imports of pre-finished engineered laminated flooring (HS 4411.13, 4411.14; 4411.92; 4411.93) from China and Indonesia (imposed on 8 July 2006)
Permanent Delegation of Turkey to the WTO (May 2017)
Initiation on 23 February 2017 of anti-dumping investigation on imports of terephthalic acid (HS 2917.36.00) from Belgium; Korea, Rep. of and Spain
Permanent Delegation of Turkey to the WTO (May 2017)
Initiation on 24 March 2017 of anti-dumping investigation on imports of sodium percarbonates (HS 2836.99.90) from Germany and Sweden
Permanent Delegation of Turkey to the WTO (May 2017)
Initiation on 6 April 2017 of safeguard investigation on imports of pneumatic tyres (HS 4011.10; 4011.20; 4011.70; 4011.80; 4011.90; 8708)
WTO document G/SG/N/6/TUR/22, 12 April 2017
Initiation on 22 April 2017 of safeguard investigation on imports of toothbrushes (HS 9603.21.00)
WTO document G/SG/N/6/TUR/23, 3 May 2017
United States of America Termination on 18 November 2016 of anti-dumping duties on imports of certain iron mechanical transfer drive components (HS 8483.30.80; 8483.50.60; 8483.50.90; 8483.90.30; 8483.90.80; 7325.10.00; 7325.99.10; 7326.19.00; 8431.31.00; 8431.39.00; 8483.50.40) from Canada and China (investigation initiated on 25 November 2015 and provisional duty imposed on 8 June 2016)
WTO document G/ADP/N/294/USA, 9 March 2017
Termination on 18 November 2016 of countervailing investigation on imports of certain iron mechanical transfer drive components (HS 8483.30.80; 8483.50.60; 8483.50.90; 8483.90.30; 8483.90.80; 7325.10.00; 7325.99.10; 7326.19.00; 8431.31.00; 8431.39.00; 8483.50.40) from China (investigation initiated on 25 November 2015 and provisional duty imposed on 11 April 2016)
WTO document G/SCM/N/313/USA, 14 March 2017
Termination on 18 November 2016 of anti-dumping duties on imports of circular welded carbon-quality steel pipe (HS 7306.19.10; 7306.19.51; 7306.30.10; 7306.30.50; 7306.50.10; 7306.50.50) from Viet Nam (investigation initiated on 25 November 2015 and provisional duty imposed on 8 June 2016)
WTO document G/ADP/N/294/USA, 9 March 2017
Termination on 18 November 2016 of countervailing duties on imports of circular welded carbon-quality steel pipe (HS 7306.19.10; 7306.19.51; 7306.30.10; 7306.30.50; 7306.50.10; 7306.50.50) from Pakistan (investigation initiated on 25 November 2015 and provisional duty imposed on 8 April 2016)
WTO document G/SCM/N/313/USA, 14 March 2017
Initiation on 16 December 2016 of anti-dumping investigation on imports of certain hardwood plywood products (HS 4412) from China
WTO document G/ADP/N/294/USA, 9 March 2017
Initiation on 8 December 2016 of countervailing investigation on imports of certain hardwood plywood products (HS 4412) from China
WTO document G/SCM/N/313/USA, 14 March 2017

84
Measure Source/Date Status Initiation on 22 December 2016 of anti-dumping investigation on imports of certain softwood lumber products (HS 4407.10.01; 4409.10.05; 4409.10.10; 4409.10.20; 4409.10.90; 4418.90.25; 4415.20.40; 4415.20.80; 4418.90.46; 4421.90.70; 4421.90.94; 4421.90.97) from Canada
WTO document G/ADP/N/294/USA, 9 March 2017; and Department of Commerce, International Trade Administration A-122-857, Federal Register/Vol. 82 FR No. 18421 (19 April 2017)
Provisional duty imposed on 27 April 2017
Initiation on 22 December 2016 of countervailing investigation on imports of certain softwood lumber products (HS 4407.10.01; 4409.10.05; 4409.10.10; 4409.10.20; 4409.10.90; 4418.90.25; 4415.20.40; 4415.20.80; 4418.90.46; 4421.90.70; 4421.90.94; 4421.90.97) from Canada
WTO document G/SCM/N/313/USA, 14 March 2017; and Department of Commerce, International Trade Administration C-122-858, Federal Register/Vol. 82 FR No. 19657 (28 April 2017)
Provisional duty imposed on 27 April 2017
Termination on 30 December 2016 of anti-dumping duties on imports of solid urea (HS 3102.10) from Russian Federation and Ukraine (imposed on 14 July 1987)
WTO document G/ADP/N/294/USA, 9 March 2017
Initiation on 28 March 2017 of anti-dumping investigation on imports of silicon metals (HS 2804.61.00; 2804.69.10; 2804.69.50) from Australia, Brazil and Norway
Department of Commerce, International Trade Administration A-602-810, A-351-850 and A-403-805 Federal Register/Vol. 82 FR No. 16352 (4 April 2017)
Initiation on 28 March 2017 of countervailing investigation on imports of silicon metals (HS 2804.61.00; 2804.69.10; 2804.69.50) from Australia, Brazil and Kazakhstan
Department of Commerce, International Trade Administration C-351-851, C-602-811 and C-834-808 Federal Register/Vol. 82 FR No. 16356 (4 April 2017)
Initiation on 28 March 2017 of anti-dumping investigation on imports of certain aluminium foil (HS 7607.11.30; 7607.11.60; 7607.11.90; 7607.19.60; 7606.11.30; 7606.11.60; 7606.12.30; 7606.12.60; 7606.91.30; 7606.91.60; 7606.92.30; 7606.92.60) from China
Department of Commerce, International Trade Administration A-570-053, Federal Register/Vol. 82 FR No. 15691 (30 March 2017)
Initiation on 28 March 2017 of countervailing investigation on imports of certain aluminium foil (HS 7607.11.30; 7607.11.60; 7607.11.90; 7607.19.60; 7606.11.30; 7606.11.60; 7606.12.30; 7606.12.60; 7606.91.30; 7606.91.60; 7606.92.30; 7606.92.60) from China
Department of Commerce, International Trade Administration C-570-054, Federal Register/Vol. 82 FR No. 15688 (30 March 2017)

85
Measure Source/Date Status Initiation on 12 April 2017 of anti-dumping investigation on imports of carbon and alloy steel wire rod (HS 7213.91.30; 7213.91.45; 7213.91.60; 7213.99.00; 7227.20.00; 7227.90.60) from Belarus; Italy; Korea, Rep. of; Russian Federation; South Africa; Spain; Turkey; Ukraine; the United Arab Emirates and the United Kingdom
Department of Commerce, International Trade Administration A-822-806, A-475-836, A-580-891, A-821-824, A-791-823, A-469-816, A-489-831, A-823-816, A-520-808 and A-412-826, Federal Register/Vol. 82 FR No. 19207 (26 April 2017)
Initiation on 12 April 2017 of anti-dumping investigation on imports of biodiesel (HS 3826.00.30) from Argentina and Indonesia
Department of Commerce, International Trade Administration A-357-820 and A-560-830 Federal Register/Vol. 82 FR No. 18428 (19 April 2017)
Initiation on 12 April 2017 of countervailing investigation on imports of biodiesel (HS 3826.00.30) from Argentina and Indonesia
Department of Commerce, International Trade Administration C-357-821 and C-560-831 Federal Register/Vol. 82 FR No. 18423 (19 April 2017)
Initiation on 17 April 2017 of countervailing investigation on imports of carbon and alloy steel wire rod (HS 7213.91.30; 7213.91.45; 7213.91.60; 7213.99.00; 7227.20.00; 7227.90.60) from Italy and Turkey
Department of Commerce, International Trade Administration C-475-837 and C-489-832, Federal Register/Vol. 82 FR No. 19213 (26 April 2017)
Initiation on 20 April 2017 of anti-dumping investigation on imports of carton-closing staples (HS 8305.20.00) from China
Department of Commerce, International Trade Administration A-570-055, Federal Register/Vol. 82 FR No. 19351 (27 April 2017)
Initiation on 1 May 2017 of anti-dumping investigation on imports of tool chests and cabinets (HS 9403.10.00; 9403.20.00; 7326.90.86; 7326.90.35) from China and Viet Nam
Department of Commerce, International Trade Administration A-570-056 and A-552-821 Federal Register/Vol. 82 FR No. 21523 (9 May 2017)
Initiation on 1 May 2017 of countervailing investigation on imports of tool chests and cabinets (HS 9403.10.00; 9403.20.00; 7326.90.86; 7326.90.35) from China
Department of Commerce, International Trade Administration C-570-057 Federal Register/Vol. 82 FR No. 21516 (9 May 2017)

86
Measure Source/Date Status Initiation on 9 May 2017 of anti-dumping investigation on imports of certain cold-drawn mechanical tubing of carbon and alloy steel (HS 7304.31.30; 7304.31.60; 7304.51.10; 7304.51.50; 7306.30.50; 7306.50.50; 7306.30.10; 7306.50.10) from China; Germany; India; Italy; Korea, Rep. of and Switzerland
Department of Commerce, International Trade Administration A-428-845, A-533-873, A-475-838, A-580-892, A-570-058 and A-441-801 Federal Register/Vol. 82 FR No. 22491 (16 May 2017)
Initiation on 9 May 2017 of countervailing investigation on imports of certain cold-drawn mechanical tubing of carbon and alloy steel (HS 7304.31.30; 7304.31.60; 7304.51.10; 7304.51.50; 7306.30.50; 7306.50.50; 7306.30.10; 7306.50.10) from China and India
Department of Commerce, International Trade Administration C-533-874 and C-570-059 Federal Register/Vol. 82 FR No. 22486 (16 May 2017)

87
ANNEX 3
OTHER TRADE AND TRADE-RELATED MEASURES1
(MID-OCTOBER 2016 to MID-MAY 2017)
Confirmed information2
Measure Source/Date Status
Argentina Inclusion of 74 new tariff lines in the list of products requiring non-automatic import licensing requirements (e.g. parts for motorcycles, percussion musical instruments, paper and paperboard, blades for saws, machinery and mechanical appliances, electrical machinery and equipment and parts thereof, optical fibres, sulphuric acid, organic chemicals, chemical products, plastics and articles thereof, conveyor or transmission belts of vulcanized rubber, glass and glassware, iron and steel, aluminium and articles thereof, bedding, mattresses, lamps and lighting fittings) (NCM Chapters 28; 29; 38; 39; 40; 48; 70; 72; 76; 79; 82; 84; 85; 87; 90; 91; 92; 94; 96)
Permanent Delegation of Argentina to the WTO (30 May 2017), Resolución No. 301-E/2016 Ministerio de Producción -Secretaría de Comercio (19 October 2016) and Resolución No. 152-E/2017 -Secretaría de Comercio (2 March 2017)
Elimination of certain items (27 tariff lines) from the list of products requiring non-automatic import licensing requirements (NCM 7219.34.00; 7408.19.00; 7604.29.19; 8205.59.00; 8207.30.00; 8207.80.00; 8207.90.00; 8208.20.00; 8424.30.10; 8456.90.00; 8457.10.00; 8477.10.99; 8501.20.00; 8515.90.00; 8546.90.00; 9018.31.90; 8471.30.12; 8471.30.19; 8471.30.90; 8471.41.10; 8471.49.00; 8504.40.90; 8528.41.10; 8528.41.20; 8528.51.10; 8528.51.20; 8544.42.00)
Implementation of a Certificate of Import of Used Capital Goods (Certificado de Importación de Bienes Usados "CIBU") (NCM Chapters 84; 85; 86; 87; 88; 89; 90)
Permanent Delegation of Argentina to the WTO (30 May 2017) and Decreto No. 1205/2016 (29 November 2016)
Effective 30 November 2016
1 The inclusion of any measure in this Annex implies no judgement by the WTO Secretariat on whether
or not such measure, or its intent, is protectionist in nature. Moreover, nothing in the Annex implies any judgement, either direct or indirect, on the consistency of any measure referred to with the provisions of any WTO agreement.
2 This Section includes information which has either been provided by the Member concerned or has been confirmed at the request of the Secretariat.

88
Measure Source/Date Status
Updated list of "criterion values" (valores criterio de carácter preventivo) for imports of cotton toilet linen and kitchen linen, terry towelling or similar terry fabrics (NCM 6302.60.00), from specific origins
Permanent Delegation of Argentina to the WTO (30 May 2017) and Administración Federal de Ingresos Públicos - Resolución General No. 3992-E (7 February 2017)
Effective 9 February 2017
Updated list of "criterion values" (valores criterio de carácter preventivo) for imports of plastic tableware, kitchenware, other household articles and toilet articles (NCM 3924.10.00; 3924.90.00), from specific origins
Permanent Delegation of Argentina to the WTO (30 May 2017) and Administración Federal de Ingresos Públicos - Resolución General No. 3995-E (22 February 2017)
Effective 22 February 2017
Updated list of "reference values" for exports of cranberries (NCM 0810.40.00), for certain specified destinations
Permanent Delegation of Argentina to the WTO (30 May 2017) and Administración Federal de Ingresos Públicos - Resolución General No. 4001-E (3 March 2017)
Effective 3 March 2017
Establishment of new requirements (Registro de Operaciones de Importación de Petróleo Crudo y sus Derivados) for the import of crude oil and its derivatives (NCM 2709; 2710): (i) registration of import operations; (ii) prior import authorization by the Ministry of Energy; and (iii) submission of an application by importers to the Ministry. Imports allowed only if insufficient: (i) supply of locally-produced crude oil; (ii) processing capacity in refineries; and (iii) supply of local derivatives
Permanent Delegation of Argentina to the WTO (30 May 2017) and Decreto No. 192/2017 - Ministerio de Energía y Minería (20 March 2017)
Effective 21 March 2017
Updated list of "criterion values" (valores criterio de carácter preventivo) for imports of meat of swine and frozen meat of swine (NCM 0203.29.00; 0210.19.00), from specific origins
Permanent Delegation of Argentina to the WTO (30 May 2017) and Administración Federal de Ingresos Públicos - Resolución General No. 4039-E (2 May 2017)
Effective 4 May 2017
Extension of the import prohibition of worn clothing and other worn articles (NCM 6309.00.10; 6309.00.90)
Permanent Delegation of Argentina to the WTO (30 May 2017) and Decreto No. 333/2017 Ministerio de Producción (12 May 2017)
Effective 15 May 2017 for 5 years

89
Measure Source/Date Status
Brazil Increase of import tariffs (to 18%) on certain LED lamps (NCM 8539.50.00) and (to 14%) on semi-bleached or bleached coniferous chemical wood pulp (NCM 4703.21.00)
Permanent Delegation of Brazil to the WTO (29 May 2017) and Camex Resolution No. 137/2016 (28 December 2016)
Effective 29 December 2016
Temporary increase of import tariffs (from 10% to 35%) on coffee, not roasted and not decaffeinated (variedade Conilon) (NCM 0901.11.10)
Permanent Delegation of Brazil to the WTO (29 May 2017)
Effective 21 February 2017 to 31 May 2017
India Restoration of the "additional duty rate" (CVD) on gold coins having a gold content not below 99.5 and gold findings
Permanent Delegation of India to the WTO (30 May 2017) and Notification Customs, Ministry of Finance - Department of Revenue No. 59/2016 (1 December 2016)
Effective 1 December 2016
Reimposition of import tariffs (7.5%) on technetium-99m (HS 2844) (originally eliminated on 3 October 2016)
Permanent Delegation of India to the WTO (30 May 2017); Notification Customs, Ministry of Finance - Department of Revenue No. 61/2016 (27 December 2016); and WTO document WT/TPR/OV/19, 21 November 2016
Effective 27 December 2016
Increase of import tariffs (from zero to 2%) on populated printed circuit boards (PCBs) for use in the manufacture of mobile phones (HS 8517.70)
Permanent Delegation of India to the WTO (30 May 2017) and Notification Customs, Ministry of Finance - Department of Revenue No. 4/2017 (2 February 2017)
Effective 2 February 2017
Increase of import tariffs (from 6% to 10%) on silver, in any form, other than medallions and silver coins having silver content not below 99.9%, or semi-manufactured forms of silver falling under sub-heading HS 7106.92; and medallions and silver coins having silver content not below 99.9% or semi-manufactured forms of silver falling under sub-heading HS 7106.92 (HS 71); (from zero to 10%) on hot-rolled coils for use in the manufacture of welded tubes and pipes falling under heading HS 7305 or 7306 (HS 7208); and co-polymer coated MS tapes/stainless steel tapes for use in the manufacture of telecommunication grade optical fibres or optical fibre cables (HS 7212.40.00); (from zero to 5%) on magnesium oxide (MgO) coated cold-rolled steel coils for use in the manufacture of cold-rolled grain oriented steel (CRGO) falling under HS 7225.11.00) (HS 7225.19.90); (from 5% to 7.5%) on all goods other than reverse osmosis (RO) membrane elements for household type filters (HS 8421.99.00)
Permanent Delegation of India to the WTO (30 May 2017) and Notification Customs, Ministry of Finance - Department of Revenue No. 6/2017 (2 February 2017)

90
Measure Source/Date Status
Increase of export duties (from zero to 15%) on other aluminium ores including laterite (HS 2606.00.90)
Permanent Delegation of India to the WTO (30 May 2017) and Notification Customs, Ministry of Finance - Department of Revenue No. 3/2017 (2 February 2017)
Effective 2 February 2017
Increase of import tariffs (from zero to 10%) on wheat and tur (HS 0713.40.00; 0713.60.00)
Permanent Delegation of India to the WTO (30 May 2017) and Notification No. 10/2017-Customs (23 March 2017)
Effective 28 March 2017
Further extension of the temporary minimum import price "MIP" (CIF basis/metric tonne) for 66 iron and steel tariff lines (HS Chapter 72) (originally implemented on 1 February 2016, for 6 months)
Permanent Delegation of India to the WTO (30 May 2017)
Effective December 2016 for 2 months
National Steel Policy 2017 providing preference to domestically manufactured iron and steel products in government procurement
Ministry of Steel (May 2017)
Effective May 2017
Indonesia New requirement for imports of iron, steel and alloy steel and their derivative products (HS Chapter 72)
Permanent Delegation of Indonesia to the WTO (30 May 2017) and Minister of Trade Regulation No. 82/ M-AG/PER/12/2016 (9 December 2016)
Effective 1 January 2017 to 31 December 2019
New requirement for exports of processed and refined mining products (HS Chapter 48) (effective 1 February 2017), animals and animal products (effective 2 March 2017)
Permanent Delegation of Indonesia to the WTO (30 May 2017) and Minister of Trade Regulations Nos. 01/M-DAG/PER/1/2017 (19 January 2017) and 13/ M-DAG/PER/2/2017 (2 March 2017)
Effective: see individual dates in measure
Revised regulation on issuance of business trade licences and company registration certificates
Permanent Delegation of Indonesia to the WTO (30 May 2017) and Minister of Trade Regulations Nos. 07/ M-DAG/PER/2/2017 and 08/ M-DAG/PER/2/2017 (17 February 2017)
Effective 22 February 2017

91
Measure Source/Date Status
New requirements for imports of animals and animal products Permanent Delegation of Indonesia to the WTO (30 May 2017) and Minister of Trade Regulation No. 13/ M-DAG/PER/2/2017 (2 March 2017)
Effective 2 March 2017
New requirement for imports of tyres (HS 4011), establishing import restrictions and pre-shipment inspections and restricting entry points
Permanent Delegation of Indonesia to the WTO (30 May 2017) and Regulation No. 77/M-DAG/PER/11/2016 (11 November 2016)
Effective 1 January 2017
Mexico Further extension of the temporary increase of import tariffs (from zero to 15%) on 97 iron and steel tariff lines (HS Chapter 72) (originally implemented on 7 October 2015 for 180 days and extended on 4 April 2016 for an additional period of 180 days)
Permanent Delegation of Mexico to the WTO (29 May 2017); Diario Oficial de la Federación (Official Journal), 6 April 2017; and WTO document WT/TPR/OV/19, 21 November 2016
Effective 6 April 2017, for 180 days
Russian Federation Further extension of the temporary export ban on tanned leather (HS 4104.11; 4104.19) (originally effective from 18 July 2016 to 18 January 2017)
Permanent Delegation of the Russian Federation to the WTO (30 May 2017)
Effective 1 February 2017 to 1 August 2017
Government Resolution of the Russian Federation No. 9 of 14 January 2017, established limitations on government procurement of foreign products and services for state security reasons
Permanent Delegation of the Russian Federation to the WTO (30 May 2017)
Addition of 62 new items manufactured in the Eurasian Economic Union to the list of medical devices receiving preferential treatment in government procurement
Permanent Delegation of the Russian Federation to the WTO (30 May 2017)
Russian Federation (for Eurasian Economic Union) Introduction of mandatory presentation of preliminary information for goods imported by air
Permanent Delegation of the Russian Federation to the WTO (14 October 2016)
Effective 1 April 2017

92
Measure Source/Date Status
South Africa (for Southern African Customs Union)
Increase of import tariffs (from 20% to 30%) on plastic baths, shower-baths, sinks and wash-basins (HS 3922.10) (effective 2 December 2016); (from zero to 10%) on adhesive bandages (HS 3005.10.10; 3005.10.90) (effective 9 December 2016). Imports from the European Union, EFTA, MERCOSUR and the Southern African Development Community (SADC) members exempted
Permanent Delegation of South Africa to the WTO (25 April 2017) and Notices Nos. R. 1466 (2 December 2016), R 1537 (9 December 2016) - International Trade Administration Commission - Government Gazettes Nos. 40460 and 40481
Effective: see individual dates in measure
Increase of import tariffs (from zero to R 63.63 c/kg) on cane and beet sugar (originally implemented on 26 September 2014) (HS 1701.12; 1701.13; 1701.14; 1701.91; 1701.99)
Permanent Delegation of South Africa to the WTO (25 April 2017) and Notice No. R. 264 - International Trade Administration Commission - Government Gazette No. 40713 (24 March 2017)
Effective 24 March 2017
Increase of import tariffs (from zero to 5%) on certain flat-rolled products of stainless steel (HS 7219; 7220) (effective 3 March 2017); and (to 10%/30%) on wire of iron or non-alloy steel (HS 7217); screws, bolts, nuts, coach screws, screw hooks, rivets, cotters, cotter-pins, washers (including spring washers) and similar articles, of iron or steel (HS 7318) (effective 31 March 2017). Imports from the European Union, EFTA and the Southern African Development Community (SADC) members exempted
Permanent Delegation of South Africa to the WTO (25 April 2017) and International Trade Administration Commission Notices Nos. R. 199 - Government Gazette No. 40661 (3 March 2017) and R. 291 Government Gazette No. 40734 (31 March 2017)
Effective: see individual dates in measure
Turkey Increase of import tariffs on tableware, kitchenware and other household articles (effective 11 November 2016); on office materials (effective 11 November 2016); on carpets and other textile products (effective 8 December 2016); on leather apparel and other apparel (effective 31 December 2016); on kashmir (cashmere) apparel (effective 31 December 2016)
Permanent Delegation of Turkey to the WTO (May 2017)
Effective: see individual dates in measure
Increase of import tariffs (from 25% to 40%) on bulk undenatured ethyl alcohol and (from 30% to 50%) on packaged undenatured ethyl alcohol (effective 1 January 2017); (from zero to 15%) on flat-rolled products of iron or non-alloy steel, plated or coated with aluminium-zinc alloys of a width of 600 mm or more (effective 1 January 2017); on cosmetic and cleaning preparations (effective 11 January 2017); (from 5.8% to 30%) on ductile pipes, internal combustion engines, electric motors and generators, generator sets, rotary electric converters, and tractors and gearboxes (effective 18 January 2017); (to 21%) on tractors, generators, accumulators and diesel motors (effective 18 January 2017)
Permanent Delegation of Turkey to the WTO (May 2017)
Effective: see individual dates in measure

93
Measure Source/Date Status
United States of America "Buy America" requirements included in the Water Infrastructure Improvements For the Nation Act (WIIN Act). The WIIN Act maintained existing requirements, during fiscal year 2017, by mandating that funds made available from a state loan fund may not be used for projects for the construction, alteration, or repair of a public water system unless all of the iron and steel products used in the project are produced in the United States. This provision could be waived if: (i) enforcing this requirement would be inconsistent with the public interest; (ii) iron and steel products are not produced in the United States in sufficient and reasonably available quantities and of satisfactory quality; and (iii) inclusion of iron and steel products produced in the United States would increase the cost of the overall project by more than 25%. Provisions included in the WIIN Act shall be applied in a manner consistent with United States obligations under international agreements
Permanent Delegation of the United States to the WTO (May 2017) and Water Infrastructure Improvements for the Nation Act S.612 (December 2016)
Effective 1 January 2017
Tariff reclassifications resulting in the increase of import tariffs on photomask pellicles (HS 3926.90.99), on cam fasteners and dowels made of zinc (HS 7907.00.60), and on reusable bags of woven polypropylene strips used for yard waste and recycling (HS 6305.32.00)
U.S. Customs and Border Protection 19 CFR PART 177 - Customs Bulletin and Decisions, Vol. 50 No. 48 (30 November 2016)
Effective 30 January 2017
Recorded, but non-confirmed information3
Measure Source/Date Status
India Imposition through the implementation of the Goods and Services Tax Regime (GST) of import duties (10%) on certain telecom products, e.g. mobile phones, digital still video cameras and other electronic integrated circuits, classified as ITA-1 products
The Hindu - BusinnesLine (11 December 2016 and 8 May 2017) and India Times (26 April 2017)
"Make in India" requirements for government procurement through the new e-market platform GEM (Government e-Market)
Asit Ranjan Mishra (28 February 2017)
Imports of apples (HS 0808) now permitted through sea ports and airports in Kolkata, Chennai, Mumbai and Cochin; through the land port and airport in Delhi; and through India's land borders
Minutes of the meeting of Council of Trade in Goods, forthcoming
Temporary import ban on reptile leather, raw mink, fox and chinchilla fur skins and tanned mink skins (HS 4114; 4101; 4102; 4103; 4303)
Press reports referring to Notification No. 33/2015-2020 (January 2017)
Indonesia Export ban on copper concentrates (HS 2603) Press reports
(January 2017) Effective 1 January 2017
Import permit requirements for certain locally produced horticulture products
Business World (27 March 2017)
Revised import requirements for milk (HS 0401; 0402), authorizing its import only if domestic production is not able to fulfil national demand
Press reports
3 This Section includes information which has been obtained from public sources but has not yet been
confirmed by the delegation concerned.

94
Measure Source/Date Status
Russian Federation Amendments introduced to the list of goods essential to the internal market, resulting in a temporary export ban
Press reports referring to Government Decree No. 19 (18 January 2017)
Establishment of a 15% price preference for Russian goods, works, or services purchased by state-owned entities or by legal persons using state funding for certain investment projects
Press reports referring to Decree No. 925 (16 September 2016)
Effective 1 January 2017

95
ANNEX 4
MEASURES AFFECTING TRADE IN SERVICES1
(Mid-October 2016 to Mid-May 2017)
Measure
Mode(s) of
supply
Sectoral classification
Source
Date
Verified by
Member MEASURES AFFECTING VARIOUS SECTORS
Brazil On 24 November 2016, the Central Bank of Brazil amended the rules concerning the registration of foreign direct investment with the Central Bank. The new rules bring back the requirement that companies recipient of foreign direct investment register their financial economic statements with the Central Bank on a yearly basis. This requirement is applied on a quarterly basis for companies with assets or net worth equal to or greater than R$250 million. The rules also provide that the Brazilian company recipient of the foreign investment will be legally responsible for the registration of the foreign investment and that it may appoint representatives to carry out the registrations on its behalf.
Mode 3 All sectors Resolution No. 4,533 of the National Monetary Council, viewed at: https://www.bcb.gov.br/pre/normativos/busca/downloadNormativo.asp?arquivo=/Lists/Normativos/Attachments/50287/Res_4533_v1_O.pdf
Effective 30 January 17
YES
Canada The government, under the Investment Canada Act, issued guidelines concerning the national security review of foreign investments. The guidelines provide further information on the review process and set out factors that the government may take into account when making a determination on grounds of national security.
Mode 3 All sectors "Guidelines on the National Security Review of Investments", Innovation, Science and Economic Department Canada, 19 December 2016, viewed at: https://www.ic.gc.ca/eic/site/ica-lic.nsf/eng/lk81190.html
Effective 19 December 16
YES
1 The inclusion of any measure in this Annex implies no judgement by the WTO Secretariat on whether
or not such measure, or its intent, is protectionist in nature. Moreover, nothing in the Annex implies any judgement, either direct or indirect, on the consistency of any measure referred to with the provisions of any WTO agreement.
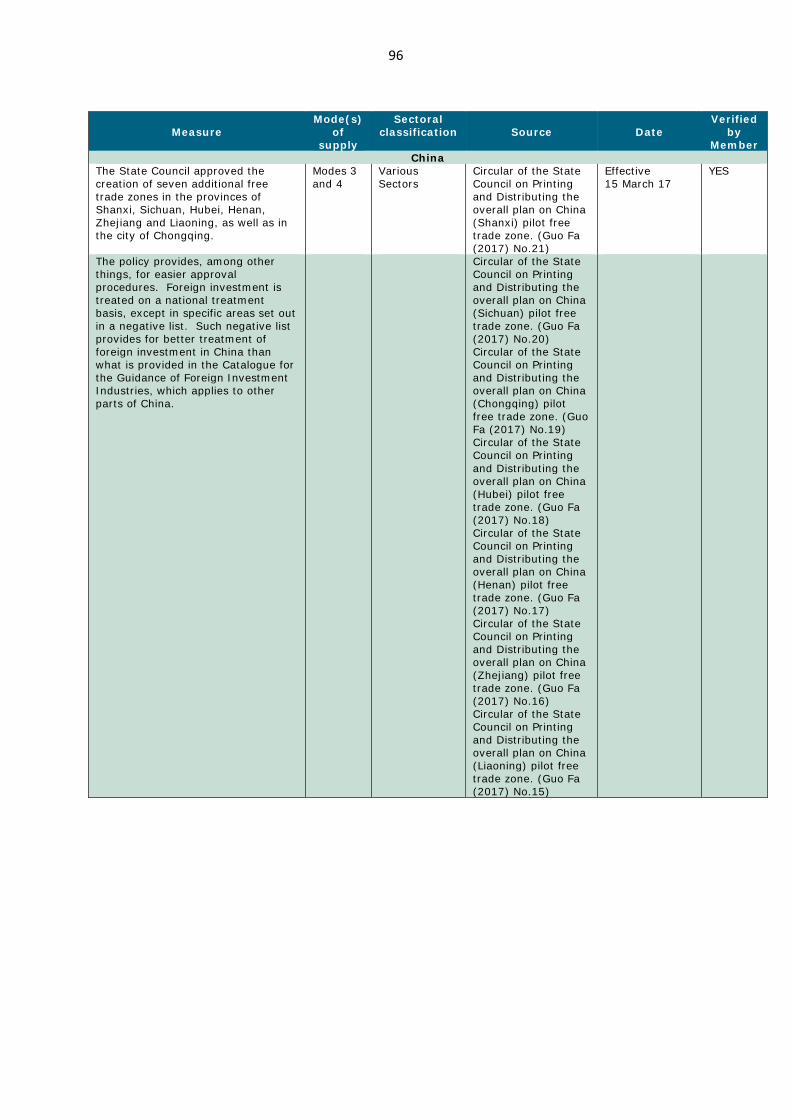
96
Measure
Mode(s) of
supply
Sectoral classification
Source
Date
Verified by
Member China
The State Council approved the creation of seven additional free trade zones in the provinces of Shanxi, Sichuan, Hubei, Henan, Zhejiang and Liaoning, as well as in the city of Chongqing.
Modes 3 and 4
Various Sectors
Circular of the State Council on Printing and Distributing the overall plan on China (Shanxi) pilot free trade zone. (Guo Fa (2017) No.21)
Effective 15 March 17
YES
The policy provides, among other things, for easier approval procedures. Foreign investment is treated on a national treatment basis, except in specific areas set out in a negative list. Such negative list provides for better treatment of foreign investment in China than what is provided in the Catalogue for the Guidance of Foreign Investment Industries, which applies to other parts of China.
Circular of the State Council on Printing and Distributing the overall plan on China (Sichuan) pilot free trade zone. (Guo Fa (2017) No.20) Circular of the State Council on Printing and Distributing the overall plan on China (Chongqing) pilot free trade zone. (Guo Fa (2017) No.19) Circular of the State Council on Printing and Distributing the overall plan on China (Hubei) pilot free trade zone. (Guo Fa (2017) No.18) Circular of the State Council on Printing and Distributing the overall plan on China (Henan) pilot free trade zone. (Guo Fa (2017) No.17) Circular of the State Council on Printing and Distributing the overall plan on China (Zhejiang) pilot free trade zone. (Guo Fa (2017) No.16) Circular of the State Council on Printing and Distributing the overall plan on China (Liaoning) pilot free trade zone. (Guo Fa (2017) No.15)
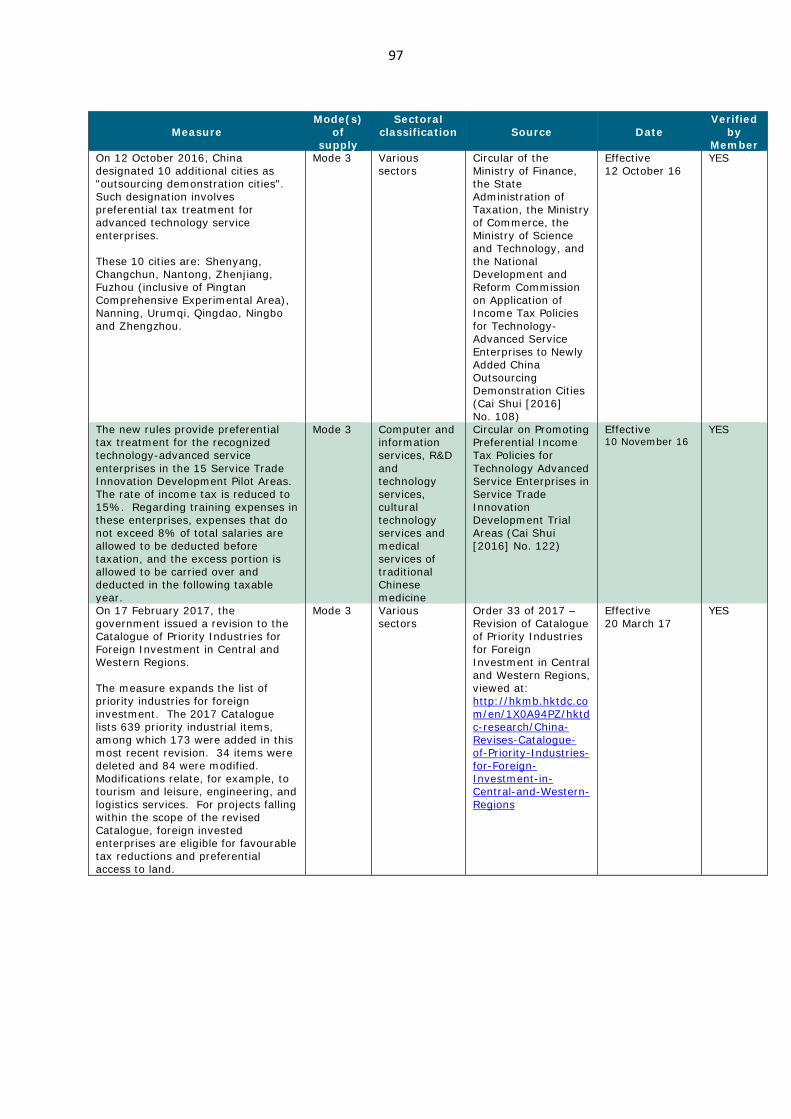
97
Measure
Mode(s) of
supply
Sectoral classification
Source
Date
Verified by
Member On 12 October 2016, China designated 10 additional cities as "outsourcing demonstration cities". Such designation involves preferential tax treatment for advanced technology service enterprises. These 10 cities are: Shenyang, Changchun, Nantong, Zhenjiang, Fuzhou (inclusive of Pingtan Comprehensive Experimental Area), Nanning, Urumqi, Qingdao, Ningbo and Zhengzhou.
Mode 3 Various sectors
Circular of the Ministry of Finance, the State Administration of Taxation, the Ministry of Commerce, the Ministry of Science and Technology, and the National Development and Reform Commission on Application of Income Tax Policies for Technology-Advanced Service Enterprises to Newly Added China Outsourcing Demonstration Cities (Cai Shui [2016] No. 108)
Effective 12 October 16
YES
The new rules provide preferential tax treatment for the recognized technology-advanced service enterprises in the 15 Service Trade Innovation Development Pilot Areas. The rate of income tax is reduced to 15%. Regarding training expenses in these enterprises, expenses that do not exceed 8% of total salaries are allowed to be deducted before taxation, and the excess portion is allowed to be carried over and deducted in the following taxable year.
Mode 3 Computer and information services, R&D and technology services, cultural technology services and medical services of traditional Chinese medicine
Circular on Promoting Preferential Income Tax Policies for Technology Advanced Service Enterprises in Service Trade Innovation Development Trial Areas (Cai Shui [2016] No. 122)
Effective 10 November 16
YES
On 17 February 2017, the government issued a revision to the Catalogue of Priority Industries for Foreign Investment in Central and Western Regions. The measure expands the list of priority industries for foreign investment. The 2017 Catalogue lists 639 priority industrial items, among which 173 were added in this most recent revision. 34 items were deleted and 84 were modified. Modifications relate, for example, to tourism and leisure, engineering, and logistics services. For projects falling within the scope of the revised Catalogue, foreign invested enterprises are eligible for favourable tax reductions and preferential access to land.
Mode 3 Various sectors
Order 33 of 2017 – Revision of Catalogue of Priority Industries for Foreign Investment in Central and Western Regions, viewed at: http://hkmb.hktdc.com/en/1X0A94PZ/hktdc-research/China-Revises-Catalogue-of-Priority-Industries-for-Foreign-Investment-in-Central-and-Western-Regions
Effective 20 March 17
YES

98
Measure
Mode(s) of
supply
Sectoral classification
Source
Date
Verified by
Member On 7 November 2016, China adopted a Cybersecurity Law that introduced various new requirements in relation to the collection, use and protection of personal information, the protection of "critical information infrastructure", the responsibilities of network service providers, and the preservation of sensitive information. Among other things, the Law requires "personal information and important data" collected and generated in China to be stored domestically. Security assessments by authorities will be conducted in relation to information and data transferred abroad pursuant to business requirements. More detailed regulations will be issued to support implementation of these provisions of the Law.
Multiple modes
All sectors Cybersecurity Law Effective 1 June 17
FINANCIAL SERVICES Argentina
The Resolution established that reinsurance and retrocession services may be supplied through local reinsurers and/or admitted reinsurers (cross-border reinsurers). Insurance companies will be allowed to place their risks directly with Admitted reinsurers according to the following scheme: up to 50% of their ceded premiums for contracts beginning 1 July 2017; up to 60% of their ceded premiums for contracts beginning on 1 July 2018; up to 75% of ceded premiums for contracts beginning on 1 July 2019. Before this Resolution, insurance companies could only reinsure individual risk with Admitted Reinsures above US$50 million in their entirety. The Resolution also amended the intra-group limitation whereby retrocession between a local reinsurer and a related company, which used to be 40% of the aggregate premiums in a given fiscal year, is increased to 75%. Finally, the new measure eliminated the requirement that Admitted Reinsurers register as a representative office or branch, and introduced a more straightforward registration procedure.
Mode 1 Reinsurance and retrocession services
Resolución SSN No. 40.422-E/2017. Published in the Official Gazette on 4 May 17, viewed at: https://www.boletinoficial.gob.ar/#!DetalleNorma/163138/20170504.
Effective 13 May 17
YES
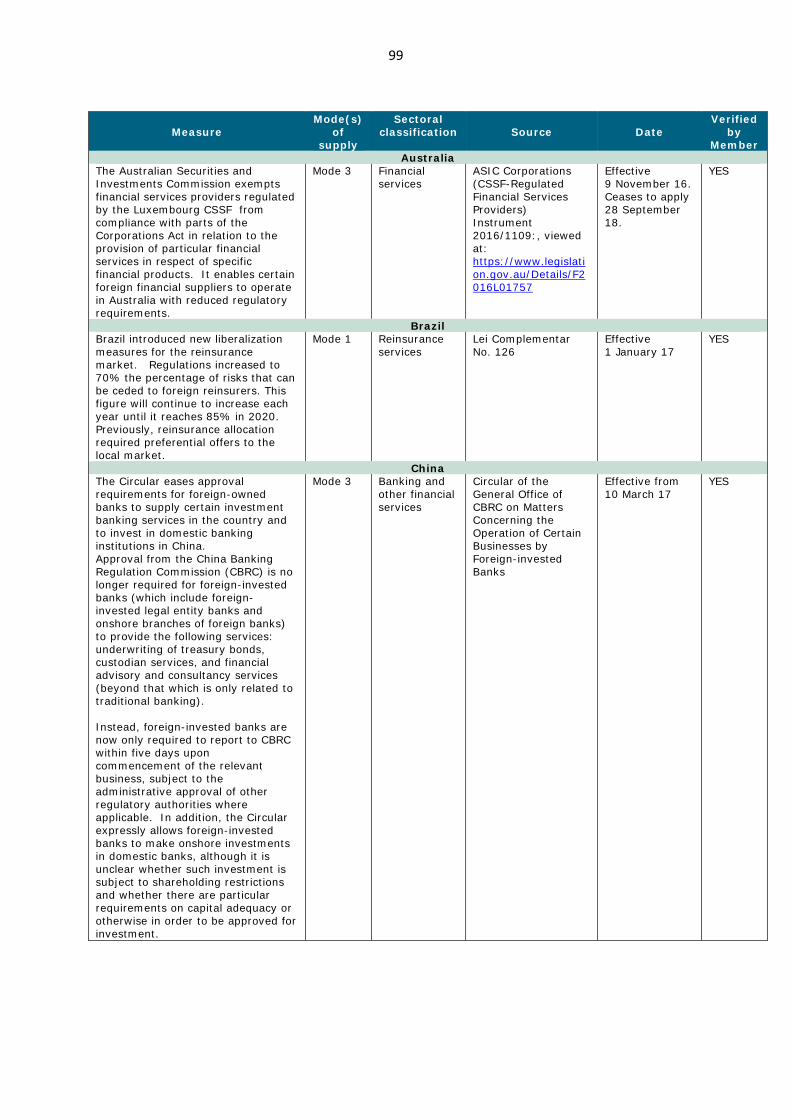
99
Measure
Mode(s) of
supply
Sectoral classification
Source
Date
Verified by
Member Australia
The Australian Securities and Investments Commission exempts financial services providers regulated by the Luxembourg CSSF from compliance with parts of the Corporations Act in relation to the provision of particular financial services in respect of specific financial products. It enables certain foreign financial suppliers to operate in Australia with reduced regulatory requirements.
Mode 3 Financial services
ASIC Corporations (CSSF-Regulated Financial Services Providers) Instrument 2016/1109:, viewed at: https://www.legislation.gov.au/Details/F2016L01757
Effective 9 November 16. Ceases to apply 28 September 18.
YES
Brazil Brazil introduced new liberalization measures for the reinsurance market. Regulations increased to 70% the percentage of risks that can be ceded to foreign reinsurers. This figure will continue to increase each year until it reaches 85% in 2020. Previously, reinsurance allocation required preferential offers to the local market.
Mode 1 Reinsurance services
Lei Complementar No. 126
Effective 1 January 17
YES
China The Circular eases approval requirements for foreign-owned banks to supply certain investment banking services in the country and to invest in domestic banking institutions in China. Approval from the China Banking Regulation Commission (CBRC) is no longer required for foreign-invested banks (which include foreign-invested legal entity banks and onshore branches of foreign banks) to provide the following services: underwriting of treasury bonds, custodian services, and financial advisory and consultancy services (beyond that which is only related to traditional banking). Instead, foreign-invested banks are now only required to report to CBRC within five days upon commencement of the relevant business, subject to the administrative approval of other regulatory authorities where applicable. In addition, the Circular expressly allows foreign-invested banks to make onshore investments in domestic banks, although it is unclear whether such investment is subject to shareholding restrictions and whether there are particular requirements on capital adequacy or otherwise in order to be approved for investment.
Mode 3 Banking and other financial services
Circular of the General Office of CBRC on Matters Concerning the Operation of Certain Businesses by Foreign-invested Banks
Effective from 10 March 17
YES

100
Measure
Mode(s) of
supply
Sectoral classification
Source
Date
Verified by
Member India
Every Indian insurer must comply with the order of preference for cessions by Indian insurers prescribed by Regulation 28(9) of the Branch Office Regulations. The order of preference contained in Regulation 28(9) sets out the hierarchy between the various entities with which an Indian insurer can place its reinsurance business. The regulations specify that an Indian insurer first has to approach India's official reinsurer GIC Re before reaching out to the branch operations of foreign reinsurers to place any reinsurance deals. After exhausting these two channels, the insurers are allowed to approach reinsurers located in Special Economic Zones (SEZs), Indian primary insurers, and, lastly, the cross-border reinsurers located outside the country.
Mode 1
Reinsurance IRDAI circular (IRDAI/NL/CIR/RIN/021/01/2017), viewed at: https://www.irda.gov.in/admincms/cms/whatsNew_Layout.aspx?page=PageNo3053&flag=1.
Effective 16 January 17
YES
Indonesia Indonesia announced that it will amend existing regulations in order to limit foreign ownership of insurance companies to 80%. The amendment will be applied to companies with foreign ownership below 80% and to new insurance companies. For existing insurance companies where foreign ownership exceeds 80%, adjustments would not be required, except in the context of new capital injections. The initial regulation from 1992 capped foreign ownership at 80%. In 1999, in the wake of the financial crisis, authorities allowed foreign investors to exceed the ceiling.
Mode 3 Insurance services
Viewed at: http://www.kemenkeu.go.id/en/Berita/minister-finance-and-house-representatives-discussed-limits-foreign-ownership-insurance
Announced on 18 April 17
YES
The Regulation imposes a 20% limit on foreign ownership of enterprises that offer electronic payment processing services. The new limit applies to (i) new enterprises in the electronic payments services sector, (ii) existing enterprises that expand into this sector, and (iii) enterprises already active in the sector that experience a change of ownership.
Mode 3 Electronic payment processing services
Bank of Indonesia Regulation No. 18/40/PBI/2016 on Payment Transaction Processing, issued on 14 November 2016, viewed at: http://www.bi.go.id/id/peraturan/sistem-pembayaran/Pages/pbi_184016.aspx
Effective 15 November 16
YES

101
Measure
Mode(s) of
supply
Sectoral classification
Source
Date
Verified by
Member TELECOMMUNICATIONS/ICT/ AUDIOVISUAL SERVICES
Argentina On 2 January 2017, the government issued Decree 1340, which established rules and standards regarding the convergence between television, telecommunication, and information technology services. The decree allows licensees of such services to supply certain convergent services as of 1 January 2018 within specified territories. This includes, for example, the operation of telephone companies in the cable TV market, or the supply of telecommunication services by satellite TV companies. The decree allows satellite TV suppliers that already hold licenses for information technology services to continue providing such services, including broadband Internet access.
Multiple modes
Telecommunication and audiovisual services
Presidential Decree 1340, pursuant to Presidential Decree 267/2015 and Laws 27.078 and 26.522, viewed at: http://servicios.infoleg.gob.ar/infolegInternet/anexos/270000-274999/270115/norma.htm
Effective 2 January 17
YES
Australia The government committed A$220 million to the Mobile Black Spot Program to improve mobile coverage in regional and remote Australia. Rounds 1 and 2 of the programme will deliver 765 new or upgraded mobile base stations across Australia. The rollout of these base stations is expected to be completed by the end of 2018. Further, the Government has allocated A$60 million to target 125 specific priority locations.
Mode 3 Mobile telecommuni-cation services
Department of Communications and the Arts https://www.communications.gov.au/what-we-do/phone/mobile-services-and-coverage/mobile-black-spot-program
Ongoing. Round 2 was launched on 1 December 16. The rollout of rounds 1 and 2 base stations is expected to be completed by the third quarter of 2018.
YES
China The new Film Industry Promotion Law, adopted on 7 November 2016, sets out new requirements and procedures in relation to production, distribution, review, and exhibition of feature films in China. The law requires local theatre operators to ensure that the screening time for Chinese films is no less than 2/3 of the annual screening time of all films. The law reiterates that coproductions are entitled to the treatment granted to films produced by domestic entities. The law also aims to simplify the procedures for state approval of scripts. Moreover, it prohibits work with foreign organizations or individuals that have damaged the country's honour and interests, or threatened social stability. The law also transfers to the provincial level a number of administrative responsibilities, such as examination and approval of movie production, release, and projection.
Multiple modes
Production, distribution and exhibition of motion pictures
Film Industry Promotion Law
Effective 1 March 17
YES

102
Measure
Mode(s) of
supply
Sectoral classification
Source
Date
Verified by
Member European Union
The Directive on security of network and information systems (the NIS Directive) was adopted by the European Parliament on 6 July 2016. The Directive concerns measures to ensure a high common level of network and information security across the European Union.
Multiple modes
Telecommunication services
Directive (EU) 2016/1148 of the European Parliament and of the Council of 6 July 16
The Directive entered into force on 8 August 16. Member States are given 21 months to transpose the Directive into national laws and 6 months more to identify operators of essential services.
YES
Indonesia The Ministry of Communications and Informatics issued a new regulation on data protection, pursuant to the Electronic Information and Transactions Law of 2008 and Government Regulation 82 of 2012. The regulation requires electronic system providers (ESPs) to have data centres and disaster recovery centres located in Indonesia. The regulation also requires ESPs to get express written consent for the collection and utilisation of personal data, and to store personal data in encrypted form. Further, the regulation sets out procedures for cross-border data transfers, which are subject to coordination with the Ministry.
Modes 1 through 3
Electronic system services
Ministry of Communication and Informatics (MOCI) Regulation 20 of 2016 on Personal Data Protection in Electronic Systems
1 December 16 YES

103
Measure
Mode(s) of
supply
Sectoral classification
Source
Date
Verified by
Member Russian Federation
On 1 May 2017, the President of the Russian Federation signed a Federal Law that limits foreign participation in certain audiovisual services. The new law applies to owners of Internet websites, website pages, information systems, and computer software that are used for online distribution of collections of audiovisual works, access to which is provided for a fee or on the condition of viewing advertising targeted at users in the Russian Federation, and which are accessed by more than 100,000 users per day in the Russian Federation. The measure provides that only a Russian legal entity or Russian Federation citizen that does not hold the citizenship of another state can own such websites and systems. Unless stated otherwise in an international agreement of the Russian Federation, foreign persons2 that own an information resource used for online distribution of collections of audiovisual works that has less than 50% of its users in the Russian Federation are not allowed to own more than 20% of the charter capital of such Russian legal entities, unless they receive permission from a government commission. The law will not apply to Internet search systems or information resources that primarily distribute content posted by individual Internet users.
Modes 1 & 3
Online distribution of collections of audiovisual works
Federal Law No. 87-FZ of 1 May 17 "On Amendments to the Federal Law on Information. Information Technologies and Information Protection" and Certain Legislative Acts of the Russian Federation.
Effective 1 July 17
YES
United States of America The President of the United States signed a resolution that was recently passed by the Senate and House and which brings an end to the Federal Communications Commission's earlier broadband privacy rules from the previous administration. Internet Service Providers are now legally allowed to commercialise user data without their explicit permission.
Multiple modes
Telecommuni- cation services
SJ Res. 34
4 April 17
2 A foreign state, an international organization, as well as an organization controlled by them, a foreign
legal entity, a Russian legal entity with foreign participation in the charter capital of more than 20%, a foreign citizen, a person without citizenship, a citizen of the Russian Federation holding citizenship of another state, and their affiliates.

104
Measure
Mode(s) of
supply
Sectoral classification
Source
Date
Verified by
Member AIR TRANSPORT SERVICES
China China has implemented additional measures concerning foreign investment in services relating to air transport: - Service suppliers from Hong Kong, China and Macao, China are allowed to invest in aircraft maintenance, airline catering, air cargo transportation and warehousing, parking lot and ground service items (excluding security-related services) on a wholly-owned basis. - The requirements that service suppliers from Hong Kong, China and Macao, China go through economic needs tests before obtaining a business licence for setting up joint venture computer reservation system (CRS) enterprises are abolished. - The new measure provides for the following within the China (Shanghai) Pilot Free Trade Zone and other pilot free trade zones: foreign investors are allowed to establish and invest in wholly-owned air transportation sales agency enterprises; foreign investors are allowed to set up and invest in wholly-owned enterprises to undertake the business of air cargo transportation and warehousing, ground services, airline catering and parking lots; the requirement that the Chinese side shall hold controlling shares in the general aircraft maintenance joint venture enterprise is relaxed, and foreign investors are allowed to invest in general aircraft maintenance projects in the form of equity or cooperative joint ventures; and, the requirement that foreign investors that invest in aircraft maintenance business shall be under the obligations to contract business on the international maintenance market is abolished.
Mode 3 Air transport Supplementary Requirements on Foreign Investment in China's Civil Aviation Industry
Effective 1 May 17
YES

105
Measure
Mode(s) of
supply
Sectoral classification
Source
Date
Verified by
Member SERVICES SUPPLIED THROUGH THE MOVEMENT OF NATURAL PERSONS
Australia On 18 April 2017, the government of Australia announced that the Temporary Work (Skilled) visa (subclass 457 visa) will be abolished and replaced with a new Temporary Skill Shortage (TSS) visa in March 2018. Implementation of this reform is taking place in different stages. As of 19 April 2017, the lists of occupations that underpin the 457 visa have been condensed from 651 to 435 occupations, with 216 occupations removed and access to 59 other occupations restricted. The occupation lists under the 457 visa have been renamed. First, the Consolidated Sponsored Occupation List (CSOL) is renamed the Short Term Skilled Occupations List (STSOL). The list will be updated every six months. For occupations under this list, the maximum duration of stay is of two years. Second, the Skilled Occupations List (SOL) is renamed the Medium and Long Term Strategic Skills List (MLTSSL), which concerns occupations that are deemed to be of high value to the Australian economy. The maximum duration of stay for these occupations remains of four years.
Mode 4 All sectors https://www.border.gov.au/Trav/Work/457-abolition-replacement
Commenced on 18 April 17 and to be completed by March 18
YES
Canada Immigration, Refugees and Citizenship Canada (IRCC) eliminated the four-year cumulative duration rule for temporary foreign workers in Canada. This rule meant that certain foreign workers became ineligible to work in Canada for four years upon completion of four years of work in Canada.
Mode 4 All sectors Viewed at: http://www.cic.gc.ca/english/resources/tools/temp/work/cumulative.asp
Effective 13 December 16
YES

106
Measure
Mode(s) of
supply
Sectoral classification
Source
Date
Verified by
Member France
The new law creates a category of "ICT Mobile Permits", which allows foreign nationals holding an intra-corporate transferee permit in one EU Member State to work temporarily in France without the need to obtain a new work permit. It also includes an "ICT Trainee" permit that entitles foreign nationals to enter France for training purposes in a company of the same corporate group for up to one year, as well as a corresponding "ICT Trainee Mobile" permit. Moreover, the law simplifies the application process for intra-company transferees holding specialist or senior management positions, and introduces a short term work permit exemption for assignment up to 90 days in selected sectors and for specific types of assignments.
Mode 4 All sectors Loi n° 2016-274 du 7 mars 2016 relative au droit des étrangers en France, viewed at: http://www.immigration.interieur.gouv.fr/Info-ressources/Actualites/L-actu-immigration/La-loi-du-7-mars-2016-relative-au-droit-des-etrangers
Effective 1 November 16
YES
India India has further expanded its e-Visa programme. As of 24 May 2017, nationals from a total of 162 countries are eligible under the programme, which enables international travellers whose sole objective in visiting India concerns recreation, sight-seeing, casual visit to meet friends or relatives, short duration medical treatment or casual business visit to enter the territory for a period of up to 60 days. The nomenclature of the existing e-Tourist Visa has been changed to e-Visa, with three subcategories: e-Tourist Visa, e-Business Visa, and e-Medical Visa.
Mode 4 All sectors Viewed at: https://indianvisaonline.gov.in/visa/tvoa.html
Effective 30 March 17
YES
A new Intern Visa category was introduced for foreign nationals seeking to intern in Indian companies, educational institutions and NGOs. It permits a stay of up to one year, provided that studies were completed recently and that a minimum salary threshold is met. A quota of 50 Intern Visas per year has been set for each Indian Mission, except for countries where the population of foreign nationals of Indian origin exceeds one million, where it has been set at 100 visas per year.
Mode 4 All sectors Viewed at: https://www.fragomen.com/knowledge-center/immigration-alerts/intern-visa-category-introduced
Effective 1 April 17
YES

107
Measure
Mode(s) of
supply
Sectoral classification
Source
Date
Verified by
Member Korea, Rep. of
New guidelines limit activities under the Short Term Travellers visa to non-profit activities (attending meetings, negotiations, finalizing contracts, etc.). All for-profit activities, including the supply of services pursuant to a contract (e.g. installation and repair or imported machinery), now require an employment visa before entry.
Mode 4 All sectors Viewed at: http://www.ey.com/Publication/vwLUAssets/Korea_limits_permissible_business_visitor_activities/$FILE/Korea%20-%20Immigration%20-%20Business%20visitor%20activities.pdf visa.go.kr
Effective 8 March 17
YES
United Kingdom The Tier 2 Intra-Company Transferee visa category has been reduced to two sub-categories, namely Long Term Staff and Graduate Trainees. The Short Term Staff sub-category has been eliminated. Another change that was introduced is to exempt intra-company transferees earning over £73,900 from the requirement to have at least 12 months of employment experience. Changes have also been made to the Tier 2 (General) visa category, including an increase in the salary threshold above which no labour market test is applied.
Mode 4 All sectors Viewed at: https://www.gov.uk/tier-2-intracompany-transfer-worker-visa/overview
Effective 6 April 17
YES
__________