30-DAY HOSPITAL READMISSION PREDICTION MODELS: DESIGN ...
62
30-DAY HOSPITAL READMISSION PREDICTION MODELS: DESIGN, PERFORMANCE and GENERALIZABILITY by Brett F. Cropp A thesis submitted to Johns Hopkins University in conformity with the requirements for the degree of Master of Science Baltimore, Maryland March, 2016
Transcript of 30-DAY HOSPITAL READMISSION PREDICTION MODELS: DESIGN ...

30-DAY HOSPITAL READMISSION PREDICTION MODELS: DESIGN, PERFORMANCE and GENERALIZABILITY
by
Brett F. Cropp
A thesis submitted to Johns Hopkins University in conformity with the requirements for the
degree of Master of Science
Baltimore, Maryland
March, 2016

ii
Abstract
Following the introduction of the Hospital Readmissions Reduction Program (HRRP) in 2012,
there has been a push in research and quality improvement efforts to reduce 30-day hospital
readmissions. While the needle has moved slightly downward for the high-risk conditions
targeted, the majority of hospitals have received some penalty in 2015, totaling over $400
million. Having prediction models for avoidable readmissions would help providers in allocating
resources and designing interventions for high-risk individuals. This systematic review searched
for peer-reviewed efforts to predict 30-day readmissions published since 1990. In total, 428
articles were assessed for inclusion / exclusion criteria, resulting in 38 articles surviving all
criteria. These articles were coded for several factors influencing study design including research
setting, data sources, cohort size and characteristics. Further, methodologies were assessed for
models implemented, input variable types, validation procedures, and model output and
performance. Most studies used electronic medical or administrative records, while a few
studies integrated additional data sources such as patient registries and direct patient follow-up.
Cohorts varied, with congestive heart failure being the most frequently studied and, surprisingly,
only one study developing a combined model for all three conditions originally included in the
HRRP. The vast majority of studies used multivariate logistic regression to predict 30-day
readmission outcomes, with varied performance. A few efforts were made to include novel
statistical methods for readmission prediction, but their ability to improve performance was
inconclusive. Unexpectedly, only one study integrated a prediction model into a clinical
workflow. The low number of integration efforts could be a result of the difficulty in generating
highly accurate models. As the HRRP expands to more conditions, and 30-day readmission gains
traction as a quality metric, it is imperative that hospitals are fully informed when deciding
which readmission prediction models to implement and when to use them. Several studies
suggested model generalizability as a limitation and there were also several key pieces of
information missing from some studies. To help assess model generalizability and ensure
consistent reporting, this review proposes a modified checklist for 30-day readmission
prediction efforts.

iii
Contents Abstract ............................................................................................................................................ ii
Introduction ..................................................................................................................................... 1
Methods ........................................................................................................................................... 6
Sources ......................................................................................................................................... 6
Inclusion/Exclusion Criteria ......................................................................................................... 8
Article Coding ............................................................................................................................... 9
Results ............................................................................................................................................ 13
Study and Data Context ............................................................................................................. 13
Data Sources .............................................................................................................................. 15
Study Samples ............................................................................................................................ 16
Model Inputs .............................................................................................................................. 18
Models Used .............................................................................................................................. 22
Model Outputs and Validation .................................................................................................. 24
Model Accuracy ......................................................................................................................... 25
Important Factors Discovered ................................................................................................... 27
Technologies and Model Implementation ................................................................................. 28
Study Limitations ....................................................................................................................... 29
Discussion ...................................................................................................................................... 29
Acknowledgements........................................................................................................................ 38
Appendix ........................................................................................................................................ 39
Table A1 ..................................................................................................................................... 39
Inclusion / Exclusion Criteria ...................................................................................................... 50
References ................................................................................................................................. 51
Curriculum Vitae ............................................................................................................................ 57

1
Introduction In 2012, the Hospital Readmissions Reduction Program (HRRP) was established under
the Affordable Care Act, enacting a set of policies to define and measure hospital readmissions
for the purposes of penalizing poorly performing hospitals. This program requires the Center of
Medicare and Medicaid Services (CMS) to measure readmissions events for a set of specific
medical conditions and adjust reimbursements for hospitals participating in the inpatient
prospective payment system (IPPS) [1]. The program defines a readmission event as an
"admission to a hospital within 30 days of a discharge from the same or another hospital” [1].
Initially, this program intended to reduce unplanned readmissions for three conditions (acute
myocardial infarction (AMI), congestive heart failure (CHF) and pneumonia (PNA)). Since its
original inception, the list of reportable conditions has been expanded to include chronic
obstructive pulmonary disease, elective total hip arthroplasties and total knee arthroplasties.
Currently, CMS includes all-cause readmissions for all of the conditions above, meaning that a
readmission event is counted towards a hospital’s total count regardless of whether the cause
was the initial admitting diagnosis.
For each hospital, an “excessive readmission ratio” (ERR) is calculated for each
condition, which compares that hospital’s readmission rate against the national average. The
excessive readmission ratio is risk-adjusted to account for relevant risk factors (e.g.
demographics, co-morbidities) that are known to impact an individual’s propensity for
readmission [1]. Furthermore, CMS uses an algorithm to remove planned admissions from the
calculations to avoid inclusion of routine post-discharge follow-ups [2,3]. Currently, poorly
performing hospitals can be penalized up to a 3% reduction of reimbursement for all Medicare
discharges. In the first year of the program, when the maximum reduction was 1% of

2
reimbursements, more than 2,000 hospitals accounted for nearly $300 million in financial
penalties due to high ERRs [4].
Readmission has been targeted not only because of relatively stagnant historical rates,
but also due to of the high associated costs. The risk-adjusted readmission rates for the initial
three conditions were stagnant between 2002 and 2009, with PNA and AMI hovering around
18% and CHF around 24% by 2009 [4,5]. A study on Medicare data from 2003 to 2004 calculated
that nearly 20% of Medicare patients were readmitted within 30-days with an estimated
financial impact of over $17 billion [6]. All-cause Medicare readmissions accounted for $24
billion in total costs in 2011, representing more than half of the $41 billion in total hospital costs
for all-cause adult readmission events [7]. The average cost of a Medicare readmission was
$13,800 in 2013, which is $700 more than the average cost of an index admission during that
same year [8]. Thus, not only is there room for improvement in terms of quality of care and care
coordination to improve these relatively unchanged rates, but there is also a significant cost to
be captured by reducing readmissions.
Following the introduction of HRRP, Medicare rates of readmission have progressed
incrementally. All-cause Medicare readmissions were down to 17.3% by 2013 (compared to 20%
for data a decade prior), while the readmission rates for all other forms of coverage (Medicaid,
commercial and uninsured) rose between 2009 and 2013 [8]. The readmission rates for all three
conditions targeted by HRRP began to drop in 2012, with both PNA and AMI dropping below
18% for the performance time period of July 2010 to June 2013. Congestive heart failure
decreased by 2% over three consecutive performance periods, spanning June 2008 to June
2013. However, a significant proportion of hospitals received Medicare reimbursement
penalties in 2015 [9]. A total of 78% of hospitals had reimbursement reductions in FY2015 for a

3
sum of $428 million in penalties [9]. While the total penalties issued, in addition to the
proportions of hospitals receiving those penalties, increased in the 3rd year following HRRP, one
must note that the penalties are based on a 3-year performance period and there would be a lag
for performance improvements to appear in monetary outcomes. Furthermore, the increase in
the maximum penalty and number of conditions included in HRRP could influence the upward
trend in total financial penalties received by hospitals.
The lack of substantial progress is partially due to the difficulty and cost of implementing
readmission reduction programs [10]. A CMS-funded quality improvement initiative
implemented in 14 communities only found slight improvements in 30-day readmission rates
compared to similar communities, while costing several million dollars to implement [11].
However, with the range of conditions and maximum penalties broadened, there is more
incentive to expand quality improvement initiatives, discharge planning and care coordination.
Importantly, not all readmissions are avoidable - a key challenge in the adoption of
readmission reduction programs and an argument against the HRRP penalties. In fact, there is
much variability published in terms of the proportions of readmissions that are unavoidable.
Two studies estimated avoidable readmissions at less than 30% [11]. One systematic review of
readmissions studies found that the range of reported avoidable urgent readmissions was
between 5% and 78% [12]. These estimates were found to be dependent on the type of patient
information used to determine the degree to which a readmission was avoidable. Accurately
classifying readmissions as avoidable is crucial for the proper implementation of penalties that
are more representative of a hospital’s performance, and in the development of methods to
intervene on such readmissions. There are many cases in which a readmission cause is
preventable, including hospital acquired infections and complications, premature discharge, lack

4
of medication reconciliation, and poor discharge instructions and planning [13]. However,
interventions addressing these cases are costly for the broader population and it could take
several years for a hospital to recapture the cost of implementing such programs.
There is a growing demand for solutions to assist hospital systems in controlling
readmission rates. Coinciding with the introduction of the HRRP program was the passing of the
Health Information Technology for Economic and Clinical Health (HITECH) act in 2009. This
legislation established a set of technical specifications surrounding the adoption of Electronic
Health Records (EHR), named “Meaningful Use”, that hospitals were required to meet in order
to receive financial incentives. Since its adoption, the HITECH stimulus has driven the rapid
adoption of EHRs in hospitals. By 2014, 97% of non-federal US hospitals had installed a certified
EHR, and 75% had a basic EHR system, which includes electronic clinical information,
computerized provider order entry and diagnostic results management [14]. This basic EHR
adoption is almost a 3-fold increase from 2011 (27.6%), and by 2014 34% of hospitals had
comprehensive EHRs, which include decision support tools [14]. The widespread adoption of
EHRs could benefit hospitals adopting readmission research and interventions, providing more
immediate, accessible and comprehensive patient information during the index admission, while
also providing opportunities for clinical decision support.
With the adoption of EHRs, hospitals and providers have the ability to passively search
and aggregate patient and population information more efficiently and are more capable of
pushing notifications directly to providers during the course of an admission. Having the ability
to identify individuals or sets of individuals at higher risk for 30-day readmission would enable
providers to divert or increase resources necessary to prevent a readmission. Beyond broad
administrative procedures to target avoidable readmissions, hospitals can begin to use

5
knowledge of specific risk factors for readmissions for highly targeted interventions. Static
factors that negatively impact readmission rates such as patient demographics and community
factors (e.g. social support and poverty rates) cannot be overcome within the course of an
inpatient admission [5]. However, mutable factors, such as medication interactions or blood-
glucose levels, can be accessed directly from a medical record, input into a decision model and
addressed at discharge or through follow-up.
Other data sources beyond medical records may augment the collection of patient
readmission risk factors and provide new opportunities for intervention. Administrative claims
data affords the opportunity for more standardized, albeit less expansive, patient data sets
across multiple providers. Additionally, technologies such as Health Information Exchanges
(HIE), disease registries, and Personal Health Records (PHR) are promising in terms of their
ability to improve care coordination, medical record completeness and communication with
patients [15]. While integration of patient data across multiple sources and institutions may be
ideal for data record completeness and introduction of novel risk factors, it may also raise the
difficulty and cost of implementation for an intervention.
To begin to understand the drivers of readmission, risk-factor analyses have been
employed on retrospective data. These analyses have begun to pinpoint common factors in
patients who are readmitted, including co-morbidities, the number of prior admissions and
social factors such as socioeconomic status [15]. While univariate tests (e.g. descriptive
statistics) or bi-variate analyses (e.g. student’s t-test, χ-square) can pinpoint patterns of a single
risk factor and its relationship with readmission, they do not account for interactions between
the large set of a patient’s demographic and biological characteristics. Building multi-variate
models allows for the inclusion of multiple dependent variables and investigates their combined

6
influence on a measured outcome. Being able to build highly predictive multi-variate models for
30-day readmission would be of great value not only for hospitals to pinpoint individuals at high-
risk, but also for organizations such as CMS to enhance risk-adjustment in their ERR
measurements [15].
Given the relatively recent introduction of the HRRP and the evolving landscape of
healthcare data storage technologies, it is vital to gain an understanding of the limitations and
drivers of success in readmission prediction model building. While the incentives for
readmission risk prediction and stratification are clear, there are few examples of successful
development and implementation of such models [16]. Factors influencing readmission
prediction model performance can be teased apart through collecting detailed information on
the study settings, study design and types of models employed. Increasing the sample size of
index admissions may provide more accurate models; however, prediction models may be
prone to overfitting and should be supplemented with external validation. Additionally, the
generalizability of readmission models could be investigated by exploring the types of patient
cohorts and data sources used during readmission model creation. This systematic review
surveyed published prediction models for 30-day readmission to understand the study factors
that influenced model development, performance and generalizability.
Methods
Sources
In June 2014, the PubMed and Google Scholar databases were used to search for
scholarly articles relating to 30-day hospital readmission risk prediction. To identify studies
which investigated hospital readmission, both sources were searched for article titles that
included either terms “hospital readmission” or “rehospitalization.” To further identify articles
7
relating to readmission risk factors or prediction, these terms were conjoined with titles
containing “prediction” or “risk” (see Table 1 for exact queries issued). Both searches were
limited to published dates between January 1st, 1990 and June 1st, 2014. A similar search was
performed against Google Scholar; however, this query was not constrained to the title of the
articles. Google Scholar ranks articles by relevance to the search terms, and manual inspection
of the articles found that after the 140th ranked article, articles were not relevant to the topic.
Additionally, all articles selected were printed in English in peer-reviewed journals. Article
citations were downloaded and managed through Zotero, an open-source reference manager.
Recent changes in reimbursement structure and a shift in focus towards outcomes-
based care are associated with an increase in research related to hospital readmission. In order
to ensure the most recent research was included in the current study, a further search query
was conducted in October 2015 for articles published since June 1st, 2014, returning an
additional 191 articles after duplicate removal. Again, manual inspection of articles was used to
determine the limit of articles obtained through Google Scholar. The second search returned an
additional 191 articles after duplicate removal.
To ensure all articles relating to hospital readmission risk models were captured, articles
that were not found in the search results but were contained in the final list of the systematic
review by Kansagara et al. were included. This resulted in 12 additional articles added to the
inclusion / exclusion criteria filtering stage. The failure to identify these 12 additional articles
may be a result of search terms being too specific or limitations of the Google Scholar relevancy
algorithm.

8
Table 1: List of sources used, queries executed on sources and resulting article count.
Inclusion/Exclusion Criteria
Inclusion and exclusion criteria (see Appendix IEC) were determined through an abstract
review, or a full-text review when abstracts were insufficient. Studies were included if they
measured a readmission event using a time-frame defined as within 30-days, 1 month or 28-
days post-discharge. This inclusion was used to most closely approximate the 30-day time
window used for CMS reimbursement adjustment. As this study was mainly focused on the
methods of readmission prediction, articles from outside the United States, or containing non-
US data, were included. Systematic reviews and meta-analyses, editorial or abstract-only
articles, and studies limited to pediatric groups, defined as cohorts under 18 years old, were
excluded. Finally, only articles that built and/or tested a prediction model for hospital
readmission were included. For the purposes of this review, prediction models were defined as
an analytic method using a set of variables relating to the patient and outputting a probability or
prediction that the patient would have an unplanned admission after discharge.
To ensure inter-rater reliability, a subset of the articles was selected for IEC assessment
by a researcher blind to the assessments of the other individual (Figure 1). Any discrepancies
between the reviewers on individual criteria were resolved through discussion between the two
Source Query Date Range Articles
1/1/1990-6/1/2014 136
6/1/2014-10/1/2015 38
1/1/1990-6/1/2014 140
6/1/2014-10/1/2015 170
Systematic Reviews 12
PubMed
(((hospital[Title] AND
readmission[Title]) OR
(rehospitalization[Title])) AND
(prediction[Title] OR risk[Title]))
Google Scholar
(hospital readmission OR
rehospitalization) AND (risk OR
prediction)

9
reviewers. The full list of criteria was updated based on the clarifications discussed by the
reviewers. All articles included in the coding stage met the all of the inclusion / exclusion criteria
listed above. Following article coding, another researcher sampled the coding results to check
for errors and validate criteria.
Figure 1: Literature Flow chart describing source querying and inclusion / exclusion process
Article Coding
To further characterize hospital readmission studies, 17 unique factors were coded (see
Table 2). These factors were classified into four categories, including research context, study
sample, methodology and model evaluation. To describe the research context, the general
characteristics of the study setting and design were coded, specifically whether the study data
was derived from academic or non-academic hospital contexts (or other contexts, such as health
information exchanges or patient registries), and the size of the hospital network if available.

10
The existence of any data sources listed in the article was also recorded, as well as if the source
was in electronic form, if noted in the article. In particular, it was noted whether the
readmission-related data was extracted from a medical record (e.g. patient charts or EHR),
administrative records, surveys or other sources. These were deemed important to assess the
ease of implementation and generalizability of the model to other settings.
Under the study sample, population attributes were recorded, including general
inclusion and exclusion criteria into the study cohort, the type of cohort used and the sample
size. Sample size was calculated as the sum of distinct index admissions used in all models and
cohorts (e.g. derivation and validation). The type of cohort ranged from an all-cause readmission
prediction model to models predicting readmission in patients with specific conditions,
undergoing surgical procedures, within a specific age range or any other cohort definition
provided.
Table 2: List of Categories and Factors used to Code Hospital Readmission Studies
Category Factors
Research Context
Study setting
Data source & description
Number of hospitals within network
Outcome measured (readmission window)
Type of study (retrospective vs. prospective)
Data sources
Specific technologies listed
Study Sample
Population sample size
General inclusion / exclusion
Type of cohort
Methodology
Types of variables included in model
Analytical models used
Existence of derivation / validation Sets
Model Evaluation Model output

11
Model accuracy
Important factors discovered
Implementation into workflow
Due to a wide variety of factors that could influence readmissions for different cohorts,
the variables tested were characterized into categories, rather than using the specific variables
themselves. Categories for model input included demographic, social, diagnostic, procedural,
laboratory, behavioral, mental status, hospital resource utilization, history, vitals, and various
indexes. Descriptions and examples of each category can be found within Table 3. All analytical
models used in each study that intended to predict readmission risk were recorded. Categories
for methods included bi-variate analysis (which focused on a single variable’s impact on
readmission odds, often used to identify variables for inclusion in a multi-variate model), multi-
variate logistic regression, Cox proportional hazards, or other analyses (e.g. Support Vector
Machines, Bayesian networks). The existence of model training or testing was coded, whether
executed through internal validation methods like bootstrapping, sample splitting or external
validation. The sample split percentages were also recorded.
Table 3: Readmission prediction model input categories, with descriptions and examples
Model Input Variable Category Category Description Examples
Demographic Traditional demographic factors Age, gender, ethnicity
Social
Socioeconomic factors beyond those typically collected upon admission
Social support, impoverished, residence distance to hospital
Diagnostic
The presence of a primary diagnosis and / or co-morbidities
ICD-9/10 codes, diagnostic categories, co-morbidities
Procedure
The occurrence of a surgical procedure during the index admission and any resulting complications
CPT codes, occurrence of a general procedure, procedure complications

12
Laboratory
Any laboratory codes, results or a cumulative number of tests during index admission
Albumin, Hbac1, GFR, BUN
Indexes
Composite scores compiled from patient information
Charlson Co-morbidity Index, ASA Class, Elixhauser Co-morbidity Index
Vitals
Vital sign measurements collected during the index admission
BMI, blood pressure, respiratory rate, blood oxygenation
Medications
Presence of specific medications, types of medications or the total number of medications the patient is treated with
Medical History
Any non-diagnostic information describing the patient prior to the index admission
Length of Stay
The length of the patient's inpatient stay, from admission to discharge
Discharge Location
The location / type of facility where the patient is discharged
Home, long-term care
Behavioral / Cognitive
Any information describing the patient's mental state or social behaviors exhibited
Smoking, alcohol use, depression symptoms
Resource Utilization
Variables representing the use of healthcare resources within a period prior to the index admission and up to discharge
Number of admissions within past year, ER admission within 30 days, number of consultations
Hospital Characteristics
Information describing the hospital or hospital system
Complexity of hospital system, number of beds, bed occupancy
Other
Any other information that does not fit into the other categories
Functional status, discharge season, admission urgency
The final category used to code hospital readmission risk models was model evaluation.
The model output was coded in terms of the statistic or risk stratification measurement. The
model accuracy was also coded in terms of the significance threshold used for the input
variables and / or the performance of any models included in the study (e.g., the c-statistic). This
13
information was used to gauge the model performance. Any risk factors that were specifically
noted, had reached statistical significance, or had been included in the final model were
recorded.
Finally, to assess the practicality of the model, any specific technologies relating to data
extraction, data storage or specific algorithms used were noted. This could include a specific
EHR brand, or a type of clinical database (e.g. clinical data warehouse). It was noted whether
the model was implemented into operating clinical workflow, including the methodology of
implementation. Any specific limitations noted by the authors were also recorded.
Results
Study and Data Context In total, 38 peer-reviewed studies were found to have tested or included a prediction
model for 30-day hospital readmission. A total of 15 studies were held in academic hospital
environments (Table 4) [17-31]. These studies included an average of 1.8 hospitals in their
readmission data, with a mean sample size of 15,278 index admissions. There were 10 studies
held in non-academic hospital environments, which contained an average of 24.3 hospitals and
270,560 index admissions [32-41]. The largest sample was held in a non-academic environment
and contained over 2.3 million index admissions across 41 hospitals in Hong Kong [36]. The
smallest sample was 100 patients who were enrolled in a tele-monitoring program post-
discharge [18]. Four of the studies included a combination of both academic and non-academic
hospitals in their data, with an average of 18 hospitals (this average was driven by a study held
in Switzerland containing 49 acute care hospitals) [42-45].
A total of 9 studies were conducted outside of hospital environments [46-54]. These
studies used various claims databases (e.g. Medicare claims), and patients registries (e.g.

14
Quebec Trauma Registry, American Heart Association’s Get with the Guidelines-Heart Failure
registry, New York State Cardiac Surgery Reporting System). In all but two of these studies, the
number of hospitals from which the data originated was not specified [48,52]. For studies with
regional or national registry data, the data can be sourced from several hundred hospitals, such
as the case with the National Surgery Quality Improvement Program which includes up to 400
hospitals [50,53]. Given the broad scale of data collection for patient registries and insurance
providers, the average sample size was substantial, with over 100,000 index admissions. The
smallest sample size in this study setting group contained 6,615 index admissions, while the
remaining studies conducted outside hospital environments had more than 16,000 admissions
each.
Table 4: Readmission study setting count with sample sizes and data source combinations
Academic Non-academic
Both Academic
and Non-
Academic Other
Citations
17,18,19,20,21,22,2
3,24,25,26,27,28,29
,30,31
32,33,34,35,36,37,3
8,39,40,4142,43,44,45
46,47,48,49,50,51,52,
53,54
Avg. Number of
Hospitals1.8 24.25 18.25 45.5
Avg. Sample Size 15,278 270,560 50,568 102,134
Smallest Sample 100 189 26,045 6,615
Largest Sample 118,221 2,344,003 131,809 628,929 Total PercentMedical Only 6 2 2 0 10 26.3%
Medical and Survey 1 0 0 0 1 2.6%
Medical and Other 0 1 0 0 1 2.6%
Administrative Only 2 2 1 1 6 15.8%
Administrative and
Survey1 0 0 0 1 2.6%
Administrative and
Other0 0 0 4 4 10.5%
Medical and
Administrative4 3 0 2 9 23.7%
Medical,
Administrative and
Survey
0 0 1 0 1 2.6%
Medical,
Administrative and
Other
1 2 0 0 3 7.9%
Other only 0 0 0 2 2 5.3%
Total 15 10 4 9
Percent 39.5% 26.3% 10.5% 23.7%
Hospital Readmission Study Setting
Data Source
Combination

15
Data Sources Medical and administrative data sources were the most prevalent source types across
all 38 studies, and most were stored in electronic form; however, this could not be ascertained
for some studies. In total, 24 medical sources and 24 administrative sources were used to collect
readmission data (Table 5). Ten studies collected data using sources other than medical and
administrative records, and 3 studies used survey techniques to collect data including telephone
follow-up and patient interviews [20,29,42]. The most frequent data source combination was
medical records only (26.3% of studies), followed by medical and administrative records (23.7%)
and administrative records only (15.8%). Two studies used only other data sources (those that
did not fit into the medical or administrative classification), while 4 studies used a combination
of three sources, including medical, administrative and either other or survey (Table 4). Most of
the data sources (81%) were in electronic form where applicable, however, one medical record
was not in electronic form [34] (Table 5). Importantly, for 10 individual data sources it could not
be determined whether the source was electronic or not. In some cases, the specific technology
used for the data source was mentioned, such as Epic EHR [17,43] or system-wide electronic
data warehouses [21,25]. Interestingly, one study included data source as a factor and
considered the effect of the various combinations of data sources, and the variables derived
from these sources, on the performance of readmission risk models [30].

16
Table 5: Data sources used including the mode of storage
Study Samples There were several categories of patient cohort types used for data inclusion and model
development, with CHF being the most frequent medical condition included. These cohort types
included all-cause (found in 17 studies), one condition (12) or groups of conditions (3), age
restriction (9), surgical procedures (5) and other restrictions (9) (Table 6). Single conditions
applied alone included CHF (7 studies), ischemic stroke, type-2 diabetes and cancer. One study
applied all three conditions first targeted by HRRP (CHF, AMI and PNA), while another study
applied a group of 12 high-volume conditions [19,49]. All age-restricted studies used a cut-off of
65 years old, which is the starting age of eligibility for Medicare. Surgical procedures used to
define cohorts included cardiac procedures, hysterectomy, thyroidectomy and allogenic
hematopoietic cell transplantations (allo-HCT). The most frequent cohort that fit into the other
category was the inclusion of the veteran population [33,37,38,41]. Additional restrictions in this
category included trauma patients, patients on parenteral antibiotic treatments, patients who
used an otolaryngology service, and patients who filled a prescription following discharge.
Cohort types were either applied alone or in combination with other types, producing
15 distinct total categories. Studies that focused on all-cause models exclusively were the most
CitationsData Source
Type
Data Source:
ElectronicCitations
Data Source:
Not ElectronicCitations
Data Source:
Not SpecifiedCitations Total
17,18,19,22,23,24,26,
27,28,29,30,31,42,43,
45,32,34,35,36,37,38,
39,40,46,47
Medical 19
17,18,19,23,26,2
7,30,31,43,45,32
,35,36,37,38,39,
40,46,47
1 34 422,28,29,4
224
19,20,21,22,25,28,30,
31,42,44,33,35,36,37,
38,39,41,46,47,48,49,
51,52,54
Administrative 19
19,21,25,30,42,4
4,35,36,37,38,39
,41,46,47,48,49,
51,52,54
0 520,22,28,3
1,3324
28,37,39,40,48,50,51,
52,53,54Other 9
37,39,40,48,50,5
1,52,53,540 1 28 10
20,29,42 Survey 3
30-day follow-
up, Telephone
follow up,
Patient
interview

17
frequent combination (9), while there were 3 studies that combined all-cause with an age
restriction. Four studies that used an age restriction also focused on one condition and one
study used an age-restriction with a group of conditions. All-cause and age-restriction combined
models had an average of nearly 800,000 index admissions; however, this average was heavily
driven by one study with over 2.3 million admissions (another study in this category had only
183 admissions). The average number of input variable categories used in readmission models
varied across all the cohort combinations, ranging from 4 to 8 categories (Table 6). The study
with 8 input variable categories was an extensive investigation of readmission, developing
several models with various cohorts and data source combination and including 118,000 index
admissions [30].

18
Table 6: Cohorts used in models, with average sample sizes and input variable category counts
Model Inputs Studies including medical record data tended to include more input variable categories
in the prediction model development. Models that utilized only medical record data sources
used 6.2 input variable categories on average, while those using only administrative sources had
Cohort Type
Includes
Cohort (Not
Exclusively) Citations
Includes
Cohort
(Exclusively) Citations
Avg. #
Variable
Categories
Avg. Sample
Size Description
All-Cause
17
20,21,22,25,29,30
,42,43,44,45,32,3
3,35,36,39,41,479
20,22,42,43,44,4
5,32,35,39
6.9 43,278
One Condition
12
17,18,21,24,28,30
,31,37,40,46,51,5
4 417,18,28,40
6 13,770
7 CHF; 1 ischemic
stroke; 1 Type-2
diabetes; 1 cancer
Age-Restriction9
25,29,31,36,38,46
,49,51,54 0Greater than 65 years
old
Group of
Conditions3
19,34,49
219,34
6.5 2,957
CHF, AMI and PNA;
Pyschiatric; 12 high-
volume conditions
Surgery
5
24,26,50,52,53
4
26,50,52,53
6.8 23,554
2 cardiac; 1
hysterectomy; 1
thyroidectomy; 1 allo-
hct
Other
9
23,27,30,33,37,38
,41,47,48
3
23,27,48
7 19,860
4 veteran; 1 trauma;
1 patients who picked
up prescriptions; 1
patients who had
antibiotic treatment;
1 population that
used otolaryngology
service; 1 model that
focused on data
source combinations
All-Cause & One
Condition 121
6 46,209All-Cause, One
Condition &
Other 130
8 118,221All-Cause &
Other 333,41,47
4 5,382All-Cause & Age-
Restriction 325,29,36
5.3 791,159Age-Restriction
& One Condition 431,46,51,54
5.3 171,242Age-Restriction
& Group of
Conditions 149
4 6,615Age-Restriction
& Other 138
7 129,400One Condition &
Other 137
8 3,436One Condition &
Surgery 124
5.0 618

19
an average of 4.5 categories (Table 7). Studies that used both medical record and administrative
data sources also input an average of 6.2 input variable categories into their models. Two data
source categories (medical and other and other only) had the highest number of input variable
categories with an average of 9, while three studies using medical administrative and other
sources used 8.7. Two studies used 11 of the variable categories [32,53] and conversely, one
study used just the Diagnostic category [18]. One study included an Index (LACE1) and Resource
Utilization variables, and another used just Demographic and Diagnostic input data ([42,47], see
Table 3 for description of categories).
Table 7: Counts of data source combinations with average input variable categories
1 LACE is a composite measure that includes the length of stay, whether the admission was acute, the Charlson co-
morbidity index score, and the number of visits to the ER in the prior 6 months
Citations
Data Source
Combination
Combination
Count
Avg. # Variable
Categories
17,18,23,24,26,27,
43,45,32,34Medical Only 10 6.2
29Medical and
Survey1 6.0
40Medical and
Other1 9.0
21,25,44,33,41,49Administrative
Only6 4.5
20Administrative
and Survey1 4.0
48,51,52,54Administrative
and Other4 6.0
19,22,30,31,35,36,
38,46,47
Medical and
Administrative9 6.2
42
Medical,
Administrative
and Survey
1 2.0
28,37,39
Medical,
Administrative
and Other
3 8.7
50,53 Other only 2 9.0

20
Variables that are typically easier to access were more commonly represented in
models, including Demographics, appearing in 35 studies, Diagnostic (32), and Resource
Utilization (23) (Table 8). The Resource Utilization input variables most common were the count
of emergency visits or general admissions within a specific time period prior to the index
admission, frequently 6 months to a year. Twenty-two studies used Indexes, of which the most
frequently used were the Charlson co-morbidity index, LACE and the Elixhauser co-morbidity
index. Less frequent indexes included the American Society of Anesthesiologists (ASA) physical
status classification system, Injury Severity Score, Acute Physiology and Chronic Health
Evaluation (APACHE), Brief Psychiatric Rating Scale (BPRS), New York Heart Association
Functional Classification for Heart Failure, Tabek Mortality Score and the High-Risk Diagnoses for
the Elderly Scale.

21
Table 8: Model input variable categories and counts
Less frequently included variable categories were Social (19 studies), Procedure (14),
Laboratory (14), Other (13) and Discharge Location (13). Less than half of models used Length of
Variable Category
Variable
Category
Count Citations
Demographics 35
17,19,20,21,22,23,24,25,26,
27,28,29,30,31,43,45,32,33,
34,35,36,37,38,39,40,41,46,
47,48,49,50,51,52,53,54
Diagnostic 32
17,18,19,21,22,23,24,26,27,
29,30,31,43,45,32,33,34,35,
36,37,39,40,41,46,47,48,49,
50,51,52,53,54
Resource utilization 23
17,19,20,21,22,23,25,27,30,
42,43,44,45,32,34,35,36,37,
38,39,40,48,54
Indexes 22
17,19,20,23,24,25,28,29,42,
43,44,45,33,34,35,37,38,39,
40,48,50,53
Social 19
17,19,20,21,22,23,25,28,29,
30,43,32,33,35,36,37,38,39,
41
Procedure 1421,22,24,26,27,45,32,33,40,
49,50,51,52,53
Laboratory 1419,22,28,30,31,43,32,39,40,
46,50,51,53,54
LOS 1419,21,22,23,27,29,43,32,35,
40,41,49,52,53
Other 1322,28,29,30,45,34,35,37,38,
39,48,50,53
History 1123,24,27,28,31,32,36,51,52,
53,54
Vitals 1028,31,43,32,37,39,50,51,53,
54
Medications 1019,22,23,28,32,35,38,39,40,
53
Discharge Location 1023,25,27,30,45,32,33,35,40,
53
Behavioral/Cognitive 4 17,30,37,39
Hospital Characteristics 3 38,52,54

22
Stay (14), which was surprising given the relative simplicity of the calculation and its widespread
use as a quality indicator. Common Social variables were marital status, social support, caregiver
status, living situation upon discharge, and socioeconomic status. A few studies included
geographic data to determine whether distance to the hospital or remoteness of residence
influenced risk of readmission. Procedures were represented by number and type of procedure,
with some studies noting procedure complications and one study using all CPT codes associated
with the patient’s index admission. Typical Laboratory values included were albumin, hematocrit
(HCT), blood urea nitrogen (BUN), plasma sodium, hemoglobin, glomerular filtration rate (GFR),
and creatinine. The most frequent Other variables were comprised of functional status (4),
Activities of Daily Living (2), discharge season (2), disability status, fragility-related diagnoses,
type and source of admission, admission urgency, term frequency-inverse document frequency
from clinical notes, body region and mechanism of injury for trauma patients, episodes of
seclusion or restraint for psychiatric cases, and imaging results. The use of term-frequency
inverse-document frequency was used by one study for text mining of clinical notes to isolate
important keywords, such as those relating to a substance abuse (e.g. “abuse”, “dependence”,
“withdrawal”) and potentially identifying behavioral risk factors [30]. Behavioral / Cognitive risk
factors were included in four studies and consisted of noted substance abuse issues as well as
an estimation of high risk behaviors from visits to a social worker or presence of an STD.
Models Used The vast majority of studies used multivariate models for 30-day readmission prediction
with all but two studies including a multivariate logistic regression in their study (Table 9).
Twelve studies used only a multivariate model, and 18 studies conducted both a bivariate and
multivariate analysis. Less frequent analysis combinations included multivariate, bivariate and
other (4), multivariate and other (2), bivariate only (1), and other only (1). The bivariate only

23
analysis was conducted on a previously validated index (LACE) while the other only study also
tested the accuracy (using a Receiver Operating Characteristic, or ROC, analysis) of three
previously validated screening tools [29,44].
Importantly, 7 studies used a model, or set of models, other than bivariate or
multivariate. Other models included support vector machines and the SQLApe (Striving for
Quality Level and Analyzing of Patient Expenses) algorithm to identify and eliminate admissions
that were unavoidable [22,30]. A custom model was built using elements of hazard models,
Bayesian networks and Markov Chain Monte Carlo models and subsequently compared to a
multivariate logistic model [41]. In addition to a multivariate logistic model, one study used
classification and regression trees (CART), C5. 0 and Chi-square Automatic Interaction Detection
(CHAID), and neural networks models [39].

24
Table 9: Models used for readmission risk prediction with model outputs, validation methods
and validation size where appropriate.
Model Outputs and Validation Nearly all studies that included a multivariate logistic regression model also included a
model output of the c-statistic (Table 9). The c-statistic, equivalent to the ROC or area-under-
curve (AUC), is a measure of a model’s performance compared with the alternative of the model
performing at chance (AUC of 0.5). The majority of models also provided p-values and odds
ratios or relative risks when reporting the significance of individual factors in the models. Six of
the studies stratified the model output into a risk score or level, indicating an individual’s level
of risk for a 30-day readmission [17,20,22,31,39,54]. One study output the mean-square error
for a custom model and compared this to other models tested (including BayesNet, CART and a
machine learning algorithm, AdaBoost) [41].
Citations
Model
Combinations
Model
Combination
Count Model Outputs
Model
Validation
Methods
Average Validation
Cohort Size (% total
sample)
44 Bivariate Only 1 Relative Risk(1) Not applicable(1) Not applicable
18,20,42,45,32
,33,36,46,47,4
8,49,54
Multivariate Only 12
Odds Ratio(9), P-
value(11), C-statistic
(11), Relative Risk(1),
Other(3)
None(1),
Derivation /
Validation(9),
Bootstrapping(1),
Not applicable(1)
0.431
17,19,21,23,24
,25,26,27,28,3
1,34,35,38,40,
50,51,52,53
Bivariate and
Multivariate18
Odds Ratio(12), P-
value(15), C-statistic
(16), Relative Risk(1),
Other(5)
None(4),
Derivation /
Validation(6),
Bootstrapping(5),
Not applicable(3)
0.332
30,41Multivariate and
Other2
C-statistic (1),
Other(1)
Derivation /
Validation(2)0.3
29 Other 1 C-statistic (1) Not applicable(1) Not applicable
22,43,37,39
Multivariate,
Bivariate and
Other
4
Odds Ratio(4), P-
value(4), C-statistic
(4), Other(4)
None(1),
Derivation /
Validation(3)
0.387

25
For model validation, 20 studies used a derivation / validation sample splitting
technique with an average of 40% of the source samples used for validation (Table 9). Four of
these studies also used external data for validation [21,28,32,42]. Six studies used bootstrapping
techniques to validate models, using between 200 and 500 random samples. In six cases there
was no evidence of validation of models where applicable. In two studies, integrated
discrimination improvement and net reclassification improvement were used for model
comparison [37,43].
Model Accuracy Model performance was highly variable across studies, depending on the type of cohort
included, model type and input variable combination. Two studies that focused on all-cause
index admissions and readmissions with an age restriction produced relatively underperforming
models, with c-statistics less than or equal to 0.65 ([25,29], Table A1 in Appendix). Conversely,
one study with the same inclusion criteria had promising results, yielding a c-statistic of 0.819
for the derivation set and 0.824 for the validation. This study used less input variable categories
than the other two studies; however, it also included far more samples, most likely contributing
to its discriminative capacity (2.3 million index admissions compared to roughly 30,000 and
183). Studies using only all-cause cohorts had encouraging model performance. Two all-cause
models using variables collected upon the index admission or within 24-hours from the time of
admission, resulted in c-statistics between 0.69 [43] and 0.76 [32]. Further, the discharge
models for these two studies performed slightly better; both including data that would be
collected upon discharge (e.g., LOS, discharge location, laboratory values upon discharge). A
study that investigated the performance of a previously validated index, LACE, produced c-
statistics between 0.711 and 0.774, depending on the index cut-off used and addition of other
risk factors [35]. This was similar to another all-cause model, which also used LACE and achieved

26
c-statistics between 0.68 and 0.71 for the training / testing sets [42]. An all-cause model
developed only using an administrative data source produced c-statistics between 0.75 and 0.81
across training sites and testing samples [21].
Models implementing methods other than bivariate analyses and multivariate logistic
regression achieved some modest improvements when compared directly against the
traditional methods. One study developed an all-cause model achieving a c-statistic of 0.68, but
also utilized supervised learning using support vector machine (SVM), producing a c-statistic of
0.74 [30]. A study comparing a custom model to other logistic and non-logistic models found the
mean-square error (0.05) to be substantially less than other models (CART, AdaBoost, logistic –
0.16, BayesNet – 0.225) [41]. However, this all-cause model was implemented in a veteran
population, a population with unique characteristics. Two models attempted to improve upon
CMS 30-day readmission models. One all-cause model demonstrated significant improvement
over the CMS model with integrated discrimination improvement (p < 0.05) and net
reclassification improvement (p < 0.001) [43]. Another study, focusing on ischemic stroke in
veterans, compared the CMS model (C=0.636) to a model with the CMS input and social factors
(C=0.646) and CMS input with both social and clinical factors (C=0.661) [37].
Performance varied among studies attempting to predict readmission risk for one or
more conditions. A study found very good discrimination for readmissions due to CHF (C=0.92),
procedure complications (C=0.88) and mood disorders (C=0.84), all of which were more accurate
than the all-cause model and model for readmissions due to general symptoms [30]. Another
model for CHF was fairly accurate for the derivation set (C=0.73), and slightly less for the
validation set (C=0.69) [17]. By using both clinical and non-clinical factors in their CHF model,
one group was able to achieve a c-statistic of 0.69 [28]. Another study had less accurate CHF

27
models, whether the model was derived from medical or administrative sources (C=0.58-0.61)
[46]. A U.S. group developed a model for Type 2 diabetes, a condition not currently monitored
for 30-day readmissions under HRRP, with some success (C=0.69) [40]. The one model derived
for three of the HRRP-focused conditions (CHF, AMI and PNA) produced reasonable accuracies
for the derivation (C=0.64-0.73) and random sample validation sets (C=0.63-0.76), but
performed slightly worse for a historical validation (C=0.61-0.68) [19]. Two studies produced
very good discrimination (C=0.83-0.85); however, these studies focused on patients that used an
otolaryngology service and those who underwent hysterectomies [27,50]. Finally, a study on
chronic pancreatitis built a model with c-statistics between 0.65 and 0.73, depending on the
derivation / validation sample and site [21].
Important Factors Discovered There were several variables that were included in multiple final readmission risk
models (Table A1). Basic demographics including age, race and gender were statistically
significant in many models, with a higher age increasing the odds of a 30-day readmission in
most. Co-morbidities were also a significant risk factor, whether measured through the number
of co-morbidities, the presence of high-risk conditions or the Charlson co-morbidity index. Other
indexes predictive of readmission included LACE, ASA physical status class, Tabek mortality
score, APACHE score, and BPRS for psychiatric patients. Several studies found the number of
previous hospitalizations to be an important risk factor for readmission, as well as the length
and type (elective vs. emergent) of index admission. Predictive social and behavioral factors
included marital status, living alone, poverty levels, distance to hospital (further being less likely
in one study [25]), drug use, and the presence of anxiety or depression. One study found
hospital characteristics impacted the risk of readmission, including annual surgery volume and
hospital risk-adjusted mortality rates [52]. As expected, several clinical factors found were

28
specific to the cohort included, such as prep regimen for allo-HCT patients, heart failure
classification, or a presence of IC9-CM code for radical pancreaticoduodenectomy for chronic
pancreatitis patients [21,24,28]. Functional status of the patient and discharge location also
played an important role in several models. Finally, there were several laboratory values derived
from medical record sources that were predictive of readmission, including BUN, HCT, albumin,
sodium and creatinine.
Technologies and Model Implementation Technologies listed for data storage or extraction included several EHRs, clinical and
administrative data repositories and patient registries. Clinical research databases used included
Research Electronic Data Capture (RedCAP) and Clinical Investigation Data Exploration
Repository (CIDER) [23,27]. Other studies utilized administrative databases, including the Johns
Hopkins Casemix Datamart, Ontario administrative databases and Medicare Standard Analytic
File [21,42,46]. Several studies extracted data from the hospital system’s EHR, in some cases
listing the specific brand such as Epic or Cerner [17,32]. Registries for specific conditions or
procedures included the Unified Transplant Database at Cleveland Clinic, an EHR-based disease
registry, the Quebec trauma registry, the Get with the Guidelines Heart Failure project, the NYS
Cardiac Surgery Reporting System and the National Surgical Quality Improvement Program
(NSQIP) [24,39,48,51,53]. Following model development, two studies specifically mentioned
plans for implementing the model into the clinical workflow [19,21]. Only one study reported
model integration into the hospital system [36]. The model was run live as a daily screening tool
to identify high-risk elderly patients. Risk scores were computed daily upon discharge and high-
risk patients were automatically forwarded to disease management for telephone follow-up.

29
Study Limitations Nearly all of the studies explicitly mentioned limitations, with the most often mentioned
relating to model generalizability or data completeness. Models may not be completely
generalizable due to the specific settings of the hospital (rural vs. metro), unique study
populations (e.g., veterans) or unique care delivery systems (e. g. Kaiser Permanente’s
integrated delivery system). Less frequently captured social, demographic or clinical information
led to issues with incomplete records and reduced sample size. Several studies noted that a lack
of external validation reduced the generalizability of the model. Further, many studies noted
that there was no capability to monitor inter-hospital readmissions due to data systems being
segregated and data access limited. Small sample sizes hindered some studies, leading to wide
confidence intervals for estimations. A lack of access to extensive clinical data was also
mentioned, which could account for some of the uncaptured variance in the models. Finally, one
study was conducted in Israel and made specific mention of population and hospital system
organizational differences between Israel and the United States [39].
Discussion With the rollout of Medicare reimbursement adjustments following the introduction of
the HRRP, there has been increased pressure on hospital systems to adapt and reform. The
possibility remains that the program could extend to other high-risk conditions or similar
adjustments could be made for 30-day readmissions in the commercial insurance market. Broad
organizational changes, such as increased staffing or resources for discharge, may be effective at
reducing admissions; however, they are costly to apply to all index admissions. Thus, a strong
case can be made for mechanisms to predict an individual patient’s 30-day readmission risk. This
systematic review included recent attempts to predict readmission risk.

30
Out of the 38 studies, there was a wide variety of study settings where readmission
prediction models were developed. Having access to a large hospital network not only allows for
larger samples, it introduces more opportunity for representing the general population and
including less prevalent events into the model. Two studies with over 40 hospitals produced
sample sizes of over 130,000 and over 2 million, with promising results [34,43]. While large
healthcare organizations, including integrated hospital networks, HIEs and data registries
tended to produce larger data sets, there is no guarantee this will lead to more accurate models.
A model built with over half a million admissions produced modest results, even when
augmenting the administrative data with medical records [44].
The majority of studies included medical or administrative sources for readmission data;
however, only a third of studies included both. Incorporating medical sources provides the
advantage of recently collected data and proximity to the care providers through the EHR.
Further, studies utilizing medical records tended to have more input variable categories in their
models, demonstrating the relative richness of EHR data. Several studies listed a lack of access
to clinical variables as a limitation to their work. Using medical sources provides the ability to
isolate variables within an EHR that are predictive of readmission and potentially incorporate
models into clinical decision support systems. This would allow risk scores to be computed in
the background and notifications to be generated during the course of the index admission or
prior to discharge. However, this may come at a cost of data quality and incompleteness, also
noted by several studies in their limitations. Several advantages exist for administration data,
including the cleaning and standardization of data for billing or quality improvement purposes.
Further, isolating model input data that adheres to common terminologies could lead to easier
integration across study sites.

31
Several studies used patient registries and HIEs to collect data, while three studies used
surveys for patient follow-up. These sources may allow for a more complete and longitudinal
patient record, spanning across multiple institutions. However, implementation using registries
and HIEs would require integration and fast communication with outside sources for operation
within the index admission. Surveys could allow for patient-reported outcomes but are also
costly to implement when not automated, and are difficult to conduct on a large-scale for
research. Thus, it is imperative for individuals on the academic research and operations side to
weigh the costs and benefits of including multiple data sources when available.
There was a wide range of cohort restrictions for prediction model development, only a
minority of which fit the given range of conditions and age-restriction of HRRP. This suggests
that organizations view 30-day readmission as an important quality metric for other non-
regulated cohort combinations. Seven studies used a CHF diagnosis for inclusion while two
included patients who underwent cardiac surgery. The popularity of such models is most likely
driven by the high rate of readmission and prevalence of CHF. Surprisingly, only one study
included all three conditions originally covered under HRRP (CHF, AMI and PNA) into a combined
model [19]. While this study developed both condition-specific models and a combined model,
there was no direct statistical comparison to determine if the combined model had less
accuracy. Further research is needed to explore the accuracy and ease of implementation of
disease-specific readmission prediction models against all-cause. Finally, caution must also be
taken when interpreting and potentially incorporating models, considering that certain cohorts
may have had unique characteristics. For instance, all-cause models stemming from veteran
populations would be built primarily on males who are more economically deprived [38].
Further, it is important for authors of studies investigating readmission prediction models to

32
describe in detail sample demographics and note any unique features of the community where
most of the study population resides.
Nearly all of the studies used a multivariate logistic regression for development of a
prediction model. Only three studies included additional modeling techniques, including support
vector machines and Bayesian networks. While there was insufficient evidence for additional
value provided by these methods, advanced methods like supervised learning and artificial
neural networks have shown promise in disease prediction [55-57]. Further, implementing naïve
approaches or well-defined heuristics for feature selection may uncover new predictors of
interest and would increase the reproducibility of model deployment [21]. Future readmission
prediction research should consider developing non-traditional classifiers, comparing them
against traditional models such as logistic regression.
Model validation is necessary to demonstrate generalizability and reproducibility. Most
studies used model validation when appropriate, either through internal bootstrapping or by
sample splitting. External validation is also imperative regardless of the model validation
technique, and only a few studies were tested against external data. One group was able to
validate their model on a database of 1 million admissions, finding very similar model
performance to the internal derivation and validation sets [42]. External validation would serve
to determine if population differences between hospital systems are similar enough for model
adoption. Further, deploying a model at an external site would test the data coverage for model
inputs and the ease of model implementation. Only one study mentioned successful
implementation of a model into clinical workflow post validation and further work is required to
test and report on implementation efforts for other models [36].

33
The most common limitation listed among the studies was the concern over
reproducibility of the prediction model. While model validation can be used to test
generalizability, documentation of the various elements described in this study would be critical
for and expedite predictive model implementation decisions. For instance, when reporting data
sources used for readmission research, the mode of storage and collection should be explicitly
noted, as well as any specific technologies used. Ten studies did not explicitly report whether
the source was electronic, and the majority of studies failed to note the specific technologies
(e.g., brand of EMR or clinical data repository) from which the data was extracted. Additionally,
while models incorporating multiple data source types could be more accurate and appealing,
they may also be more difficult to implement, possibly requiring data integration and alignment
across disparate systems (e.g., connecting to a patient registry or HIE in near-real time to check
a patient’s medication history). Reporting and elaborating on data context for generalizability
determination should also be extended to cohort selection.
Finally, having a consistent framework for conducting and reporting readmission risk
prediction efforts would help in the preparation and the assessment of such research. A number
of frameworks do exist for the development of prediction models for medical diagnoses, but
these frameworks need to be extended for 30-day readmission. Specifically, both the Critical
Appraisal and Data Extraction for Systematic Reviews of Prediction Modelling Studies (CHARMS)
and the Transparent Reporting of a multivariate prediction model for Individual Prognosis or
Diagnosis (TRIPOD) provide guidelines for reviewing and reporting on diagnostic / prognostic
prediction models [58,59]. The TRIPOD framework could be extended for 30-day readmission
prediction studies to include checklist items including: data source types; data source
integration efforts; filtering of unplanned or unavoidable readmissions; relevant community
characteristics; model performance compared against standard models (e.g. CMS); detailed
34
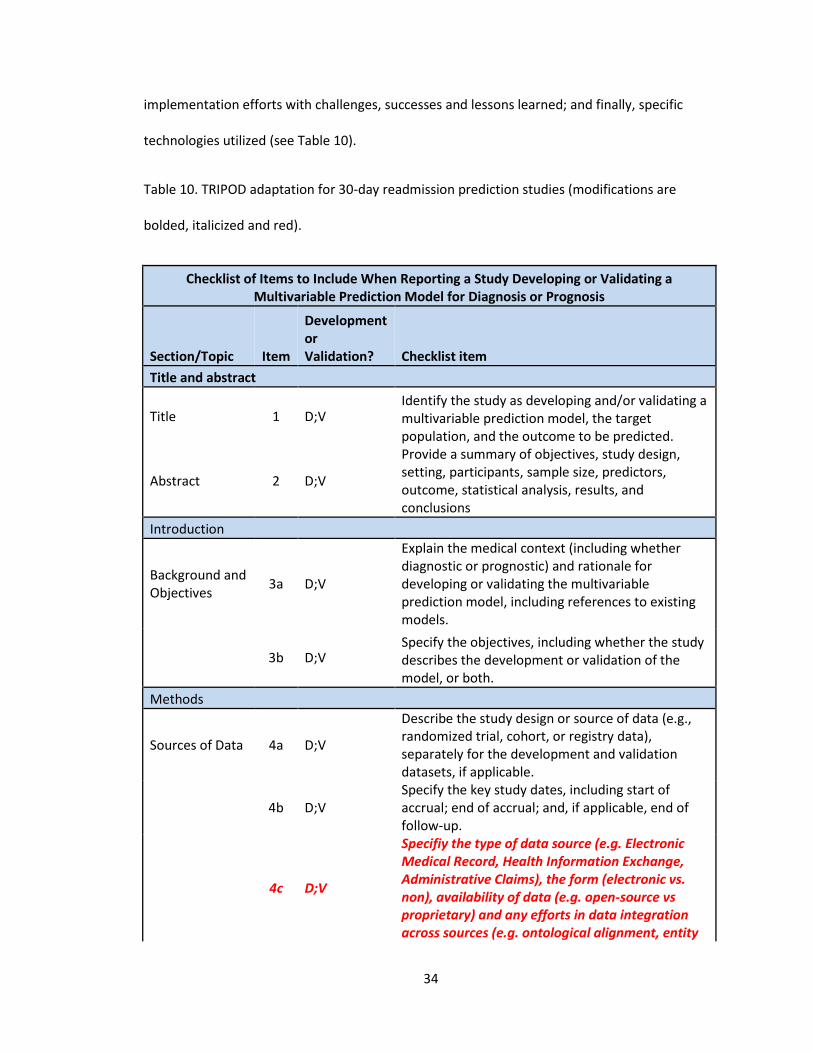
implementation efforts with challenges, successes and lessons learned; and finally, specific
technologies utilized (see Table 10).
Table 10. TRIPOD adaptation for 30-day readmission prediction studies (modifications are
bolded, italicized and red).
Checklist of Items to Include When Reporting a Study Developing or Validating a Multivariable Prediction Model for Diagnosis or Prognosis
Section/Topic Item
Development or Validation? Checklist item
Title and abstract
Title 1 D;V Identify the study as developing and/or validating a multivariable prediction model, the target population, and the outcome to be predicted.
Abstract 2 D;V
Provide a summary of objectives, study design, setting, participants, sample size, predictors, outcome, statistical analysis, results, and conclusions
Introduction
Background and Objectives
3a D;V
Explain the medical context (including whether diagnostic or prognostic) and rationale for developing or validating the multivariable prediction model, including references to existing models.
3b D;V Specify the objectives, including whether the study describes the development or validation of the model, or both.
Methods
Sources of Data 4a D;V
Describe the study design or source of data (e.g., randomized trial, cohort, or registry data), separately for the development and validation datasets, if applicable.
4b D;V Specify the key study dates, including start of accrual; end of accrual; and, if applicable, end of follow-up.
4c D;V
Specifiy the type of data source (e.g. Electronic Medical Record, Health Information Exchange, Administrative Claims), the form (electronic vs. non), availability of data (e.g. open-source vs proprietary) and any efforts in data integration across sources (e.g. ontological alignment, entity

35
resolution).
Participants 5a D;V Specify key elements of the study setting (e.g., primary care, secondary care, general population) including number and location of centers.
5b D;V Describe eligibility criteria for participants.
5d D;V
Specify any key community characteristics (e.g. accessibility of health care resources, social support structure) relevant to an individual's ability to access care and support post-discharge.
5c D;V Give details of treatments received, if relevant.
Outcome 6a D;V Clearly define the outcome that is predicted by the prediction model, including how and when assessed.
6b D;V Report any actions to blind assessment of the outcome to be predicted.
6c D;V
Specify if all-cause readmissions were measured, or if readmissions were filtered by any of the following: 1. specific causes; 2. admits that were deemed unplanned; 3. admits that were unavoidable; 4. any other inclusion / exclusion criteria for the readmission event.
Predictors 7a D;V Clearly define all predictors used in developing the multivariable prediction model, including how and when they were measured.
7b D;V Report any actions to blind assessment of predictors for the outcome and other predictors.
Sample Size 8 D;V Explain how the study size was arrived at.
Missing Data 9 D;V Describe how missing data were handled (e.g., complete-case analysis, single imputation, multiple imputation) with details of any imputation method.
Statistical Analysis Methods
10a D Describe how predictors were handled in the analyses
10b D
Specify type of model (including reasons for choosing specific models), all model-building procedures (including detailed description of any algorithms used for feature selection), and method for internal validation.
10c V For validation, describe how the predictions were calculated.
10d D;V Specify all measures used to assess model performance and, if relevant, to compare multiple models.
10e V Describe any model updating (e.g., recalibration) arising from the validation, if done.
Risk Groups 11 D;V Provide details on how risk groups were created, if

36
done.
Development and Validation
12 V For validation, identify any differences from the development data in setting, eligibility criteria, outcome, and predictors.
Results
Participants 13a D;V
Describe the flow of participants through the study, including the number of participants with and without the outcome and, if applicable, a summary of the follow-up time. A diagram may be helpful.
13b D;V
Describe the characteristics of the participants (basic demographics, clinical features, available predictors), including the number of participants with missing data for predictors and outcome.
13c V For validation, show a comparison with the development data of the distribution of important variables (demographics, predictors, and outcome).
Model Development
14a D Specify the number of participants and outcome events in each analysis.
14b D If done, report the unadjusted association between each candidate predictor and outcome.
Model Specification
15a D
Present the full prediction model to allow predictions for individuals (i.e., all regression coefficients, and model intercept or baseline survival at a given time point).
15b D Explain how to use the prediction model.
Model Performance
16a D;V Report performance measures (with CIs) for the prediction model.
16b D;V
If possible, compare model performance statistically to other reference models used (e.g. CMS model) using the same cohort. When not possible, give a detailed comparison of model performance against previously published models with similar settings / cohorts.
Model Updating 17 V If done, report the results from any model updating (i.e., model specification, model performance).
Discussion
Limitations 18 D;V Discuss any limitations of the study (such as nonrepresentative sample, few events per predictor, missing data).
Implementation Efforts
19 D;V
Discuss any model implementation efforts in detail, with discussion of implementation setting, successes, failures, and lessons learned. Of particular importance is any systematic approach to evaluating and comparing model effectiveness to previous workflows and / or alternative

37
readmission reduction efforts.
Interpretation 20a V For validation, discuss the results with reference to performance in the development data, and any other validation data.
20b D;V Give an overall interpretation of the results, considering objectives, limitations, results from similar studies, and other relevant evidence.
Implications 21 D;V Discuss the potential clinical use of the model and implications for future research.
Other Information
Supplementary Information
22 D;V Provide information about the availability of supplementary resources, such as study protocol, Web calculator, and datasets.
Technologies 23 D;V
Report any specific technologies used, including but not limited to technologies for data storage/extraction/analysis and technologies used for patient education / communication during admission and post-discharge.
Funding 24 D;V Give the source of funding and the role of the funders for the present study.
Limitations to this study include the inability to include unpublished and proprietary
commercial readmission prediction efforts. It is possible that health systems have attempted to
develop their own readmission prediction models as part of internal initiatives. Further,
commercial entities may have analytic modules for readmission analysis / prediction but fail to
disclose models due to competitive advantages gained. Another limitation to this study was the
possibility that search terms used were too specific, leading to a failure to capture relevant
articles in the results. Future work should possibly reduce the search-term specificity and
include other search engines. This study improves upon other similar efforts by gathering
information that could be useful in assessing model generalizability (e.g. data source
combinations) and proposing a framework for future reporting of 30-day readmission prediction
efforts.

38
Acknowledgements
The author would like to thank Dr. Hadi Kharrazi for his contribution of ideas, guidance and
efforts during the completion of this thesis. The author also owes a debt of gratitude to Dr.
Harold Lehmann for lending his wealth of expertise and to Kersti Winny for general support.
Finally, thank you to Fardad Gharghabi for lending time and effort in the review and coding
phases.

39
Appendix
Table A1 Readmission risk prediction studies, including data sources and modes, cohort combinations
used, model input variable categories, models used, model evaluation and important variables
noted.
Cit
Data Source Combination &
Mode Cohort
Combination Input Variable Combination
Model Combination
Model Evaluation
Important Variables
Noted
17 Medical Record (Electronic)
One Condition
Demographics, Diagnostic, Indexes, Social, Behavioral/Cognitive, Resource utilization
Bivariate analyses, Multivariate logistic regression
C-statistic (0.72) Derivation (mean = 0.73, CI: 0.71-0.75), Validation (mean = 0.69, CI: 0.63-0.74)
Tabak mortality score, Number of home address changes, Medicare member, Number of prior inpatient admissions. Slightly less significant were history of cocaine use, Single status, Male, and Anxiety and Depression.
18 Medical Record (Electronic)
One Condition
Diagnostic Multivariate logistic regression
Model including rapid heart beat, swollen abdomen/feet and missed medications (C=0.21, sensitivity=0.5, specificity=0.81)
Rapid heart beat, Swollen abdomen

40
19 Medical Record (Electronic), Administrative (Electronic)
Group of conditions
Demographics, Diagnostic, Laboratory, Indexes, Social, Medications, LOS, Resource utilization
Bivariate analyses, Multivariate logistic regression
Derivation (C=0.64-0.73), Random sample validation (C=0.63-0.76), Historical validation (C=0.61-0.68)
LOS, Past admission within 30 days, Social history, Number of discharge meds, Steroids taken upon discharge, Hemoglobin count, Charlson index, Co-morbidities (Weight loss, Lymphoma, Hypertension, Degenerative neurologic disease, Solid tumor)
20 Administrative (Not available), Survey
All-Cause Demographics, Indexes, Social, Resource utilization
Multivariate logistic regression
Derivation (C= 0.6468), Validation (C=0.6156)
Insurance type, Marital status, Possession of regular physician, Charlson Index, SF-12 Physical index, LOS > 2, # admissions in previous year
21 Administrative (Electronic)
All-Cause, One Condition
Demographics, Diagnostic, Procedure, Social, LOS, Resource utilization
Bivariate analyses, Multivariate logistic regression
All-cause (Training (C=0.75,0.79), Cross-site validation (C=0.78,0.81)), Pancreatitis (Training (C=0.71,0.65), Cross-site validation (C=0.65,0.73))
For All-cause: Admissions past 5 years, CPT codes including blood transfusion, Hydromorphone inj. , Tacrolimus (oral med), Bacterial culture, and Therapeutic or diagnostic injection. CP Model: Admissions past 5 years, ICM-9 CM code of radical pancreaticoduodenectomy, and 3 CPT Codes

41
22 Medical Record (Not available), Administrative (Not available)
All-Cause Demographics, Diagnostic, Procedure, Laboratory, Social, Medications, LOS, Resource utilization, Other(Type and source of admission)
Bivariate analyses, Multivariate logistic regression, Other (SQLApe Algorithm (Striving for Quality Level and Analyzing of Patient Expenses) used to exclude unavoidable readmissions)
Derivation (C=0.69), Validation (C=0.71)
Low hemoglobin, Discharge from oncology, Low sodium, Procedure during stay, LOS > 5, Non-elective admission, Number of admissions prior year
23 Medical Record (Electronic)
Other Demographics, Diagnostic, Indexes, Social, Medications, History, LOS, Discharge Location, Resource utilization
Bivariate analyses, Multivariate logistic regression
C=0.6 Age, Aminoglycoside use, Prior hospitalizations, Drug-resistant organism
24 Medical Record (Both Electronic and Non-electronic)
One Condition, Surgery
Demographics, Diagnostic, Procedure, Indexes, History
Bivariate analyses, Multivariate logistic regression
P <= 0.001 HCT co-morbidity index, Prep regimen (containing total body irradiation), Index admission infection
25 Administrative (Electronic)
All-Cause, Age-restricted
Demographics, Indexes, Social, Discharge Location, Resource utilization
Bivariate analyses, Multivariate logistic regression
P < 0.05, Elixhauser (Derivation (C=0.65), Validation (C=0.65)), HRDES models (Derivation C=0.63), Validation (C=0.63))
Age, Gender, Race, Discharge location, Insurance type, Surgery service, Major organ systems or systemic comorbid conditions, Distance to hospital (further away less likely to be readmitted)

42
26 Medical Record (Electronic)
Surgery Demographics, Diagnostic, Procedure
Bivariate analyses, Multivariate logistic regression
P < 0.05, C=0.701
Female, Diabetes, Preoperative atrial fibrillation, COPD, Renal dysfunction, Distance category to hospital
27 Medical Record (Electronic)
Other Demographics, Diagnostic, Procedure, History, LOS, Discharge Location, Resource utilization
Bivariate analyses, Multivariate logistic regression
P < 0.05, C=0.85 Presence of complication, Neck breather status, Discharge location, Illicit drug use, Severe coronary artery disease or Chronic lung disease
28 Medical Record (Not available), Administrative (Not available), Other (Not available - Census, National Death Index)
One Condition
Demographics, Laboratory, Indexes, Social, Vitals, Medications, History, Other(Discharge season (winter v. other seasons))
Bivariate analyses, Multivariate logistic regression
Clinical and nonclinical factors (C=0.69)
Living alone, HF Classification and Blood urea nitrogen were biggest factors. Less significant factors include Heart rate, Serum albumin, Discharge season, Presence of life-threatening arrhythmia, Diuretic use
29 Medical Record (Not available), Survey
All-Cause, Age-restricted
Demographics, Diagnostic, Indexes, Social, LOS, Other(Functional (ADL))
Other (ROC analyses for different index paritions for each of the three screening tools)
ISAR (C=0.442-0.505), TRST (C= 0.444-0.515), VIP (C=0.508-0.516)
None

43
30 Medical Record (Electronic), Administrative (Electronic)
All-Cause, One Condition, Other
Demographics, Diagnostic, Laboratory, Social, Discharge Location, Behavioral/Cognitive, Resource utilization, Other(Term-frequency-inverse document frequency from clinical notes)
Multivariate logistic regression, Other (Support Vector Machine)
All-cause (C=0.68), General symptoms readmission dx (C=0.71), CHF readmission dx (C=0.92), Procedure complications (C=0.88), Mood disorder (C=0.84), SVM (C=0.74)
Laboratory results, Visit history, Demographics, Prior ICD codes, Clinical keywords
31 Medical Record (Electronic), Administrative (Not available)
One Condition, Age-restricted
Demographics, Diagnostic, Laboratory, Vitals, History
Bivariate analyses, Multivariate logistic regression
P<0.001 for bi-variate, All-age model (C=0.61), Greater-than 65 y.o. model (C=0.59)
Age (lower), HCT (lower), BUN (higher), History of HF, History of COPD, History of Aortic Stenosis, History of stroke and Lower heart rate (for > 65 yo)

44
32 Medical Record (Electronic)
All-Cause Demographics, Diagnostic, Procedure, Laboratory, Social, Vitals, Medications, History , LOS, Discharge Location, Resource utilization
Multivariate logistic regression
Admission Model (Derivation (C= 0.76), Validation internal (C=0.75), External validation without recalibaration (C=0.69), external validation with recalibration (C= 0.76)), Discharge Model (Derivation (C=0.78), Validation internal (C=0.77), External validation without recalibaration (C=0.71), External validation with recalibration (C=0.78))
Model improvement with addition of LOS, Conditions, Procedures and Discharge disposition
33 Administrative (Not available)
All-Cause, Other
Demographics, Diagnostic, Procedure, Indexes, Social, Discharge Location
Multivariate logistic regression
P < 0.05 Readmission Risk classification, Disability status, Number of surgeries, Bed section (intermediate location)
34 Medical Record (Not Electronic)
Group of conditions
Demographics, Diagnostic, Indexes, Resource utilization, Other(Episodes of seclusion or restraint)
Bivariate analyses, Multivariate logistic regression
P < 0.05, P < 0.001 for model fit
Number of previous admissions, BPRS scores for self-neglect and Thought disorder

45
35 Medical Record (Electronic), Administrative (Electronic)
All-Cause Demographics, Diagnostic, Indexes, Social, Medications, LOS, Discharge Location, Resource utilization, Other(Activities of daily living, functional status, discharge season)
Bivariate analyses, Multivariate logistic regression
LACE alone, Cut-off 10 (C=0.711), LACE alone, Cut-off 8 (C=0.774), LACE with other factors (C=0.774)
LACE, Functional status, Insurance type, Possession of Primary Care Physician, ER admission (lower), Activities of daily living
36 Medical Record (Electronic), Administrative (Electronic)
All-Cause, Age-restricted
Demographics, Diagnostic, Social, History, Resource utilization
Multivariate logistic regression
P < 0.001, Derivation (C=0.819), Validation (0.824)
Age, Gender, Number of prior readmisions, Number of patient days (acute and non-acute), Number of diagnostic groups, Type of admission (emergent highest), Co-morbidities (renal dialysis highest)
37 Medical Record (Electronic), Administrative (Electronic), Other (Electronic - VA Office of Quality and Performance Stroke Special Project)
One Condition, Other
Demographics, Diagnostic, Indexes, Social, Vitals, Behavioral/Cognitive, Resource utilization, Other(Functional status)
Bivariate analyses, Multivariate logistic regression, Other (Net reclassification improvement for comparing social / clinical models over the CMS standard model)
CMS (C=0.636), CMS + Social (C=0.646), CMS + Social + Clinical (C=0.661)
Age, Number of co-morbidities, Metastatic cancer or Skin ulcers (Model 1), Low-income (Model 2), Age, Apache score, Skin ulcers (Model 3)

46
38 Medical Record (Electronic), Administrative (Electronic)
Age-restricted , Other
Demographics, Indexes, Social, Medications, Resource utilization, Hospital Characteristics, Other(Fragility-related diagnoses)
Bivariate analyses, Multivariate logistic regression
P < 0.001, C=0.6554
Co-morbidities (including presence of Mental illness (protective), Charlson index, and Fraility-related diagnoses), Previous hospitalization, Previous high-risk medication exposure, and Poverty level
39 Medical Record (Electronic), Administrative (Electronic), Other (Electronic - Chronic disease registry)
All-Cause Demographics, Diagnostic, Laboratory, Indexes, Social, Vitals, Medications, Behavioral/Cognitive, Resource utilization, Other(Disability status, imaging report)
Bivariate analyses, Multivariate logistic regression, Other (CART (classification and regression trees), C5. 0 and Chi-square Automatic Interaction Detection (CHAID), and neural networks models)
P < 0.001 for bi-variate and logistic, Derivation (C=0.7), Validation (C=0.69)
Chronic conditions (CHF, COPD, Chronic Renal Failure, Arrythmia, Malignancy), Number of hospitalizations in previous year
40 Medical Record (Electronic), Other (Electronic - Humedica CDR)
One Condition
Demographics, Diagnostic, Procedure, Laboratory, Indexes, Medications, LOS, Discharge Location, Resource utilization
Bivariate analyses, Multivariate logistic regression
C=0.693 Diabetes treatment escalation, LOS, Previous hospitalizations w/in 6 mo, Payer type, Charlson Index, Co-morbidities (Hypertension and Heart failure)

47
41 Administrative (Electronic)
All-Cause, Other
Demographics, Diagnostic, Social, LOS
Multivariate logistic regression, Other (Complex custom model including elements of Hazards, Bayesian and Markov Chain Monte Carlo models, Other models used for comparison included classification and regression trees, a boosting algorithm (AdaBoost) and Bayesian networks)
MSE = 0.05 (Custom model), MSE = 0.16 (CART, boosting, logistic), MSE= 0.225 (Bayes Net)
Not available
42 Medical Record (Not available), Administrative (Electronic), Survey
All-Cause Indexes, Resource utilization
Multivariate logistic regression
Derivation using LACE (C=0.7114), Validation (C=0.6935), External validation (C=0.684)
LOS, Acute emergent admission, Co-morbidity (Charlson Index), Visits to ER during prev. 6 mo.
43 Medical Record (Electronic)
All-Cause Demographics, Diagnostic, Laboratory, Indexes, Social, Vitals, LOS, Resource utilization
Bivariate analyses, Multivariate logistic regression, Other (Integrated Discrimination Improvement for comparing models, and net reclassification improvement)
24-hour model (C=0.69), 24-hour + Discharge model (C=0.71), Combined model significantly better discrimination than LACE and CMS model (NRI index, P < 0.001, IDI Index P < 0.05)
Several lab values (Albumin, HCT, Bun), Insurance type, Age, Past utilization, Elective admission
44 Administrative (Electronic)
All-Cause Indexes, Resource utilization
Bivariate analyses
Not available High LACE (>= 10) had RR of 2. 08

48
45 Medical Record (Electronic)
All-Cause Demographics, Diagnostic, Procedure, Indexes, Discharge Location, Resource utilization, Other(Admission urgency)
Multivariate logistic regression
Non-clinical model (C=0.67), Charlson Index Model (C=0.69), SQLape-based model (C=0.72)
Charlson score, Previous admission, "High risk" operation or Malignancy under the SQLape categorization
46 Medical Record (Electronic), Administrative (Electronic)
One Condition, Age-restricted
Demographics, Diagnostic, Laboratory
Multivariate logistic regression
Administrative model (Derivation (C=0.60), Validation C=(0.60,0.61)), Medical record model (Derivation (C=0.58), Validation (C=0.61))
Administrative model (Acute coronary syndrome, renal failure, COPD, metastatic cancer or acute leukemia, severe hematologic disorders), Medical record model (Congestive heart failure, high BUN or creatinine, low hematocrit, history of heart disease)
47 Medical Record (Electronic), Administrative (Electronic)
All-Cause, Other
Demographics, Diagnostic
Multivariate logistic regression
P < 0.05 for individual variables, Charlson Index diagnoses model (C=0.675), Chronic Disease Score diagnoses model (C=0.68)
Charson Index diagnoses model (COPD, Diabetes, Metastatic solid tumor), Chronic Disease Score diagnoses model (Malignancies, Parkinson's Disease, Cardiac disease, Diabetes)
48 Administrative (Electronic), Other (Electronic - Quebec Trauma Registry)
Other Demographics, Diagnostic, Indexes, Resource utilization, Other(Body region and mechanism of injury)
Multivariate logistic regression
P < 0.001, C=0.651
Age, Female, Injury Severity, Body region (Abdomen and Thorax), Number of prior admissions, Co-morbidities (Cancer and Pyschosis)

49
49 Administrative (Electronic)
Age-restricted , Group of conditions
Demographics, Diagnostic, Procedure, LOS
Multivariate logistic regression
P < 0.01, Condition-specific models ranged from C=0.56 (Respiratory failure, COPD, Angioplasty), C=0.62 (Prostatectomy), C=0.68 (Cholecystitis)
Cholecystitis (Gall bladder dysfunction / Carcinoma with operation, LOS, Non-operative gall bladder cases, Presence of cardiac disease), Prostatectomy (Benign prostatic hyperplasia, prostatic abcess, LOS)
50 Other (Electronic)
Surgery Demographics, Diagnostic, Procedure, Laboratory, Indexes, Vitals, Other(Functional status)
Bivariate analyses, Multivariate logistic regression
P<0.05 for bivariate, Full model for ovarian (C=0.85), Full model for benign gynecologic disease (C=0.83)
ASA class, Functional status, Pre-operative conditions (including Diabetes and CHF), and Post-operative conditions (SSI, reoperation, Pulmonary embolism, UTI, Sepsis, Myocardial infarction)
51 Administrative (Electronic), Other (Electronic - Heart Failure registry (GWTG-HF) data)
One Condition, Age-restricted
Demographics, Diagnostic, Procedure, Laboratory, Vitals, History
Bivariate analyses, Multivariate logistic regression
Claims only model (C=0.587), Claims-clinical model (C=0.599)
Hemoglobin, Serum creatinine, Serum sodium, Systolic blood pressure
52 Administrative (Electronic), Other (Electronic - Registry - CSRS Cardiac Reporting System)
Surgery Demographics, Diagnostic, Procedure, History, LOS, Hospital Characteristics
Bivariate analyses, Multivariate logistic regression
Readmission after CABG surgery (C=0.62)
Age, Gender, Body surface area, CHF, Postsurgical LOS, Co-morbidities (including Diabates, COPD, Hepatic failure), Dialysis, Annual surgeon volume, Discharge location, Hospital risk-

50
adjusted mortality rate
53 Other (Electronic - National Surgical Quality Improvement Program database)
Surgery Demographics, Diagnostic, Procedure, Laboratory, Indexes, Vitals, Medications, History, LOS, Discharge Location, Other(Functional status)
Bivariate analyses, Multivariate logistic regression
Derivation (C=0.681), Validation (C=0.646), Using Risk Score (C=0.676)
Thyroid malignancy, ASA > 2, Renal insufficiency, Hypoalbuminemia, Duration of stay > 1 day
54 Administrative (Electronic), Other (Electronic - Heart Failure registry (GWTG-HF) data)
One Condition, Age-restricted
Demographics, Diagnostic, Laboratory, Vitals, History, Resource utilization, Hospital Characteristics
Multivariate logistic regression
P < 0.05, Both models Derivation (C=0.59), Validation (C=0.59)
Hemoglobin, Discharge labs (Sodium, Creatinine), Age, Race, BNP, Toponin abnormal, BUN, Heart rate, Systolic BP at admission
Inclusion / Exclusion Criteria IEC - 1: 30-Day Readmission
IEC - 2: Not a systematic review, meta-analysis, or editorial
IEC - 3: Not limited to a pediatric population (< 18 years old)
IEC - 4: Existence of a Prediction Model

51
References
[1] "Readmissions Reduction Program (HRRP)," 2016.
[2] L. Horwitz, C. Partovian, Z. Lin, J. Herrin, J. Grady, M. Conover, J. Montague, C. Dillaway, K.
Bartczak, J. Ross, S. Bernheim, E. Drye and H. M. Krumholz, "Hospital-Wide (All-Condition)
30‐Day Risk-Standardized Readmission Measure," Yale New Haven Health Services
Corporation/Center for Outcomes Research & Evaluation, New Haven, Connecticut, 2011.
[3] "2014 Measure Updates and Specifications Report," Yale New Haven Health Services
Corporation/Center for Outcomes Research & Evaluation, New Haven, Connecticut, 2014.
[4] M. V. Williams, "A requirement to reduce readmissions: take care of the patient, not just
the disease," vol. 309, no. 4, pp. 394-396, 2013.
[5] K. E. Joynt and A. K. Jha, "Thirty-day readmissions--truth and consequences," vol. 366, no.
15, pp. 1366-1369, 2012.
[6] S. F. Jencks, M. V. Williams and E. A. Coleman, "Rehospitalizations among patients in the
Medicare fee-for-service program," vol. 360, no. 14, pp. 1418-1428, 2009.
[7] A. Hines, M. Barrett, H. Jiang and C. Steiner, "Conditions With the Largest Number of Adult
Hospital Readmissions by Payer, 2011," Agency for Healthcare Research and Quality,
Rockville, MD, 2014.
[8] M. Barrett, L. Wier, H. Jiang and C. Steiner, "All-Cause Readmissions by Payer and Age,
2009-2013.," Agency for Healthcare Research and Quality, Rockville, MD, 2015.
[9] C. Boccuti and G. Casillas, "Aiming for Fewer Hospital U-turns: The Medicare Hospital
Readmission Reduction Program," The Henry J. Kaiser Family Foundation, 2015.
[10] R. A. Berenson, R. A. Paulus and N. S. Kalman, "Medicare's readmissions-reduction
program--a positive alternative," vol. 366, no. 15, pp. 1364-1366, 2012.
[11] F. PB and M. RA, "Revisiting hospital readmissions," vol. 309, no. 4, pp. 398-400, 2013.
[12] C. van Walraven, A. Jennings, M. Taljaard, I. Dhalla, S. English, S. Mulpuru, S. Blecker and A.
J. Forster, "Incidence of potentially avoidable urgent readmissions and their relation to all-
cause urgent readmissions," vol. 183, no. 14, pp. E1067--E1072, 2011.
[13] "Insights for Improvement, Reducing Readmissions: Measuring Health Plan Performance,"
2012.

52
[14] D. Charles, M. Gabriel and T. Searcy, "Adoption of Electronic Health Record Systems among
U.S. Non-Federal Acute Care Hospitals: 2008-2014," Office of the National Coordinator for
Health Information Technology, Washington, DC, 2015.
[15] "Reducing Readmissions - Top Ways Information Technology Can Help," 2012.
[16] D. Kansagara, H. Englander, A. Salanitro, D. Kagen, C. Theobald, M. Freeman and S.
Kripalani, "Risk prediction models for hospital readmission: a systematic review," vol. 306,
no. 15, pp. 1688-1698, 2011.
[17] R. Amarasingham, B. J. Moore, Y. P. Tabak, M. H. Drazner, C. A. Clark, S. Zhang, W. G. Reed,
T. S. Swanson, Y. Ma and E. A. Halm, "An automated model to identify heart failure patients
at risk for 30-day readmission or death using electronic medical record data," Medical care,
vol. 48, no. 11, pp. 981-988, 2010.
[18] A. H. Zai, J. G. Ronquillo, R. Nieves, H. C. Chueh, J. C. Kvedar and K. Jethwani, "Assessing
hospital readmission risk factors in heart failure patients enrolled in a telemonitoring
program," International journal of telemedicine and applications, vol. 2013, p. 1, 2013.
[19] C. Hebert, C. Shivade, R. Foraker, J. Wasserman, C. Roth, H. Mekhjian, S. Lemeshow and P.
Embi, "Diagnosis-specific readmission risk prediction using electronic health data: a
retrospective cohort study," BMC medical informatics and decision making, vol. 14, no. 1, p.
1, 2014.
[20] O. Hasan, D. O. Meltzer, S. A. Shaykevich, C. M. Bell, P. J. Kaboli, A. D. Auerbach, T. B.
Wetterneck, V. M. Arora, J. Zhang and J. L. Schnipper, "Hospital readmission in general
medicine patients: a prediction model," Journal of general internal medicine, vol. 25, no. 3,
pp. 211-219, 2010.
[21] D. He, S. C. Mathews, A. N. Kalloo and S. Hutfless, "Mining high-dimensional administrative
claims data to predict early hospital readmissions," Journal of the American Medical
Informatics Association, vol. 21, no. 2, pp. 272-279, 2014.
[22] J. Donzé, D. Aujesky, D. Williams and J. L. Schnipper, "Potentially avoidable 30-day hospital
readmissions in medical patients: derivation and validation of a prediction model," JAMA
internal medicine, vol. 173, no. 8, pp. 632-638, 2013.
[23] G. M. Allison, E. G. Muldoon, D. M. Kent, J. K. Paulus, R. Ruthazer, A. Ren and D. R.
Snydman, "Prediction model for 30-day hospital readmissions among patients discharged
receiving outpatient parenteral antibiotic therapy," Clinical infectious diseases, vol. 58, no.
6, pp. 812-819, 2014.

53
[24] N. Bejanyan, B. J. Bolwell, A. Lazaryan, L. Rybicki, S. Tench, H. Duong, S. Andresen, R.
Sobecks, R. Dean, B. Pohlman and others, "Risk factors for 30-day hospital readmission
following myeloablative allogeneic hematopoietic cell transplantation (allo-HCT)," Biology
of Blood and Marrow Transplantation, vol. 18, no. 6, pp. 874-880, 2012.
[25] M. D. Silverstein, H. Qin, S. Q. Mercer, J. Fong and Z. Haydar, "Risk factors for 30-day
hospital readmission in patients? 65 years of age," in Baylor {University} {Medical} {Center}.
{Proceedings}, 2008.
[26] V. A. Ferraris, S. P. Ferraris, R. C. Harmon and B. D. Evans, "Risk factors for early hospital
readmission after cardiac operations," The Journal of thoracic and cardiovascular surgery,
vol. 122, no. 2, pp. 278-286, 2001.
[27] E. M. Graboyes, T.-N. Liou, D. Kallogjeri, B. Nussenbaum and J. A. Diaz, "Risk factors for
unplanned hospital readmission in otolaryngology patients," Otolaryngology–Head and
Neck Surgery, vol. 149, no. 4, pp. 562-571, 2013.
[28] Q. L. Huynh, M. Saito, C. L. Blizzard, M. Eskandari, B. Johnson, G. Adabi, J. Hawson, K.
Negishi, T. H. Marwick, M. Investigators and others, "Roles of nonclinical and clinical data in
prediction of 30-day rehospitalization or death among heart failure patients," Journal of
cardiac failure, vol. 21, no. 5, pp. 374-381, 2015.
[29] T. Braes, P. Moons, P. Lipkens, W. Sterckx, M. Sabbe, J. Flamaing, S. Boonen and K. Milisen,
"Screening for risk of unplanned readmission in older patients admitted to hospital:
predictive accuracy of three instruments," Aging clinical and experimental research, vol. 22,
no. 4, pp. 345-351, 2010.
[30] C. Walsh and G. Hripcsak, "The effects of data sources, cohort selection, and outcome
definition on a predictive model of risk of thirty-day hospital readmissions," Journal of
biomedical informatics, vol. 52, pp. 418-426, 2014.
[31] S. Sudhakar, W. Zhang, Y.-F. Kuo, M. Alghrouz, A. Barbajelata and G. Sharma, "Validation of
the Readmission Risk Score in Heart Failure Patients at a Tertiary Hospital," Journal of
cardiac failure, vol. 21, no. 11, pp. 885-891, 2015.
[32] S. A. Choudhry, J. Li, D. Davis, C. Erdmann, R. Sikka and B. Sutariya, "A public-private
partnership develops and externally validates a 30-day hospital readmission risk prediction
model," Online journal of public health informatics, vol. 5, no. 2, p. 219, 2013.
[33] J. Holloway, S. V. Medendorp and J. Bromberg, "Risk factors for early readmission among
veterans.," Health services research, vol. 25, no. 1 Pt 2, p. 213, 1990.

54
[34] C. Swett, "Symptom severity and number of previous psychiatric admissions as predictors
of readmission.," Psychiatric Services, 1995.
[35] L. Spiva, M. Hand, L. VanBrackle and F. McVay, "Validation of a Predictive Model to Identify
Patients at High Risk for Hospital Readmission," Journal for Healthcare Quality, 2014.
[36] E. Tsui, S. Y. Au, C. P. Wong, A. Cheung and P. Lam, "Development of an automated model
to predict the risk of elderly emergency medical admissions within a month following an
index hospital visit: A Hong Kong Experience," Health informatics journal, vol. 21, no. 1, pp.
46-56, 2015.
[37] S. Keyhani, L. J. Myers, E. Cheng, P. Hebert, L. S. Williams and D. M. Bravata, "Effect of
clinical and social risk factors on hospital profiling for stroke readmission: a cohort study,"
Annals of internal medicine, vol. 161, no. 11, pp. 775-784, 2014.
[38] J. A. Pugh, C.-P. Wang, S. E. Espinoza, P. H. Noël, M. Bollinger, M. Amuan, E. Finley and M. J.
Pugh, "Influence of Frailty-Related Diagnoses, High-Risk Prescribing in Elderly Adults, and
Primary Care Use on Readmissions in Fewer than 30 Days for Veterans Aged 65 and Older,"
Journal of the American Geriatrics Society, vol. 62, no. 2, pp. 291-298, 2014.
[39] E. Shadmi, N. Flaks-Manov, M. Hoshen, O. Goldman, H. Bitterman and R. D. Balicer,
"Predicting 30-day readmissions with preadmission electronic health record data," Medical
care, vol. 53, no. 3, pp. 283-289, 2015.
[40] E. Eby, C. Hardwick, M. Yu, S. Gelwicks, K. Deschamps, J. Xie and T. George, "Predictors of
30 day hospital readmission in patients with type 2 diabetes: a retrospective, case–control,
database study," Current medical research and opinion, vol. 31, no. 1, pp. 107-114, 2015.
[41] J. E. Helm, A. Alaeddini, J. M. Stauffer, K. M. Bretthauer and T. A. Skolarus, "Reducing
hospital readmissions by integrating empirical prediction with resource optimization,"
Production and Operations Management, 2015.
[42] C. van Walraven, I. A. Dhalla, C. Bell, E. Etchells, I. G. Stiell, K. Zarnke, P. C. Austin and A. J.
Forster, "Derivation and validation of an index to predict early death or unplanned
readmission after discharge from hospital to the community," Canadian Medical
Association Journal, vol. 182, no. 6, pp. 551-557, 2010.
[43] R. Amarasingham, F. Velasco, B. Xie, C. Clark, Y. Ma, S. Zhang, D. Bhat, B. Lucena, M. Huesch
and E. A. Halm, "Electronic medical record-based multicondition models to predict the risk
of 30 day readmission or death among adult medicine patients: validation and comparison
to existing models," BMC medical informatics and decision making, vol. 15, no. 1, p. 1, 2015.

55
[44] A. Gruneir, I. A. Dhalla, C. van Walraven, H. D. Fischer, X. Camacho and P. Rochon,
"Unplanned readmissions after hospital discharge among patients identified as being at
high risk for readmission using a validated predictive algorithm," Open Medicine, vol. 5, no.
2, pp. 104-111, 2011.
[45] P. Halfon, Y. Eggli, I. Prêtre-Rohrbach, D. Meylan, A. Marazzi and B. Burnand, "Validation of
the potentially avoidable hospital readmission rate as a routine indicator of the quality of
hospital care," Medical care, vol. 44, no. 11, pp. 972-981, 2006.
[46] P. S. Keenan, S.-L. T. Normand, Z. Lin, E. E. Drye, K. R. Bhat, J. S. Ross, J. D. Schuur, B. D.
Stauffer, S. M. Bernheim, A. J. Epstein and others, "An administrative claims measure
suitable for profiling hospital performance on the basis of 30-day all-cause readmission
rates among patients with heart failure," Circulation: Cardiovascular Quality and Outcomes,
vol. 1, no. 1, pp. 29-37, 2008.
[47] J. P. Parker, J. S. McCombs and E. A. Graddy, "Can pharmacy data improve prediction of
hospital outcomes?: Comparisons with a diagnosis-based comorbidity measure," Medical
care, vol. 41, no. 3, pp. 407-419, 2003.
[48] L. Moore, H. T. Stelfox, A. F. Turgeon, A. B. Nathens, A. Lavoie, G. Bourgeois and J. Lapointe,
"Derivation and validation of a quality indicator for 30-day unplanned hospital readmission
to evaluate trauma care," Journal of Trauma and Acute Care Surgery, vol. 76, no. 5, pp.
1310-1316, 2014.
[49] J. W. Thomas, "Does risk-adjusted readmission rate provide valid information on hospital
quality?," Inquiry, pp. 258-270, 1996.
[50] K. Dessources, J. Y. Hou, A. I. Tergas, W. M. Burke, C. V. Ananth, E. Prendergast, L. Chen, A.
I. Neugut, D. L. Hershman and J. D. Wright, "Factors associated with 30-day hospital
readmission after hysterectomy," Obstetrics \& Gynecology, vol. 125, no. 2, pp. 461-470,
2015.
[51] B. G. Hammill, L. H. Curtis, G. C. Fonarow, P. A. Heidenreich, C. W. Yancy, E. D. Peterson and
A. F. Hernandez, "Incremental value of clinical data beyond claims data in predicting 30-day
outcomes after heart failure hospitalization," Circulation: Cardiovascular Quality and
Outcomes, vol. 4, no. 1, pp. 60-67, 2011.
[52] E. L. Hannan, M. J. Racz, G. Walford, T. J. Ryan, O. W. Isom, E. Bennett and R. H. Jones,
"Predictors of readmission for complications of coronary artery bypass graft surgery," Jama,
vol. 290, no. 6, pp. 773-780, 2003.
[53] J. C. Iannuzzi, F. J. Fleming, K. N. Kelly, D. T. Ruan, J. R. Monson and J. Moalem, "Risk scoring
can predict readmission after endocrine surgery," Surgery, vol. 156, no. 6, pp. 1432-1440,
56
2014.
[54] Z. J. Eapen, L. Liang, G. C. Fonarow, P. A. Heidenreich, L. H. Curtis, E. D. Peterson and A. F.
Hernandez, "Validated, electronic health record deployable prediction models for assessing
patient risk of 30-day rehospitalization and mortality in older heart failure patients," JACC:
Heart Failure, vol. 1, no. 3, pp. 245-251, 2013.
[55] W. Yu, T. Liu, R. Valdez, M. Gwinn and M. J. Khoury, "Application of support vector machine
modeling for prediction of common diseases: the case of diabetes and pre-diabetes," BMC
Medical Informatics and Decision Making, vol. 10, no. 1, p. 16, 2010.
[56] S. Dreiseitl and L. Ohno-Machado, "Logistic regression and artificial neural network
classification models: a methodology review," Journal of Biomedical Informatics, vol. 35, no.
5–6, pp. 352-359, #oct# 2002.
[57] F. Amato, A. López, E. M. Peña-Méndez, P. Vaňhara, A. Hampl and J. Havel, "Artificial neural
networks in medical diagnosis," Journal of Applied Biomedicine, vol. 11, no. 2, pp. 47-58,
2013.
[58] K. G. Moons, J. A. de Groot, W. Bouwmeester, Y. Vergouwe, S. Mallett, D. G. Altman, J. B.
Reitsma and G. S. Collins, "Critical appraisal and data extraction for systematic reviews of
prediction modelling studies: the CHARMS checklist," PLoS Med, vol. 11, no. 10, p.
e1001744, 2014.
[59] G. S. Collins, J. B. Reitsma, D. G. Altman and K. G. Moons, "Transparent reporting of a
multivariable prediction model for individual prognosis or diagnosis (TRIPOD): the TRIPOD
Statement," BMC Medicine, vol. 13, p. 1, 2015.

57
Curriculum Vitae
BRETT CROPP
[email protected] | 64 Parkwood Ave Kenmore, NY 14217 | (716) 867-0035
EDUCATION
2004-2008 Bachelor of Arts, Human Biology
Brown University, Providence, RI
PROFESSIONAL AND RESEARCH EXPERIENCE
Oct. 2014 - Present Research Scientist
CUBRC, Inc. Information Exploitation Sector, Buffalo, NY
● Key part of a business initiative tasked to adopt and develop information technology for health informatics applications for insurance companies and providers
● Active development of a complex event processing application for detection and notification of medical non-adherence events in pharmacy claims data
● Active development of a distributed triple storage system for healthcare data and graph-based data exploration and analysis using basic formal ontology (BFO)-compliant medical ontologies
Jun. 2013-Oct. 2014 Research Assistant
Center for Population Health Information Technology, JH Bloomberg School of Public Health,
Dr. Hadi Kharrazi
● Extraction, parsing and normalization of HL7 v2 ADT messages from the Maryland Health Information Exchange for use in a readmissions risk prediction algorithm
Jan. 2012-July 2014 Research Contractor
Section on Integrative Neuroimaging, National Institutes of Mental Health, NIH, Bethesda, MD
Dr. Karen F. Berman
● Lead programmer, development of MSSQL database and Java GUI for research data collection
Jan. 2010-Jan. 2012 Postbaccalaureate Intramural Research Training Award (IRTA)
Fellowship
● Lead Programmer, Computational neuroscience of dopamine mediation of incentive-

58
based decision-making measured by PET Fluro-DOPA receptor imaging in healthy adults ● Lead Analyst, Assessment of genotype effects (BDNF & COMT) on human decision-
making behavior Mar. 2009-Dec. 2009 Research Support Specialist
CUBRC, Buffalo, NY
● Designed and integrated statistical routines for web-based relational database for DoD clinical research of Traumatic Brain Injuries
● Interfaced MySQL, R, Java and Java Server Pages
May 2008-Feb. 2009 Research Assistant
Bioacoustics Research Program, Cornell Lab of Ornithology Dr. Sandra
Vehrencamp
● Designed experimental analysis testing for singing patterns in aggressive songbird interactions
● Three months of fieldwork in a tropical dry forest in Costa Rica ● Organized, processed and analyzed acoustic and behavioral data using custom MATLAB
scripting, leading to a peer-reviewed publication
Jun. 2007-May 2008 Research Assistant
Brown University Psychology Laboratory Dr. Andrea Megela Simmons, Dr.
James Simmons
● Analysis of vocal interactions in natural bullfrog choruses using a novel microphone array system, leading to a peer-reviewed publication
● Processed and analyzed sound and location data using custom MATLAB routines
PEER-REVIEWED PUBLICATIONS
1. Bates ME, Cropp BF, Gonchar M, Knowles J, Simmons JA, Simmons AM. Spatial location
influences vocal interactions in bullfrog choruses. The Journal of the Acoustical Society of
America 127, no. 4 (April 2010): 2664-2677.
2. Goker-Alpan O, Masdeu JC, Kohn PD, Ianni A, Lopez G, Groden C, Chapman MC, Cropp BF,
Eisenberg DP, Maniwang ED, Davis J, Wiggs E, Sidransky E, Berman KF. The neurobiology of
glucocerebrosidase-associated parkinsonism: a positron emission tomography study of
dopamine synthesis and regional cerebral blood flow. Brain (2012) 135(8): 2440-2448
3. Nguyen TV, McCracken JT, Ducharme S, Cropp BF, Botteron KN, Evans AC, Karama S.
Interactive Effects of DHEA and Testosterone on Cortical Thickness during Early Brain
Development” Journal of Neuroscience (2013) 33(26): 10840-10848

59
4. Jabbi M, Nash T, Kohn P, Ianni A, Coutlee C, Holroyd T, Carver F, Chen Q, Cropp BF,
Kippenhan JS, Robinson S, Coppola R, Berman KF. Convergent BOLD and beta-band activity in
superior temporal sulcus and frontolimbic circuitry underpins human emotion cognition.
Cerebral Cortex (2014): bht427.
5. Vehrencamp SL, Ellis JM, Cropp BF, Koltz J. Negotiation of territory boundaries in the banded
wren. Behavioral Ecology (2014).
6. Jabbi, M, Prabhakaran, R, Ekuta, V, Damme, K, Cropp, B, Roe, K, ... Berman, KF. Human
Superior Temporal Sulcus Subserves both Concrete and Abstract Social Cognition in Typical
Development. Neuropsychopharmacology (2014, December): (Vol. 39, pp. S502-S503).
CONFERENCE PROCEEDINGS
1. Cropp BF, Jabbi M, Kohn P, Nash T, Raila H, Kippenhan JS, Eisenberg D, Masdeu J, Berman KF.
Midbrain dopamine modulates mesocorticolimbic and sensorimotor regulation of decision-
making.
17th annual meeting, Organization for Human Brain Mapping (HBM). June 2011, Quebec City,
Canada.
41nd annual meeting of the Society for Neuroscience (SFN). October 2011, Washington DC.
67th annual meeting, Society of Biological Psychiatry (SOBP). May 2012, Philadelphia, PA.
2. Cropp BF, Bates ME, Simmons JA, Simmons AM. Spatial and temporal organization of
acoustic interactions in bullfrog choruses. 12th Congress of the International Behavioral Ecology
(ISBE).