
30 - daiwahouse-reit.co.jp
45
Semi-Annual Report for the 30th Fiscal Period From September 1, 2020 to February 28, 2021 Securities Code: 8984 2-4-8, Nagatacho, Chiyoda-ku, Tokyo, Japan https://www.daiwahouse-reit.co.jp/en/ https://www.daiwahouse-reit.co.jp/en/
Transcript of 30 - daiwahouse-reit.co.jp

Semi-Annual Report
for the 30th Fiscal PeriodFrom September 1, 2020 to February 28, 2021
Securities Code: 8984
2-4-8, Nagatacho, Chiyoda-ku, Tokyo, Japan
https://www.daiwahouse-reit.co.jp/en/
https://www.daiwahouse-reit.co.jp/en/
We would like to send our heartfelt sympathy to everyone who has fallen ill with COVID-19.
We would like to report on the financial results and give an overview of operations of Daiwa House REIT Investment Corporation (hereinafter referred to as “DHR”) in the 30th fiscal period ended February 28, 2021.
DHR acquired one hotel property being subleased by Daiwa House Group (acquisition price of ¥3.1 billion) in September 2020. Furthermore, in December 2020 and January 2021, DHR sold two residential properties with concerns over reduced medium- to long-term competitiveness and rising repairs and maintenance expenses (sale price of ¥2.7 billion), recording a gain on sales of ¥0.8 billion. As a result, DHR’s portfolio as of the end of the current fiscal period consisted of 227 properties with an asset size of ¥820.1 billion (total acquisition price). Our occupancy rate at the end of the current fiscal period was 99.4%. In the following fiscal period, in March 2021, DHR sold one residential property (sale price of ¥3.5 billion), and in April 2021, DHR acquired one logistics property (acquisition price of ¥5.9 billion).
In the Japanese economy today, an overall sense of uncertainty remains due to the serious effects of COVID-19. Even amid these conditions, only a portion of DHR’s tenants received rent reductions, and the effects of COVID-19 were minimal. The full-period contributions of properties acquired in the previous fiscal period and the recording of gains on sales mentioned above resulted in operating revenues of ¥28,097 million, operating income of ¥12,571 million, and net income of ¥11,098 million. The total amount of distributions was ¥12,859 million (¥5,856 per unit) after the addition of an amount equivalent to amortization of goodwill of ¥1,982 million to net income and the deduction of an amount equivalent to part of the gain on sale of real estate properties.
DHR will work to continuously increase unitholder value by ensuring stable revenue and steady growth of its portfolio over the medium to long term through fully utilizing its sponsor Daiwa House Group’s comprehensive strengths and knowhow regarding real-estate development.
In closing, we ask for the continued support of our unitholders and the investment community as we move forward.
Mid-Term Growth Strategy Aimingfor Sustainable Growth of DPU
External growth
Acquire properties accretive to DPU
Selectively acquire highly competitive properties mainly in the three major metropolitan areas and core regional cities(Note 1)
Leverage pipelines and promote portfolio rebal-ancing
Utilize various acquisition schemes
Internal growth
Improve profitability
Steadily increase rent mainly at the residential properties in central Tokyo
Additional investment in LED light installation and other value enhancement measures
Conduct planned large-scale repair
Promote redevelopment (rebuilding)
Finance
Maintain financial discipline
Equity financing attentive to NAV and growth of DPU
Control LTV (excluding goodwill) at around 45% with an upper limit at 50%
Decrease debt financing costs
Effective use of cash on hand
Over the 3 years after the merger (from September 2016 to August 2019)
Mid-Term Growth Strategy (from September 2019 onward)
ESG strategy Improve ESG rating by third parties including GRESB and MSCI Increase the ratio of properties with environmental certifications to 70% or more by the fiscal year ending March 31, 2031(Note 2)
(Note 1) “Core regional cities” are cities outside of the three major metropolitan areas designated by government ordinance of Japan (Sapporo City, Sendai City, Niigata City, Hamamatsu City,
Shizuoka City, Hiroshima City, Okayama City, Fukuoka City, Kitakyushu City, and Kumamoto City).
(Note 2) In April 2021, DHR raised the target ratio of properties with environmental certifications from 50% or more to 70% or more and announced a new target fiscal year.
C O N T E N T S
Mid-Term Growth Strategy • • • • • • • • • • • • • • • • • • • • • • • • • • • • • • • • 2
Overview of the 30th Fiscal Period Ended February 28, 2021 • • • 3
Financial Highlights for the Fiscal Period Ended February 28, 2021 • • • 4
External Growth • • • • • • • • • • • • • • • • • • • • • • • • • • • • • • • • • • • • • • • • • 6
ESG Initiatives • • • • • • • • • • • • • • • • • • • • • • • • • • • • • • • • • • • • • • • • • • • 7
Internal Growth Initiatives • • • • • • • • • • • • • • • • • • • • • • • • • • • • • • • 10
Portfolio Highlights • • • • • • • • • • • • • • • • • • • • • • • • • • • • • • • • • • • • • 11
Major Portfolio Properties • • • • • • • • • • • • • • • • • • • • • • • • • • • • • • • 12
Portfolio Map • • • • • • • • • • • • • • • • • • • • • • • • • • • • • • • • • • • • • • • • • • 13
Financial Status • • • • • • • • • • • • • • • • • • • • • • • • • • • • • • • • • • • • • • • • 14
I. Asset Management Report • • • • • • • • • • • • • • • • • • • • • • • • • • 16
II. Balance Sheets • • • • • • • • • • • • • • • • • • • • • • • • • • • • • • • • • • • • • 54
III. Statements of Income and Retained Earnings • • • • • • • • • • 56
IV. Statements of Changes in Net Assets • • • • • • • • • • • • • • • • • 57
V. Statements of Cash Flows • • • • • • • • • • • • • • • • • • • • • • • • • • • • 59
VI. Notes to Financial Statements • • • • • • • • • • • • • • • • • • • • • • • • 60
VII. Independent Auditor’s Report • • • • • • • • • • • • • • • • • • • • • • • • • 84
Investor Information • • • • • • • • • • • • • • • • • • • • • • • • • • • • • • • • • 88
¥5,856Distributions Per Unit(Note 1)
30th Fiscal Period(From September 1, 2020 to February 28, 2021)*Distribution payments start date is May 10, 2021.
Forecast distributions per unit(Note 2)
¥6,050 ¥5,50031st Fiscal Period(From March 1, 2021 to August 31, 2021)
32nd Fiscal Period(From September 1, 2021 to February 28, 2022)
(Note 1) Distributions per unit for the 30th fiscal period include distributions in excess of earnings of ¥755 (which do not apply to return of capital).
(Note 2) Forecast distributions per unit refer to the forecast as of April 20, 2021, and actual distributions per unit may vary from this figure. These forecasts also do not guarantee the amount
of distributions. Furthermore, forecast distributions per unit include distributions in excess of earnings, and we forecast distributions in excess of earnings per unit of ¥807 (which do
not apply to return of capital) for the fiscal period ending August 31, 2021 and ¥902 (including return of capital of ¥73) for the fiscal period ending February 28, 2022.
Asset SizeTarget Stabilized DPU Toshiharu AsadaExecutive Director
Daiwa House REIT Investment Corporation
Koichi TsuchidaPresident and CEO
Daiwa House Asset Management Co., Ltd.
32
Mid-Term Growth Strategy Overview of the 30th Fiscal Period Ended February 28, 2021
As of August 31, 2020
(29th period)
As of February 28, 2021
(30th period)Change
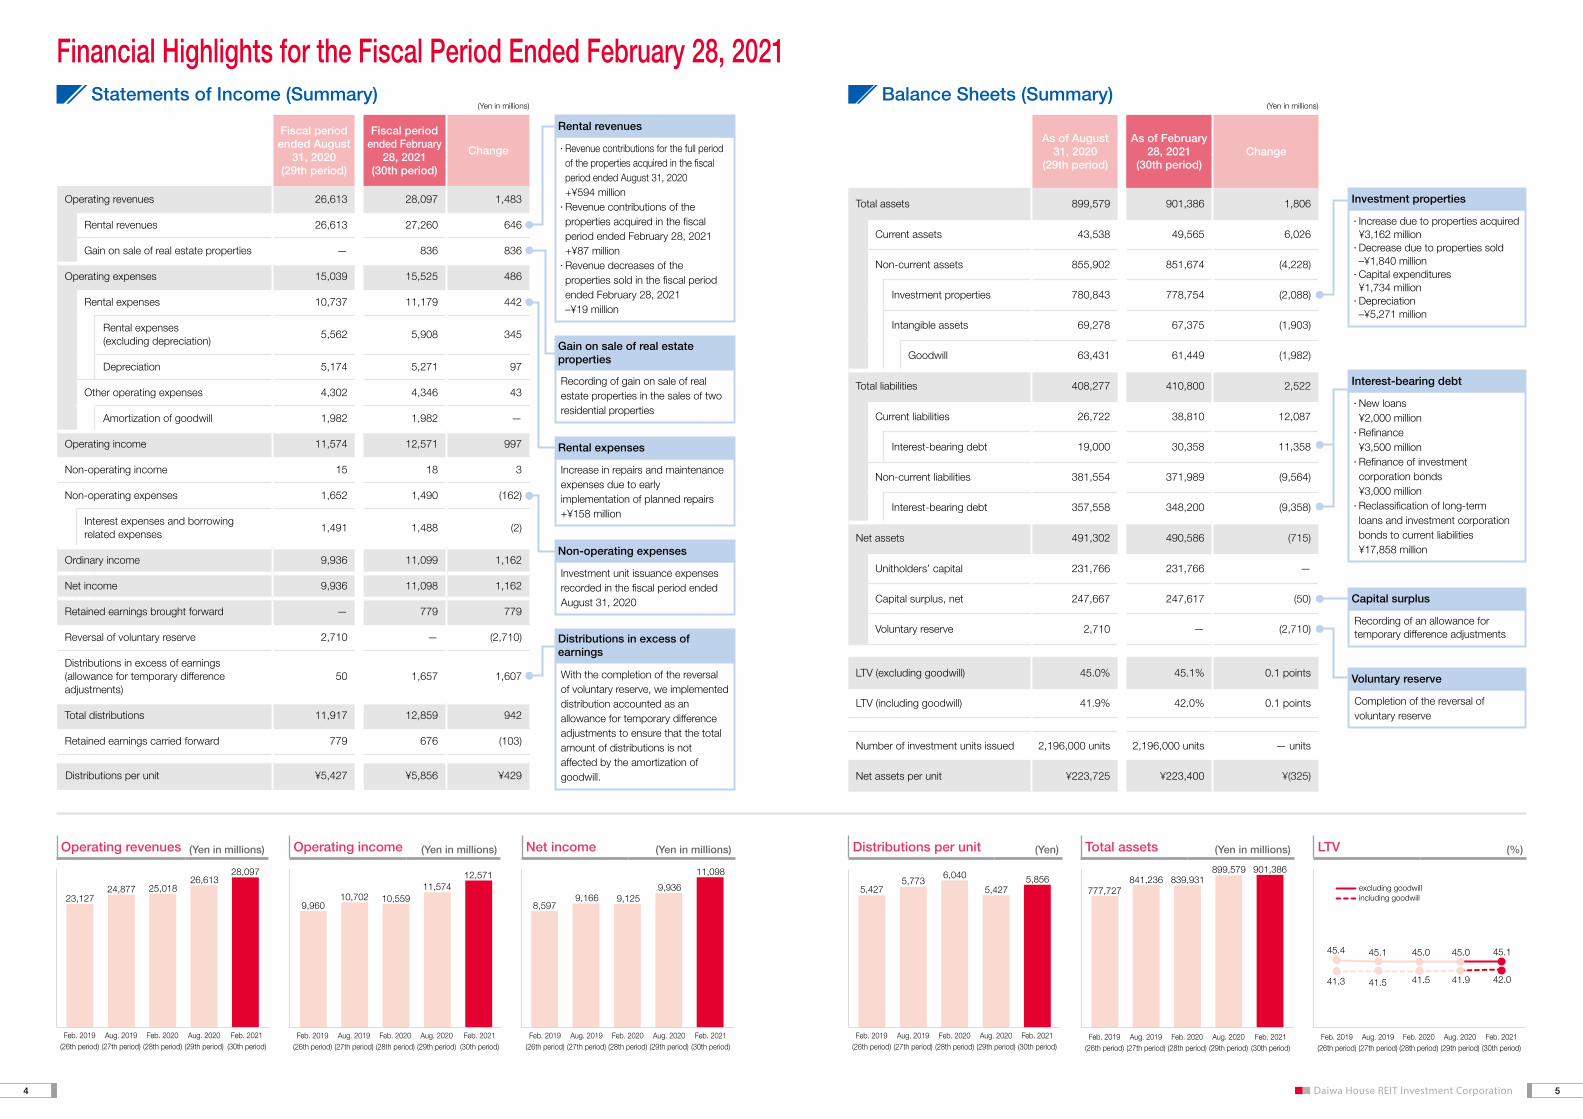
Total assets 899,579 901,386 1,806
Current assets 43,538 49,565 6,026
Non-current assets 855,902 851,674 (4,228)
Investment properties 780,843 778,754 (2,088)
Intangible assets 69,278 67,375 (1,903)
Goodwill 63,431 61,449 (1,982)
Total liabilities 408,277 410,800 2,522
Current liabilities 26,722 38,810 12,087
Interest-bearing debt 19,000 30,358 11,358
Non-current liabilities 381,554 371,989 (9,564)
Interest-bearing debt 357,558 348,200 (9,358)
Net assets 491,302 490,586 (715)
Unitholders’ capital 231,766 231,766 —
Capital surplus, net 247,667 247,617 (50)
Voluntary reserve 2,710 — (2,710)
LTV (excluding goodwill) 45.0% 45.1% 0.1 points
LTV (including goodwill) 41.9% 42.0% 0.1 points
Number of investment units issued 2,196,000 units 2,196,000 units — units
Net assets per unit ¥223,725 ¥223,400 ¥(325)
Fiscal period ended August
31, 2020(29th period)
Fiscal period ended February
28, 2021(30th period)
Change
Operating revenues 26,613 28,097 1,483
Rental revenues 26,613 27,260 646
Gain on sale of real estate properties — 836 836
Operating expenses 15,039 15,525 486
Rental expenses 10,737 11,179 442
Rental expenses(excluding depreciation)
5,562 5,908 345
Depreciation 5,174 5,271 97
Other operating expenses 4,302 4,346 43
Amortization of goodwill 1,982 1,982 —
Operating income 11,574 12,571 997
Non-operating income 15 18 3
Non-operating expenses 1,652 1,490 (162)
Interest expenses and borrowing related expenses
1,491 1,488 (2)
Ordinary income 9,936 11,099 1,162
Net income 9,936 11,098 1,162
Retained earnings brought forward — 779 779
Reversal of voluntary reserve 2,710 — (2,710)
Distributions in excess of earnings (allowance for temporary difference adjustments)
50 1,657 1,607
Total distributions 11,917 12,859 942
Retained earnings carried forward 779 676 (103)
Distributions per unit ¥5,427 ¥5,856 ¥429
(Yen in millions) (Yen in millions)
Operating revenues (Yen in millions) Operating income (Yen in millions) Net income (Yen in millions) Total assets (Yen in millions) LTV (%)Distributions per unit (Yen)
Revenue contributions for the full period of the properties acquired in the fiscal period ended August 31, 2020 +¥594 million Revenue contributions of the properties acquired in the fiscal period ended February 28, 2021 +¥87 million Revenue decreases of the properties sold in the fiscal period ended February 28, 2021 –¥19 million
Rental revenues
Recording of gain on sale of real estate properties in the sales of two residential properties
Gain on sale of real estate properties
Increase due to properties acquired ¥3,162 million Decrease due to properties sold –¥1,840 million
Capital expenditures ¥1,734 million Depreciation –¥5,271 million
Investment properties
New loans ¥2,000 million
Refinance ¥3,500 million Refinance of investment corporation bonds ¥3,000 million Reclassification of long-term loans and investment corporation bonds to current liabilities ¥17,858 million
Interest-bearing debt
Completion of the reversal of voluntary reserve
Voluntary reserve
Recording of an allowance for temporary difference adjustments
Capital surplus
Increase in repairs and maintenance expenses due to early implementation of planned repairs+¥158 million
Rental expenses
Investment unit issuance expenses recorded in the fiscal period ended August 31, 2020
Non-operating expenses
With the completion of the reversal of voluntary reserve, we implemented distribution accounted as an allowance for temporary difference adjustments to ensure that the total amount of distributions is not affected by the amortization of goodwill.
Distributions in excess ofearnings
25,018
28,09726,613
23,12724,877
Feb. 2019(26th period)
Aug. 2020(29th period)
Feb. 2020(28th period)
Feb. 2021(30th period)
Aug. 2019(27th period)
10,5599,960
10,702
12,57111,574
Aug. 2019(27th period)
Feb. 2019(26th period)
Aug. 2020(29th period)
Feb. 2020(28th period)
Feb. 2021(30th period)
9,1258,597
9,166
11,098
9,936
Aug. 2019(27th period)
Feb. 2019(26th period)
Aug. 2020(29th period)
Feb. 2020(28th period)
Feb. 2021(30th period)
6,040
5,4275,773 5,856
5,427
Aug. 2019(27th period)
Feb. 2019(26th period)
Aug. 2020(29th period)
Feb. 2020(28th period)
Feb. 2021(30th period)
839,931777,727
841,236901,386899,579
Aug. 2019(27th period)
Feb. 2019(26th period)
Aug. 2020(29th period)
Feb. 2020(28th period)
Feb. 2021(30th period)
42.0
45.1
41.3
45.4
41.5
45.1
41.5
45.0
41.9
45.0
excluding goodwillincluding goodwill
Aug. 2019(27th period)
Aug. 2020(29th period)
Feb. 2020(28th period)
Feb. 2021(30th period)
Feb. 2019(26th period)
54
Statements of Income (Summary) Balance Sheets (Summary)
Financial Highlights for the Fiscal Period Ended February 28, 2021
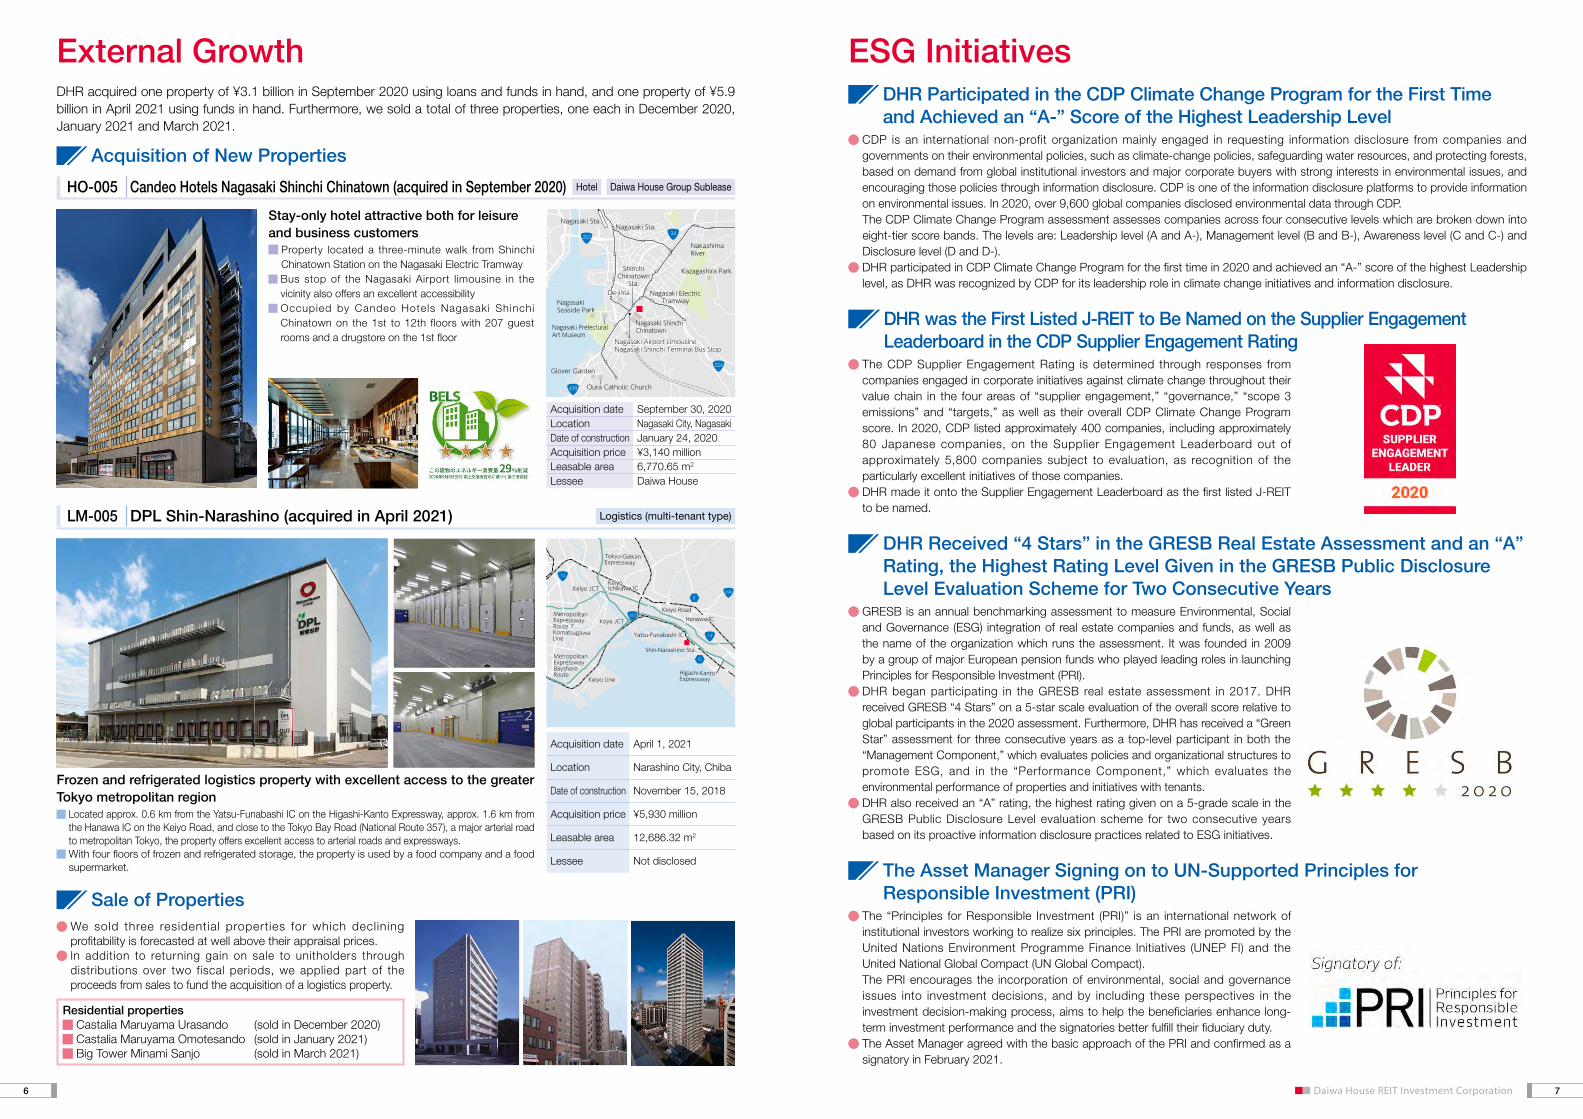
DHR acquired one property of ¥3.1 billion in September 2020 using loans and funds in hand, and one property of ¥5.9 billion in April 2021 using funds in hand. Furthermore, we sold a total of three properties, one each in December 2020, January 2021 and March 2021.
Residential properties Castalia Maruyama Urasando (sold in December 2020) Castalia Maruyama Omotesando (sold in January 2021) Big Tower Minami Sanjo (sold in March 2021)
We sold three residential properties for which declining profitability is forecasted at well above their appraisal prices. In addition to returning gain on sale to unitholders through distributions over two fiscal periods, we applied part of the proceeds from sales to fund the acquisition of a logistics property.
CDP is an international non-profit organization mainly engaged in requesting information disclosure from companies and governments on their environmental policies, such as climate-change policies, safeguarding water resources, and protecting forests, based on demand from global institutional investors and major corporate buyers with strong interests in environmental issues, and encouraging those policies through information disclosure. CDP is one of the information disclosure platforms to provide information on environmental issues. In 2020, over 9,600 global companies disclosed environmental data through CDP.
The CDP Climate Change Program assessment assesses companies across four consecutive levels which are broken down into eight-tier score bands. The levels are: Leadership level (A and A-), Management level (B and B-), Awareness level (C and C-) and Disclosure level (D and D-).
DHR participated in CDP Climate Change Program for the first time in 2020 and achieved an “A-” score of the highest Leadership level, as DHR was recognized by CDP for its leadership role in climate change initiatives and information disclosure.
DHR Participated in the CDP Climate Change Program for the First Time and Achieved an “A-” Score of the Highest Leadership Level
GRESB is an annual benchmarking assessment to measure Environmental, Social and Governance (ESG) integration of real estate companies and funds, as well as the name of the organization which runs the assessment. It was founded in 2009 by a group of major European pension funds who played leading roles in launching Principles for Responsible Investment (PRI).
DHR began participating in the GRESB real estate assessment in 2017. DHR received GRESB “4 Stars” on a 5-star scale evaluation of the overall score relative to global participants in the 2020 assessment. Furthermore, DHR has received a “Green Star” assessment for three consecutive years as a top-level participant in both the “Management Component,” which evaluates policies and organizational structures to promote ESG, and in the “Performance Component,” which evaluates the environmental performance of properties and initiatives with tenants.
DHR also received an “A” rating, the highest rating given on a 5-grade scale in the GRESB Public Disclosure Level evaluation scheme for two consecutive years based on its proactive information disclosure practices related to ESG initiatives.
DHR Received “4 Stars” in the GRESB Real Estate Assessment and an “A” Rating, the Highest Rating Level Given in the GRESB Public Disclosure Level Evaluation Scheme for Two Consecutive Years
The “Principles for Responsible Investment (PRI)” is an international network of institutional investors working to realize six principles. The PRI are promoted by the United Nations Environment Programme Finance Initiatives (UNEP FI) and the United National Global Compact (UN Global Compact).
The PRI encourages the incorporation of environmental, social and governance issues into investment decisions, and by including these perspectives in the investment decision-making process, aims to help the beneficiaries enhance long-term investment performance and the signatories better fulfill their fiduciary duty.
The Asset Manager agreed with the basic approach of the PRI and confirmed as a signatory in February 2021.
The Asset Manager Signing on to UN-Supported Principles for Responsible Investment (PRI)
The CDP Supplier Engagement Rating is determined through responses from companies engaged in corporate initiatives against climate change throughout their value chain in the four areas of “supplier engagement,” “governance,” “scope 3 emissions” and “targets,” as well as their overall CDP Climate Change Program score. In 2020, CDP listed approximately 400 companies, including approximately 80 Japanese companies, on the Supplier Engagement Leaderboard out of approximately 5,800 companies subject to evaluation, as recognition of the particularly excellent initiatives of those companies.
DHR made it onto the Supplier Engagement Leaderboard as the first listed J-REIT to be named.
DHR was the First Listed J-REIT to Be Named on the Supplier Engagement Leaderboard in the CDP Supplier Engagement Rating
HO-005 Candeo Hotels Nagasaki Shinchi Chinatown (acquired in September 2020)
Acquisition date September 30, 2020Location Nagasaki City, NagasakiDate of construction January 24, 2020Acquisition price ¥3,140 millionLeasable area 6,770.65 m2
Lessee Daiwa House
Stay-only hotel attractive both for leisure and business customers
Property located a three-minute walk from Shinchi Chinatown Station on the Nagasaki Electric Tramway
Bus stop of the Nagasaki Airport limousine in the vicinity also offers an excellent accessibility Occupied by Candeo Hotels Nagasaki Shinchi Chinatown on the 1st to 12th floors with 207 guest rooms and a drugstore on the 1st floor
Kazagashira Park
NakashimaRiver
Glover Garden
Nagasaki Airport LimousineNagasaki Shinchi Terminal Bus StopNagasaki Airport LimousineNagasaki Shinchi Terminal Bus Stop
Nagasaki ShinchiChinatown
Nagasaki ElectricTramway
DejimaDejima
ShinchiChinatownSta.
Nagasaki PrefecturalArt Museum
Oura Catholic Church
Nagasaki Sta.Nagasaki Sta.
499
NagasakiSeaside Park
20234
324
Daiwa House Group Sublease
Frozen and refrigerated logistics property with excellent access to the greater Tokyo metropolitan region
Located approx. 0.6 km from the Yatsu-Funabashi IC on the Higashi-Kanto Expressway, approx. 1.6 km from the Hanawa IC on the Keiyo Road, and close to the Tokyo Bay Road (National Route 357), a major arterial road to metropolitan Tokyo, the property offers excellent access to arterial roads and expressways.
With four floors of frozen and refrigerated storage, the property is used by a food company and a food supermarket.
15
8296
357
14
14
Shin-Narashino Sta.
Hanawa ICHanawa ICKeiyo RoadKeiyo Road
Yatsu-Funabashi IC
KeiyoIchikawa ICKeiyoIchikawa ICKeiyo JCTKeiyo JCT
Koya JCTMetropolitanExpresswayRoute 7KomatsugawaLine
Higashi-KantoExpressway
Tokyo-GaikanExpressway
Keiyo Line
MetropolitanExpresswayBayshoreRoute
LM-005 DPL Shin-Narashino (acquired in April 2021)
Acquisition date April 1, 2021
Location Narashino City, Chiba
Date of construction November 15, 2018
Acquisition price ¥5,930 million
Leasable area 12,686.32 m2
Lessee Not disclosed
Logistics (multi-tenant type)
Hotel
76
External Growth
Sale of Properties
ESG Initiatives
Acquisition of New Properties
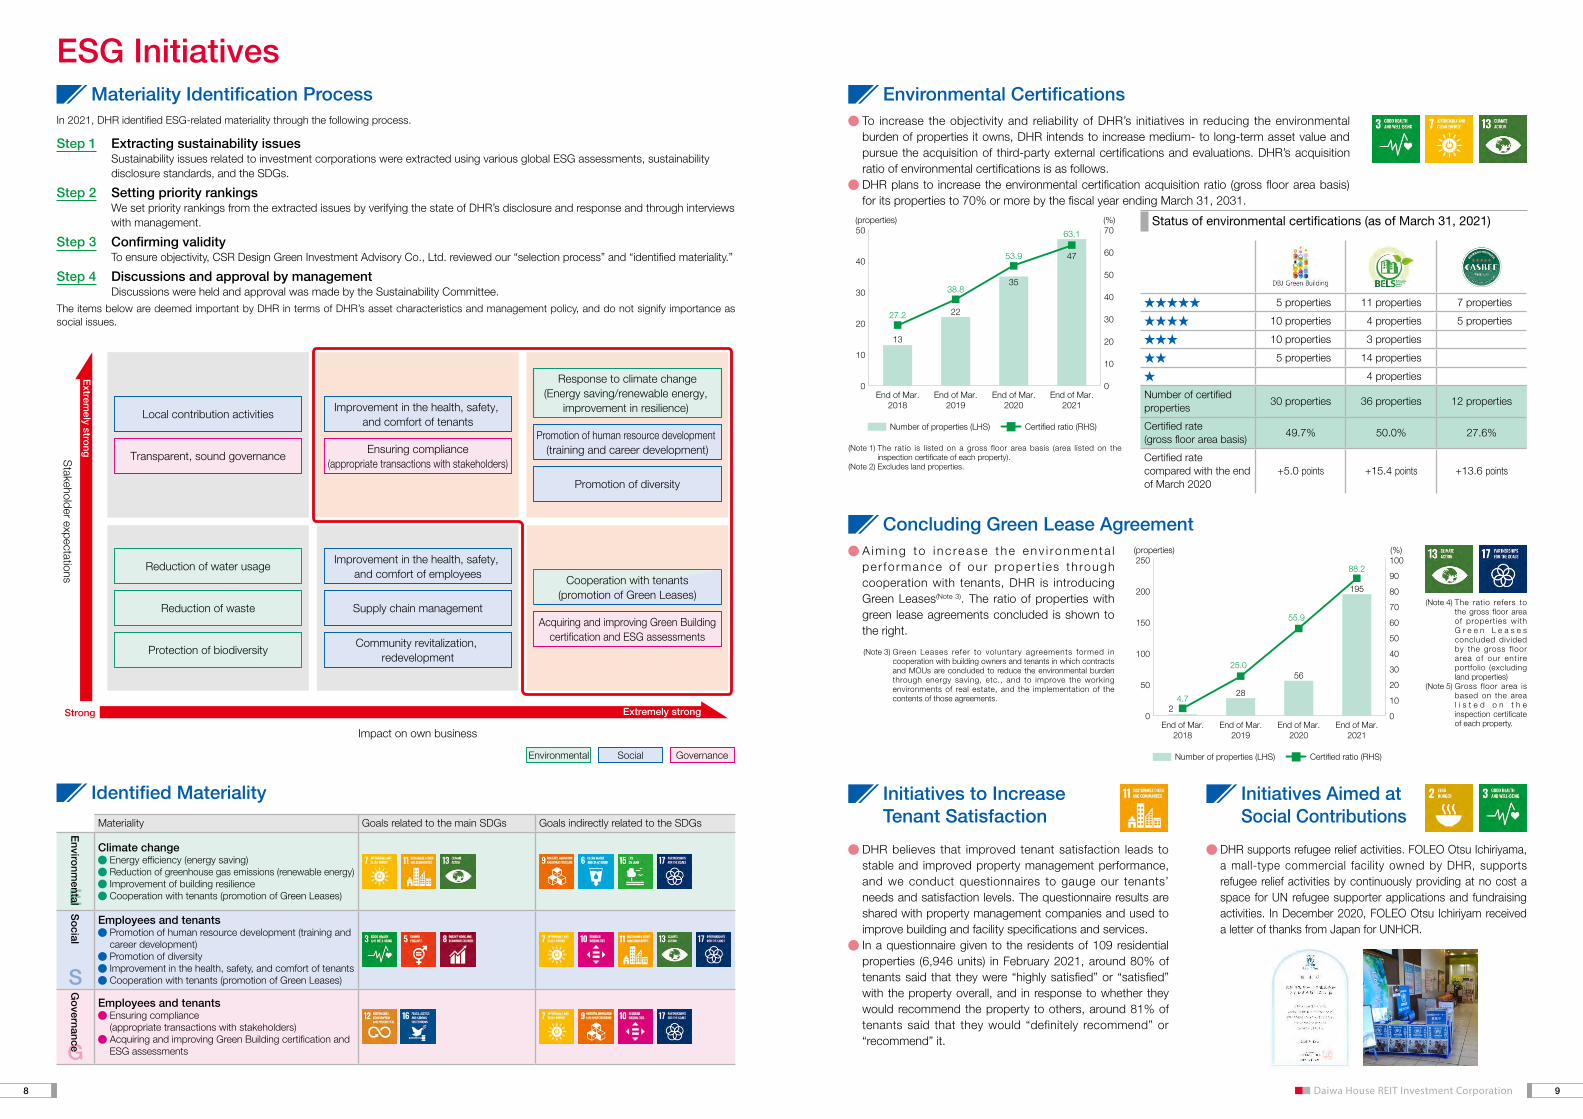
To increase the objectivity and reliability of DHR’s initiatives in reducing the environmental burden of properties it owns, DHR intends to increase medium- to long-term asset value and pursue the acquisition of third-party external certifications and evaluations. DHR’s acquisition ratio of environmental certifications is as follows.
DHR plans to increase the environmental certification acquisition ratio (gross floor area basis) for its properties to 70% or more by the fiscal year ending March 31, 2031.
DHR believes that improved tenant satisfaction leads to stable and improved property management performance, and we conduct questionnaires to gauge our tenants’ needs and satisfaction levels. The questionnaire results are shared with property management companies and used to improve building and facility specifications and services.
In a questionnaire given to the residents of 109 residential properties (6,946 units) in February 2021, around 80% of tenants said that they were “highly satisfied” or “satisfied” with the property overall, and in response to whether they would recommend the property to others, around 81% of tenants said that they would “definitely recommend” or “recommend” it.
DHR supports refugee relief activities. FOLEO Otsu Ichiriyama, a mall-type commercial facility owned by DHR, supports refugee relief activities by continuously providing at no cost a space for UN refugee supporter applications and fundraising activities. In December 2020, FOLEO Otsu Ichiriyam received a letter of thanks from Japan for UNHCR.
(Note 1) The ratio is listed on a gross floor area basis (area listed on the inspection certificate of each property).
(Note 2) Excludes land properties.
5 properties 11 properties 7 properties
10 properties 4 properties 5 properties
10 properties 3 properties
5 properties 14 properties
4 properties
Number of certified properties
30 properties 36 properties 12 properties
Certified rate(gross floor area basis)
49.7% 50.0% 27.6%
Certified ratecompared with the end of March 2020
+5.0 points +15.4 points +13.6 points
Materiality Goals related to the main SDGs Goals indirectly related to the SDGs
Climate change Energy efficiency (energy saving) Reduction of greenhouse gas emissions (renewable energy) Improvement of building resilience Cooperation with tenants (promotion of Green Leases)
Employees and tenants Promotion of human resource development (training and career development) Promotion of diversity Improvement in the health, safety, and comfort of tenants Cooperation with tenants (promotion of Green Leases)
Employees and tenants Ensuring compliance (appropriate transactions with stakeholders) Acquiring and improving Green Building certification and ESG assessments
In 2021, DHR identified ESG-related materiality through the following process.
The items below are deemed important by DHR in terms of DHR’s asset characteristics and management policy, and do not signify importance as social issues.
Step 1 Extracting sustainability issues Sustainability issues related to investment corporations were extracted using various global ESG assessments, sustainability
disclosure standards, and the SDGs.
Step 2 Setting priority rankings We set priority rankings from the extracted issues by verifying the state of DHR’s disclosure and response and through interviews
with management.
Step 3 Confirming validity To ensure objectivity, CSR Design Green Investment Advisory Co., Ltd. reviewed our “selection process” and “identified materiality.”
Step 4 Discussions and approval by management Discussions were held and approval was made by the Sustainability Committee.
0
10
20
30
40
50
0
10
20
30
40
50
60
70(%)(properties)
End of Mar.2018
End of Mar.2019
End of Mar.2020
End of Mar.2021
13
27.2 22
38.835
53.9
Number of properties (LHS) Certified ratio (RHS)
47
63.1
E
S
G
Local contribution activities
Transparent, sound governance
Improvement in the health, safety, and comfort of tenants
Ensuring compliance(appropriate transactions with stakeholders)
Promotion of diversity
Response to climate change(Energy saving/renewable energy,
improvement in resilience)
Promotion of human resource development (training and career development)
Improvement in the health, safety, and comfort of employees
Supply chain management
Community revitalization, redevelopment
Reduction of water usage
Reduction of waste
Protection of biodiversity
Cooperation with tenants(promotion of Green Leases)
Acquiring and improving Green Buildingcertification and ESG assessments
Extremely strong
GovernanceSocialEnvironmental
Strong
Extrem
ely strong
Impact on own business
Stakeholder expectations
Status of environmental certifications (as of March 31, 2021)
Enviro
nmental
So
cialG
overnance
98
ESG InitiativesMateriality Identification Process
Identified Materiality
Environmental Certifications
A i m i n g t o i n c re a s e t h e e n v i ro n m e n t a l per fo rmance o f our p roper t i es th rough cooperation with tenants, DHR is introducing Green Leases(Note 3). The ratio of properties with green lease agreements concluded is shown to the right.
(Note 3) Green Leases refer to voluntary agreements formed in cooperation with building owners and tenants in which contracts and MOUs are concluded to reduce the environmental burden through energy saving, etc., and to improve the working environments of real estate, and the implementation of the contents of those agreements.
(Note 4) The ratio refers to the gross floor area of propert ies with G r e e n L e a s e s concluded divided by the gross f loor area of our ent ire portfolio (excluding land properties)
(Note 5) Gross floor area is based on the area l i s t e d o n t h e inspection certificate of each property.
0
50
100
150
200
250
0
10
20
30
40
50
60
70
80
90
100(properties) (%)
End of Mar.2018
End of Mar.2019
End of Mar.2020
End of Mar.2021
24.7
28
25.056
55.9
195
88.2
Number of properties (LHS) Certified ratio (RHS)
Concluding Green Lease Agreement
Initiatives to Increase Tenant Satisfaction
Initiatives Aimed at Social Contributions
95
96
97
98
99
100
(%) …Retail …Hotel …Other assets…Portfolio total …Logistics …Residential
End of Sept.2020
End of Oct.2020
End of Nov.2020
End of Dec.2020
End of Jan.2021
End of Feb.2021
Logistics facility construction leading to increased rent income(fiscal period ended February 28, 2021)
Value enhancement projects
Number of properties
Construction costEffect
Increase in total rental revenue (annual) (Note)
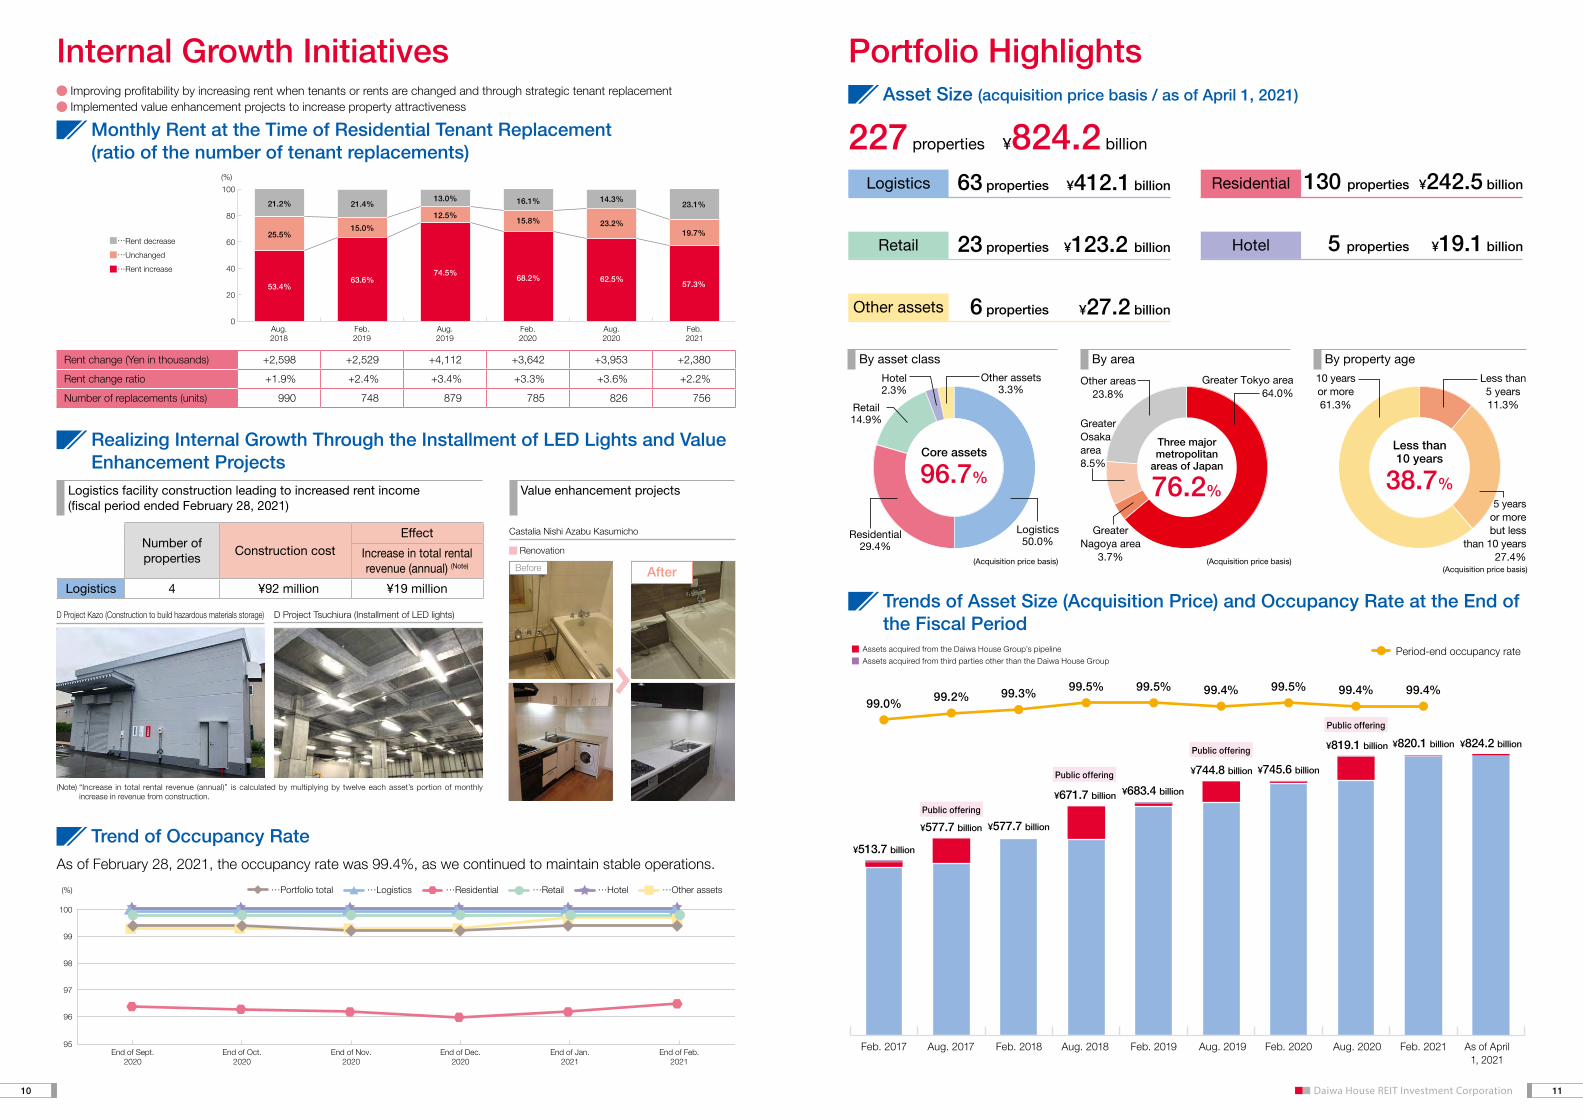
Logistics 4 ¥92 million ¥19 million
Improving profitability by increasing rent when tenants or rents are changed and through strategic tenant replacement Implemented value enhancement projects to increase property attractiveness
Renovation
As of February 28, 2021, the occupancy rate was 99.4%, as we continued to maintain stable operations.
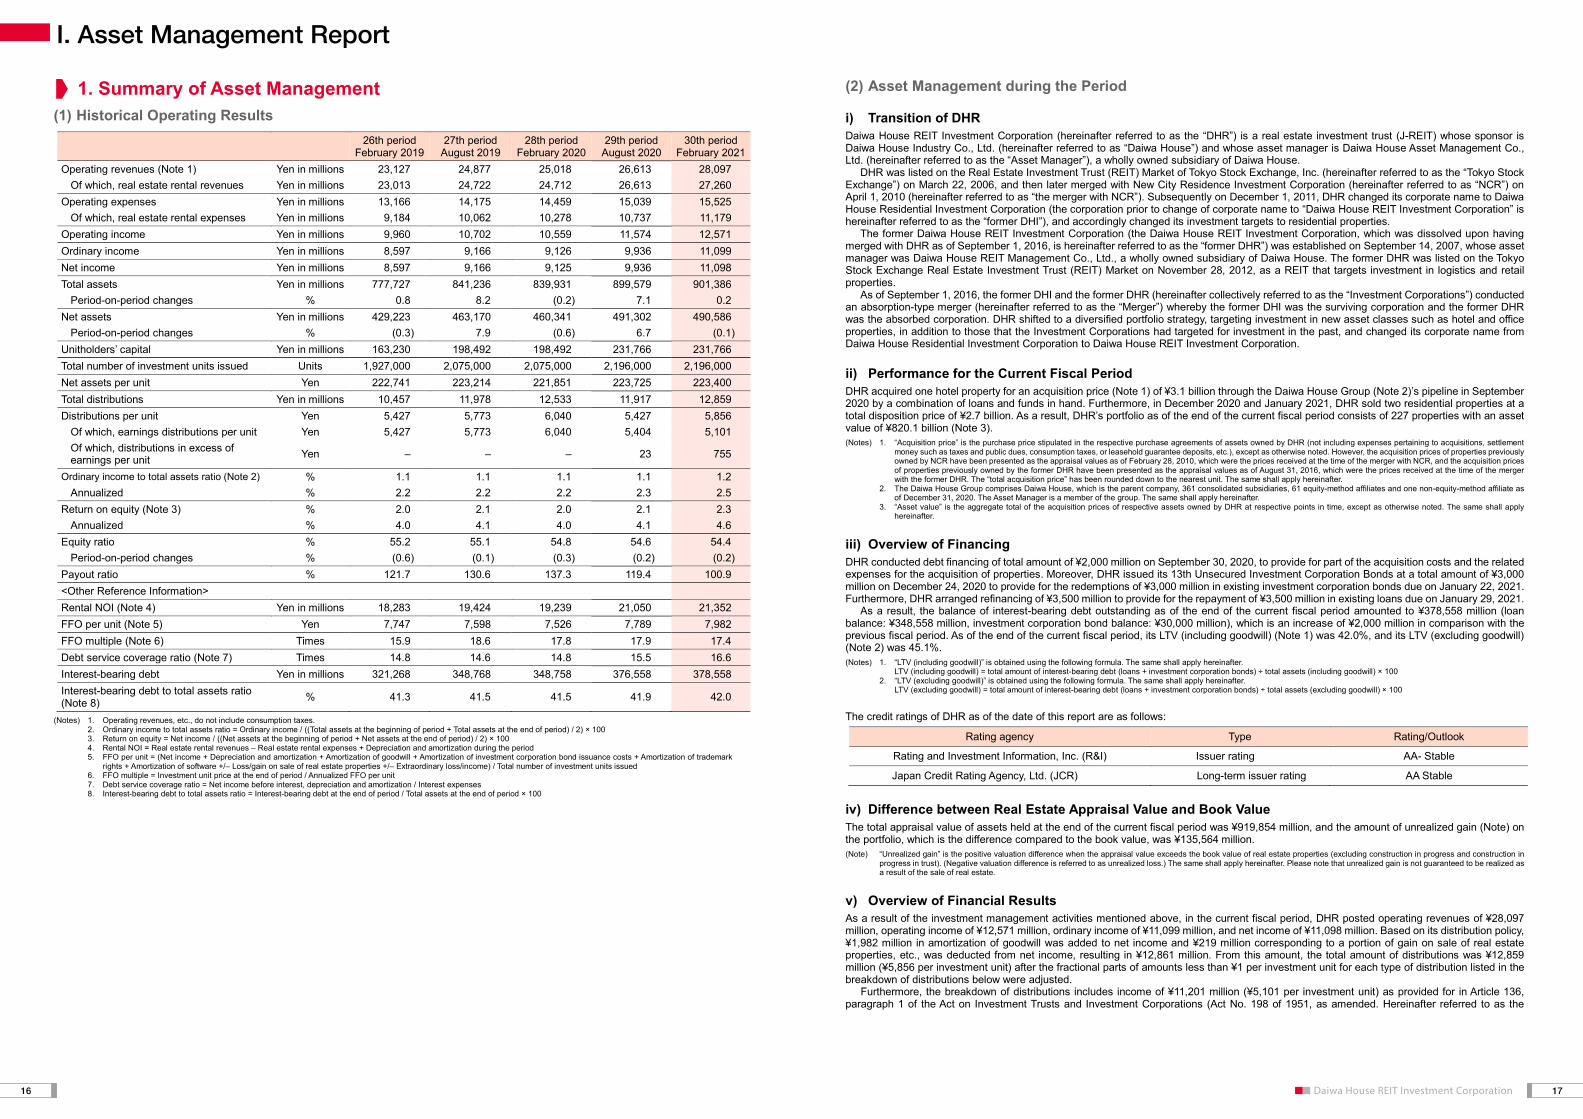
Period-end occupancy rate
¥513.7 billion
¥577.7 billion
¥683.4 billion
¥745.6 billion
¥577.7 billion
¥671.7 billion
¥744.8 billion
¥819.1 billion
Feb. 2017 Aug. 2017 Feb. 2018 Aug. 2018 Feb. 2019 Aug. 2019 Feb. 2020
¥824.2 billion
As of April1, 2021
¥820.1 billion
Feb. 2021Aug. 2020
99.0% 99.2% 99.3% 99.5% 99.5% 99.4% 99.5% 99.4% 99.4%
Assets acquired from the Daiwa House Group’s pipeline
Assets acquired from third parties other than the Daiwa House Group
Public offering
Public offering
Public offering
Public offering
227 properties ¥824.2 billion
¥412.1 billion63 propertiesLogistics ¥242.5 billion130 propertiesResidential
¥123.2 billion23 propertiesRetail ¥19.1 billion5 propertiesHotel
¥27.2 billion6 propertiesOther assets
Core assets
96.7%
Other assets3.3%
Retail14.9%
Hotel2.3%
Residential29.4%
Logistics50.0%
(Acquisition price basis)
By asset class
Other areas23.8%
GreaterOsakaarea8.5%
GreaterNagoya area
3.7%
Greater Tokyo area64.0%
Three majormetropolitan
areas of Japan
76.2%
(Acquisition price basis)
By area
Less than10 years
38.7%
10 yearsor more61.3%
5 yearsor morebut less
than 10 years27.4%
Less than5 years11.3%
(Acquisition price basis)
By property age
(%)
0
20
40
60
80
100
53.4%
21.2%
25.5%
63.6%
21.4%
15.0%
74.5%
13.0%
12.5%
57.3%
23.1%
19.7%
62.5%
14.3%
23.2%
68.2%
16.1%
15.8%
Rent decrease
Unchanged
Rent increase
Aug.2018
Feb.2019
Aug.2019
Feb.2020
Feb.2021
Aug.2020
Rent change (Yen in thousands) +2,598 +2,529 +4,112 +3,642 +3,953 +2,380
Rent change ratio +1.9% +2.4% +3.4% +3.3% +3.6% +2.2%
Number of replacements (units) 990 748 879 785 826 756
1110
Monthly Rent at the Time of Residential Tenant Replacement(ratio of the number of tenant replacements)
Realizing Internal Growth Through the Installment of LED Lights and Value Enhancement Projects
Trend of Occupancy Rate
Asset Size (acquisition price basis / as of April 1, 2021)
Trends of Asset Size (Acquisition Price) and Occupancy Rate at the End of the Fiscal Period
Internal Growth Initiatives Portfolio Highlights
Castalia Nishi Azabu Kasumicho
(Note) “Increase in total rental revenue (annual)” is calculated by multiplying by twelve each asset’s portion of monthly increase in revenue from construction.
D Project Kazo (Construction to build hazardous materials storage) D Project Tsuchiura (Installment of LED lights)
Before After

RM-012 iias Tsukuba
LB-031 D Project Nishiyodogawa
LM-001 DPL Misato
LM-002 DPL Fukuoka Kasuya
Retail properties
Other assets
Logistics properties Logistics properties
Logistics properties
Residential properties Hotel properties
HO-001 Daiwa Roynet Hotel Yokohama Kannai OT-006 GRANODE HiroshimaRE-059 Castalia Tower Shinagawa Seaside
Saitama Ibaraki
Chiba
Tokyo
Kanagawa
Greater Tokyo area
Kita Ward
Shinjuku Ward
Setagaya Ward
Suginami Ward
Nerima Ward
Itabashi Ward
Shibuya Ward
Meguro Ward
Toshima Ward
Nakano Ward
Bunkyo Ward
Chiyoda Ward
Shinagawa Ward
Minato Ward
Chuo Ward
Koto Ward
Sumida Ward
Adachi Ward
Katsushika WardArakawa Ward
Taito WardEdogawa Ward
Ota Ward
Tokyo 23Wards
Aichi
Gifu
Mie
Greater Nagoya area
HO-005Candeo Hotels Nagasaki Shinchi Chinatown
Shiga
NaraOsaka
Hyogo
Kyoto
Greater Osaka area
Assets acquired in the fiscal period ended February 28, 2021
Assets acquired in the fiscal period ending August 31, 2021
LM-005DPL Shin-Narashino
Logistics properties
Residential properties
Retail properties
Hotel properties
Other assets
1312
Portfolio Map (as of April 1, 2021)Major Portfolio Properties

Commitment line ¥25.0 billion
Aug.
2021
Feb. Aug.
2022
Feb. Aug.
2023
Feb. Aug.
2024
Feb. Aug.
2025
Feb. Aug.
2026
Feb. Aug.
2027
Feb. Aug.
2028
Feb. Aug.
2029
Feb. Aug.
2030
Feb. Aug.
2031
Feb. Aug.
2033 2040
Aug.
2038
(Yen in millions)
0
10,000
25,000
15,000
5,000
20,000
30,000Investment corporation bondsLong-term loans
DHR is working to improve the stability of its financial base by maintaining and expanding its strong lender formation, through initiatives
geared toward diversifying methods of raising capital through issuance of investment corporation bonds, and by promoting use of long-term
fixed rates on interest-bearing debt and staggering repayment dates. DHR’s policy is to work toward stable financial operations by
controlling our LTV (excluding goodwill) at around the 45% level.
Lender Loan balance (Yen in millions)
Sumitomo Mitsui Trust Bank, Limited 61,529Sumitomo Mitsui Banking Corporation 61,490MUFG Bank, Ltd. 58,344Mizuho Bank, Ltd. 53,520Development Bank of Japan Inc. 18,900The Norinchukin Bank 14,810Aozora Bank, Ltd. 12,761Resona Bank, Limited 12,500Mizuho Trust & Banking Co., Ltd. 8,878Shinsei Bank, Limited 6,500Nippon Life Insurance Company 5,600Shinkin Central Bank 5,000Mitsui Sumitomo Insurance Company, Limited 4,500The Bank of Fukuoka, Ltd. 3,500The Chiba Bank, Ltd. 2,965The 77 Bank, Ltd. 2,700The Nishi-Nippon City Bank, Ltd. 2,500The Dai-ichi Life Insurance Company, Limited 2,500The Chugoku Bank, Limited 2,200The Iyo Bank, Ltd. 2,000The Bank of Kyoto, Ltd. 1,500The Shizuoka Bank, Ltd. 1,260JAPAN POST INSURANCE Co., Ltd. 1,100Taiyo Life Insurance Company 1,000The Yamaguchi Bank, Ltd. 500The Yamanashi Chuo Bank, Ltd. 500
Total loans 348,558(Note) The amounts were rounded down to the nearest million yen.
JCR(Japan Credit Rating Agency, Ltd.)
AA (Stable) R&I(Rating and Investment Information, Inc.)
AA- (Stable)
In the fiscal period ended February 28, 2021, DHR implemented
new borrowings of ¥2,000 million in September 2020, issued
¥3,000 million in investment corporation bonds to provide for
redemptions of existing investment corporation bonds in December
2020, and arranged refinancing of ¥3,500 million in January 2021.
Total interest-bearing debt
Total loans
Total investment corporation bonds
¥378,558 million
¥348,558 million
¥30,000 million
LTV (excluding goodwill) 45.1%
LTV (including goodwill) 42.0%
Long-term interest-bearing debt ratio 91.8%
Fixed interest ratio 97.2%
Average interest rate 0.68%
Average remaining maturity 4.7 years
Commitment line ¥25,000 million
1514
Financial Policy
Interest-bearing Debt (as of April 1, 2021) Breakdown by Lender (as of April 1, 2021)
Diversifying Debt Maturities (as of April 1, 2021)
Rating / Outlook (as of February 28, 2021)
Financial Status
I. Asset Management Report
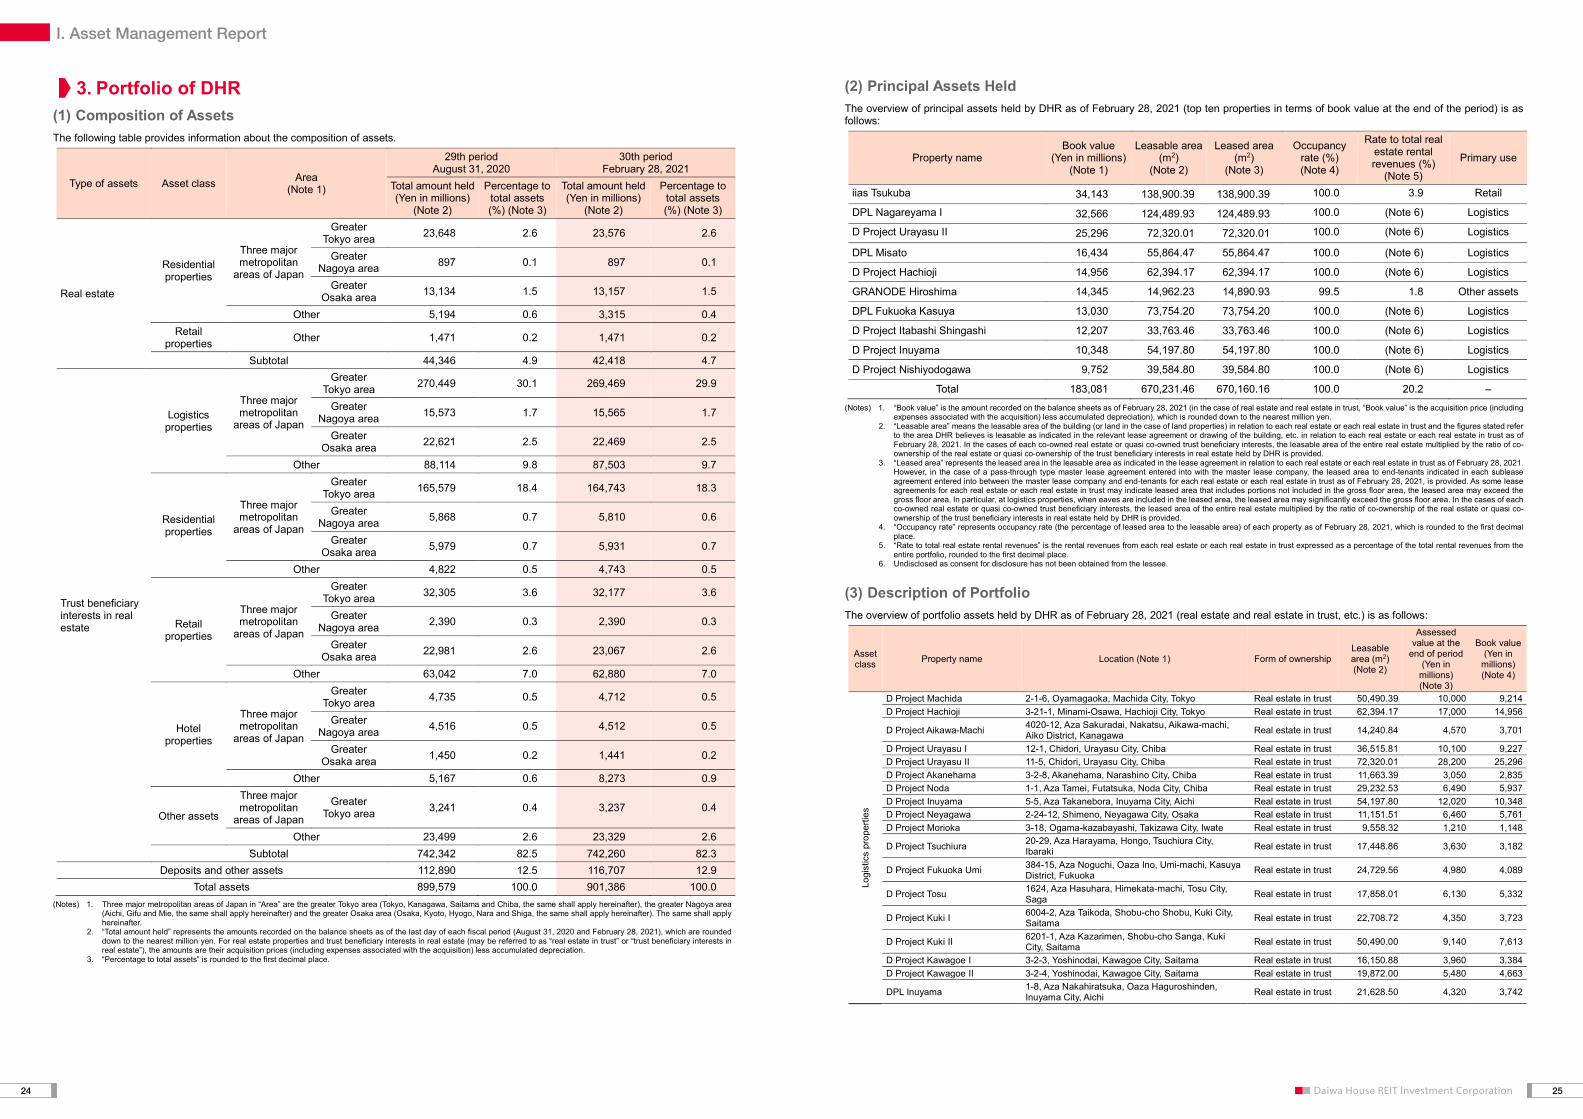
1. Summary of Asset Management (1) Historical Operating Results
26th period February 2019
27th period August 2019
28th period February 2020
29th period August 2020
30th period February 2021
Operating revenues (Note 1) Yen in millions 23,127 24,877 25,018 26,613 28,097 Of which, real estate rental revenues Yen in millions 23,013 24,722 24,712 26,613 27,260
Operating expenses Yen in millions 13,166 14,175 14,459 15,039 15,525 Of which, real estate rental expenses Yen in millions 9,184 10,062 10,278 10,737 11,179
Operating income Yen in millions 9,960 10,702 10,559 11,574 12,571 Ordinary income Yen in millions 8,597 9,166 9,126 9,936 11,099 Net income Yen in millions 8,597 9,166 9,125 9,936 11,098 Total assets Yen in millions 777,727 841,236 839,931 899,579 901,386
Period-on-period changes % 0.8 8.2 (0.2) 7.1 0.2 Net assets Yen in millions 429,223 463,170 460,341 491,302 490,586
Period-on-period changes % (0.3) 7.9 (0.6) 6.7 (0.1) Unitholders’ capital Yen in millions 163,230 198,492 198,492 231,766 231,766 Total number of investment units issued Units 1,927,000 2,075,000 2,075,000 2,196,000 2,196,000 Net assets per unit Yen 222,741 223,214 221,851 223,725 223,400 Total distributions Yen in millions 10,457 11,978 12,533 11,917 12,859 Distributions per unit Yen 5,427 5,773 6,040 5,427 5,856
Of which, earnings distributions per unit Yen 5,427 5,773 6,040 5,404 5,101 Of which, distributions in excess of earnings per unit Yen – – – 23 755
Ordinary income to total assets ratio (Note 2) % 1.1 1.1 1.1 1.1 1.2 Annualized % 2.2 2.2 2.2 2.3 2.5
Return on equity (Note 3) % 2.0 2.1 2.0 2.1 2.3 Annualized % 4.0 4.1 4.0 4.1 4.6
Equity ratio % 55.2 55.1 54.8 54.6 54.4 Period-on-period changes % (0.6) (0.1) (0.3) (0.2) (0.2)
Payout ratio % 121.7 130.6 137.3 119.4 100.9 <Other Reference Information> Rental NOI (Note 4) Yen in millions 18,283 19,424 19,239 21,050 21,352 FFO per unit (Note 5) Yen 7,747 7,598 7,526 7,789 7,982 FFO multiple (Note 6) Times 15.9 18.6 17.8 17.9 17.4 Debt service coverage ratio (Note 7) Times 14.8 14.6 14.8 15.5 16.6 Interest-bearing debt Yen in millions 321,268 348,768 348,758 376,558 378,558 Interest-bearing debt to total assets ratio (Note 8) % 41.3 41.5 41.5 41.9 42.0
(Notes) 1. Operating revenues, etc., do not include consumption taxes. 2. Ordinary income to total assets ratio = Ordinary income / ((Total assets at the beginning of period + Total assets at the end of period) / 2) × 100 3. Return on equity = Net income / ((Net assets at the beginning of period + Net assets at the end of period) / 2) × 100 4. Rental NOI = Real estate rental revenues – Real estate rental expenses + Depreciation and amortization during the period 5. FFO per unit = (Net income + Depreciation and amortization + Amortization of goodwill + Amortization of investment corporation bond issuance costs + Amortization of trademark
rights + Amortization of software +/– Loss/gain on sale of real estate properties +/– Extraordinary loss/income) / Total number of investment units issued 6. FFO multiple = Investment unit price at the end of period / Annualized FFO per unit 7. Debt service coverage ratio = Net income before interest, depreciation and amortization / Interest expenses 8. Interest-bearing debt to total assets ratio = Interest-bearing debt at the end of period / Total assets at the end of period × 100
I. Asset Management Report
(2) Asset Management during the Period
i) Transition of DHR Daiwa House REIT Investment Corporation (hereinafter referred to as the “DHR”) is a real estate investment trust (J-REIT) whose sponsor is Daiwa House Industry Co., Ltd. (hereinafter referred to as “Daiwa House”) and whose asset manager is Daiwa House Asset Management Co., Ltd. (hereinafter referred to as the “Asset Manager”), a wholly owned subsidiary of Daiwa House.
DHR was listed on the Real Estate Investment Trust (REIT) Market of Tokyo Stock Exchange, Inc. (hereinafter referred to as the “Tokyo Stock Exchange”) on March 22, 2006, and then later merged with New City Residence Investment Corporation (hereinafter referred to as “NCR”) on April 1, 2010 (hereinafter referred to as “the merger with NCR”). Subsequently on December 1, 2011, DHR changed its corporate name to Daiwa House Residential Investment Corporation (the corporation prior to change of corporate name to “Daiwa House REIT Investment Corporation” is hereinafter referred to as the “former DHI”), and accordingly changed its investment targets to residential properties.
The former Daiwa House REIT Investment Corporation (the Daiwa House REIT Investment Corporation, which was dissolved upon having merged with DHR as of September 1, 2016, is hereinafter referred to as the “former DHR”) was established on September 14, 2007, whose asset manager was Daiwa House REIT Management Co., Ltd., a wholly owned subsidiary of Daiwa House. The former DHR was listed on the Tokyo Stock Exchange Real Estate Investment Trust (REIT) Market on November 28, 2012, as a REIT that targets investment in logistics and retail properties.
As of September 1, 2016, the former DHI and the former DHR (hereinafter collectively referred to as the “Investment Corporations”) conducted an absorption-type merger (hereinafter referred to as the “Merger”) whereby the former DHI was the surviving corporation and the former DHR was the absorbed corporation. DHR shifted to a diversified portfolio strategy, targeting investment in new asset classes such as hotel and office properties, in addition to those that the Investment Corporations had targeted for investment in the past, and changed its corporate name from Daiwa House Residential Investment Corporation to Daiwa House REIT Investment Corporation.
ii) Performance for the Current Fiscal Period DHR acquired one hotel property for an acquisition price (Note 1) of ¥3.1 billion through the Daiwa House Group (Note 2)’s pipeline in September 2020 by a combination of loans and funds in hand. Furthermore, in December 2020 and January 2021, DHR sold two residential properties at a total disposition price of ¥2.7 billion. As a result, DHR’s portfolio as of the end of the current fiscal period consists of 227 properties with an asset value of ¥820.1 billion (Note 3). (Notes) 1. “Acquisition price” is the purchase price stipulated in the respective purchase agreements of assets owned by DHR (not including expenses pertaining to acquisitions, settlement
money such as taxes and public dues, consumption taxes, or leasehold guarantee deposits, etc.), except as otherwise noted. However, the acquisition prices of properties previously owned by NCR have been presented as the appraisal values as of February 28, 2010, which were the prices received at the time of the merger with NCR, and the acquisition prices of properties previously owned by the former DHR have been presented as the appraisal values as of August 31, 2016, which were the prices received at the time of the merger with the former DHR. The “total acquisition price” has been rounded down to the nearest unit. The same shall apply hereinafter.
2. The Daiwa House Group comprises Daiwa House, which is the parent company, 361 consolidated subsidiaries, 61 equity-method affiliates and one non-equity-method affiliate as of December 31, 2020. The Asset Manager is a member of the group. The same shall apply hereinafter.
3. “Asset value” is the aggregate total of the acquisition prices of respective assets owned by DHR at respective points in time, except as otherwise noted. The same shall apply hereinafter.
iii) Overview of Financing DHR conducted debt financing of total amount of ¥2,000 million on September 30, 2020, to provide for part of the acquisition costs and the related expenses for the acquisition of properties. Moreover, DHR issued its 13th Unsecured Investment Corporation Bonds at a total amount of ¥3,000 million on December 24, 2020 to provide for the redemptions of ¥3,000 million in existing investment corporation bonds due on January 22, 2021. Furthermore, DHR arranged refinancing of ¥3,500 million to provide for the repayment of ¥3,500 million in existing loans due on January 29, 2021.
As a result, the balance of interest-bearing debt outstanding as of the end of the current fiscal period amounted to ¥378,558 million (loan balance: ¥348,558 million, investment corporation bond balance: ¥30,000 million), which is an increase of ¥2,000 million in comparison with the previous fiscal period. As of the end of the current fiscal period, its LTV (including goodwill) (Note 1) was 42.0%, and its LTV (excluding goodwill) (Note 2) was 45.1%. (Notes) 1. “LTV (including goodwill)” is obtained using the following formula. The same shall apply hereinafter.
LTV (including goodwill) = total amount of interest-bearing debt (loans + investment corporation bonds) ÷ total assets (including goodwill) × 100 2. “LTV (excluding goodwill)” is obtained using the following formula. The same shall apply hereinafter.
LTV (excluding goodwill) = total amount of interest-bearing debt (loans + investment corporation bonds) ÷ total assets (excluding goodwill) × 100
The credit ratings of DHR as of the date of this report are as follows: Rating agency Type Rating/Outlook
Rating and Investment Information, Inc. (R&I) Issuer rating AA- Stable
Japan Credit Rating Agency, Ltd. (JCR) Long-term issuer rating AA Stable
iv) Difference between Real Estate Appraisal Value and Book Value The total appraisal value of assets held at the end of the current fiscal period was ¥919,854 million, and the amount of unrealized gain (Note) on the portfolio, which is the difference compared to the book value, was ¥135,564 million. (Note) “Unrealized gain” is the positive valuation difference when the appraisal value exceeds the book value of real estate properties (excluding construction in progress and construction in
progress in trust). (Negative valuation difference is referred to as unrealized loss.) The same shall apply hereinafter. Please note that unrealized gain is not guaranteed to be realized as a result of the sale of real estate.
v) Overview of Financial Results As a result of the investment management activities mentioned above, in the current fiscal period, DHR posted operating revenues of ¥28,097 million, operating income of ¥12,571 million, ordinary income of ¥11,099 million, and net income of ¥11,098 million. Based on its distribution policy, ¥1,982 million in amortization of goodwill was added to net income and ¥219 million corresponding to a portion of gain on sale of real estate properties, etc., was deducted from net income, resulting in ¥12,861 million. From this amount, the total amount of distributions was ¥12,859 million (¥5,856 per investment unit) after the fractional parts of amounts less than ¥1 per investment unit for each type of distribution listed in the breakdown of distributions below were adjusted.
Furthermore, the breakdown of distributions includes income of ¥11,201 million (¥5,101 per investment unit) as provided for in Article 136, paragraph 1 of the Act on Investment Trusts and Investment Corporations (Act No. 198 of 1951, as amended. Hereinafter referred to as the
I. Asset Management Report
1. Summary of Asset Management
1716

I. Asset Management ReportI. Asset Management Report
“Investment Trusts Act”) as earnings distributions and an allowance for temporary difference adjustments of ¥1,657 million (¥755 per investment unit) as distributions in excess of earnings.
(3) Summary of Capital Increase Changes in DHR’s total number of investment units issued and unitholders’ capital for the most recent five years until February 28, 2021 are as follows:
Date Event
Total number of investment units issued
(Units) Unitholders’ capital
(Yen in millions) Remark
Change Balance Change Balance
September 1, 2016 Delivery by allotment due to merger 771,540 1,519,280 – 61,703 (Note 1)
March 21, 2017 Capital increase through public offering 156,720 1,676,000 42,625 104,328 (Note 2)
April 14, 2017 Capital increase through third-party allotment 14,000 1,690,000 3,807 108,136 (Note 3)
March 19, 2018 Capital increase through public offering 222,000 1,912,000 51,607 159,743 (Note 4)
April 13, 2018 Capital increase through third-party allotment 15,000 1,927,000 3,486 163,230 (Note 5)
March 1, 2019 Capital increase through public offering 138,000 2,065,000 32,879 196,110 (Note 6)
March 26, 2019 Capital increase through third-party allotment 10,000 2,075,000 2,382 198,492 (Note 7)
March 2, 2020 Capital increase through public offering 121,000 2,196,000 33,273 231,766 (Note 8) (Notes) 1. At the time of the merger, which became effective as of September 1, 2016, DHR allotted 2.2 units of DHR per unit of the former DHR, and as a result, 771,540 new investment
units were issued. 2. Investment units were issued by public offering with an issue price of ¥280,868 per unit (paid-in amount: ¥271,983) in order to raise funds for the acquisition of new properties, etc. 3. Additional investment units were issued with a paid-in amount of ¥271,983 per unit in order to raise funds for the acquisition of new properties, etc. 4. Investment units were issued by public offering with an issue price of ¥239,806 per unit (paid-in amount: ¥232,465) in order to raise funds for the acquisition of new properties, etc. 5. Additional investment units were issued with a paid-in amount of ¥232,465 per unit in order to raise funds for the acquisition of new properties, etc. 6. Investment units were issued by public offering with an issue price of ¥245,784 per unit (paid-in amount: ¥238,260) in order to raise funds for the acquisition of new properties, etc. 7. Additional investment units were issued with a paid-in amount of ¥238,260 per unit in order to raise funds for the acquisition of new properties, etc. 8. Investment units were issued by public offering with an issue price of ¥283,670 per unit (paid-in amount: ¥274,986) in order to raise funds for the acquisition of new properties, etc.
[Changes in market price of investment securities] The highest and lowest prices and the closing prices at the beginning and the end of the period in the REIT section of the Tokyo Stock Exchange, on which DHR’s investment securities are listed, by period are as follows:
26th period 27th period 28th period 29th period 30th period
Fiscal period ended February 2019 August 2019 February 2020 August 2020 February 2021
Highest ¥261,100 ¥280,800 ¥318,000 ¥286,500 ¥298,300
Lowest ¥238,800 ¥241,700 ¥269,200 ¥181,100 ¥240,600
Beginning of period ¥256,900 ¥247,200 ¥282,000 ¥278,500 ¥271,900
End of period ¥248,400 ¥280,400 ¥269,200 ¥277,000 ¥279,600
I. Asset Management Report
(4) Distributions For the current fiscal period, of the total amount of ¥12,861,279,967 when combining net income of ¥11,098,720,597 and amortization of goodwill of ¥1,982,226,586 and excluding ¥219,667,216 corresponding to a portion of gain on sale of real estate properties, etc., DHR decided to pay a total of ¥12,859,776,000 in distributions, for distributions per unit of ¥5,856, after adjusting the fractional parts of amounts less than ¥1 per investment unit for each type of distribution listed in the breakdown of distributions below. The breakdown of distributions was ¥11,201,796,000 as earnings distributions (¥5,101 per unit) and ¥1,657,980,000 in allowance for temporary difference adjustments as distributions in excess of earnings (¥755 per unit).
26th period From
September 1, 2018 to February 28, 2019
27th period From
March 1, 2019 to August 31, 2019
28th period From
September 1, 2019 to February 29, 2020
29th period From
March 1, 2020 to August 31, 2020
30th period From
September 1, 2020 to February 28, 2021
Unappropriated retained earnings
(Yen in thousands) 8,597,087 9,166,085 9,125,933 9,936,041 11,877,987
Amount retained as voluntary reserve / retained earnings carried forward (Note)
(Yen in thousands)
8,930,366 6,117,477 2,710,410 779,267 676,191
Total distributions (Yen in thousands) 10,457,829 11,978,975 12,533,000 11,917,692 12,859,776
Distributions per unit (Yen) 5,427 5,773 6,040 5,427 5,856
Of the above, total earnings distributions
(Yen in thousands) 10,457,829 11,978,975 12,533,000 11,867,184 11,201,796
Earnings distributions per unit (Yen) 5,427 5,773 6,040 5,404 5,101
Of the above, total capital refunds
(Yen in thousands) – – – 50,508 1,657,980
Capital refunds per unit (Yen) – – – 23 755
Of total capital refunds, total distributions deemed as distributions from the allowance for temporary difference adjustments
(Yen in thousands)
– – – 50,508 1,657,980
Of capital refunds per unit, distributions deemed as distributions from the allowance for temporary difference adjustments per unit
(Yen)
– – – 23 755
Of total capital refunds, total distributions deemed as distributions from capital refunds for tax purposes
– – – – –
Of capital refunds per unit, distributions deemed as distributions from capital refunds for tax purposes per unit
– – – – –
(Note) Amount retained as voluntary reserve from 26th period to 28th period indicates the sum of the amount retained as reserve for temporary difference adjustments and reserve for distribution after accumulation and reversal of reserves. Amount retained as voluntary reserve from 29th period and subsequent period indicates the retained earnings carried forward to the following period.
1918

I. Asset Management ReportI. Asset Management Report
(5) Future Operating Policies and Issues to Be Addressed
i) Investment Environment During the current fiscal period, the Japanese economy experienced a temporary lull in the spread of COVID-19 through fall of 2020. Economic stimulus policies such as the Go To Campaign were implemented, and the real GDP increased by 2.8% compared with the previous quarter from October to December 2020. However, thereafter, COVID-19 again began to spread, and a state of emergency was again declared by the Japanese government in January 2021. As a result, the real GDP declined by 1.0% compared with the previous quarter from January to March 2021, as overall uncertain conditions continued.
Even in this environment, large-scale monetary easing policy and other factors led the Nikkei Stock Average to rise above ¥30,000 for the first time in around 30 years in March 2021. Furthermore, in the J-REIT market, the Tokyo Stock Exchange REIT Index plunged to 1,145 points on a closing-price base on March 19, 2020, but then recovered to 1,929 points by the end of February 2021.
In the real estate market, the land value appraisals for public purposes released by the Ministry of Land, Infrastructure, Transport and Tourism in March 2021 showed the first nationwide average decline in six years, centered on a decline in commercial land values in major metropolitan areas. However, against the backdrop of a continued low-interest-rate environment, we continue to see active trading in the real estate market.
ii) Future Operating Policies and Issues to Be Addressed (a) Growth Strategy Due to its shift to a diversified portfolio strategy as a result of the Merger, taking advantage of the expanded opportunities to acquire properties from an extensive range of asset classes, DHR aims to steadily grow its asset size while maximizing unitholder value by securing stable income over the long term.
Due to its shift to a diversified portfolio strategy, DHR’s portfolio now includes a range of assets with varying risk-return profiles, and as of the date of this report, maintains high occupancy rates for assets held. By investing in various types of assets, DHR deems that it will be able to diversify its portfolio and mitigate the risk of excessive reliance on a limited number of tenants in order to boost portfolio income and generate cash flows that are more consistent.
DHR carefully selects and acquires assets that contribute to increasing unitholder value mainly through the Daiwa House Group’s pipeline and plans to maintain its policy of selective investment going forward.
Furthermore, through continuous property replacement, DHR aims to increase the quality of its portfolio and realize increased unitholder value.
(b) ESG initiatives The Daiwa House Group’s basic approach is “Creating Dreams, Building Hearts.” As a group that co-creates value for individuals, communities and people’s lifestyles, the group aims to build trust relationships with stakeholders and contribute to society through its businesses, and to realize a sustainable society by meeting the challenge of achieving “zero environmental impacts.”
The Asset Manager shares the Daiwa House Group’s basic approach as DHR’s asset manager, and considers that including the environmental, social, and governance considerations in its real estate investment management operations contributes to DHR’s basic policy of ensuring stable revenue and steady asset growth over the long term. Therefore, we have established the “Sustainability Policy” to guide our real estate investment management.
The Asset Manager considers efforts such as energy conservation and reducing greenhouse gas emissions in relation to asset management to be of paramount importance. It establishes individual policies for the matter and strives to reduce the burden it puts on the environment. The Asset Manager’s reduction targets of energy consumption (long-term targets) are to reduce energy consumption and CO2 emission intensity by 10% over the ten-year period from 2018 to 2027.
(c) Distribution Policy DHR changed part of its distribution policy in the fiscal period ended February 28, 2017 and made it a policy to distribute the amount equivalent to amortization of goodwill to top up net income, and distributions in excess of earnings in the amount equivalent to amortization of goodwill are paid (distribution accounted as an allowance for temporary difference adjustments and other distributions in excess of earnings).
Furthermore, in the case of the occurrence of excess taxable income over accounting income associated with sale of properties that causes a need for DHR to take action to maintain its conduit status, DHR plans to conduct additional distributions in excess of earnings (distribution accounted as an allowance for temporary difference adjustments) to reduce the occurrence of corporate taxes.
However, where there is an occurrence of special gains such as gain on sale of real estate properties, other distributions in excess of earnings, which is a part of the above-mentioned distributions in excess of earnings in the amount equivalent to amortization of goodwill, can be reduced by an amount equivalent to part of the gain on sale of real estate properties.
DHR’s policy is to pay distributions in excess of earnings (distribution accounted as an allowance for temporary difference adjustments and other distributions in excess of earnings) to realize stabilization of distributions on a medium- to long-term basis (Note) while ensuring the level of distributions not impacted by the amortization of goodwill that accompanied the Merger. (Note) Under the above distribution policy, DHR has the policy to stabilize distributions. However, it is not intended as a guarantee or promise of the payment of distribution and amounts thereof.
iii) Financial Strategy DHR seeks as its basic policy to execute a well-planned and flexible financial strategy with the aim of ensuring sustainable income on a medium- to long-term basis, contributing to the steady growth and efficient management of its properties and creating management stability.
DHR is also working to improve the stability of its financial base by maintaining and expanding its strong lender formation through initiatives geared toward diversifying methods of raising capital through issuance of investment corporation bonds, and by promoting use of long-term fixed rates on interest-bearing debt and staggering repayment dates.
I. Asset Management Report
(6) Significant Events after Balance Sheet Date A. Disposition of Assets
DHR disposed of the following property: Asset name Big Tower Minami Sanjo Asset type Trust beneficiary interest in real estate Asset class Residential properties Disposition price (Note 1) ¥3,515,000 thousand Buyer (Note 2) Mantomi Building Date of disposition March 1, 2021
(Notes) 1. This figure does not include expenses pertaining to dispositions, settlement money such as taxes and public dues, consumption taxes, etc. 2. The buyer falls neither under the category of a party having a special interest relationship with DHR or the Asset Manager, nor under the category of a related party of DHR
or the Asset Manager. B. Acquisition of Assets
DHR acquired the following property: Asset name DPL Shin-Narashino Asset type Trust beneficiary interest in real estate Asset class Logistics properties Acquisition price (Note 1) ¥5,930,000 thousand Seller (Note 2) Daiwa House Industry Co., Ltd. Date of acquisition April 1, 2021
(Notes) 1. This figure does not include expenses pertaining to acquisitions, settlement money such as taxes and public dues, consumption taxes, etc. 2. Daiwa House, the seller, is defined as an interested party, etc. in the Investment Trusts Act. Therefore, the Asset Manager has gone through the necessary discussion and
resolution procedures in accordance with its regulations on transactions with interested parties.
C. Debt Financing DHR conducted debt financing for the funds for the repayment of ¥3,000 million in long-term loans due on April 1, 2021, as follows:
Lender
Borrowing amount (Yen in millions)
Interest rate Borrowing date
Repayment date
Method of repayment Collateral
Sumitomo Mitsui Banking Corporation Sumitomo Mitsui Trust Bank, Limited MUFG Bank, Ltd. Mizuho Bank, Ltd.
3,000 0.70311% (Fixed interest rate) April 1, 2021 April 1, 2031 Bullet
repayment
Unsecured and
non-guaranteed
D. Issuance of Investment Corporation Bonds DHR issued investment corporation bonds to provide for part of the funds for the refinance of ¥9,500 million in long-term loans due on April 30, 2021, as follows:
Name of investment corporation bonds Issue amount (Yen in millions) Interest rate Maturity Collateral
Daiwa House REIT Investment Corporation 14th Unsecured Investment Corporation Bonds (Pari passu conditions among specified investment corporation bonds) (Green Bonds)
4,000 0.500% April 15, 2031 Unsecured
and non-guaranteed
2120

I. Asset Management ReportI. Asset Management Report
2. Overview of the Investment Corporation (1) Status of Investment Units
26th period
As of February 28, 2019
27th period As of August 31,
2019
28th period As of February
29, 2020
29th period As of August 31,
2020
30th period As of February
28, 2021 Total number of authorized investment units 8,000,000 8,000,000 8,000,000 8,000,000 8,000,000
Total number of investment units issued 1,927,000 2,075,000 2,075,000 2,196,000 2,196,000 Unitholders’ capital (Yen in thousands) 163,230,367 198,492,847 198,492,847 231,766,153 231,766,153
Number of unitholders 16,903 17,717 16,349 18,024 19,059
(2) Matters concerning Investment Units The major unitholders as of February 28, 2021 are as follows:
Name Number of investment units held (Units)
Percentage of investment units held against the total number of investment units
issued (%) (Note) Custody Bank of Japan, Ltd. (Trust account) 417,722 19.0
The Master Trust Bank of Japan, Ltd. (Trust account) 328,637 15.0
Daiwa House Industry Co., Ltd. 189,200 8.6
The Nomura Trust and Banking Co., Ltd. (Investment trust account) 93,834 4.3
Custody Bank of Japan, Ltd. (Securities investment trust account) 72,030 3.3
State Street Bank - West Client - Treaty 505234 54,332 2.5
SMBC Nikko Securities Inc. 48,148 2.2
JAPAN SECURITIES FINANCE CO., LTD. 28,586 1.3
State Street Bank and Trust Company 505103 25,109 1.1
STICHTING PGGM DEPOSITARY PGGM LISTED REAL ESTATE PF FUND 22,535 1.0
Total 1,280,133 58.3 (Note) The percentages are rounded to the first decimal place.
(3) Officers
The following table provides information about the officers.
Title and post Name Major concurrent position Total remuneration per title
during the 30th period (Yen in thousands)
Executive Director Toshiharu Asada – 2,400
Supervisory Directors
Tetsuya Iwasaki Certified Public Accountant and Enrolled Agent, Citia Certified Public Accountant Firm Outside Director, Uoriki Co., Ltd.
2,100
Hiroshi Ishikawa Attorney, Ohhara Law Office Outside Director, Japan Medical Dynamic Marketing, INC.
2,100
Accounting Auditor Ernst & Young ShinNihon LLC – 19,000
(Notes) 1. The Executive Director and Supervisory Directors do not hold investment units of DHR under their own or another person’s name. Any Supervisory Director may serve as an executive of a corporation other than those listed above, but such corporations including those listed above do not have any interest in DHR.
2. Dismissal or non-reappointment of the Accounting Auditor shall be discussed at DHR’s board of directors pursuant to the provisions of the Investment Trusts Act for dismissal, taking into full account all relevant factors for non-reappointment such as the quality of audits and remuneration for audits.
3. ¥2,000 thousand of the remuneration for the Accounting Auditor is related to the preparation of a comfort letter.
I. Asset Management Report
(4) Asset Manager, Custodian and General Administrators
Business Name
Asset Manager Daiwa House Asset Management Co., Ltd.
Custodian Sumitomo Mitsui Trust Bank, Limited
General Administrator Sumitomo Mitsui Trust Bank, Limited
Transfer agent / Special account administrator Sumitomo Mitsui Trust Bank, Limited
Administrator of investment corporation bonds Sumitomo Mitsui Trust Bank, Limited, MUFG Bank, Ltd., Sumitomo Mitsui Banking Corporation
2. Overview of the Investment Corporation
2322
I. Asset Management ReportI. Asset Management Report
3. Portfolio of DHR (1) Composition of Assets
The following table provides information about the composition of assets.
Type of assets Asset class Area (Note 1)
29th period August 31, 2020
30th period February 28, 2021
Total amount held (Yen in millions)
(Note 2)
Percentage to total assets (%) (Note 3)
Total amount held (Yen in millions)
(Note 2)
Percentage to total assets (%) (Note 3)
Real estate
Residential properties
Three major metropolitan
areas of Japan
Greater Tokyo area 23,648 2.6 23,576 2.6
Greater Nagoya area 897 0.1 897 0.1
Greater Osaka area 13,134 1.5 13,157 1.5
Other 5,194 0.6 3,315 0.4 Retail
properties Other 1,471 0.2 1,471 0.2
Subtotal 44,346 4.9 42,418 4.7
Trust beneficiary interests in real estate
Logistics properties
Three major metropolitan
areas of Japan
Greater Tokyo area 270,449 30.1 269,469 29.9
Greater Nagoya area 15,573 1.7 15,565 1.7
Greater Osaka area 22,621 2.5 22,469 2.5
Other 88,114 9.8 87,503 9.7
Residential properties
Three major metropolitan
areas of Japan
Greater Tokyo area 165,579 18.4 164,743 18.3
Greater Nagoya area 5,868 0.7 5,810 0.6
Greater Osaka area 5,979 0.7 5,931 0.7
Other 4,822 0.5 4,743 0.5
Retail properties
Three major metropolitan
areas of Japan
Greater Tokyo area 32,305 3.6 32,177 3.6
Greater Nagoya area 2,390 0.3 2,390 0.3
Greater Osaka area 22,981 2.6 23,067 2.6
Other 63,042 7.0 62,880 7.0
Hotel properties
Three major metropolitan
areas of Japan
Greater Tokyo area 4,735 0.5 4,712 0.5
Greater Nagoya area 4,516 0.5 4,512 0.5
Greater Osaka area 1,450 0.2 1,441 0.2
Other 5,167 0.6 8,273 0.9
Other assets
Three major metropolitan
areas of Japan
Greater Tokyo area 3,241 0.4 3,237 0.4
Other 23,499 2.6 23,329 2.6 Subtotal 742,342 82.5 742,260 82.3
Deposits and other assets 112,890 12.5 116,707 12.9 Total assets 899,579 100.0 901,386 100.0
(Notes) 1. Three major metropolitan areas of Japan in “Area” are the greater Tokyo area (Tokyo, Kanagawa, Saitama and Chiba, the same shall apply hereinafter), the greater Nagoya area (Aichi, Gifu and Mie, the same shall apply hereinafter) and the greater Osaka area (Osaka, Kyoto, Hyogo, Nara and Shiga, the same shall apply hereinafter). The same shall apply hereinafter.
2. “Total amount held” represents the amounts recorded on the balance sheets as of the last day of each fiscal period (August 31, 2020 and February 28, 2021), which are rounded down to the nearest million yen. For real estate properties and trust beneficiary interests in real estate (may be referred to as “real estate in trust” or “trust beneficiary interests in real estate”), the amounts are their acquisition prices (including expenses associated with the acquisition) less accumulated depreciation.
3. “Percentage to total assets” is rounded to the first decimal place.
I. Asset Management Report
(2) Principal Assets Held The overview of principal assets held by DHR as of February 28, 2021 (top ten properties in terms of book value at the end of the period) is as follows:
Property name Book value
(Yen in millions) (Note 1)
Leasable area (m2)
(Note 2)
Leased area (m2)
(Note 3)
Occupancy rate (%) (Note 4)
Rate to total real estate rental revenues (%)
(Note 5)
Primary use
iias Tsukuba 34,143 138,900.39 138,900.39 100.0 3.9 Retail
DPL Nagareyama I 32,566 124,489.93 124,489.93 100.0 (Note 6) Logistics
D Project Urayasu II 25,296 72,320.01 72,320.01 100.0 (Note 6) Logistics
DPL Misato 16,434 55,864.47 55,864.47 100.0 (Note 6) Logistics
D Project Hachioji 14,956 62,394.17 62,394.17 100.0 (Note 6) Logistics
GRANODE Hiroshima 14,345 14,962.23 14,890.93 99.5 1.8 Other assets
DPL Fukuoka Kasuya 13,030 73,754.20 73,754.20 100.0 (Note 6) Logistics
D Project Itabashi Shingashi 12,207 33,763.46 33,763.46 100.0 (Note 6) Logistics
D Project Inuyama 10,348 54,197.80 54,197.80 100.0 (Note 6) Logistics
D Project Nishiyodogawa 9,752 39,584.80 39,584.80 100.0 (Note 6) Logistics
Total 183,081 670,231.46 670,160.16 100.0 20.2 – (Notes) 1. “Book value” is the amount recorded on the balance sheets as of February 28, 2021 (in the case of real estate and real estate in trust, “Book value” is the acquisition price (including
expenses associated with the acquisition) less accumulated depreciation), which is rounded down to the nearest million yen. 2. “Leasable area” means the leasable area of the building (or land in the case of land properties) in relation to each real estate or each real estate in trust and the figures stated refer
to the area DHR believes is leasable as indicated in the relevant lease agreement or drawing of the building, etc. in relation to each real estate or each real estate in trust as of February 28, 2021. In the cases of each co-owned real estate or quasi co-owned trust beneficiary interests, the leasable area of the entire real estate multiplied by the ratio of co-ownership of the real estate or quasi co-ownership of the trust beneficiary interests in real estate held by DHR is provided.
3. “Leased area” represents the leased area in the leasable area as indicated in the lease agreement in relation to each real estate or each real estate in trust as of February 28, 2021. However, in the case of a pass-through type master lease agreement entered into with the master lease company, the leased area to end-tenants indicated in each sublease agreement entered into between the master lease company and end-tenants for each real estate or each real estate in trust as of February 28, 2021, is provided. As some lease agreements for each real estate or each real estate in trust may indicate leased area that includes portions not included in the gross floor area, the leased area may exceed the gross floor area. In particular, at logistics properties, when eaves are included in the leased area, the leased area may significantly exceed the gross floor area. In the cases of each co-owned real estate or quasi co-owned trust beneficiary interests, the leased area of the entire real estate multiplied by the ratio of co-ownership of the real estate or quasi co-ownership of the trust beneficiary interests in real estate held by DHR is provided.
4. “Occupancy rate” represents occupancy rate (the percentage of leased area to the leasable area) of each property as of February 28, 2021, which is rounded to the first decimal place.
5. “Rate to total real estate rental revenues” is the rental revenues from each real estate or each real estate in trust expressed as a percentage of the total rental revenues from the entire portfolio, rounded to the first decimal place.
6. Undisclosed as consent for disclosure has not been obtained from the lessee.
(3) Description of Portfolio The overview of portfolio assets held by DHR as of February 28, 2021 (real estate and real estate in trust, etc.) is as follows:
Asset class Property name Location (Note 1) Form of ownership
Leasable area (m2) (Note 2)
Assessed value at the
end of period (Yen in
millions) (Note 3)
Book value (Yen in
millions) (Note 4)
Logi
stic
s pr
oper
ties
D Project Machida 2-1-6, Oyamagaoka, Machida City, Tokyo Real estate in trust 50,490.39 10,000 9,214 D Project Hachioji 3-21-1, Minami-Osawa, Hachioji City, Tokyo Real estate in trust 62,394.17 17,000 14,956
D Project Aikawa-Machi 4020-12, Aza Sakuradai, Nakatsu, Aikawa-machi, Aiko District, Kanagawa Real estate in trust 14,240.84 4,570 3,701
D Project Urayasu I 12-1, Chidori, Urayasu City, Chiba Real estate in trust 36,515.81 10,100 9,227 D Project Urayasu II 11-5, Chidori, Urayasu City, Chiba Real estate in trust 72,320.01 28,200 25,296 D Project Akanehama 3-2-8, Akanehama, Narashino City, Chiba Real estate in trust 11,663.39 3,050 2,835 D Project Noda 1-1, Aza Tamei, Futatsuka, Noda City, Chiba Real estate in trust 29,232.53 6,490 5,937 D Project Inuyama 5-5, Aza Takanebora, Inuyama City, Aichi Real estate in trust 54,197.80 12,020 10,348 D Project Neyagawa 2-24-12, Shimeno, Neyagawa City, Osaka Real estate in trust 11,151.51 6,460 5,761 D Project Morioka 3-18, Ogama-kazabayashi, Takizawa City, Iwate Real estate in trust 9,558.32 1,210 1,148
D Project Tsuchiura 20-29, Aza Harayama, Hongo, Tsuchiura City, Ibaraki Real estate in trust 17,448.86 3,630 3,182
D Project Fukuoka Umi 384-15, Aza Noguchi, Oaza Ino, Umi-machi, Kasuya District, Fukuoka Real estate in trust 24,729.56 4,980 4,089
D Project Tosu 1624, Aza Hasuhara, Himekata-machi, Tosu City, Saga Real estate in trust 17,858.01 6,130 5,332
D Project Kuki I 6004-2, Aza Taikoda, Shobu-cho Shobu, Kuki City, Saitama Real estate in trust 22,708.72 4,350 3,723
D Project Kuki II 6201-1, Aza Kazarimen, Shobu-cho Sanga, Kuki City, Saitama Real estate in trust 50,490.00 9,140 7,613
D Project Kawagoe I 3-2-3, Yoshinodai, Kawagoe City, Saitama Real estate in trust 16,150.88 3,960 3,384 D Project Kawagoe II 3-2-4, Yoshinodai, Kawagoe City, Saitama Real estate in trust 19,872.00 5,480 4,663
DPL Inuyama 1-8, Aza Nakahiratsuka, Oaza Haguroshinden, Inuyama City, Aichi Real estate in trust 21,628.50 4,320 3,742
3. Portfolio of DHR
2524

I. Asset Management ReportI. Asset Management Report
Asset class Property name Location (Note 1) Form of ownership
Leasable area (m2) (Note 2)
Assessed value at the
end of period (Yen in
millions) (Note 3)
Book value (Yen in
millions) (Note 4)
Logi
stic
s pr
oper
ties
D Project Fukuoka Hakozaki 5-2-1, Hakozakifuto, Higashi Ward, Fukuoka City, Fukuoka Real estate in trust 34,710.80 4,700 4,167
D Project Kuki III 6004-1, Aza Taikoda, Shobu-cho Shobu, Kuki City, Saitama Real estate in trust 26,937.41 8,640 7,226
D Project Kuki IV 6201-5, Aza Kazarimen, Shobu-cho Sanga, Kuki City, Saitama Real estate in trust 26,460.00 6,200 5,233
D Project Kuki V 6201-6, Aza Kazarimen, Shobu-cho Sanga, Kuki City, Saitama Real estate in trust 47,320.89 9,180 7,887
D Project Kuki VI 48-3, Kiyoku-cho, Kuki City, Saitama Real estate in trust 29,244.66 5,690 4,858 D Project Yashio 50-1, Oaza Shin-machi, Yashio City, Saitama Real estate in trust 21,965.04 6,900 6,119
D Project Nishiyodogawa 2-7-48, Nakashima, Nishiyodogawa Ward, Osaka City, Osaka Real estate in trust 39,584.80 11,100 9,752
D Project Matsudo 700-3, Aza Nishinooda, Kamihongo, Matsudo City, Chiba Real estate in trust 26,776.67 7,910 7,096
D Project Hibiki Nada 3-1-5, Hibiki-machi, Wakamatsu Ward, Kitakyushu City, Fukuoka Real estate in trust 23,933.75 2,110 1,943
D Project Morioka II 3-15, Ogama-kazabayashi, Takizawa City, Iwate Real estate in trust 4,481.00 1,320 1,215 D Project Kawagoe III 2-8-55, Yoshinodai, Kawagoe City, Saitama Real estate in trust 39,572.32 8,010 6,905 D Project Kazo 2-16-1, Okuwa, Kazo City, Saitama Real estate in trust 18,437.60 3,690 3,218 D Project Urayasu III 12-1, Chidori, Urayasu City, Chiba Real estate in trust 39,441.32 9,980 8,526 D Project Tomisato 7-2, Misawa, Tomisato City, Chiba Real estate in trust 36,113.25 5,390 4,747 D Project Kyotanabe 3-50-1, Kannabidai, Kyotanabe City, Kyoto Real estate in trust 10,965.68 3,860 3,406 D Project Sendai Izumi 2-9-1, Akedori, Izumi Ward, Sendai City, Miyagi Real estate in trust 10,764.05 1,620 1,438 D Project Oyama 2333-34, Aza Atago, Oaza Hari, Oyama City, Tochigi Real estate in trust 14,106.91 2,090 1,909 D Project Sano 570-9, Nishiura-cho, Sano City, Tochigi Real estate in trust 15,668.44 1,850 1,683
D Project Tatebayashi 110-8, Aza Uchiya, Shimosagawada-cho, Tatebayashi City, Gunma Real estate in trust 13,521.56 3,280 2,948
D Project Kakegawa 653-14, Aza Oyabu, Sakagawa, Kakegawa City, Shizuoka Real estate in trust 39,341.44 6,140 5,767
D Project Hiroshima Seifu 2-2-1, Tomonishi, Asaminami Ward, Hiroshima City, Hiroshima Real estate in trust 19,004.72 4,110 3,665
D Project Tosu II 1621, Aza Hasuhara, Himekata-machi, Tosu City, Saga Real estate in trust 13,012.50 1,940 1,610
D Project Kawagoe IV 3-2-1, Yoshinodai, Kawagoe City, Saitama Real estate in trust 24,684.47 6,120 5,482
D Project Kuki VII 6004-3, Aza Taikoda, Shobu-cho Shobu, Kuki City, Saitama Real estate in trust 3,225.46 1,170 1,026
D Project Chibakita 461-1, Naganumacho, Inage Ward, Chiba City, Chiba Real estate in trust 24,368.86 8,470 7,515
D Project Matsudo II 700-1, Aza Nishinooda, Kamihongo, Matsudo City, Chiba Real estate in trust 25,305.82 8,680 8,011
D Project Tomisato II 1-6, Misawa, Tomisato City, Chiba Real estate in trust 40,870.56 7,220 6,673
D Project Osaka Hirabayashi 2-6-15, Hirabayashikita, Suminoe Ward, Osaka City, Osaka Real estate in trust 22,485.08 4,240 3,549
D Project Sendai Izumi II 3-1-1, Akedori, Izumi Ward, Sendai City, Miyagi Real estate in trust 39,580.46 7,670 7,012
D Project Kaminokawa 2568-1, Aza Minamihara, Oaza Tako, Kaminokawamachi, Kawachi District, Tochigi Real estate in trust 52,239.75 8,210 7,646
D Project Fuji 2261-6, Aza Shiroyama, Obuchi, Fuji City, Shizuoka Real estate in trust 23,795.40 3,640 3,471 D Project Tosu III 3-1-3, Yayoigaoka, Tosu City, Saga Real estate in trust 65,215.07 9,630 8,872 D Project Kitahachioji I 2969-2, Ishikawamachi, Hachioji City, Tokyo Real estate in trust 16,523.82 4,530 4,254 D Project Kitahachioji II 2969-18, Ishikawamachi, Hachioji City, Tokyo Real estate in trust 21,402.20 6,000 5,660 D Project Kitahachioji III 2969-19, Ishikawamachi, Hachioji City, Tokyo Real estate in trust 26,275.05 7,730 7,243 D Project Itabashi Shingashi 1-2-2, Shingashi, Itabashi Ward, Tokyo Real estate in trust 33,763.46 12,700 12,207
D Project Sagamihara 1-2-31, Miyashimo, Chuo Ward, Sagamihara City, Kanagawa Real estate in trust 16,599.30 4,080 3,849
D Project Kuki VIII 49-3, Kiyokucho, Kuki City, Saitama Real estate in trust 29,410.54 6,350 6,007 D Project Yokkaichi 1947-14, Nakamuracho, Yokkaichi City, Mie Real estate in trust 6,185.46 1,500 1,474 D Project Ibaraki Ishioka 6-4, Kashiwabara, Ishioka City, Ibaraki Real estate in trust 24,493.54 4,200 3,985 DPL Misato 1-3-5, Inter-Minami, Misato City, Saitama Real estate in trust 55,864.47 19,000 16,434
DPL Fukuoka Kasuya 642-1, Aza Sanjyuroku, Oaza Uchihashi, Kasuyamachi, Kasuya District, Fukuoka Real estate in trust 73,754.20 13,900 13,030
DPL Kitakyushu 5-14, Sonekitamachi, Kokuraminami Ward, Kitakyushu City, Fukuoka Real estate in trust 26,672.98 3,630 3,383
DPL Nagareyama I 1374-1, Aza Taneishita, Nishifukai, Nagareyama City, Chiba Real estate in trust 124,489.93 33,800 32,566
Logistics properties – Subtotal 1,871,221.99 439,270 394,846
Res
iden
tial
prop
ertie
s
Qiz Ebisu 4-3-1, Ebisu, Shibuya Ward, Tokyo Real estate in trust 5,230.39 9,450 7,397 Castalia Azabujuban Shichimenzaka 2-7-5, Azabujuban, Minato Ward, Tokyo Real estate in trust 3,492.93 4,610 4,103
Castalia Shibakoen 3-32-10, Shiba, Minato Ward, Tokyo Real estate in trust 2,707.51 2,500 2,372 Castalia Ginza 1-14-13, Ginza, Chuo Ward, Tokyo Real estate in trust 2,226.42 2,410 2,285
I. Asset Management Report
Asset class Property name Location (Note 1) Form of ownership
Leasable area (m2) (Note 2)
Assessed value at the
end of period (Yen in
millions) (Note 3)
Book value (Yen in
millions) (Note 4)
Res
iden
tial p
rope
rties
Castalia Hiroo 3-13-3, Nishi Azabu, Minato Ward, Tokyo Real estate in trust 1,621.59 2,070 2,038 Castalia Nihonbashi 11-2, Nihonbashi Kabuto-cho, Chuo Ward, Tokyo Real estate in trust 1,458.73 1,250 1,064 Castalia Hacchobori 3-27-5, Hacchobori, Chuo Ward, Tokyo Real estate in trust 2,969.57 2,410 2,025 Castalia Azabujuban 2-10-1, Azabujuban, Minato Ward, Tokyo Real estate in trust 2,400.00 2,860 2,720 Castalia Azabujuban II 2-21-2, Azabujuban, Minato Ward, Tokyo Real estate in trust 2,094.58 2,740 2,504 Castalia Shinjuku Natsumezaka 10-1, Kikui-cho, Shinjuku Ward, Tokyo Real estate in trust 1,917.62 1,700 1,765 Castalia Ginza II 1-23-4, Ginza, Chuo Ward, Tokyo Real estate in trust 1,817.56 1,830 1,616 Castalia Shibuya Sakuragaoka 29-21, Sakuragaoka-cho, Shibuya Ward, Tokyo Real estate in trust 1,123.80 1,260 1,345 Castalia Nishi Azabu Kasumicho 1-3-12, Nishi Azabu, Minato Ward, Tokyo Real estate in trust 2,779.77 2,640 2,303
Castalia Ochanomizu 3-24-1, Kanda-Ogawamachi, Chiyoda Ward, Tokyo Real estate in trust 2,559.21 2,410 1,664 Castalia Sangubashi 4-52-12, Yoyogi, Shibuya Ward, Tokyo Real estate in trust 1,898.47 1,690 1,459 Castalia Suitengu 2-8-13, Nihonbashi Kakigaracho, Chuo Ward, Tokyo Real estate in trust 1,940.94 1,630 1,186
Castalia Suitengu II 1-38-16, Nihonbashi Kakigaracho, Chuo Ward, Tokyo Real estate in trust 1,858.34 1,450 1,068
Castalia Shintomicho 3-10-10, Irifune, Chuo Ward, Tokyo Real estate in trust 1,444.52 1,180 889 Castalia Shintomicho II 2-6-4, Irifune, Chuo Ward, Tokyo Real estate in trust 1,244.54 1,040 797 Castalia Harajuku 3-55-3, Sendagaya, Shibuya Ward, Tokyo Real estate in trust 1,225.26 1,050 866 Castalia Yoyogi Uehara 1-17-16, Uehara, Shibuya Ward, Tokyo Real estate in trust 811.95 776 640 Castalia Sendagaya 2-9-10, Sendagaya, Shibuya Ward, Tokyo Real estate in trust 803.03 684 544 Castalia Shinjuku 7 chome 7-17-16, Shinjuku, Shinjuku Ward, Tokyo Real estate in trust 957.60 583 430 Castalia Ningyocho 7-15, Nihonbashi Tomisawacho, Chuo Ward, Tokyo Real estate in trust 1,747.90 1,480 870 Castalia Ningyocho II 8-12, Nihonbashi Tomisawacho, Chuo Ward, Tokyo Real estate in trust 1,826.80 1,570 962 Castalia Shin-Ochanomizu 2-3-3, Kanda Awaji-cho, Chiyoda Ward, Tokyo Real estate in trust 1,308.38 1,180 835 Castalia Higashi Nihonbashi II 12-11, Nihonbashi Tomisawacho, Chuo Ward, Tokyo Real estate in trust 2,117.46 1,870 1,253 Castalia Jinbocho 2-40-8, Kanda-Jinbocho, Chiyoda Ward, Tokyo Real estate in trust 1,628.80 1,610 1,060 Castalia Shintomicho III 2-8-8, Irifune, Chuo Ward, Tokyo Real estate in trust 972.51 847 594 Castalia Shinjuku Gyoen 2-14-4, Shinjuku, Shinjuku Ward, Tokyo Real estate in trust 3,594.16 3,490 2,550 Castalia Takanawadai 3-4-12, Takanawa, Minato Ward, Tokyo Real estate in trust 1,147.44 1,150 803 Castalia Higashi Nihonbashi III 3-5-6, Higashi-Nihonbashi, Chuo Ward, Tokyo Real estate in trust 1,105.20 870 590 Castalia Shinjuku Gyoen II 1-29-15, Shinjuku, Shinjuku Ward, Tokyo Real estate in trust 668.79 579 459 Castalia Shintomicho IV 3-10-8, Irifune, Chuo Ward, Tokyo Real estate in trust 681.00 538 385 Castalia Takanawadai II 3-5-6, Takanawa, Minato Ward, Tokyo Real estate in trust 1,567.84 1,500 1,134 Castalia Minami Azabu 2-2-27, Minami Azabu, Minato Ward, Tokyo Real estate in trust 882.67 818 606 Castalia Ginza III 8-18-2, Ginza, Chuo Ward, Tokyo Real estate 3,494.42 3,220 2,692 Castalia Kayabacho 2-1, Nihonbashi Koami-cho, Chuo Ward, Tokyo Real estate 4,602.95 3,470 2,470 Castalia Takanawa 2-17-12, Takanawa, Minato Ward, Tokyo Real estate in trust 10,408.26 9,190 7,300 Castalia Higashi Nihonbashi 9-14, Nihonbashi Yokoyama-cho, Chuo Ward, Tokyo Real estate 6,442.28 4,320 3,235 Castalia Shinjuku 2-6-11, Shinjuku, Shinjuku Ward, Tokyo Real estate 3,150.80 3,620 2,787 Castalia Ichigaya 14-4, Ichigaya Yakuoji-machi, Shinjuku Ward, Tokyo Real estate in trust 1,546.34 1,410 860
Shibaura Island Bloom Tower 4-20-2, 4-20-3, 4-20-4, Shibaura, Minato Ward, Tokyo Real estate in trust 16,849.50 9,440 6,312
Castalia Hatsudai 1-10-9, Honmachi, Shibuya Ward, Tokyo Real estate in trust 3,077.05 2,500 1,972 Castalia Hatsudai II 1-33-7, Honmachi, Shibuya Ward, Tokyo Real estate in trust 2,339.42 2,330 1,829 Castalia Ebisu 3-15-6, Ebisu, Shibuya Ward, Tokyo Real estate in trust 1,659.71 1,770 1,379 Castalia Meguro Kamurozaka 4-31-23, Nishi Gotanda, Shinagawa Ward, Tokyo Real estate in trust 4,967.97 4,830 3,944 Castalia Toritsudaigaku 1-4-1, Midorigaoka, Meguro Ward, Tokyo Real estate in trust 863.70 543 567 Castalia Yukigaya 2-13-3, Higashi Yukigaya, Ota Ward, Tokyo Real estate in trust 1,542.30 1,200 983 Castalia Yutenji 2-14-21, Yutenji, Meguro Ward, Tokyo Real estate in trust 1,380.35 1,380 1,297 Castalia Otsuka 3-17-4, Minami Otsuka, Toshima Ward, Tokyo Real estate in trust 1,871.70 1,710 1,279 Castalia Kikukawa 2-1-12, Kikukawa, Sumida Ward, Tokyo Real estate in trust 1,168.18 882 724 Castalia Meguro 2-1-13, Meguro, Meguro Ward, Tokyo Real estate in trust 1,414.73 1,230 859 Castalia Otsuka II 2-32-20, Higashi-Ikebukuro, Toshima Ward, Tokyo Real estate in trust 1,784.50 1,420 955 Castalia Jiyugaoka 1-20-1, Jiyugaoka, Meguro Ward, Tokyo Real estate in trust 1,472.47 1,510 1,145 Castalia Mejiro 2-8-16, Takada, Toshima Ward, Tokyo Real estate in trust 1,658.90 1,150 907 Castalia Ikebukuro 3-1-12, Nishi-Ikebukuro, Toshima Ward, Tokyo Real estate in trust 3,644.35 3,090 2,381 Castalia Kaname-cho 5-26-10 Nishi-Ikebukuro, Toshima Ward, Tokyo Real estate in trust 1,624.06 1,340 1,075 Castalia Tower Shinagawa Seaside
4-10-18, Higashi Shinagawa, Shinagawa Ward, Tokyo Real estate in trust 12,732.35 9,550 6,699
Castalia Yakumo 2-20-5, Yakumo, Meguro Ward, Tokyo Real estate 1,276.91 869 814 Castalia Togoshiekimae 1-7-16, Hiratsuka, Shinagawa Ward, Tokyo Real estate 2,014.12 2,270 1,429 Castalia Honjo Azumabashi 3-7-11, Honjo, Sumida Ward, Tokyo Real estate in trust 2,255.88 1,280 958 Castalia Kitazawa 1-15-5, Kitazawa, Setagaya Ward, Tokyo Real estate in trust 1,220.16 916 740 Castalia Monzennakacho 1-17-12, Fukuzumi, Koto Ward, Tokyo Real estate in trust 887.94 630 462 Castalia Kamiikedai 1-4-15, Kamiikedai, Ota Ward, Tokyo Real estate in trust 414.45 237 176 Castalia Morishita 1-16-12, Morishita, Koto Ward, Tokyo Real estate in trust 1,383.90 1,140 774 Castalia Wakabayashikoen 4-39-4, Wakabayashi, Setagaya Ward, Tokyo Real estate in trust 1,425.43 907 734
2726

I. Asset Management ReportI. Asset Management Report
Asset class Property name Location (Note 1) Form of ownership
Leasable area (m2) (Note 2)
Assessed value at the
end of period (Yen in
millions) (Note 3)
Book value (Yen in
millions) (Note 4)
Res
iden
tial p
rope
rties
Castalia Asakusabashi 2-16-21, Yanagi-bashi, Taito Ward, Tokyo Real estate in trust 1,537.84 1,010 715 Castalia Iriya 3-1-28, Shitaya, Taito Ward, Tokyo Real estate in trust 1,415.15 703 505 Castalia Kita Ueno 1-15-5, Kita-Ueno, Taito Ward, Tokyo Real estate in trust 4,197.66 3,080 2,407 Castalia Morishita II 2-12-11, Shin-Ohashi, Koto Ward, Tokyo Real estate 1,275.60 895 594 Castalia Minowa 5-24-4, Negishi, Taito Ward, Tokyo Real estate 2,406.41 1,650 1,258 Castalia Oyamadai 7-14-13, Todoroki, Setagaya Ward, Tokyo Real estate 857.32 615 509 Castalia Nakano 2-12-13, Arai, Nakano Ward, Tokyo Real estate 1,613.86 1,330 979 Castalia Yoga 1-3-12, Tamagawadai, Setagaya Ward, Tokyo Real estate 1,472.38 1,180 854 Castalia Sumiyoshi 2-8-11, Sumiyoshi, Koto Ward, Tokyo Real estate 1,362.60 1,090 846 Castalia Monzennakacho II 2-2-9, Tomioka, Koto Ward, Tokyo Real estate 3,038.98 2,940 1,930 Castalia Oshiage 3-5-2, Mukoujima, Sumida Ward, Tokyo Real estate 1,785.24 1,240 952 Castalia Kuramae 3-9-4, Kuramae, Taito Ward, Tokyo Real estate 1,994.93 1,570 1,103 Castalia Nakanobu 4-7-11, Nakanobu, Shinagawa Ward, Tokyo Real estate in trust 2,421.82 2,490 1,642 Royal Parks Toyosu 3-5-21, Toyosu, Koto Ward, Tokyo Real estate in trust 18,112.03 10,600 5,727 Castalia Togoshi 5-2-1, Togoshi, Shinagawa Ward, Tokyo Real estate in trust 2,629.59 2,510 1,540 Castalia Ooimachi 4-2-11, Ooi, Shinagawa Ward, Tokyo Real estate 1,413.75 1,700 1,115 Castalia Omori 1-19-20, Omori kita, Ota Ward, Tokyo Real estate in trust 2,046.36 1,870 1,364 Castalia Mishuku 1-3-39, Taishidou, Setagaya Ward, Tokyo Real estate in trust 2,640.86 2,420 1,780 Castalia Arakawa 2-3-1, Arakawa, Arakawa Ward, Tokyo Real estate in trust 3,797.92 2,320 1,520 Castalia Omori II 1-8-13, Omori kita, Ota Ward, Tokyo Real estate in trust 2,818.70 3,090 2,205 Castalia Nakameguro 1-18-7, Aobadai, Meguro Ward, Tokyo Real estate in trust 3,166.71 4,880 3,739 Castalia Meguro Chojyamaru 2-8-1, Kamiosaki, Shinagawa Ward, Tokyo Real estate in trust 2,123.77 2,610 1,972 Castalia Meguro Takaban 1-6-19, Takaban, Meguro Ward, Tokyo Real estate in trust 1,961.52 1,990 1,726 Castalia Omori III 5-21-11, Minami-ooi, Shinagawa Ward, Tokyo Real estate in trust 2,004.80 1,850 1,439 Castalia Meguro Tairamachi 1-23-8, Tairamachi, Meguro Ward, Tokyo Real estate in trust 1,278.52 1,420 1,181 Royal Parks SEASIR 1-16-2, Nishiarai Sakae-cho, Adachi Ward, Tokyo Real estate in trust 17,269.74 5,220 3,787 Castalia Honkomagome 6-21-2, Honkomagome, Bunkyo Ward, Tokyo Real estate in trust 2,224.41 1,930 1,480
Cosmo Heim Musashikosugi 2-8, Kizuki Ise-cho, Nakahara Ward, Kawasaki City, Kanagawa Real estate in trust 4,208.83 2,170 1,650
Castalia Tsurumi 3-5-10, Tsurumi Chuo, Tsurumi Ward, Yokohama City, Kanagawa Real estate in trust 1,452.09 789 573
Castalia Funabashi 4-4-8, Honcho, Funabashi City, Chiba Real estate in trust 1,552.01 830 670 Castalia Nishi Funabashi 4-19-16, Nishi Funa, Funabashi City, Chiba Real estate in trust 1,597.32 998 723
Castalia Nogeyama 1-8-1, Hinodecho, Naka Ward, Yokohama City, Kanagawa Real estate in trust 744.90 329 290
Castalia Ichikawa 1-24-3, Ichikawa, Ichikawa City, Chiba Real estate in trust 876.89 572 410 Royal Parks Hanakoganei 1-8-2, Hanakoganei, Kodaira City, Tokyo Real estate in trust 18,153.57 6,620 4,645
Castalia Musashikosugi 2-21, Imaikami-cho, Nakahara Ward, Kawasaki City, Kanagawa Real estate in trust 2,179.80 2,020 1,607
Royal Parks Wakabadai 2-1-1, Wakabadai, Inagi City, Tokyo Real estate in trust 21,367.93 4,830 3,621 Pacific Royal Court Minatomirai Urban Tower
5-3-3, Minatomirai, Nishi Ward, Yokohama City, Kanagawa Real estate in trust 26,294.49 11,700 7,787
L-Place Shinkoyasu 3-298-1, Koyasu-dori, Kanagawa Ward, Yokohama City, Kanagawa Real estate in trust 3,009.74 2,190 1,630
Royal Parks Musashikosugi 13-8, Aza Shinjuku-kochi, Nakamaruko, Nakahara Ward, Kawasaki City, Kanagawa Real estate in trust 3,808.97 1,380 939
Castalia Sakaisuji Honmachi 1-3-7, Kyutarocho, Chuo Ward, Osaka City, Osaka Real estate in trust 3,471.39 1,900 1,268 Castalia Shin-Umeda 6-8-21, Nakatsu, Kita Ward, Osaka City, Osaka Real estate in trust 3,279.90 1,690 1,224 Castalia Abeno 2-4-37, Abeno-Suji, Abeno Ward, Osaka City, Osaka Real estate 10,920.75 5,660 4,037 Castalia Sakae 4-16-10, Sakae, Naka Ward, Nagoya City, Aichi Real estate 2,836.00 1,270 897 Castalia Higashi Hie 5-31, Hie-cho, Hakata Ward, Fukuoka City, Fukuoka Real estate 3,061.60 1,080 815
Castalia Tower Nagahoribashi 1-15-25, Shimanouchi, Chuo Ward, Osaka City, Osaka Real estate 8,747.40 4,790 2,846
Castalia Sannomiya 3-2-31, Isobedori, Chuo Ward, Kobe City, Hyogo Real estate 3,071.60 1,560 1,028
Castalia Kotodaikoen 3-10-24, Kokubun-cho, Aoba Ward, Sendai City, Miyagi Real estate 1,684.10 580 397
Castalia Ichibancho 1-6-27, 1-6-30, Ichibancho, Aoba Ward, Sendai City, Miyagi Real estate 2,800.32 967 672
Castalia Omachi 2-5-8, Omachi, Aoba Ward, Sendai City, Miyagi Real estate 2,149.08 847 583
Castalia Uemachidai 4-1-12, Uehonmachi Nishi, Chuo Ward, Osaka City, Osaka Real estate 5,415.39 2,860 1,971
Castalia Tower Higobashi 1-2-24, Tosabori, Nishi Ward, Osaka City, Osaka Real estate 6,230.20 3,650 2,299
Big Tower Minami Sanjo 2-15-1, Minami Sanjo Higashi, Chuo Ward, Sapporo City, Hokkaido Real estate in trust 8,661.19 2,760 1,183
Castalia Fushimi 1-8-49, Nishiki, Naka Ward, Nagoya City, Aichi Real estate in trust 7,022.69 3,250 1,874
Castalia Meieki Minami 1-12-22, Meiekiminami, Nakamura Ward, Nagoya City, Aichi Real estate in trust 1,822.10 1,000 633
Castalia Yakuin 2-3-13, Imaizumi, Chuo Ward, Fukuoka City, Fukuoka Real estate 2,784.83 1,240 845
I. Asset Management Report
Asset class Property name Location (Note 1) Form of ownership
Leasable area (m2) (Note 2)
Assessed value at the
end of period (Yen in
millions) (Note 3)
Book value (Yen in
millions) (Note 4)
Res
iden
tial p
rope
rties
Castalia Mibu 79, Mibu Aiai-cho, Nakagyo Ward, Kyoto City, Kyoto Real estate in trust 2,828.39 1,550 1,054
Castalia Tsutsujigaoka 4-2-35, Shintera, Wakabayashi Ward, Sendai City, Miyagi Real estate in trust 4,471.11 1,850 1,125
Castalia Ohori Bay Tower 1-6-6, Minato, Chuo Ward, Fukuoka City, Fukuoka Real estate in trust 11,089.75 3,740 2,434
Royal Parks Namba 2-2-40, Minato machi, Naniwa Ward, Osaka City, Osaka Real estate in trust 10,354.15 2,950 2,384
Castalia Shigahondori 1-15-2, Wakabadori, Kita Ward, Nagoya City, Aichi Real estate in trust 5,086.69 2,200 1,513
Castalia Kyoto Nishioji 100-1, Shichijyo Goshonouchi Minamimachi, Shimogyo Ward, Kyoto City, Kyoto Real estate 2,035.37 1,100 974
Castalia Ningyocho III 1-2-3, Nihonbashi Ningyocho, Chuo Ward, Tokyo Real estate in trust 2,897.06 2,730 1,952 Royal Parks Umejima 5-25-33, Umeda, Adachi Ward, Tokyo Real estate in trust 6,828.78 2,170 1,878 Castalia Shinsakae II 1-29-21, Shinsakae, Naka Ward, Nagoya City, Aichi Real estate in trust 4,425.46 1,980 1,788
Residential properties – Subtotal 464,498.67 301,084 222,074
Ret
ail p
rope
rties
ACROSSMALL Shinkamagaya 2-12-1, Shin-Kamagaya, Kamagaya City, Chiba Real estate in trust 41,742.84 8,650 7,380 FOLEO Hirakata 1-20-10, Koyamichi, Hirakata City, Osaka Real estate in trust 16,390.96 4,670 4,395
QiZ GATE URAWA 3720, Aza Fudodani, Oaza Nakao, Midori Ward, Saitama City, Saitama Real estate in trust 9,720.49 4,450 4,129
UNICUS Takasaki 1150-5, Aza Nishikanai, Iizuka-machi, Takasaki City, Gunma Real estate in trust 9,277.08 3,220 2,905
ACROSSPLAZA Miyoshi (Land)
855-403, Aza Kitashinno, Oaza Fujikubo, Miyoshi-machi, Iruma District, Saitama Real estate in trust 24,018.00 3,960 3,740
DREAM TOWN ALi 3-1-1, Hamada, Aomori City, Aomori Real estate in trust 22,196.81 8,250 7,853
ASOBOX (Land) 2-2-16, Nakatsuguchi, Kokura Kita Ward, Kitakyushu City, Fukuoka Real estate in trust 11,207.90 1,960 1,617
FOLEO Ome Imai 3-10-9, Imai, Ome City, Tokyo Real estate in trust 8,637.91 3,940 3,702 FOLEO Otsu Ichiriyama 7-1-1, Ichiriyama, Otsu City, Shiga Real estate in trust 62,917.73 8,750 7,936
FOLEO Hakata 1-14-46, Higashinaka, Hakata Ward, Fukuoka City, Fukuoka Real estate in trust 23,230.77
(Note 5) 3,700 3,105
ACROSSMALL Semboku (Land)
5-456-67, Harayamadai, Minami Ward, Sakai City, Osaka Real estate in trust 30,824.72 3,870 3,383
iias Tsukuba 5-19, Kenkyugakuen, Tsukuba City, Ibaraki Real estate in trust 138,900.39 34,300 34,143
LIFE Sagamihara Wakamatsu 5-19-5, Wakamatsu, Minami Ward, Sagamihara City, Kanagawa Real estate in trust 2,973.44 1,850 1,643
FOLEO Sendai Miyanomori 4-14-5, Higashisendai, Miyagino Ward, Sendai City, Miyagi Real estate in trust 19,845.72 7,480 6,797
ACROSSPLAZA Inazawa (Land) 5-1-1, Otsuka Minami, Inazawa City, Aichi Real estate in trust 31,981.70 2,600 2,390
Sports Depo and GOLF5 Kokurahigashi IC Store
2-18-17, Kamikuzuhara, Kokuraminami Ward, Kitakyushu City, Fukuoka Real estate in trust 8,899.89 2,400 2,130
Hiratsuka Retail Property (Land) 1-2, Kuryozutsumi, Hiratsuka City, Kanagawa Real estate in trust 28,002.92 6,680 5,857
Royal Home Center Morinomiya (Land)
1-540-1, Tamatsukuri, Chuo Ward, Osaka City, Osaka Real estate in trust 6,669.74 5,280 4,541
Aoyama Tailor Bunkyo Sengoku Ekimae Store 2-29-21, Honkomagome, Bunkyo Ward, Tokyo Real estate in trust 1,066.95 770 767
FOLEO Shobu 6006-1, Aza Terada, Shobu, Shobucho, Kuki City, Saitama Real estate in trust 19,104.17 5,150 4,957
Hapias Kaita (Land) 2-1262-11, Une, Kaita-cho, Aki District, Hiroshima Real estate 13,415.52 1,520 1,471 COMBOX310 1-107-1, Miyamachi, Mito City, Ibaraki Real estate in trust 30,517.69 4,660 4,327
Sports Plaza Ibaraki 6-2, Eidai-cho, Ibaraki City, Osaka (Retail Building) 9-22, Eidai-cho, Ibaraki City, Osaka (Land of Parking Garage)
Real estate in trust 9,470.27 2,710 2,704
Retail properties – Subtotal 571,013.61 130,820 121,880
Hot
el p
rope
rties
Daiwa Roynet Hotel Yokohama Kannai
2-7-4, Hagoromocho, Naka Ward, Yokohama City, Kanagawa Real estate in trust 7,932.37 5,020 4,712
Super Hotel JR Nara Station Sanjo Street 500-1, Sanjo-cho, Nara City, Nara Real estate in trust 2,637.18 1,480 1,441
Daiwa Roynet Hotel Nagoya Shinkansenguchi
1-23, Tsubakicho, Nakamura Ward, Nagoya City, Aichi Real estate in trust 7,605.41 4,400 4,512
AGORA Kanazawa 2-25-17, Katamachi, Kanazawa City, Ishikawa Real estate in trust 7,011.58 5,290 5,134 Candeo Hotels Nagasaki Shinchi Chinatown 3-12 Doza-machi, Nagasaki City, Nagasaki Real estate in trust 6,770.65 3,190 3,138
Hotel properties – Subtotal 31,957.19 19,380 18,940
2928

I. Asset Management ReportI. Asset Management Report
Asset class Property name Location (Note 1) Form of ownership
Leasable area (m2) (Note 2)
Assessed value at the
end of period (Yen in
millions) (Note 3)
Book value (Yen in
millions) (Note 4)
Oth
er a
sset
s
Urban Living Inage 327-1, Sanno-cho, Inage Ward, Chiba City, Chiba Real estate in trust 4,177.52 1,280 810
Aburatsubo Marina HILLS 1523-1, Aza Shirasu, Misaki-machi Moroiso, Miura City, Kanagawa Real estate in trust 3,901.14 1,230 1,021
Naha Shin-Toshin Center Building (Daiwa Roynet Hotel Naha-Omoromachi)
1-1-12, Omoromachi, Naha City, Okinawa Real estate in trust 13,480.00 8,110 7,176
Sharp Hiroshima Building 2-13-4, Nishihara, Asaminami Ward, Hiroshima City, Hiroshima Real estate in trust 3,064.89 1,950 1,806
Nursery Room Berry Bear Omori Nishi Welcia Ota Omori Nishi Store
5-25-21, Omorinishi, Ota Ward, Tokyo Real estate in trust 1,345.60 1,380 1,385
GRANODE Hiroshima 3-5-7, Futabanosato, Higashi Ward, Hiroshima City, Hiroshima Real estate in trust 14,962.23 15,350 14,345
Other – Subtotal 40,931.38 29,300 26,547 Total 2,979,622.84 919,854 784,289
(Notes) 1. “Location” means displayed address of each real estate or each real estate in trust. If a property does not have a displayed address, the address of the building in the register (when there is more than one address, any of them) is shown. For land properties, the address of the land in the register is shown as location.
2. “Leasable area” means the leasable area of the building (or land in the case of land properties) in relation to each real estate or each real estate in trust and the figures stated refer to the area DHR believes is leasable as indicated in the relevant lease agreement or drawing of the building, etc. in relation to each real estate or each real estate in trust as of February 28, 2021. In the cases of each co-owned real estate or quasi co-owned trust beneficiary interests, the leasable area of the entire real estate multiplied by the ratio of co-ownership of the real estate or quasi co-ownership of the trust beneficiary interests in real estate held by DHR is provided.
3. “Assessed value at the end of period” is the appraisal value as of February 28, 2021 provided by real estate appraisers (Daiwa Real Estate Appraisal Co., Ltd., Chuo Real Estate Appraisal Co., Ltd., The Tanizawa Sōgō Appraisal Co., Ltd., Japan Real Estate Institute and JLL Morii Valuation & Advisory K.K.) in accordance with the Articles of Incorporation of DHR as well as “Regulations on Accounting of Investment Corporations.” The amounts are rounded down to the nearest million yen. There is no special interest between DHR and each real estate appraiser.
4. “Book value” is the amount recorded on the balance sheets as of February 28, 2021 (in the case of real estate and real estate in trust, “Book value” is the acquisition price (including expenses associated with the acquisition) less accumulated depreciation), which is rounded down to the nearest million yen.
5. Separately from the building of this property, a part of the land of this property is leased to the lessee for the purpose of subleasing to Fukuoka Prefecture and other third parties as land for a police station, etc. Therefore, the area of such leased land is not included in the leasable area.
I. Asset Management Report
The status of rental business related to each asset held by DHR is as follows:
Asset class Property name
29th period (From March 1, 2020 to August 31, 2020)
30th period (From September 1, 2020 to February 28, 2021)
Occupancy rate (as of the end of
period) (%) (Note 1)
Rental revenues (during the period)
(Yen in thousands)
Rate to total real estate rental
revenues (%) (Note 2)
Occupancy rate (as of the end of
period) (%) (Note 1)
Rental revenues (during the period)
(Yen in thousands)
Rate to total real estate rental
revenues (%) (Note 2)
Logi
stic
s pr
oper
ties
D Project Machida 100.0 (Note 3) (Note 3) 100.0 (Note 3) (Note 3) D Project Hachioji 100.0 (Note 3) (Note 3) 100.0 (Note 3) (Note 3) D Project Aikawa-Machi 100.0 (Note 3) (Note 3) 100.0 (Note 3) (Note 3) D Project Urayasu I 100.0 (Note 3) (Note 3) 100.0 (Note 3) (Note 3) D Project Urayasu II 100.0 (Note 3) (Note 3) 100.0 (Note 3) (Note 3) D Project Akanehama 100.0 (Note 3) (Note 3) 100.0 (Note 3) (Note 3) D Project Noda 100.0 (Note 3) (Note 3) 100.0 (Note 3) (Note 3) D Project Inuyama 100.0 (Note 3) (Note 3) 100.0 (Note 3) (Note 3) D Project Neyagawa 100.0 (Note 3) (Note 3) 100.0 (Note 3) (Note 3) D Project Morioka 100.0 (Note 3) (Note 3) 100.0 (Note 3) (Note 3) D Project Tsuchiura 100.0 (Note 3) (Note 3) 100.0 (Note 3) (Note 3) D Project Fukuoka Umi 100.0 129,293 0.5 100.0 129,912 0.5 D Project Tosu 100.0 (Note 3) (Note 3) 100.0 (Note 3) (Note 3) D Project Kuki I 100.0 (Note 3) (Note 3) 100.0 (Note 3) (Note 3) D Project Kuki II 100.0 (Note 3) (Note 3) 100.0 (Note 3) (Note 3) D Project Kawagoe I 100.0 102,933 0.4 100.0 102,933 0.4 D Project Kawagoe II 100.0 142,536 0.5 100.0 142,536 0.5 DPL Inuyama 100.0 (Note 3) (Note 3) 100.0 (Note 3) (Note 3) D Project Fukuoka Hakozaki 100.0 (Note 3) (Note 3) 100.0 (Note 3) (Note 3) D Project Kuki III 100.0 (Note 3) (Note 3) 100.0 (Note 3) (Note 3) D Project Kuki IV 100.0 (Note 3) (Note 3) 100.0 (Note 3) (Note 3) D Project Kuki V 100.0 (Note 3) (Note 3) 100.0 (Note 3) (Note 3) D Project Kuki VI 100.0 (Note 3) (Note 3) 100.0 (Note 3) (Note 3) D Project Yashio 100.0 (Note 3) (Note 3) 100.0 (Note 3) (Note 3) D Project Nishiyodogawa 100.0 (Note 3) (Note 3) 100.0 (Note 3) (Note 3) D Project Matsudo 100.0 (Note 3) (Note 3) 100.0 (Note 3) (Note 3) D Project Hibiki Nada 100.0 (Note 3) (Note 3) 100.0 (Note 3) (Note 3) D Project Morioka II 100.0 (Note 3) (Note 3) 100.0 (Note 3) (Note 3) D Project Kawagoe III 100.0 (Note 3) (Note 3) 100.0 (Note 3) (Note 3) D Project Kazo 100.0 (Note 3) (Note 3) 100.0 (Note 3) (Note 3) D Project Urayasu III 100.0 (Note 3) (Note 3) 100.0 (Note 3) (Note 3) D Project Tomisato 100.0 (Note 3) (Note 3) 100.0 (Note 3) (Note 3) D Project Kyotanabe 100.0 (Note 3) (Note 3) 100.0 (Note 3) (Note 3) D Project Sendai Izumi 100.0 (Note 3) (Note 3) 100.0 (Note 3) (Note 3) D Project Oyama 100.0 (Note 3) (Note 3) 100.0 (Note 3) (Note 3) D Project Sano 100.0 (Note 3) (Note 3) 100.0 (Note 3) (Note 3) D Project Tatebayashi 100.0 (Note 3) (Note 3) 100.0 (Note 3) (Note 3) D Project Kakegawa 100.0 (Note 3) (Note 3) 100.0 (Note 3) (Note 3) D Project Hiroshima Seifu 100.0 (Note 3) (Note 3) 100.0 (Note 3) (Note 3) D Project Tosu II 100.0 (Note 3) (Note 3) 100.0 (Note 3) (Note 3) D Project Kawagoe IV 100.0 161,023 0.6 100.0 161,023 0.6 D Project Kuki VII 100.0 (Note 3) (Note 3) 100.0 (Note 3) (Note 3) D Project Chibakita 100.0 (Note 3) (Note 3) 100.0 (Note 3) (Note 3) D Project Matsudo II 100.0 (Note 3) (Note 3) 100.0 (Note 3) (Note 3) D Project Tomisato II 100.0 (Note 3) (Note 3) 100.0 (Note 3) (Note 3) D Project Osaka Hirabayashi 100.0 (Note 3) (Note 3) 100.0 (Note 3) (Note 3) D Project Sendai Izumi II 100.0 (Note 3) (Note 3) 100.0 (Note 3) (Note 3) D Project Kaminokawa 100.0 (Note 3) (Note 3) 100.0 (Note 3) (Note 3)
3130
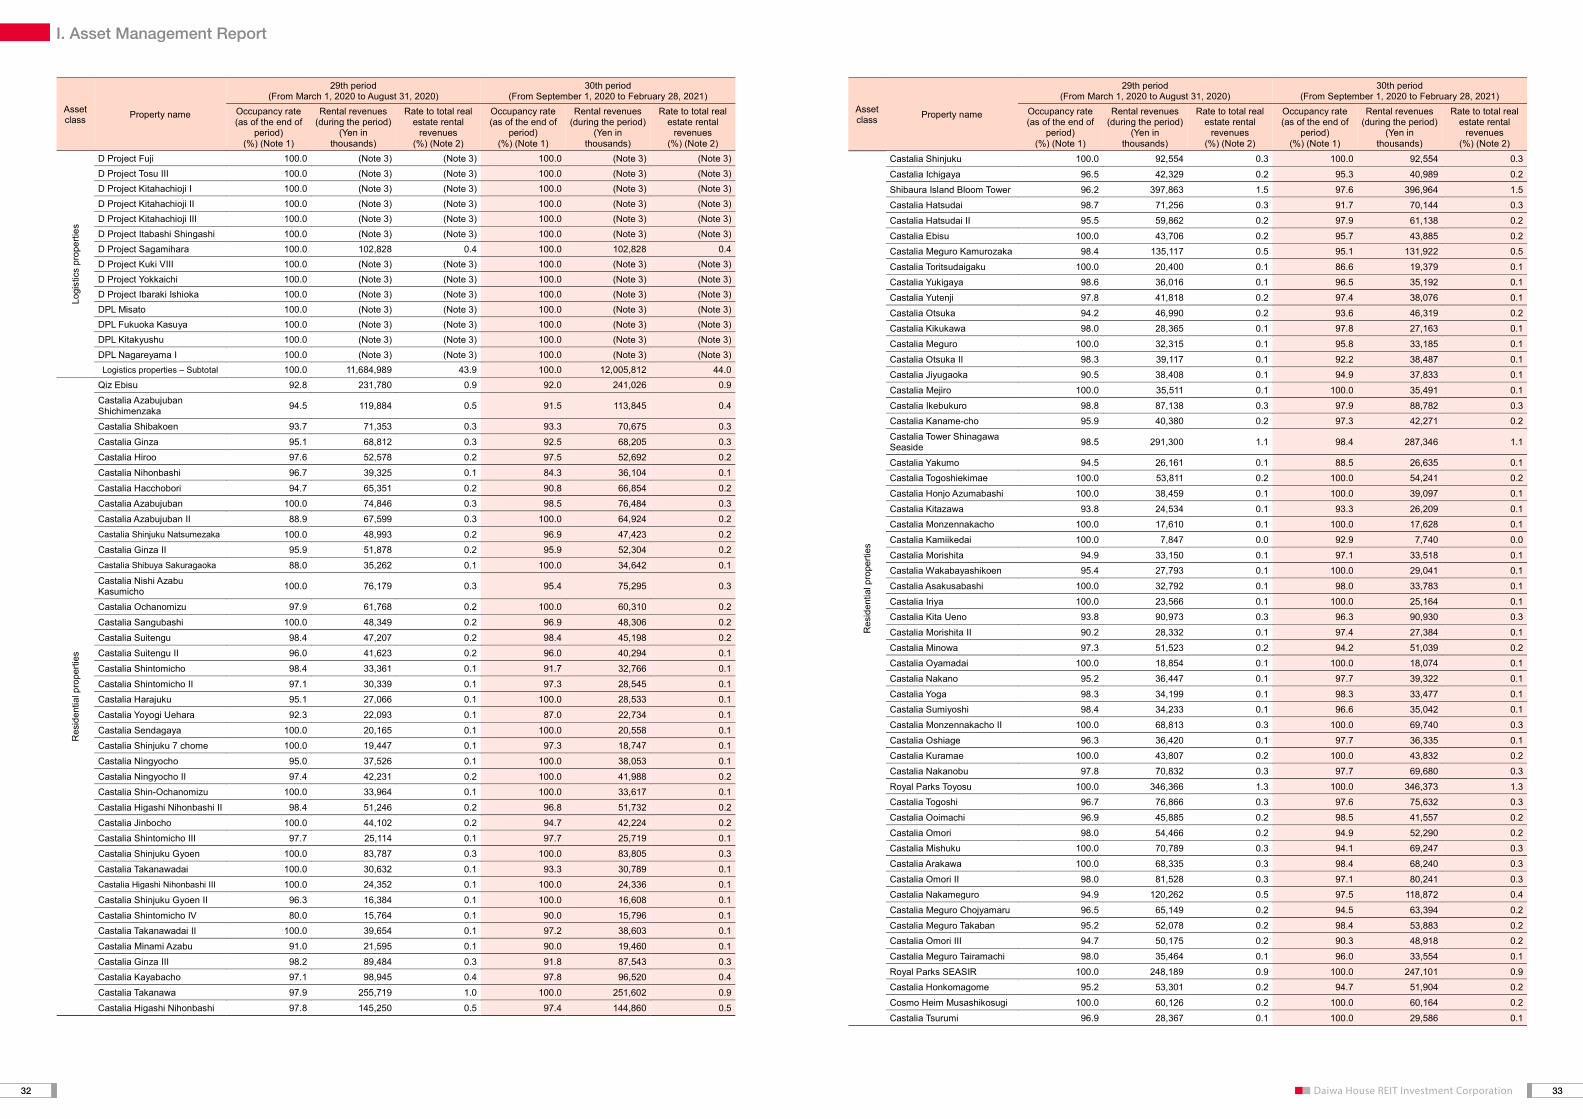
I. Asset Management ReportI. Asset Management Report
Asset class Property name
29th period (From March 1, 2020 to August 31, 2020)
30th period (From September 1, 2020 to February 28, 2021)
Occupancy rate (as of the end of
period) (%) (Note 1)
Rental revenues (during the period)
(Yen in thousands)
Rate to total real estate rental
revenues (%) (Note 2)
Occupancy rate (as of the end of
period) (%) (Note 1)
Rental revenues (during the period)
(Yen in thousands)
Rate to total real estate rental
revenues (%) (Note 2)
Logi
stic
s pr
oper
ties
D Project Fuji 100.0 (Note 3) (Note 3) 100.0 (Note 3) (Note 3) D Project Tosu III 100.0 (Note 3) (Note 3) 100.0 (Note 3) (Note 3) D Project Kitahachioji I 100.0 (Note 3) (Note 3) 100.0 (Note 3) (Note 3) D Project Kitahachioji II 100.0 (Note 3) (Note 3) 100.0 (Note 3) (Note 3) D Project Kitahachioji III 100.0 (Note 3) (Note 3) 100.0 (Note 3) (Note 3) D Project Itabashi Shingashi 100.0 (Note 3) (Note 3) 100.0 (Note 3) (Note 3) D Project Sagamihara 100.0 102,828 0.4 100.0 102,828 0.4 D Project Kuki VIII 100.0 (Note 3) (Note 3) 100.0 (Note 3) (Note 3) D Project Yokkaichi 100.0 (Note 3) (Note 3) 100.0 (Note 3) (Note 3) D Project Ibaraki Ishioka 100.0 (Note 3) (Note 3) 100.0 (Note 3) (Note 3) DPL Misato 100.0 (Note 3) (Note 3) 100.0 (Note 3) (Note 3) DPL Fukuoka Kasuya 100.0 (Note 3) (Note 3) 100.0 (Note 3) (Note 3) DPL Kitakyushu 100.0 (Note 3) (Note 3) 100.0 (Note 3) (Note 3) DPL Nagareyama I 100.0 (Note 3) (Note 3) 100.0 (Note 3) (Note 3) Logistics properties – Subtotal 100.0 11,684,989 43.9 100.0 12,005,812 44.0
Res
iden
tial p
rope
rties
Qiz Ebisu 92.8 231,780 0.9 92.0 241,026 0.9 Castalia Azabujuban Shichimenzaka 94.5 119,884 0.5 91.5 113,845 0.4
Castalia Shibakoen 93.7 71,353 0.3 93.3 70,675 0.3 Castalia Ginza 95.1 68,812 0.3 92.5 68,205 0.3 Castalia Hiroo 97.6 52,578 0.2 97.5 52,692 0.2 Castalia Nihonbashi 96.7 39,325 0.1 84.3 36,104 0.1 Castalia Hacchobori 94.7 65,351 0.2 90.8 66,854 0.2 Castalia Azabujuban 100.0 74,846 0.3 98.5 76,484 0.3 Castalia Azabujuban II 88.9 67,599 0.3 100.0 64,924 0.2 Castalia Shinjuku Natsumezaka 100.0 48,993 0.2 96.9 47,423 0.2 Castalia Ginza II 95.9 51,878 0.2 95.9 52,304 0.2 Castalia Shibuya Sakuragaoka 88.0 35,262 0.1 100.0 34,642 0.1 Castalia Nishi Azabu Kasumicho 100.0 76,179 0.3 95.4 75,295 0.3
Castalia Ochanomizu 97.9 61,768 0.2 100.0 60,310 0.2 Castalia Sangubashi 100.0 48,349 0.2 96.9 48,306 0.2 Castalia Suitengu 98.4 47,207 0.2 98.4 45,198 0.2 Castalia Suitengu II 96.0 41,623 0.2 96.0 40,294 0.1 Castalia Shintomicho 98.4 33,361 0.1 91.7 32,766 0.1 Castalia Shintomicho II 97.1 30,339 0.1 97.3 28,545 0.1 Castalia Harajuku 95.1 27,066 0.1 100.0 28,533 0.1 Castalia Yoyogi Uehara 92.3 22,093 0.1 87.0 22,734 0.1 Castalia Sendagaya 100.0 20,165 0.1 100.0 20,558 0.1 Castalia Shinjuku 7 chome 100.0 19,447 0.1 97.3 18,747 0.1 Castalia Ningyocho 95.0 37,526 0.1 100.0 38,053 0.1 Castalia Ningyocho II 97.4 42,231 0.2 100.0 41,988 0.2 Castalia Shin-Ochanomizu 100.0 33,964 0.1 100.0 33,617 0.1 Castalia Higashi Nihonbashi II 98.4 51,246 0.2 96.8 51,732 0.2 Castalia Jinbocho 100.0 44,102 0.2 94.7 42,224 0.2 Castalia Shintomicho III 97.7 25,114 0.1 97.7 25,719 0.1 Castalia Shinjuku Gyoen 100.0 83,787 0.3 100.0 83,805 0.3 Castalia Takanawadai 100.0 30,632 0.1 93.3 30,789 0.1 Castalia Higashi Nihonbashi III 100.0 24,352 0.1 100.0 24,336 0.1 Castalia Shinjuku Gyoen II 96.3 16,384 0.1 100.0 16,608 0.1 Castalia Shintomicho IV 80.0 15,764 0.1 90.0 15,796 0.1 Castalia Takanawadai II 100.0 39,654 0.1 97.2 38,603 0.1 Castalia Minami Azabu 91.0 21,595 0.1 90.0 19,460 0.1 Castalia Ginza III 98.2 89,484 0.3 91.8 87,543 0.3 Castalia Kayabacho 97.1 98,945 0.4 97.8 96,520 0.4 Castalia Takanawa 97.9 255,719 1.0 100.0 251,602 0.9 Castalia Higashi Nihonbashi 97.8 145,250 0.5 97.4 144,860 0.5
I. Asset Management Report
Asset class Property name
29th period (From March 1, 2020 to August 31, 2020)
30th period (From September 1, 2020 to February 28, 2021)
Occupancy rate (as of the end of
period) (%) (Note 1)
Rental revenues (during the period)
(Yen in thousands)
Rate to total real estate rental
revenues (%) (Note 2)
Occupancy rate (as of the end of
period) (%) (Note 1)
Rental revenues (during the period)
(Yen in thousands)
Rate to total real estate rental
revenues (%) (Note 2)
Res
iden
tial p
rope
rties
Castalia Shinjuku 100.0 92,554 0.3 100.0 92,554 0.3 Castalia Ichigaya 96.5 42,329 0.2 95.3 40,989 0.2 Shibaura Island Bloom Tower 96.2 397,863 1.5 97.6 396,964 1.5 Castalia Hatsudai 98.7 71,256 0.3 91.7 70,144 0.3 Castalia Hatsudai II 95.5 59,862 0.2 97.9 61,138 0.2 Castalia Ebisu 100.0 43,706 0.2 95.7 43,885 0.2 Castalia Meguro Kamurozaka 98.4 135,117 0.5 95.1 131,922 0.5 Castalia Toritsudaigaku 100.0 20,400 0.1 86.6 19,379 0.1 Castalia Yukigaya 98.6 36,016 0.1 96.5 35,192 0.1 Castalia Yutenji 97.8 41,818 0.2 97.4 38,076 0.1 Castalia Otsuka 94.2 46,990 0.2 93.6 46,319 0.2 Castalia Kikukawa 98.0 28,365 0.1 97.8 27,163 0.1 Castalia Meguro 100.0 32,315 0.1 95.8 33,185 0.1 Castalia Otsuka II 98.3 39,117 0.1 92.2 38,487 0.1 Castalia Jiyugaoka 90.5 38,408 0.1 94.9 37,833 0.1 Castalia Mejiro 100.0 35,511 0.1 100.0 35,491 0.1 Castalia Ikebukuro 98.8 87,138 0.3 97.9 88,782 0.3 Castalia Kaname-cho 95.9 40,380 0.2 97.3 42,271 0.2 Castalia Tower Shinagawa Seaside 98.5 291,300 1.1 98.4 287,346 1.1
Castalia Yakumo 94.5 26,161 0.1 88.5 26,635 0.1 Castalia Togoshiekimae 100.0 53,811 0.2 100.0 54,241 0.2 Castalia Honjo Azumabashi 100.0 38,459 0.1 100.0 39,097 0.1 Castalia Kitazawa 93.8 24,534 0.1 93.3 26,209 0.1 Castalia Monzennakacho 100.0 17,610 0.1 100.0 17,628 0.1 Castalia Kamiikedai 100.0 7,847 0.0 92.9 7,740 0.0 Castalia Morishita 94.9 33,150 0.1 97.1 33,518 0.1 Castalia Wakabayashikoen 95.4 27,793 0.1 100.0 29,041 0.1 Castalia Asakusabashi 100.0 32,792 0.1 98.0 33,783 0.1 Castalia Iriya 100.0 23,566 0.1 100.0 25,164 0.1 Castalia Kita Ueno 93.8 90,973 0.3 96.3 90,930 0.3 Castalia Morishita II 90.2 28,332 0.1 97.4 27,384 0.1 Castalia Minowa 97.3 51,523 0.2 94.2 51,039 0.2 Castalia Oyamadai 100.0 18,854 0.1 100.0 18,074 0.1 Castalia Nakano 95.2 36,447 0.1 97.7 39,322 0.1 Castalia Yoga 98.3 34,199 0.1 98.3 33,477 0.1 Castalia Sumiyoshi 98.4 34,233 0.1 96.6 35,042 0.1 Castalia Monzennakacho II 100.0 68,813 0.3 100.0 69,740 0.3 Castalia Oshiage 96.3 36,420 0.1 97.7 36,335 0.1 Castalia Kuramae 100.0 43,807 0.2 100.0 43,832 0.2 Castalia Nakanobu 97.8 70,832 0.3 97.7 69,680 0.3 Royal Parks Toyosu 100.0 346,366 1.3 100.0 346,373 1.3 Castalia Togoshi 96.7 76,866 0.3 97.6 75,632 0.3 Castalia Ooimachi 96.9 45,885 0.2 98.5 41,557 0.2 Castalia Omori 98.0 54,466 0.2 94.9 52,290 0.2 Castalia Mishuku 100.0 70,789 0.3 94.1 69,247 0.3 Castalia Arakawa 100.0 68,335 0.3 98.4 68,240 0.3 Castalia Omori II 98.0 81,528 0.3 97.1 80,241 0.3 Castalia Nakameguro 94.9 120,262 0.5 97.5 118,872 0.4 Castalia Meguro Chojyamaru 96.5 65,149 0.2 94.5 63,394 0.2 Castalia Meguro Takaban 95.2 52,078 0.2 98.4 53,883 0.2 Castalia Omori III 94.7 50,175 0.2 90.3 48,918 0.2 Castalia Meguro Tairamachi 98.0 35,464 0.1 96.0 33,554 0.1 Royal Parks SEASIR 100.0 248,189 0.9 100.0 247,101 0.9 Castalia Honkomagome 95.2 53,301 0.2 94.7 51,904 0.2 Cosmo Heim Musashikosugi 100.0 60,126 0.2 100.0 60,164 0.2 Castalia Tsurumi 96.9 28,367 0.1 100.0 29,586 0.1
3332

I. Asset Management ReportI. Asset Management Report
Asset class Property name
29th period (From March 1, 2020 to August 31, 2020)
30th period (From September 1, 2020 to February 28, 2021)
Occupancy rate (as of the end of
period) (%) (Note 1)
Rental revenues (during the period)
(Yen in thousands)
Rate to total real estate rental
revenues (%) (Note 2)
Occupancy rate (as of the end of
period) (%) (Note 1)
Rental revenues (during the period)
(Yen in thousands)
Rate to total real estate rental
revenues (%) (Note 2)
Res
iden
tial p
rope
rties
Castalia Funabashi 95.5 31,425 0.1 96.6 30,170 0.1 Castalia Nishi Funabashi 96.3 34,208 0.1 100.0 34,313 0.1 Castalia Nogeyama 100.0 14,176 0.1 93.3 13,895 0.1 Castalia Ichikawa 100.0 22,573 0.1 100.0 19,696 0.1 Royal Parks Hanakoganei 100.0 246,312 0.9 100.0 246,634 0.9 Castalia Musashikosugi 95.5 57,184 0.2 99.0 56,007 0.2 Royal Parks Wakabadai 100.0 258,894 1.0 100.0 259,347 1.0 Pacific Royal Court Minatomirai Urban Tower 100.0 522,693 2.0 100.0 529,485 1.9
L-Place Shinkoyasu 100.0 57,609 0.2 100.0 57,047 0.2 Royal Parks Musashikosugi 100.0 69,696 0.3 100.0 69,707 0.3 Castalia Sakaisuji Honmachi 97.3 62,928 0.2 99.1 61,859 0.2 Castalia Shin-Umeda 97.8 55,924 0.2 95.0 56,043 0.2
Castalia Abeno 96.4 180,674 0.7 97.0 176,912 0.6
Castalia Sakae 88.8 44,267 0.2 90.2 42,719 0.2 Castalia Maruyama Urasando (Note 4) 89.0 19,557 0.1 – 12,125 0.0
Castalia Maruyama Omotesando (Note 5) 93.8 74,526 0.3 – 62,275 0.2
Castalia Higashi Hie 96.4 44,062 0.2 99.2 43,491 0.2 Castalia Tower Nagahoribashi 90.7 162,911 0.6 99.4 160,953 0.6 Castalia Sannomiya 98.2 54,711 0.2 99.1 54,974 0.2 Castalia Kotodaikoen 97.6 24,221 0.1 95.2 23,139 0.1 Castalia Ichibancho 98.4 39,456 0.1 100.0 38,710 0.1 Castalia Omachi 97.2 33,770 0.1 88.9 32,377 0.1 Castalia Uemachidai 95.7 92,947 0.3 100.0 90,383 0.3 Castalia Tower Higobashi 95.2 128,653 0.5 98.2 130,455 0.5 Big Tower Minami Sanjo 96.4 112,643 0.4 96.4 108,642 0.4 Castalia Fushimi 95.7 104,503 0.4 94.5 104,446 0.4 Castalia Meieki Minami 89.0 32,477 0.1 94.2 30,865 0.1 Castalia Yakuin 99.2 42,884 0.2 99.2 43,127 0.2 Castalia Mibu 97.5 51,095 0.2 98.8 50,863 0.2 Castalia Tsutsujigaoka 98.1 58,235 0.2 97.4 58,910 0.2 Castalia Ohori Bay Tower 44.6 146,928 0.6 42.2 146,511 0.5 Royal Parks Namba 100.0 140,098 0.5 100.0 140,354 0.5 Castalia Shigahondori 95.9 74,731 0.3 98.6 74,492 0.3 Castalia Kyoto Nishioji 97.5 36,107 0.1 96.2 34,646 0.1 Castalia Ningyocho III 100.0 69,893 0.3 99.0 74,171 0.3 Royal Parks Umejima 100.0 103,357 0.4 100.0 102,987 0.4 Castalia Shinsakae II 100.0 60,399 0.2 100.0 60,032 0.2
Residential properties – Subtotal 96.4 9,615,747 36.1 96.5 9,538,535 35.0
Ret
ail p
rope
rties
ACROSSMALL Shinkamagaya 100.0 280,500 1.1 100.0 281,130 1.0 FOLEO Hirakata 92.8 252,038 0.9 93.4 254,995 0.9 QiZ GATE URAWA 100.0 215,879 0.8 100.0 212,631 0.8 UNICUS Takasaki 100.0 129,956 0.5 100.0 130,833 0.5 ACROSSPLAZA Miyoshi (Land) 100.0 94,284 0.4 100.0 94,284 0.3 DREAM TOWN ALi 100.0 356,774 1.3 100.0 359,961 1.3 ASOBOX (Land) 100.0 47,076 0.2 100.0 47,076 0.2 FOLEO Ome Imai 100.0 128,963 0.5 100.0 129,086 0.5 FOLEO Otsu Ichiriyama 100.0 325,748 1.2 100.0 324,572 1.2 FOLEO Hakata 100.0 126,818 0.5 100.0 126,216 0.5 ACROSSMALL Semboku (Land) 100.0 90,606 0.3 100.0 90,606 0.3
iias Tsukuba 100.0 950,305 3.6 100.0 1,075,786 3.9 LIFE Sagamihara Wakamatsu 100.0 (Note 3) (Note 3) 100.0 (Note 3) (Note 3) FOLEO Sendai Miyanomori 100.0 238,500 0.9 100.0 239,003 0.9 ACROSSPLAZA Inazawa (Land) 100.0 69,780 0.3 100.0 69,840 0.3
I. Asset Management Report
Asset class Property name
29th period (From March 1, 2020 to August 31, 2020)
30th period (From September 1, 2020 to February 28, 2021)
Occupancy rate (as of the end of
period) (%) (Note 1)
Rental revenues (during the period)
(Yen in thousands)
Rate to total real estate rental
revenues (%) (Note 2)
Occupancy rate (as of the end of
period) (%) (Note 1)
Rental revenues (during the period)
(Yen in thousands)
Rate to total real estate rental
revenues (%) (Note 2)
Ret
ail p
rope
rties
Sports Depo and GOLF5 Kokurahigashi IC Store 100.0 (Note 3) (Note 3) 100.0 (Note 3) (Note 3)
Hiratsuka Retail Property (Land) 100.0 (Note 3) (Note 3) 100.0 (Note 3) (Note 3) Royal Home Center Morinomiya (Land) 100.0 104,340 0.4 100.0 104,340 0.4
Aoyama Tailor Bunkyo Sengoku Ekimae Store 100.0 (Note 3) (Note 3) 100.0 (Note 3) (Note 3)
FOLEO Shobu 100.0 157,200 0.6 100.0 157,327 0.6 Hapias Kaita (Land) 100.0 38,400 0.1 100.0 38,424 0.1 COMBOX310 100.0 148,800 0.6 100.0 148,800 0.5 Sports Plaza Ibaraki 100.0 446 0.0 100.0 82,812 0.3
Retail properties – Subtotal 99.8 4,043,883 15.2 99.8 4,256,022 15.6
Hot
el p
rope
rties
Daiwa Roynet Hotel Yokohama Kannai 100.0 147,284 0.6 100.0 146,794 0.5
Super Hotel JR Nara Station Sanjo Street 100.0 46,112 0.2 100.0 43,855 0.2
Daiwa Roynet Hotel Nagoya Shinkansenguchi 100.0 126,000 0.5 100.0 126,000 0.5
AGORA Kanazawa 100.0 (Note 3) (Note 3) 100.0 (Note 3) (Note 3) Candeo Hotels Nagasaki Shinchi Chinatown – – – 100.0 87,435 0.3
Hotel properties – Subtotal 100.0 399,488 1.5 100.0 476,791 1.7
Oth
er a
sset
s
Urban Living Inage 100.0 39,060 0.1 100.0 39,060 0.1 Aburatsubo Marina HILLS 100.0 43,749 0.2 100.0 43,749 0.2 Naha Shin-Toshin Center Building (Daiwa Roynet Hotel Naha-Omoromachi)
100.0 309,502 1.2 100.0 315,099 1.2
Sharp Hiroshima Building 100.0 (Note 3) (Note 3) 100.0 (Note 3) (Note 3) Nursery Room Berry Bear Omori Nishi Welcia Ota Omori Nishi Store
100.0 (Note 3) (Note 3) 100.0 (Note 3) (Note 3)
GRANODE Hiroshima 98.5 383,511 1.4 99.5 491,537 1.8 Other – Subtotal 99.4 869,424 3.3 99.8 983,048 3.6
Total 99.4 26,613,533 100.0 99.4 27,260,211 100.0
(Notes) 1. “Occupancy rate (as of the end of period)” is the leased area expressed as a percentage of the leasable area of each real estate or each real estate in trust as of August 31, 2020 and February 28, 2021, rounded to the first decimal place.
2. “Rate to total real estate rental revenues” is the rental revenues from each real estate or each real estate in trust expressed as a percentage of total rental revenues from the entire portfolio, rounded to the first decimal place.
3. Undisclosed as consent for disclosure has not been obtained from the lessee. 4. The sale of property was completed on December 21, 2020. 5. The sale of property was completed on January 29, 2021.
(4) Description of Renewable Energy Power Generation Facilities, etc. Not applicable.
(5) Description of Operating Rights of Public Facilities, etc. Not applicable.
(6) Summary of Outstanding Contracted Amount and Fair Value of Specified Transactions The following summarizes contracted amount and fair value of specified transactions of DHR as of February 28, 2021.
Category Type Contracted amount (Yen in thousands) (Note 1) Fair value
(Yen in thousands) (Note 2) (Note 3) Portion due after one year
Transaction other than market transaction
Interest rate swap transaction Receipt: floating interest rate Payment: fixed interest rate
119,258,000 102,400,000 (828,747)
Total 119,258,000 102,400,000 (828,747) (Notes) 1. “Contracted amount” is based on the notional principal amount.
2. “Fair value” is quoted by counterparties based on the prevailing market interest rate. 3. With respect to fair value amounts, the transactions for which the special treatment for interest rate swap contracts under the accounting standard for financial instruments is applied
are not carried at fair value in the balance sheets.
3534
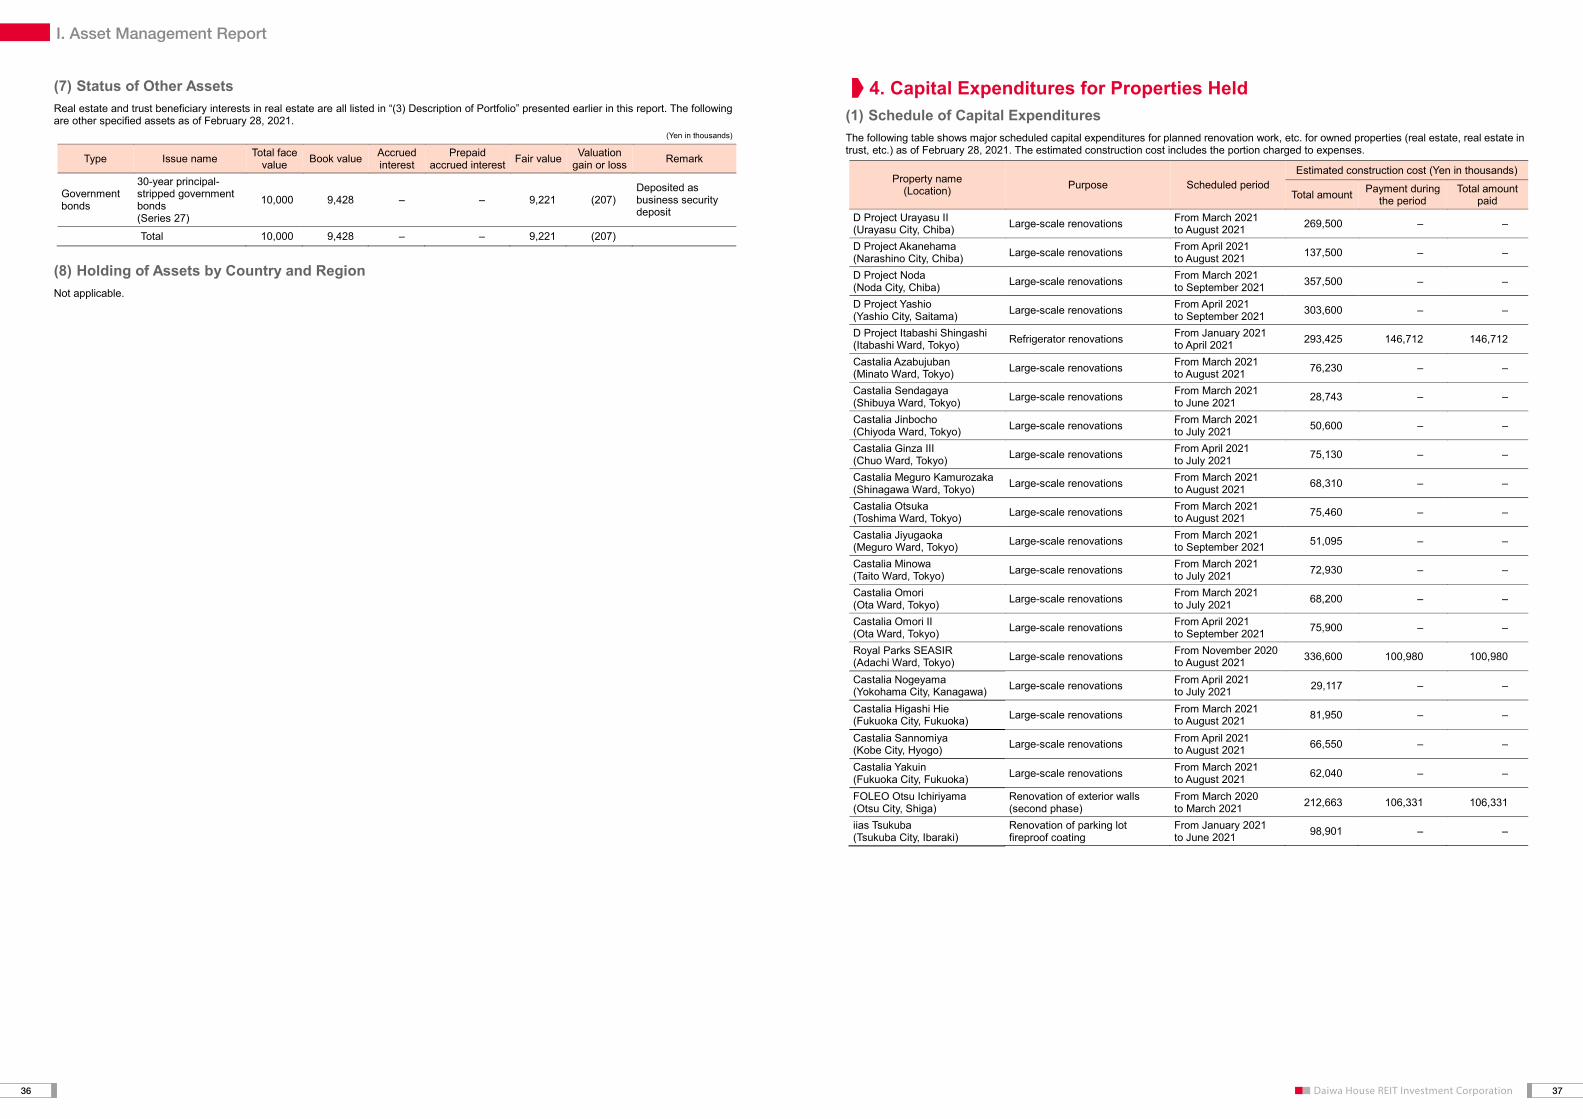
I. Asset Management ReportI. Asset Management Report
(7) Status of Other Assets Real estate and trust beneficiary interests in real estate are all listed in “(3) Description of Portfolio” presented earlier in this report. The following are other specified assets as of February 28, 2021.
(Yen in thousands)
Type Issue name Total face value Book value Accrued
interest Prepaid
accrued interest Fair value Valuation gain or loss Remark
Government bonds
30-year principal-stripped government bonds (Series 27)
10,000 9,428 – – 9,221 (207) Deposited as business security deposit
Total 10,000 9,428 – – 9,221 (207)
(8) Holding of Assets by Country and Region
Not applicable.
I. Asset Management Report
4. Capital Expenditures for Properties Held (1) Schedule of Capital Expenditures
The following table shows major scheduled capital expenditures for planned renovation work, etc. for owned properties (real estate, real estate in trust, etc.) as of February 28, 2021. The estimated construction cost includes the portion charged to expenses.
Property name (Location) Purpose Scheduled period
Estimated construction cost (Yen in thousands)
Total amount Payment during the period
Total amount paid
D Project Urayasu II (Urayasu City, Chiba) Large-scale renovations From March 2021
to August 2021 269,500 – –
D Project Akanehama (Narashino City, Chiba) Large-scale renovations From April 2021
to August 2021 137,500 – –
D Project Noda (Noda City, Chiba) Large-scale renovations From March 2021
to September 2021 357,500 – –
D Project Yashio (Yashio City, Saitama) Large-scale renovations From April 2021
to September 2021 303,600 – –
D Project Itabashi Shingashi (Itabashi Ward, Tokyo) Refrigerator renovations From January 2021
to April 2021 293,425 146,712 146,712
Castalia Azabujuban (Minato Ward, Tokyo) Large-scale renovations From March 2021
to August 2021 76,230 – –
Castalia Sendagaya (Shibuya Ward, Tokyo) Large-scale renovations From March 2021
to June 2021 28,743 – –
Castalia Jinbocho (Chiyoda Ward, Tokyo) Large-scale renovations From March 2021
to July 2021 50,600 – –
Castalia Ginza III (Chuo Ward, Tokyo) Large-scale renovations From April 2021
to July 2021 75,130 – –
Castalia Meguro Kamurozaka (Shinagawa Ward, Tokyo) Large-scale renovations From March 2021
to August 2021 68,310 – –
Castalia Otsuka (Toshima Ward, Tokyo) Large-scale renovations From March 2021
to August 2021 75,460 – –
Castalia Jiyugaoka (Meguro Ward, Tokyo) Large-scale renovations From March 2021
to September 2021 51,095 – –
Castalia Minowa (Taito Ward, Tokyo) Large-scale renovations From March 2021
to July 2021 72,930 – –
Castalia Omori (Ota Ward, Tokyo) Large-scale renovations From March 2021
to July 2021 68,200 – –
Castalia Omori II (Ota Ward, Tokyo) Large-scale renovations From April 2021
to September 2021 75,900 – –
Royal Parks SEASIR (Adachi Ward, Tokyo) Large-scale renovations From November 2020
to August 2021 336,600 100,980 100,980
Castalia Nogeyama (Yokohama City, Kanagawa) Large-scale renovations From April 2021
to July 2021 29,117 – –
Castalia Higashi Hie (Fukuoka City, Fukuoka) Large-scale renovations From March 2021
to August 2021 81,950 – –
Castalia Sannomiya (Kobe City, Hyogo) Large-scale renovations From April 2021
to August 2021 66,550 – –
Castalia Yakuin (Fukuoka City, Fukuoka) Large-scale renovations From March 2021
to August 2021 62,040 – –
FOLEO Otsu Ichiriyama (Otsu City, Shiga)
Renovation of exterior walls (second phase)
From March 2020 to March 2021 212,663 106,331 106,331
iias Tsukuba (Tsukuba City, Ibaraki)
Renovation of parking lot fireproof coating
From January 2021 to June 2021 98,901 – –
4. Capital Expenditures for Properties Held
3736
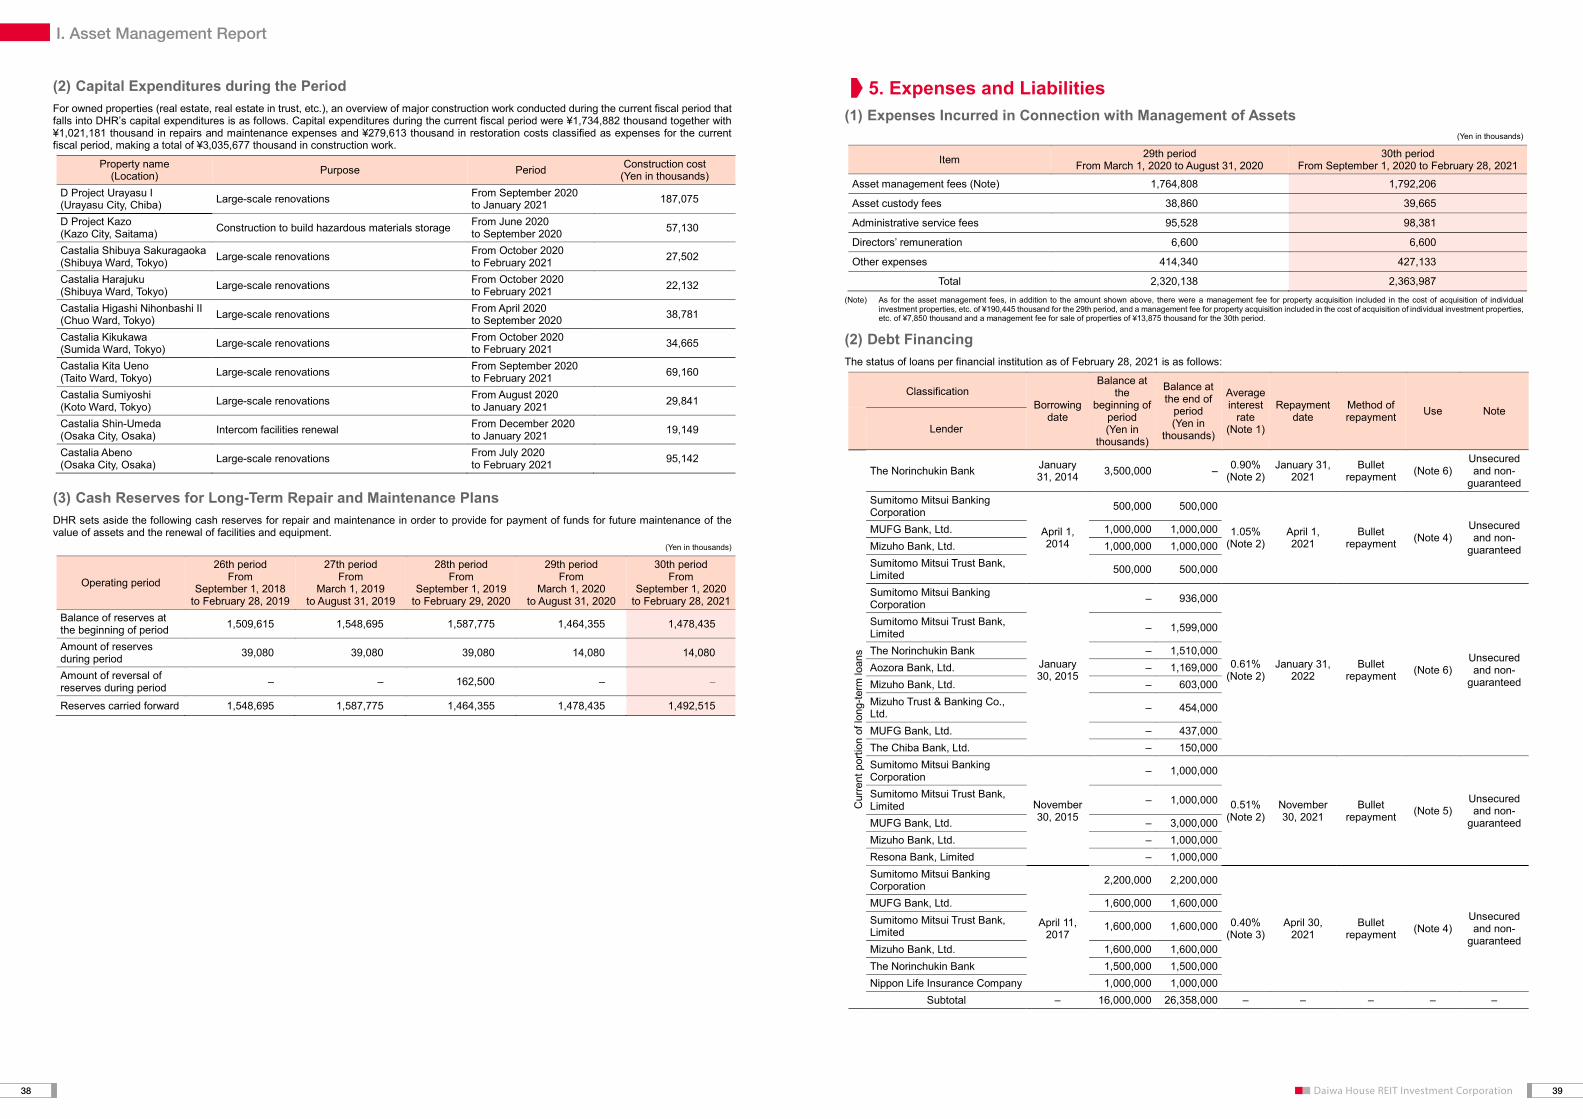
I. Asset Management ReportI. Asset Management Report
(2) Capital Expenditures during the Period For owned properties (real estate, real estate in trust, etc.), an overview of major construction work conducted during the current fiscal period that falls into DHR’s capital expenditures is as follows. Capital expenditures during the current fiscal period were ¥1,734,882 thousand together with ¥1,021,181 thousand in repairs and maintenance expenses and ¥279,613 thousand in restoration costs classified as expenses for the current fiscal period, making a total of ¥3,035,677 thousand in construction work.
Property name (Location) Purpose Period Construction cost
(Yen in thousands) D Project Urayasu I (Urayasu City, Chiba) Large-scale renovations From September 2020
to January 2021 187,075
D Project Kazo (Kazo City, Saitama) Construction to build hazardous materials storage From June 2020
to September 2020 57,130
Castalia Shibuya Sakuragaoka (Shibuya Ward, Tokyo) Large-scale renovations From October 2020
to February 2021 27,502
Castalia Harajuku (Shibuya Ward, Tokyo) Large-scale renovations From October 2020
to February 2021 22,132
Castalia Higashi Nihonbashi II (Chuo Ward, Tokyo) Large-scale renovations From April 2020
to September 2020 38,781
Castalia Kikukawa (Sumida Ward, Tokyo) Large-scale renovations From October 2020
to February 2021 34,665
Castalia Kita Ueno (Taito Ward, Tokyo) Large-scale renovations From September 2020
to February 2021 69,160
Castalia Sumiyoshi (Koto Ward, Tokyo) Large-scale renovations From August 2020
to January 2021 29,841
Castalia Shin-Umeda (Osaka City, Osaka) Intercom facilities renewal From December 2020
to January 2021 19,149
Castalia Abeno (Osaka City, Osaka) Large-scale renovations From July 2020
to February 2021 95,142
(3) Cash Reserves for Long-Term Repair and Maintenance Plans DHR sets aside the following cash reserves for repair and maintenance in order to provide for payment of funds for future maintenance of the value of assets and the renewal of facilities and equipment.
(Yen in thousands)
Operating period
26th period From
September 1, 2018 to February 28, 2019
27th period From
March 1, 2019 to August 31, 2019
28th period From
September 1, 2019 to February 29, 2020
29th period From
March 1, 2020 to August 31, 2020
30th period From
September 1, 2020 to February 28, 2021
Balance of reserves at the beginning of period 1,509,615 1,548,695 1,587,775 1,464,355 1,478,435
Amount of reserves during period 39,080 39,080 39,080 14,080 14,080
Amount of reversal of reserves during period – – 162,500 – –
Reserves carried forward 1,548,695 1,587,775 1,464,355 1,478,435 1,492,515
I. Asset Management Report
5. Expenses and Liabilities (1) Expenses Incurred in Connection with Management of Assets
(Yen in thousands)
Item 29th period From March 1, 2020 to August 31, 2020
30th period From September 1, 2020 to February 28, 2021
Asset management fees (Note) 1,764,808 1,792,206
Asset custody fees 38,860 39,665
Administrative service fees 95,528 98,381
Directors’ remuneration 6,600 6,600
Other expenses 414,340 427,133
Total 2,320,138 2,363,987 (Note) As for the asset management fees, in addition to the amount shown above, there were a management fee for property acquisition included in the cost of acquisition of individual
investment properties, etc. of ¥190,445 thousand for the 29th period, and a management fee for property acquisition included in the cost of acquisition of individual investment properties, etc. of ¥7,850 thousand and a management fee for sale of properties of ¥13,875 thousand for the 30th period.
(2) Debt Financing
The status of loans per financial institution as of February 28, 2021 is as follows:
Classification Borrowing
date
Balance at the
beginning of period (Yen in
thousands)
Balance at the end of
period (Yen in
thousands)
Average interest
rate (Note 1)
Repayment date
Method of repayment Use Note
Lender
Cur
rent
por
tion
of lo
ng-te
rm lo
ans
The Norinchukin Bank January 31, 2014 3,500,000 – 0.90%
(Note 2) January 31,
2021 Bullet
repayment (Note 6) Unsecured and non-
guaranteed Sumitomo Mitsui Banking Corporation
April 1, 2014
500,000 500,000
1.05% (Note 2)
April 1, 2021
Bullet repayment (Note 4)
Unsecured and non-
guaranteed
MUFG Bank, Ltd. 1,000,000 1,000,000 Mizuho Bank, Ltd. 1,000,000 1,000,000 Sumitomo Mitsui Trust Bank, Limited 500,000 500,000
Sumitomo Mitsui Banking Corporation
January 30, 2015
– 936,000
0.61% (Note 2)
January 31, 2022
Bullet repayment (Note 6)
Unsecured and non-
guaranteed
Sumitomo Mitsui Trust Bank, Limited – 1,599,000
The Norinchukin Bank – 1,510,000 Aozora Bank, Ltd. – 1,169,000 Mizuho Bank, Ltd. – 603,000 Mizuho Trust & Banking Co., Ltd. – 454,000
MUFG Bank, Ltd. – 437,000 The Chiba Bank, Ltd. – 150,000 Sumitomo Mitsui Banking Corporation
November 30, 2015
– 1,000,000
0.51% (Note 2)
November 30, 2021
Bullet repayment (Note 5)
Unsecured and non-
guaranteed
Sumitomo Mitsui Trust Bank, Limited – 1,000,000
MUFG Bank, Ltd. – 3,000,000 Mizuho Bank, Ltd. – 1,000,000 Resona Bank, Limited – 1,000,000 Sumitomo Mitsui Banking Corporation
April 11, 2017
2,200,000 2,200,000
0.40% (Note 3)
April 30, 2021
Bullet repayment (Note 4)
Unsecured and non-
guaranteed
MUFG Bank, Ltd. 1,600,000 1,600,000 Sumitomo Mitsui Trust Bank, Limited 1,600,000 1,600,000
Mizuho Bank, Ltd. 1,600,000 1,600,000 The Norinchukin Bank 1,500,000 1,500,000 Nippon Life Insurance Company 1,000,000 1,000,000
Subtotal – 16,000,000 26,358,000 – – – – –
5. Expenses and Liabilities
3938

I. Asset Management ReportI. Asset Management Report
Classification Borrowing
date
Balance at the
beginning of period (Yen in
thousands)
Balance at the end of
period (Yen in
thousands)
Average interest
rate (Note 1)
Repayment date
Method of repayment Use Note
Lender
Long
-term
loan
s
Sumitomo Mitsui Trust Bank, Limited
March 27, 2013 2,000,000 2,000,000 1.50%
(Note 2) March 27,
2023 Bullet
repayment (Note 4) Unsecured and non-
guaranteed Sumitomo Mitsui Banking Corporation
April 1, 2014
1,000,000 1,000,000
1.21% (Note 2)
April 1, 2022
Bullet repayment (Note 4)
Unsecured and non-
guaranteed
MUFG Bank, Ltd. 1,000,000 1,000,000 Mizuho Bank, Ltd. 1,000,000 1,000,000 Sumitomo Mitsui Trust Bank, Limited 500,000 500,000
Sumitomo Mitsui Banking Corporation
April 1, 2014
1,000,000 1,000,000
1.52% (Note 2)
April 1, 2024
Bullet repayment (Note 4)
Unsecured and non-
guaranteed
MUFG Bank, Ltd. 1,000,000 1,000,000 Sumitomo Mitsui Trust Bank, Limited 500,000 500,000
Development Bank of Japan Inc. 500,000 500,000
Sumitomo Mitsui Banking Corporation
April 1, 2014
500,000 500,000
2.03% (Note 2)
April 1, 2026
Bullet repayment (Note 4)
Unsecured and non-
guaranteed
MUFG Bank, Ltd. 500,000 500,000 Sumitomo Mitsui Trust Bank, Limited 500,000 500,000
Development Bank of Japan Inc. 500,000 500,000
Nippon Life Insurance Company September 30, 2014 1,000,000 1,000,000 1.00%
(Note 3) September 29, 2023
Bullet repayment (Note 4)
Unsecured and non-
guaranteed Sumitomo Mitsui Banking Corporation
January 30, 2015
936,000 –
0.61% (Note 2)
January 31, 2022
Bullet repayment (Note 6)
Unsecured and non-
guaranteed
Sumitomo Mitsui Trust Bank, Limited 1,599,000 –
The Norinchukin Bank 1,510,000 – Aozora Bank, Ltd. 1,169,000 – Mizuho Bank, Ltd. 603,000 – Mizuho Trust & Banking Co., Ltd. 454,000 –
MUFG Bank, Ltd. 437,000 – The Chiba Bank, Ltd. 150,000 –
Development Bank of Japan Inc.
January 30, 2015 2,000,000 2,000,000 0.88%
(Note 3) January 31,
2024 Bullet
repayment (Note 6) Unsecured and non-
guaranteed Sumitomo Mitsui Banking Corporation April 1,
2015
1,000,000 1,000,000 0.87%
(Note 2) October 3,
2022 Bullet
repayment (Note 4) Unsecured and non-
guaranteed Mizuho Bank, Ltd. 1,000,000 1,000,000 The Norinchukin Bank 1,000,000 1,000,000 Sumitomo Mitsui Banking Corporation
April 1, 2015
1,000,000 1,000,000
0.99% (Note 2)
October 2, 2023
Bullet repayment (Note 4)
Unsecured and non-
guaranteed
Sumitomo Mitsui Trust Bank, Limited 1,000,000 1,000,000
Mizuho Bank, Ltd. 1,000,000 1,000,000 Resona Bank, Limited 1,000,000 1,000,000 Sumitomo Mitsui Banking Corporation
April 1, 2015
1,000,000 1,000,000
1.23% (Note 2)
October 1, 2025
Bullet repayment (Note 4)
Unsecured and non-
guaranteed
Sumitomo Mitsui Trust Bank, Limited 1,000,000 1,000,000
MUFG Bank, Ltd. 1,000,000 1,000,000 Mizuho Bank, Ltd. 1,000,000 1,000,000
I. Asset Management Report
Classification Borrowing
date
Balance at the
beginning of period (Yen in
thousands)
Balance at the end of
period (Yen in
thousands)
Average interest
rate (Note 1)
Repayment date
Method of repayment Use Note
Lender
Long
-term
loan
s
MUFG Bank, Ltd. April 1, 2015 3,000,000 3,000,000 1.18%
(Note 3) October 1,
2025 Bullet
repayment (Note 4) Unsecured and non-
guaranteed
Development Bank of Japan Inc.
April 1, 2015 1,500,000 1,500,000 1.46%
(Note 3) April 1, 2027
Bullet repayment (Note 4)
Unsecured and non-
guaranteed Sumitomo Mitsui Trust Bank, Limited
May 1, 2015
2,030,000 2,030,000
0.66% (Note 2)
April 28, 2022
Bullet repayment (Note 4)
Unsecured and non-
guaranteed
Sumitomo Mitsui Banking Corporation 1,354,500 1,354,500
The Norinchukin Bank 1,600,000 1,600,000 Aozora Bank, Ltd. 1,192,000 1,192,000 Mizuho Bank, Ltd. 1,017,000 1,017,000 MUFG Bank, Ltd. 907,500 907,500 Mizuho Trust & Banking Co., Ltd. 524,000 524,000
Nippon Life Insurance Company 500,000 500,000 Development Bank of Japan Inc. 400,000 400,000
The Shizuoka Bank, Ltd. 260,000 260,000 The Chiba Bank, Ltd. 215,000 215,000 Sumitomo Mitsui Trust Bank, Limited
September 28, 2015
1,000,000 1,000,000
0.65% (Note 2)
September 28, 2022
Bullet repayment (Note 4)
Unsecured and non-
guaranteed
MUFG Bank, Ltd. 1,000,000 1,000,000 Sumitomo Mitsui Banking Corporation 1,000,000 1,000,000
Mizuho Bank, Ltd. 1,000,000 1,000,000
Nippon Life Insurance Company September 28, 2015 1,000,000 1,000,000 0.73%
(Note 3) September 30, 2024
Bullet repayment (Note 4)
Unsecured and non-
guaranteed Sumitomo Mitsui Banking Corporation
November 30, 2015
1,000,000 –
0.51% (Note 2)
November 30, 2021
Bullet repayment (Note 5)
Unsecured and non-
guaranteed
Sumitomo Mitsui Trust Bank, Limited 1,000,000 –
MUFG Bank, Ltd. 3,000,000 – Mizuho Bank, Ltd. 1,000,000 – Resona Bank, Limited 1,000,000 – Sumitomo Mitsui Banking Corporation
November 30, 2015
1,000,000 1,000,000
0.71% (Note 2)
May 31, 2023
Bullet repayment (Note 5)
Unsecured and non-
guaranteed
MUFG Bank, Ltd. 1,000,000 1,000,000 Sumitomo Mitsui Trust Bank, Limited 1,000,000 1,000,000
Mizuho Bank, Ltd. 1,000,000 1,000,000 Sumitomo Mitsui Banking Corporation
November 30, 2015
1,000,000 1,000,000
0.97% (Note 2)
May 30, 2025
Bullet repayment (Note 5)
Unsecured and non-
guaranteed
MUFG Bank, Ltd. 1,000,000 1,000,000 Sumitomo Mitsui Trust Bank, Limited 1,000,000 1,000,000
Mizuho Bank, Ltd. 1,000,000 1,000,000 Sumitomo Mitsui Banking Corporation
November 30, 2015
1,000,000 1,000,000
1.09% (Note 2)
May 29, 2026
Bullet repayment (Note 5)
Unsecured and non-
guaranteed
MUFG Bank, Ltd. 1,000,000 1,000,000 Sumitomo Mitsui Trust Bank, Limited 1,000,000 1,000,000
Mizuho Bank, Ltd. 1,000,000 1,000,000
4140

I. Asset Management ReportI. Asset Management Report
Classification Borrowing
date
Balance at the
beginning of period (Yen in
thousands)
Balance at the end of
period (Yen in
thousands)
Average interest
rate (Note 1)
Repayment date
Method of repayment Use Note
Lender
Long
-term
loan
s
Sumitomo Mitsui Banking Corporation
December 28, 2015
1,800,000 1,800,000
0.59% (Note 2)
December 28, 2022
Bullet repayment (Note 5)
Unsecured and non-
guaranteed
MUFG Bank, Ltd. 3,200,000 3,200,000 Sumitomo Mitsui Trust Bank, Limited 1,800,000 1,800,000
Mizuho Bank, Ltd. 1,800,000 1,800,000 Resona Bank, Limited 1,400,000 1,400,000 Shinsei Bank, Limited 500,000 500,000 Sumitomo Mitsui Banking Corporation
September 28, 2016
1,500,000 1,500,000
0.63% (Note 3)
September 29, 2025
Bullet repayment (Note 4)
Unsecured and non-
guaranteed
Sumitomo Mitsui Trust Bank, Limited 1,500,000 1,500,000
MUFG Bank, Ltd. 2,000,000 2,000,000 Mizuho Bank, Ltd. 1,500,000 1,500,000 Resona Bank, Limited 500,000 500,000 Mizuho Trust & Banking Co., Ltd. 500,000 500,000
Shinsei Bank, Limited 500,000 500,000 Shinkin Central Bank 500,000 500,000 The Bank of Fukuoka, Ltd. 500,000 500,000
Development Bank of Japan Inc.
September 28, 2016 1,000,000 1,000,000 0.69%
(Note 3) September 28, 2026
Bullet repayment (Note 4)
Unsecured and non-
guaranteed Sumitomo Mitsui Banking Corporation
September 30, 2016
1,700,000 1,700,000
0.41% (Note 3)
March 31, 2023
Bullet repayment (Note 5)
Unsecured and non-
guaranteed
MUFG Bank, Ltd. 2,700,000 2,700,000 Sumitomo Mitsui Trust Bank, Limited 1,700,000 1,700,000
Mizuho Bank, Ltd. 1,700,000 1,700,000 Aozora Bank, Ltd. 1,500,000 1,500,000 Resona Bank, Limited 800,000 800,000 Shinsei Bank, Limited 300,000 300,000 MUFG Bank, Ltd.
September 30, 2016
2,800,000 2,800,000
0.48% (Note 3)
March 29, 2024
Bullet repayment (Note 5)
Unsecured and non-
guaranteed
Sumitomo Mitsui Trust Bank, Limited 1,800,000 1,800,000
Sumitomo Mitsui Banking Corporation 1,800,000 1,800,000
Mizuho Bank, Ltd. 1,800,000 1,800,000 Aozora Bank, Ltd. 1,500,000 1,500,000 Resona Bank, Limited 900,000 900,000 Shinsei Bank, Limited 400,000 400,000 Sumitomo Mitsui Banking Corporation
November 29, 2016
3,000,000 3,000,000
0.87% (Note 3)
November 30, 2026
Bullet repayment (Note 5)
Unsecured and non-
guaranteed
Mizuho Bank, Ltd. 3,000,000 3,000,000 MUFG Bank, Ltd. 5,000,000 5,000,000 Sumitomo Mitsui Trust Bank, Limited 3,000,000 3,000,000
Resona Bank, Limited 1,000,000 1,000,000
Development Bank of Japan Inc.
March 9, 2017 2,000,000 2,000,000 0.85%
(Note 3) March 31,
2027 Bullet
repayment (Note 7) Unsecured and non-
guaranteed
Mitsui Sumitomo Insurance Company, Limited
March 9, 2017 1,000,000 1,000,000 0.55%
(Note 3) March 29,
2024 Bullet
repayment (Note 7) Unsecured and non-
guaranteed
I. Asset Management Report
Classification Borrowing
date
Balance at the
beginning of period (Yen in
thousands)
Balance at the end of
period (Yen in
thousands)
Average interest
rate (Note 1)
Repayment date
Method of repayment Use Note
Lender
Long
-term
loan
s
Mizuho Bank, Ltd.
March 31, 2017
4,000,000 4,000,000
0.57% (Note 3)
September 29, 2023
Bullet repayment (Note 5)
Unsecured and non-
guaranteed
Sumitomo Mitsui Trust Bank, Limited 4,000,000 4,000,000
MUFG Bank, Ltd. 1,000,000 1,000,000 Mizuho Trust & Banking Co., Ltd. 1,000,000 1,000,000
Sumitomo Mitsui Banking Corporation
March 31, 2017
4,000,000 4,000,000
0.70% (Note 3)
March 31, 2025
Bullet repayment (Note 5)
Unsecured and non-
guaranteed
Aozora Bank, Ltd. 2,500,000 2,500,000 Shinkin Central Bank 2,000,000 2,000,000 MUFG Bank, Ltd. 1,500,000 1,500,000 Resona Bank, Limited 1,000,000 1,000,000 Sumitomo Mitsui Banking Corporation
April 11, 2017
1,800,000 1,800,000
0.76% (Note 3)
April 30, 2026
Bullet repayment (Note 4)
Unsecured and non-
guaranteed
MUFG Bank, Ltd. 2,200,000 2,200,000 Mizuho Bank, Ltd. 1,200,000 1,200,000 Resona Bank, Limited 1,100,000 1,100,000 Mizuho Trust & Banking Co., Ltd. 1,000,000 1,000,000
Shinsei Bank, Limited 1,000,000 1,000,000 The Bank of Fukuoka, Ltd. 1,000,000 1,000,000 Sumitomo Mitsui Trust Bank, Limited 700,000 700,000
Sumitomo Mitsui Banking Corporation
April 11, 2017
2,100,000 2,100,000
1.02% (Note 3)
April 28, 2028
Bullet repayment (Note 4)
Unsecured and non-
guaranteed
MUFG Bank, Ltd. 3,700,000 3,700,000 Sumitomo Mitsui Trust Bank, Limited 1,800,000 1,800,000
Mizuho Bank, Ltd. 1,800,000 1,800,000 Mizuho Trust & Banking Co., Ltd. 600,000 600,000
Sumitomo Mitsui Trust Bank, Limited
July 31, 2017
3,400,000 3,400,000
0.89% (Note 3)
July 30, 2027
Bullet repayment (Note 5)
Unsecured and non-
guaranteed
Sumitomo Mitsui Banking Corporation 3,400,000 3,400,000
Mizuho Bank, Ltd. 3,400,000 3,400,000 MUFG Bank, Ltd. 1,900,000 1,900,000 Sumitomo Mitsui Banking Corporation
November 29, 2017
2,500,000 2,500,000
0.90% (Note 3)
November 30, 2027
Bullet repayment (Note 5)
Unsecured and non-
guaranteed
MUFG Bank, Ltd. 2,000,000 2,000,000 Development Bank of Japan Inc. 3,000,000 3,000,000
Sumitomo Mitsui Trust Bank, Limited 2,500,000 2,500,000
Mizuho Bank, Ltd. 2,500,000 2,500,000 The 77 Bank, Ltd. 1,000,000 1,000,000 The Nishi-Nippon City Bank, Ltd. 1,000,000 1,000,000
The Iyo Bank, Ltd. 500,000 500,000 The Bank of Kyoto, Ltd. 500,000 500,000 The Chugoku Bank, Limited 500,000 500,000
Mitsui Sumitomo Insurance Company, Limited
March 27, 2018 1,000,000 1,000,000 0.44%
(Note 3) March 31,
2023 Bullet
repayment (Note 4) Unsecured and non-
guaranteed
4342
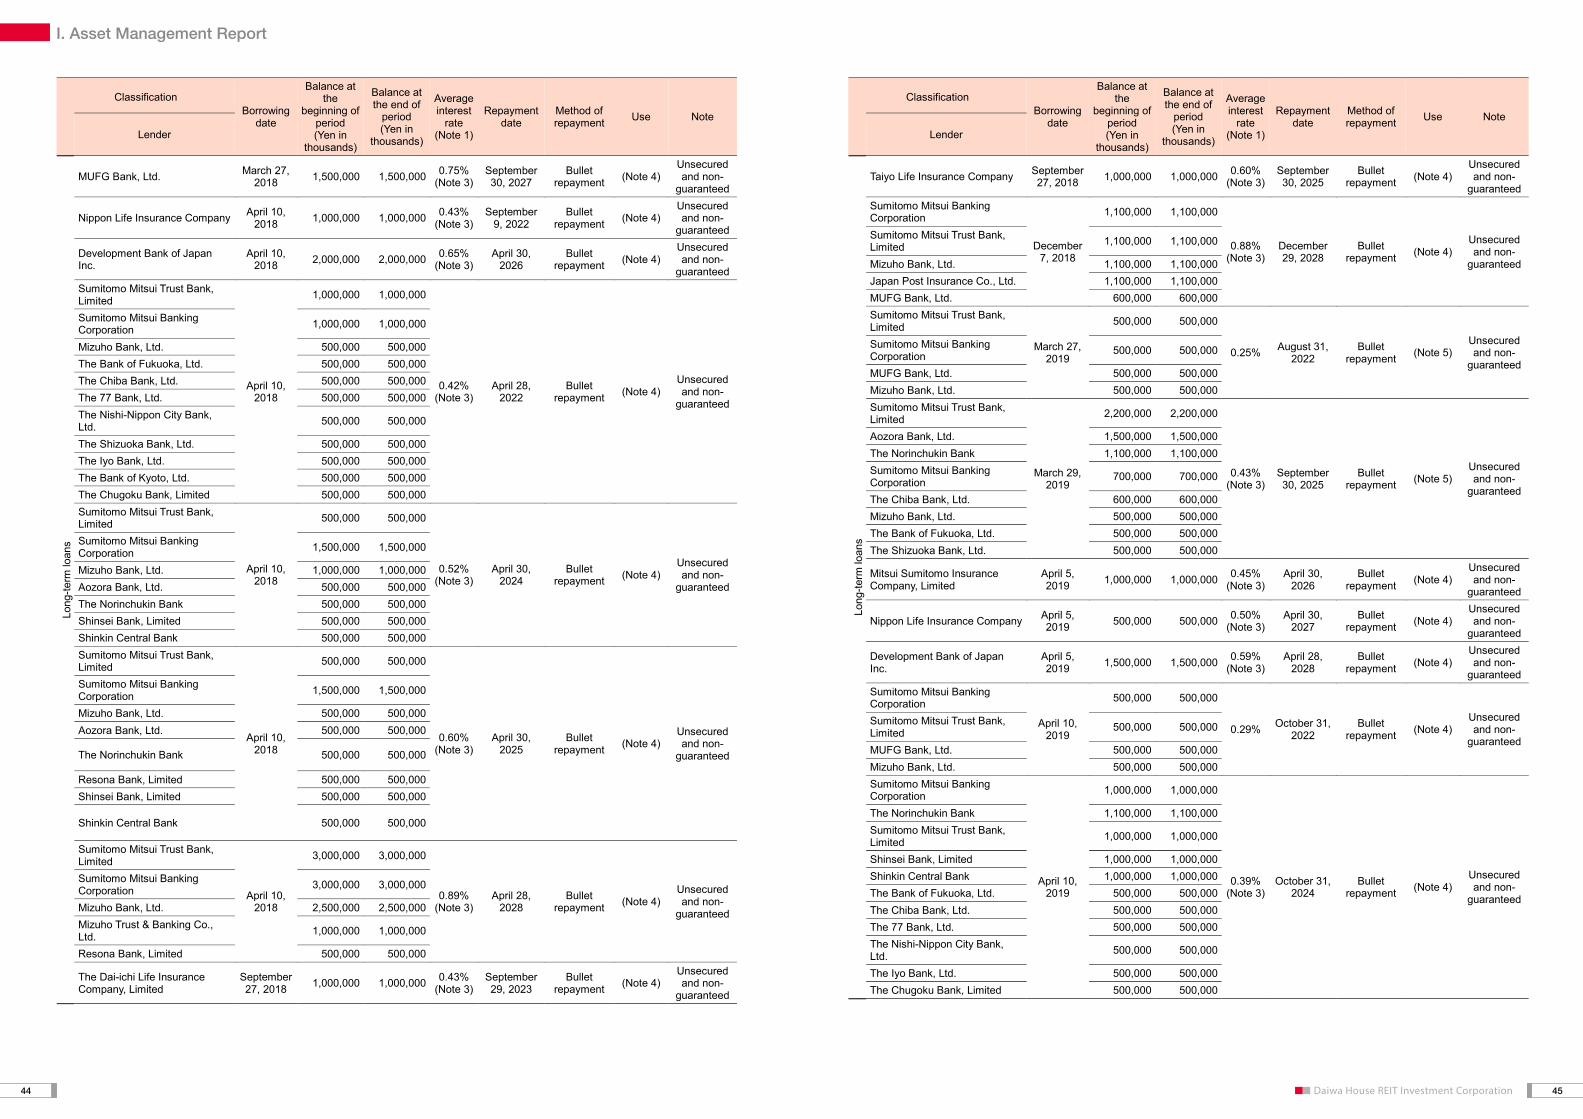
I. Asset Management ReportI. Asset Management Report
Classification Borrowing
date
Balance at the
beginning of period (Yen in
thousands)
Balance at the end of
period (Yen in
thousands)
Average interest
rate (Note 1)
Repayment date
Method of repayment Use Note
Lender
Long
-term
loan
s
MUFG Bank, Ltd. March 27, 2018 1,500,000 1,500,000 0.75%
(Note 3) September 30, 2027
Bullet repayment (Note 4)
Unsecured and non-
guaranteed
Nippon Life Insurance Company April 10, 2018 1,000,000 1,000,000 0.43%
(Note 3) September
9, 2022 Bullet
repayment (Note 4) Unsecured and non-
guaranteed
Development Bank of Japan Inc.
April 10, 2018 2,000,000 2,000,000 0.65%
(Note 3) April 30,
2026 Bullet
repayment (Note 4) Unsecured and non-
guaranteed Sumitomo Mitsui Trust Bank, Limited
April 10, 2018
1,000,000 1,000,000
0.42% (Note 3)
April 28, 2022
Bullet repayment (Note 4)
Unsecured and non-
guaranteed
Sumitomo Mitsui Banking Corporation 1,000,000 1,000,000
Mizuho Bank, Ltd. 500,000 500,000 The Bank of Fukuoka, Ltd. 500,000 500,000 The Chiba Bank, Ltd. 500,000 500,000 The 77 Bank, Ltd. 500,000 500,000 The Nishi-Nippon City Bank, Ltd. 500,000 500,000
The Shizuoka Bank, Ltd. 500,000 500,000 The Iyo Bank, Ltd. 500,000 500,000 The Bank of Kyoto, Ltd. 500,000 500,000 The Chugoku Bank, Limited 500,000 500,000 Sumitomo Mitsui Trust Bank, Limited
April 10, 2018
500,000 500,000
0.52% (Note 3)
April 30, 2024
Bullet repayment (Note 4)
Unsecured and non-
guaranteed
Sumitomo Mitsui Banking Corporation 1,500,000 1,500,000
Mizuho Bank, Ltd. 1,000,000 1,000,000 Aozora Bank, Ltd. 500,000 500,000 The Norinchukin Bank 500,000 500,000 Shinsei Bank, Limited 500,000 500,000 Shinkin Central Bank 500,000 500,000 Sumitomo Mitsui Trust Bank, Limited
April 10, 2018
500,000 500,000
0.60% (Note 3)
April 30, 2025
Bullet repayment (Note 4)
Unsecured and non-
guaranteed
Sumitomo Mitsui Banking Corporation 1,500,000 1,500,000
Mizuho Bank, Ltd. 500,000 500,000 Aozora Bank, Ltd. 500,000 500,000
The Norinchukin Bank 500,000 500,000
Resona Bank, Limited 500,000 500,000 Shinsei Bank, Limited 500,000 500,000
Shinkin Central Bank 500,000 500,000
Sumitomo Mitsui Trust Bank, Limited
April 10, 2018
3,000,000 3,000,000
0.89% (Note 3)
April 28, 2028
Bullet repayment (Note 4)
Unsecured and non-
guaranteed
Sumitomo Mitsui Banking Corporation 3,000,000 3,000,000
Mizuho Bank, Ltd. 2,500,000 2,500,000 Mizuho Trust & Banking Co., Ltd. 1,000,000 1,000,000
Resona Bank, Limited 500,000 500,000
The Dai-ichi Life Insurance Company, Limited
September 27, 2018 1,000,000 1,000,000 0.43%
(Note 3) September 29, 2023
Bullet repayment (Note 4)
Unsecured and non-
guaranteed
I. Asset Management Report
Classification Borrowing
date
Balance at the
beginning of period (Yen in
thousands)
Balance at the end of
period (Yen in
thousands)
Average interest
rate (Note 1)
Repayment date
Method of repayment Use Note
Lender
Long
-term
loan
s
Taiyo Life Insurance Company September 27, 2018 1,000,000 1,000,000 0.60%
(Note 3) September 30, 2025
Bullet repayment (Note 4)
Unsecured and non-
guaranteed Sumitomo Mitsui Banking Corporation
December 7, 2018
1,100,000 1,100,000
0.88% (Note 3)
December 29, 2028
Bullet repayment (Note 4)
Unsecured and non-
guaranteed
Sumitomo Mitsui Trust Bank, Limited 1,100,000 1,100,000
Mizuho Bank, Ltd. 1,100,000 1,100,000 Japan Post Insurance Co., Ltd. 1,100,000 1,100,000 MUFG Bank, Ltd. 600,000 600,000 Sumitomo Mitsui Trust Bank, Limited
March 27, 2019
500,000 500,000
0.25% August 31, 2022
Bullet repayment (Note 5)
Unsecured and non-
guaranteed
Sumitomo Mitsui Banking Corporation 500,000 500,000
MUFG Bank, Ltd. 500,000 500,000 Mizuho Bank, Ltd. 500,000 500,000 Sumitomo Mitsui Trust Bank, Limited
March 29, 2019
2,200,000 2,200,000
0.43% (Note 3)
September 30, 2025
Bullet repayment (Note 5)
Unsecured and non-
guaranteed
Aozora Bank, Ltd. 1,500,000 1,500,000 The Norinchukin Bank 1,100,000 1,100,000 Sumitomo Mitsui Banking Corporation 700,000 700,000
The Chiba Bank, Ltd. 600,000 600,000 Mizuho Bank, Ltd. 500,000 500,000 The Bank of Fukuoka, Ltd. 500,000 500,000 The Shizuoka Bank, Ltd. 500,000 500,000
Mitsui Sumitomo Insurance Company, Limited
April 5, 2019 1,000,000 1,000,000 0.45%
(Note 3) April 30,
2026 Bullet
repayment (Note 4) Unsecured and non-
guaranteed
Nippon Life Insurance Company April 5, 2019 500,000 500,000 0.50%
(Note 3) April 30,
2027 Bullet
repayment (Note 4) Unsecured and non-
guaranteed
Development Bank of Japan Inc.
April 5, 2019 1,500,000 1,500,000 0.59%
(Note 3) April 28,
2028 Bullet
repayment (Note 4) Unsecured and non-
guaranteed Sumitomo Mitsui Banking Corporation
April 10, 2019
500,000 500,000
0.29% October 31, 2022
Bullet repayment (Note 4)
Unsecured and non-
guaranteed
Sumitomo Mitsui Trust Bank, Limited 500,000 500,000
MUFG Bank, Ltd. 500,000 500,000 Mizuho Bank, Ltd. 500,000 500,000 Sumitomo Mitsui Banking Corporation
April 10, 2019
1,000,000 1,000,000
0.39% (Note 3)
October 31, 2024
Bullet repayment (Note 4)
Unsecured and non-
guaranteed
The Norinchukin Bank 1,100,000 1,100,000 Sumitomo Mitsui Trust Bank, Limited 1,000,000 1,000,000
Shinsei Bank, Limited 1,000,000 1,000,000 Shinkin Central Bank 1,000,000 1,000,000 The Bank of Fukuoka, Ltd. 500,000 500,000 The Chiba Bank, Ltd. 500,000 500,000 The 77 Bank, Ltd. 500,000 500,000 The Nishi-Nippon City Bank, Ltd. 500,000 500,000
The Iyo Bank, Ltd. 500,000 500,000 The Chugoku Bank, Limited 500,000 500,000
4544

I. Asset Management ReportI. Asset Management Report
Classification Borrowing
date
Balance at the
beginning of period (Yen in
thousands)
Balance at the end of
period (Yen in
thousands)
Average interest
rate (Note 1)
Repayment date
Method of repayment Use Note
Lender
Long
-term
loan
s
Sumitomo Mitsui Banking Corporation
April 10, 2019
2,500,000 2,500,000
0.75% (Note 2)
April 27, 2029
Bullet repayment (Note 4)
Unsecured and non-
guaranteed
Mizuho Bank, Ltd. 2,700,000 2,700,000 Sumitomo Mitsui Trust Bank, Limited 2,500,000 2,500,000
Resona Bank, Limited 1,000,000 1,000,000 Mizuho Trust & Banking Co., Ltd. 1,000,000 1,000,000
MUFG Bank, Ltd. 700,000 700,000 Sumitomo Mitsui Banking Corporation
November 29, 2019
2,000,000 2,000,000
0.66% (Note 2)
November 30, 2029
Bullet repayment (Note 5)
Unsecured and non-
guaranteed
Sumitomo Mitsui Trust Bank, Limited 2,000,000 2,000,000
MUFG Bank, Ltd. 2,000,000 2,000,000 Mizuho Bank, Ltd. 2,000,000 2,000,000 Development Bank of Japan Inc. 2,000,000 2,000,000
Development Bank of Japan Inc.
January 31, 2020 1,500,000 1,500,000 0.59%
(Note 3) January 31,
2029 Bullet
repayment (Note 5) Unsecured and non-
guaranteed Sumitomo Mitsui Banking Corporation
January 31, 2020
1,000,000 1,000,000
0.46% (Note 3)
July 30, 2027
Bullet repayment (Note 5)
Unsecured and non-
guaranteed
Aozora Bank, Ltd. 2,400,000 2,400,000 Sumitomo Mitsui Trust Bank, Limited 1,000,000 1,000,000
MUFG Bank, Ltd. 1,000,000 1,000,000 Mizuho Bank, Ltd. 1,000,000 1,000,000 The Norinchukin Bank 1,000,000 1,000,000 Mizuho Trust & Banking Co., Ltd. 500,000 500,000
The Yamaguchi Bank, Ltd. 500,000 500,000 Sumitomo Mitsui Banking Corporation
January 31, 2020
2,200,000 2,200,000
0.61% (Note 2)
January 31, 2030
Bullet repayment (Note 5)
Unsecured and non-
guaranteed
Sumitomo Mitsui Trust Bank, Limited 3,400,000 3,400,000
Mizuho Trust & Banking Co., Ltd. 1,300,000 1,300,000
MUFG Bank, Ltd. 1,200,000 1,200,000 Mizuho Bank, Ltd. 900,000 900,000 Sumitomo Mitsui Trust Bank, Limited
March 31, 2020
900,000 900,000
0.28% September 29, 2023
Bullet repayment (Note 5)
Unsecured and non-
guaranteed
MUFG Bank, Ltd. 1,900,000 1,900,000 Sumitomo Mitsui Banking Corporation 900,000 900,000
Mizuho Bank, Ltd. 900,000 900,000 Resona Bank, Limited 800,000 800,000 The Norinchukin Bank 500,000 500,000 The Chiba Bank, Ltd. 500,000 500,000 Shinsei Bank, Limited 300,000 300,000
Mitsui Sumitomo Insurance Company, Limited
April 1, 2020 1,000,000 1,000,000 0.40%
(Note 3) April 30,
2026 Bullet
repayment (Note 5) Unsecured and non-
guaranteed
I. Asset Management Report
Classification Borrowing
date
Balance at the
beginning of period (Yen in
thousands)
Balance at the end of
period (Yen in
thousands)
Average interest
rate (Note 1)
Repayment date
Method of repayment Use Note
Lender
Long
-term
loan
s
Sumitomo Mitsui Trust Bank, Limited
April 3, 2020
500,000 500,000
0.35% (Note 3)
October 31, 2024
Bullet repayment (Note 4)
Unsecured and non-
guaranteed
The Norinchukin Bank 1,000,000 1,000,000 The 77 Bank, Ltd. 700,000 700,000 The Chugoku Bank, Limited 700,000 700,000 Nippon Life Insurance Company 600,000 600,000 Sumitomo Mitsui Banking Corporation 500,000 500,000
MUFG Bank, Ltd. 500,000 500,000 Mizuho Bank, Ltd. 500,000 500,000 The Chiba Bank, Ltd. 500,000 500,000 The Iyo Bank, Ltd. 500,000 500,000
The Dai-ichi Life Insurance Company, Limited
April 3, 2020 500,000 500,000 0.40%
(Note 3) March 31,
2026 Bullet
repayment (Note 4) Unsecured and non-
guaranteed
Mitsui Sumitomo Insurance Company, Limited
April 3, 2020 500,000 500,000 0.41%
(Note 3) September 30, 2026
Bullet repayment (Note 4)
Unsecured and non-
guaranteed
Development Bank of Japan Inc.
April 3, 2020 1,000,000 1,000,000 0.51%
(Note 3) September 29, 2028
Bullet repayment (Note 4)
Unsecured and non-
guaranteed Sumitomo Mitsui Trust Bank, Limited
April 3, 2020
500,000 500,000
0.51% (Note 2)
April 27, 2029
Bullet repayment (Note 4)
Unsecured and non-
guaranteed
Resona Bank, Limited 1,000,000 1,000,000 Sumitomo Mitsui Banking Corporation 500,000 500,000
MUFG Bank, Ltd. 500,000 500,000 Mizuho Bank, Ltd. 500,000 500,000 Shinsei Bank, Limited 500,000 500,000 Shinkin Central Bank 500,000 500,000 The Bank of Fukuoka, Ltd. 500,000 500,000 The Nishi-Nippon City Bank, Ltd. 500,000 500,000
MUFG Bank, Ltd.
April 3, 2020
2,000,000 2,000,000
0.62% (Note 2)
April 30, 2030
Bullet repayment (Note 4)
Unsecured and non-
guaranteed
Sumitomo Mitsui Trust Bank, Limited 2,000,000 2,000,000
Sumitomo Mitsui Banking Corporation 2,000,000 2,000,000
Mizuho Bank, Ltd. 2,000,000 2,000,000 Mizuho Trust & Banking Co., Ltd. 1,000,000 1,000,000
The Bank of Kyoto, Ltd. 500,000 500,000 The Yamanashi Chuo Bank, Ltd. 500,000 500,000
The Dai-ichi Life Insurance Company, Limited
September 30, 2020 – 1,000,000 0.44%
(Note 3) March 31,
2026 Bullet
repayment (Note 4) Unsecured and non-
guaranteed
Shinsei Bank, Limited September 30, 2020 – 1,000,000 0.46%
(Note 3) September 30, 2027
Bullet repayment (Note 4)
Unsecured and non-
guaranteed
The Norinchukin Bank January 29, 2021 – 3,500,000 0.37%
(Note 3) January 31,
2028 Bullet
repayment (Note 5) Unsecured and non-
guaranteed Subtotal – 330,558,000 322,200,000 – – – – – Total – 346,558,000 348,558,000 – – – – –
(Notes) 1. Average interest rate is the loan interest rate (weighted average during the applicable term) of the corresponding lenders, and is rounded to the second decimal place. 2. DHR currently uses interest rate swaps to hedge interest rate fluctuation risk; accordingly, the indicated interest rates are the figures reflecting the effect of the interest rate swaps. 3. This loan carries a fixed interest rate.
4746

I. Asset Management ReportI. Asset Management Report
4. To be used to purchase trust beneficiary interests in real estate and related expenses. 5. To be used for repayment of existing loans (refinancing fund). 6. To be used for redemption of rehabilitation obligations (investment corporation bonds) and repayment of rehabilitation obligations (loans). 7. To be used for redemption of investment corporation bonds.
I. Asset Management Report
(3) Investment Corporation Bonds The status of investment corporation bonds issued as of February 28, 2021 is as follows:
Issue name Issue date
Balance at the beginning
of period (Yen in thousands)
Balance at the end of period
(Yen in thousands)
Interest rate Maturity Method of
redemption Use Note
Daiwa House REIT Investment Corporation 1st Unsecured Investment Corporation Bonds (Note 1)
December 24, 2014 2,000,000 2,000,000 0.826% December
24, 2024 Bullet
repayment (Note 2) Unsecured
Daiwa House Residential Investment Corporation 2nd Unsecured Investment Corporation Bonds (Note 1)
January 22, 2015 3,000,000 – 0.35% January
22, 2021 Bullet
repayment (Note 3) Unsecured
Daiwa House Residential Investment Corporation 3rd Unsecured Investment Corporation Bonds (Note 1)
January 22, 2015 3,000,000 3,000,000 0.67% January
22, 2025 Bullet
repayment (Note 3) Unsecured
Daiwa House REIT Investment Corporation 5th Unsecured Investment Corporation Bonds (Note 1)
December 20, 2016 4,000,000 4,000,000 0.24% December
20, 2021 Bullet
repayment (Note 2) Unsecured
Daiwa House REIT Investment Corporation 6th Unsecured Investment Corporation Bonds (Note 1)
December 20, 2016 4,000,000 4,000,000 0.57% December
18, 2026 Bullet
repayment (Note 2) Unsecured
Daiwa House REIT Investment Corporation 7th Unsecured Investment Corporation Bonds (Note 1)
July 30, 2018 2,000,000 2,000,000 0.69% July 30,
2030 Bullet
repayment (Note 2) Unsecured
Daiwa House REIT Investment Corporation 8th Unsecured Investment Corporation Bonds (Note 1)
July 30, 2018 1,000,000 1,000,000 1.03% July 30,
2038 Bullet
repayment (Note 2) Unsecured
Daiwa House REIT Investment Corporation 9th Unsecured Investment Corporation Bonds (Green Bonds) (Note 1)
November 25, 2019 6,000,000 6,000,000 0.53% November
22, 2029 Bullet
repayment (Note 4) Unsecured
Daiwa House REIT Investment Corporation 10th Unsecured Investment Corporation Bonds (Green Bonds) (Note 1)
May 27, 2020 2,400,000 2,400,000 0.34% May 27,
2025 Bullet
repayment (Note 4) Unsecured
Daiwa House REIT Investment Corporation 11th Unsecured Investment Corporation Bonds (Green Bonds) (Note 1)
May 27, 2020 1,600,000 1,600,000 0.64% May 27,
2030 Bullet
repayment (Note 4) Unsecured
Daiwa House REIT Investment Corporation 12th Unsecured Investment Corporation Bonds (Green Bonds) (Note 1)
May 27, 2020 1,000,000 1,000,000 1.00% May 25,
2040 Bullet
repayment (Note 4) Unsecured
Daiwa House REIT Investment Corporation 13th Unsecured Investment Corporation Bonds (Note 1)
December 24, 2020 – 3,000,000 0.60% December
24, 2032 Bullet
repayment (Note 5) Unsecured
Total – 30,000,000 30,000,000 – – – – –
(Notes) 1. The bonds have pari passu conditions among specified investment corporation bonds. 2. To be used for repayment of existing loans. 3. To be used for redemption of rehabilitation obligations (investment corporation bonds) and repayment of rehabilitation obligations (loans). 4. To be used for a part of the funds for the repayment of existing loans associated with “eligible green assets.” 5. To be used for redemption of investment corporation bonds.
(4) Short-Term Investment Corporation Bonds Not applicable.
4948
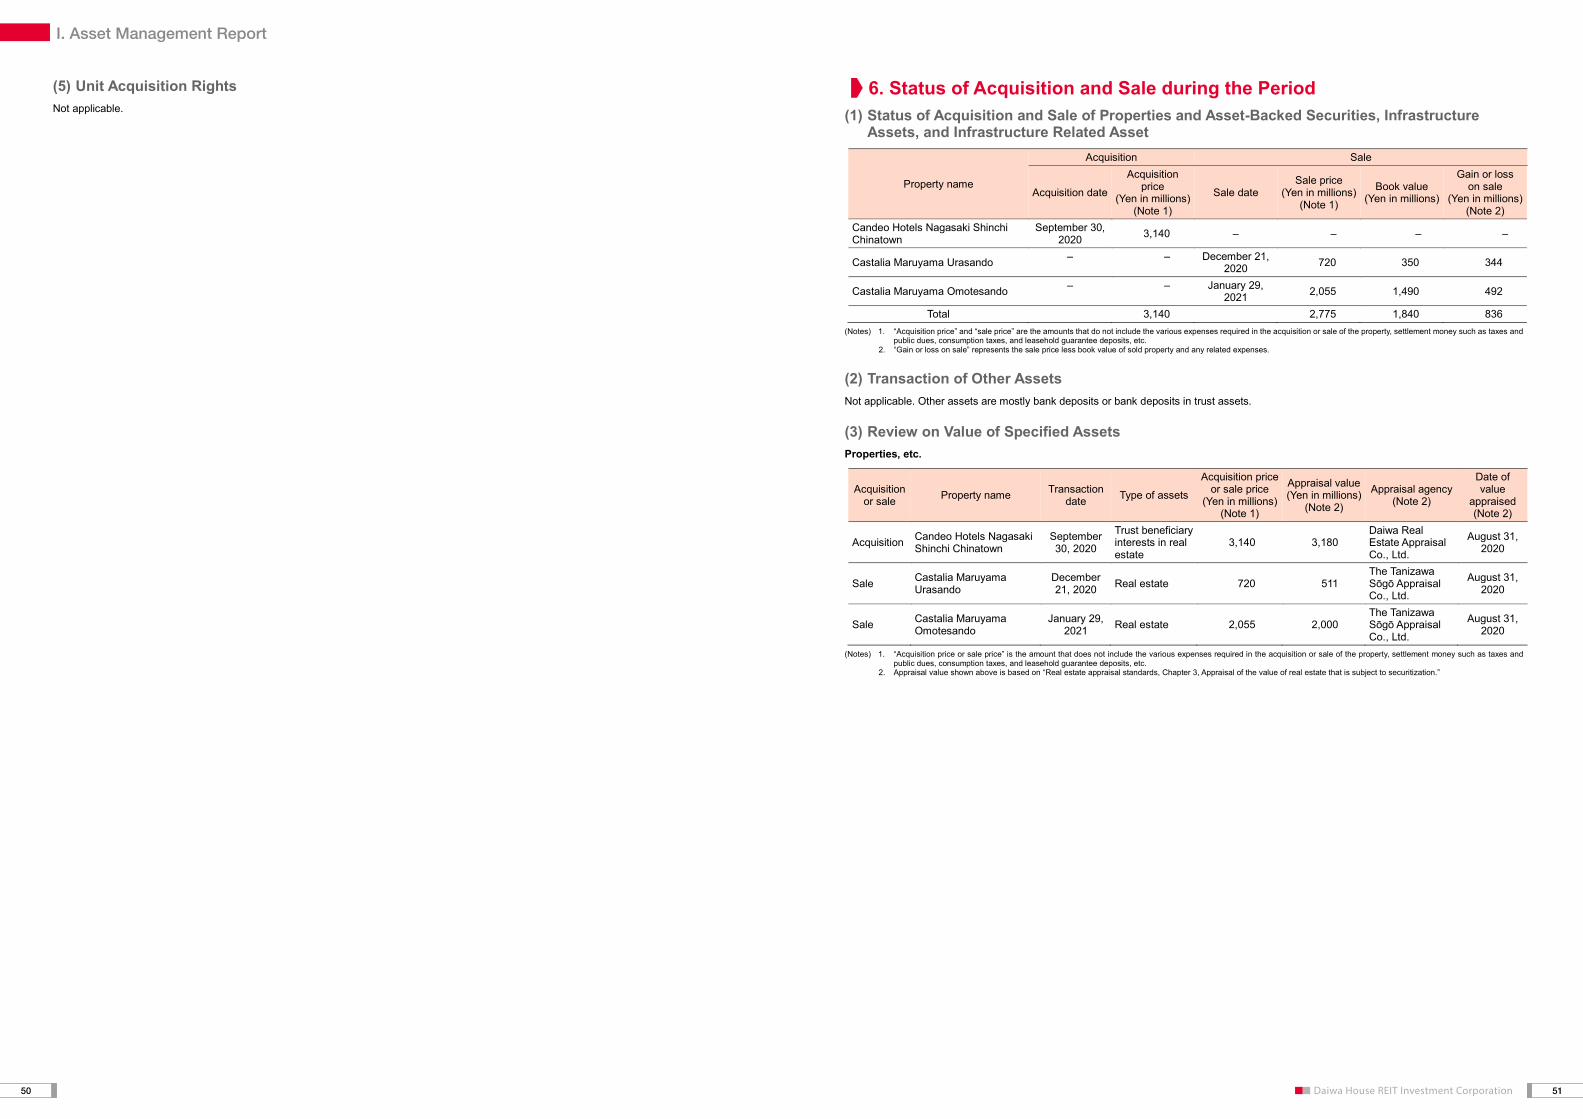
I. Asset Management ReportI. Asset Management Report
(5) Unit Acquisition Rights Not applicable.
I. Asset Management Report
6. Status of Acquisition and Sale during the Period (1) Status of Acquisition and Sale of Properties and Asset-Backed Securities, Infrastructure
Assets, and Infrastructure Related Asset
Property name
Acquisition Sale
Acquisition date
Acquisition price
(Yen in millions) (Note 1)
Sale date Sale price
(Yen in millions) (Note 1)
Book value (Yen in millions)
Gain or loss on sale
(Yen in millions) (Note 2)
Candeo Hotels Nagasaki Shinchi Chinatown
September 30, 2020 3,140 – – – –
Castalia Maruyama Urasando – – December 21, 2020 720 350 344
Castalia Maruyama Omotesando – – January 29, 2021 2,055 1,490 492
Total 3,140 2,775 1,840 836 (Notes) 1. “Acquisition price” and “sale price” are the amounts that do not include the various expenses required in the acquisition or sale of the property, settlement money such as taxes and
public dues, consumption taxes, and leasehold guarantee deposits, etc. 2. “Gain or loss on sale” represents the sale price less book value of sold property and any related expenses.
(2) Transaction of Other Assets Not applicable. Other assets are mostly bank deposits or bank deposits in trust assets.
(3) Review on Value of Specified Assets Properties, etc.
Acquisition or sale Property name Transaction
date Type of assets
Acquisition price or sale price
(Yen in millions) (Note 1)
Appraisal value (Yen in millions)
(Note 2)
Appraisal agency (Note 2)
Date of value
appraised (Note 2)
Acquisition Candeo Hotels Nagasaki Shinchi Chinatown
September 30, 2020
Trust beneficiary interests in real estate
3,140 3,180 Daiwa Real Estate Appraisal Co., Ltd.
August 31, 2020
Sale Castalia Maruyama Urasando
December 21, 2020 Real estate 720 511
The Tanizawa Sōgō Appraisal Co., Ltd.
August 31, 2020
Sale Castalia Maruyama Omotesando
January 29, 2021 Real estate 2,055 2,000
The Tanizawa Sōgō Appraisal Co., Ltd.
August 31, 2020
(Notes) 1. “Acquisition price or sale price” is the amount that does not include the various expenses required in the acquisition or sale of the property, settlement money such as taxes and public dues, consumption taxes, and leasehold guarantee deposits, etc.
2. Appraisal value shown above is based on “Real estate appraisal standards, Chapter 3, Appraisal of the value of real estate that is subject to securitization.”
6. Status of Acquisition and Sale during the Period
5150

I. Asset Management ReportI. Asset Management Report
(4) Transactions with Interested Parties, etc. Purchase and sale transactions, etc. with interested parties, etc. (Note 1) for the 30th period are as follows:
i) Status of Transactions
Classification Transaction amount, etc. (Note 2)
Purchase Sale
Total ¥3,140 million ¥2,775 million
Breakdown of transactions with interested parties
Daiwa House Industry Co., Ltd. ¥3,140 million (100.0%) ¥– million (–%)
Total ¥3,140 million (100.0%) ¥– million (–%) ii) Amount of Fees Paid
Classification Total amount paid (A) (Yen in thousands)
Breakdown of transactions with interested parties, etc. (Note 1) Rate to total amount
paid (B/A) (%) Payment recipient Amount paid (B) (Yen in thousands)
Management fees 1,500,676
Daiwa Living Co., Ltd. 550,667 36.7 Daiwa Information Service Co., Ltd. 285,465 19.0
Daiwa House Property Management Co., Ltd. 285,353 19.0
Daiwa LifeNext Co., Ltd. 33,564 2.2
Daiwa Lease Co., Ltd. 3,405 0.2
Repairs and maintenance expenses 1,021,181
Daiwa Living Co., Ltd. 415,836 40.7
Daiwa House Property Management Co., Ltd. 228,717 22.4
Daiwa Information Service Co., Ltd. 226,617 22.2
Daiwa Living Management Co., Ltd. 20,265 2.0
Daiwa LifeNext Co., Ltd. 7,868 0.8
Daiwa House Industry Co., Ltd. 3,669 0.4
Daiwa Lease Co., Ltd. 1,551 0.2
Restoration costs 279,613 Daiwa Living Co., Ltd. 198,369 70.9
Other rental expenses 136,247
Daiwa Living Co., Ltd. 43,535 32.0
Daiwa House Property Management Co., Ltd. 21,650 15.9
Daiwa Information Service Co., Ltd. 14,136 10.4
Daiwa LifeNext Co., Ltd. 1,846 1.4
Daiwa Lease Co., Ltd. 15 0.0 (Notes) 1. “Interested parties, etc.” are interested parties, etc., of the Asset Manager with which DHR has concluded an asset management agreement as provided in Article 201, Paragraph
1 of the Investment Trusts Act, Article 123 of the Order for Enforcement of the Investment Trusts Act, Article 244-3 of Regulation for Enforcement of Investment Trusts Act and Article 26, Item 27 of The Investment Trusts Association, Japan’s Rules on Management Reports, etc., of Investment Trusts and Investment Corporations.
2. “Transaction amount, etc.” is the amount that does not include the various expenses required in the acquisition or sale of the property, settlement money such as taxes and public dues, consumption taxes, and leasehold guarantee deposits, etc.
(5) Status of Transactions with Asset Manager Pertaining to Business Operated by Asset Manager as Subsidiary Business
Not applicable because the Asset Manager does not engage in any business as a subsidiary business that is a type I financial instruments business, type II financial instruments business, real estate brokerage or real estate specified joint enterprise.
I. Asset Management Report
7. Accounting (1) Status of Assets, Liabilities, Principal and Income/Loss Please refer to “Balance Sheets,” “Statements of Income and Retained Earnings,” “Statements of Changes in Net Assets,” “Notes to Financial Statements” and “Distribution Information.”
(2) Changes in Method to Calculate Depreciation Expenses
Not applicable.
(3) Changes in Method to Evaluate Properties and Infrastructure Assets
Not applicable.
(4) Status of Beneficiary Certificates of Investment Trust Established by DHR
Not applicable.
(5) Disclosure relating to Overseas Real Estate Holding Corporation and Real Estate Held by such Corporation
Not applicable.
8. Other (1) Notice The overview of conclusions and changes, etc., of major contracts approved by DHR’s board of directors during the current fiscal period is as follows:
Date of the Board of Directors meeting Item Description
November 27, 2020
Conclusion of underwriting agreement for investment corporation bond issuance, etc.
In line with a comprehensive resolution on the issuance of investment corporation bonds approved on the same day, DHR resolved that the selection of an administrator of the investment corporation bonds to be issued in the future would be at the discretion of the Executive Director. Based on this resolution, DHR entrusted Mitsubishi UFJ Morgan Stanley Securities Co., Ltd. and SMBC Nikko Securities Inc. with the relevant work for soliciting subscribers for investment corporation bonds, and entrusted Sumitomo Mitsui Trust Bank, Limited with issuance agent work, payment agent work, etc.
(2) Treatment of Fractions in Amounts and Rates
Unless otherwise specified, amounts less than the units indicated are truncated, while values of ratio are rounded up or down to the nearest value of the last digit in this report.
7. Accounting
8. Other
5352

Daiwa House REIT Investment Corporation BALANCE SHEETS
As of August 31, 2020 and February 28, 2021
As of
August 31, 2020 February 28, 2021
(Yen in thousands) Assets Current assets: Cash and bank deposits (Notes 3 and 4) ¥39,382,433 ¥48,626,458 Operating accounts receivable 313,256 264,766 Prepaid expenses 682,002 672,881 Consumption taxes receivable 3,156,408 ― Other current assets 5,334 2,561 Allowance for doubtful accounts (1,061) (1,498) Total current assets 43,538,373 49,565,169 Investment properties (Notes 8 and 9) 780,843,030 778,754,043 Other assets:
Goodwill (Note 7) 63,431,250 61,449,024 Leasehold rights in trust (Note 9) 5,845,688 5,925,048
Lease and guarantee deposits in trust 3,488,978 3,498,978 Guarantee deposits 99 99 Long-term prepaid expenses 2,282,730 2,036,722 Investment corporation bond issuance costs 138,915 147,124 Investment securities (Notes 4 and 5) 9,411 9,428 Trademark rights 1,224 945 Total other assets 75,198,298 73,067,371 Total assets ¥899,579,703 ¥901,386,584
II. Balance Sheets
Daiwa House REIT Investment Corporation BALANCE SHEETS
As of August 31, 2020 and February 28, 2021
As of August 31, 2020 February 28, 2021
(Yen in thousands) Liabilities Current liabilities: Operating accounts and other payable ¥2,300,842 ¥1,820,270 Current portion of investment corporation bonds (Notes 4 and 14) 3,000,000 4,000,000 Current portion of long-term loans (Notes 4, 6 and 15) 16,000,000 26,358,000 Accrued expenses 1,704,215 1,706,448 Accrued consumption taxes ― 1,191,971 Advances received 3,209,021 3,196,677 Unearned revenue 214,721 202,267 Deposits received 211,758 254,618 Derivative liabilities (Notes 4 and 6) ― 10,302 Other 82,101 69,603 Total current liabilities 26,722,660 38,810,159 Non-current liabilities:
Investment corporation bonds (Notes 4 and 14) 27,000,000 26,000,000 Long-term loans (Notes 4, 6 and 15) 330,558,000 322,200,000 Long-term unearned revenue 491,779 394,277 Tenant leasehold and security deposits (Note 4) 347,135 333,342 Tenant leasehold and security deposits in trust (Note 4) 21,727,786 21,739,562 Asset retirement obligations (Note 11) 652,172 658,347 Derivative liabilities (Notes 4 and 6) 777,986 664,385 Total non-current liabilities 381,554,861 371,989,915
Total liabilities 408,277,521 410,800,075 Net assets (Notes 12 and 13) Unitholders’ equity:
Unitholders’ capital 231,766,153 231,766,153 Units authorized: 8,000,000 units as of August 31, 2020 and February 28, 2021 Units issued and outstanding: 2,196,000 units as of August 31, 2020 and February 28, 2021
Surplus Capital surplus 247,667,563 247,667,563
Allowance for temporary difference adjustments ― (50,508) Capital surplus, net 247,667,563 247,617,055
Voluntary reserve Reserve for temporary difference adjustments 496,382 ― Reserve for distribution 2,214,027 ―
Total voluntary reserve 2,710,410 ― Unappropriated retained earnings 9,936,041 11,877,987 Total surplus 260,314,014 259,495,043
Total unitholders’ equity 492,080,168 491,261,196 Valuation and translation adjustments
Deferred gains or losses on hedges (Note 6) (777,986) (674,687) Total valuation and translation adjustments (777,986) (674,687)
Total net assets 491,302,181 490,586,508 Total liabilities and net assets ¥899,579,703 ¥901,386,584
The accompanying notes are an integral part of these financial statements.
5554

Daiwa House REIT Investment Corporation STATEMENTS OF INCOME AND RETAINED EARNINGS
For the fiscal periods ended August 31, 2020 and February 28, 2021
For the fiscal periods ended August 31, 2020 February 28, 2021
(Yen in thousands) Operating revenues:
Rental revenues (Note 10) ¥26,613,533 ¥27,260,211 Gain on sale of investment properties (Note 18) ― 836,795
Total operating revenues 26,613,533 28,097,006 Operating expenses:
Rental expenses (Note 10) 10,737,121 11,179,703 Asset management fees 1,764,808 1,792,206 Asset custody fees 38,860 39,665 Administrative service fees 95,528 98,381 Directors’ remuneration 6,600 6,600 Amortization of goodwill (Note 7) 1,982,226 1,982,226 Provision of allowance for doubtful accounts 213 626 Other operating expenses 414,127 426,506
Total operating expenses 15,039,486 15,525,917 Operating income 11,574,046 12,571,089 Non-operating revenues:
Interest income 198 165 Gain on forfeiture of unclaimed distributions 4,428 4,552 Gain on adjustment of liabilities 10,740 9,624 Interest on tax refund ― 4,390 Other non-operating revenues 17 17
Total non-operating revenues 15,384 18,750 Non-operating expenses:
Interest expense 1,100,321 1,093,457 Interest expense on investment corporation bonds 75,787 82,887 Amortization of investment corporation bond issuance costs 11,895 12,663 Investment unit issuance expenses 159,202 ― Borrowing related expenses 303,424 299,505 Other non-operating expenses 2,154 2,000
Total non-operating expenses 1,652,785 1,490,514 Ordinary income 9,936,646 11,099,325 Income before income taxes 9,936,646 11,099,325
Income taxes-current (Note 17) 605 605 Net income ¥9,936,041 ¥11,098,720 Retained earnings brought forward ― 779,267 Unappropriated retained earnings ¥9,936,041 ¥11,877,987
The accompanying notes are an integral part of these financial statements.
III. Statements of Income and Retained Earnings
Daiwa House REIT Investment Corporation STATEMENTS OF CHANGES IN NET ASSETS
For the fiscal periods ended August 31, 2020 and February 28, 2021
Unitholders’ equity
Surplus
Capital surplus Voluntary reserve
Number of units
issued and out-
standing Unitholders’
capital Capital surplus
Allowance for temporary difference
adjustments Capital
surplus, net
Reserve for temporary difference
adjustments Reserve for distribution
Total voluntary
reserve (Units) (Yen in thousands)
Balance as of February 29, 2020 2,075,000 ¥198,492,847 ¥247,667,563 ¥― ¥247,667,563 ¥3,903,449 ¥2,214,027 ¥6,117,477
Changes during the period:
Issuance of new investment units on March 2, 2020 121,000 33,273,306 ― ― ― ― ― ―
Reversal of reserve for temporary difference adjustments ― ― ― ― ― (3,407,066) ― (3,407,066)
Distributions from surplus ― ― ― ― ― ― ― ― Net income ― ― ― ― ― ― ― ― Net changes of items other than
changes of unitholders’ equity ― ― ― ― ― ― ― ―
Total changes during the period ― 33,273,306 ― ― ― (3,407,066) ― (3,407,066)
Balance as of August 31, 2020 2,196,000 ¥231,766,153 ¥247,667,563 ¥― ¥247,667,563 ¥496,382 ¥2,214,027 ¥2,710,410
Changes during the period: Distribution in excess of
earnings from allowance for temporary difference adjustments ― ― ― (50,508) (50,508) ― ― ―
Reversal of reserve for temporary difference adjustments ― ― ― ― ― (496,382) ― (496,382)
Reversal of reserve for distribution ― ― ― ― ― ― (2,214,027) (2,214,027)
Distributions from surplus ― ― ― ― ― ― ― ― Net income ― ― ― ― ― ― ― ― Net changes of items other than
changes of unitholders’ equity ― ― ― ― ― ― ― ―
Total changes during the period ― ― ― (50,508) (50,508) (496,382) (2,214,027) (2,710,410)
Balance as of February 28, 2021 2,196,000 ¥231,766,153 ¥247,667,563 ¥(50,508) ¥247,617,055 ¥― ¥― ¥―
IV. Statements of Changes in Net Assets
5756 5756
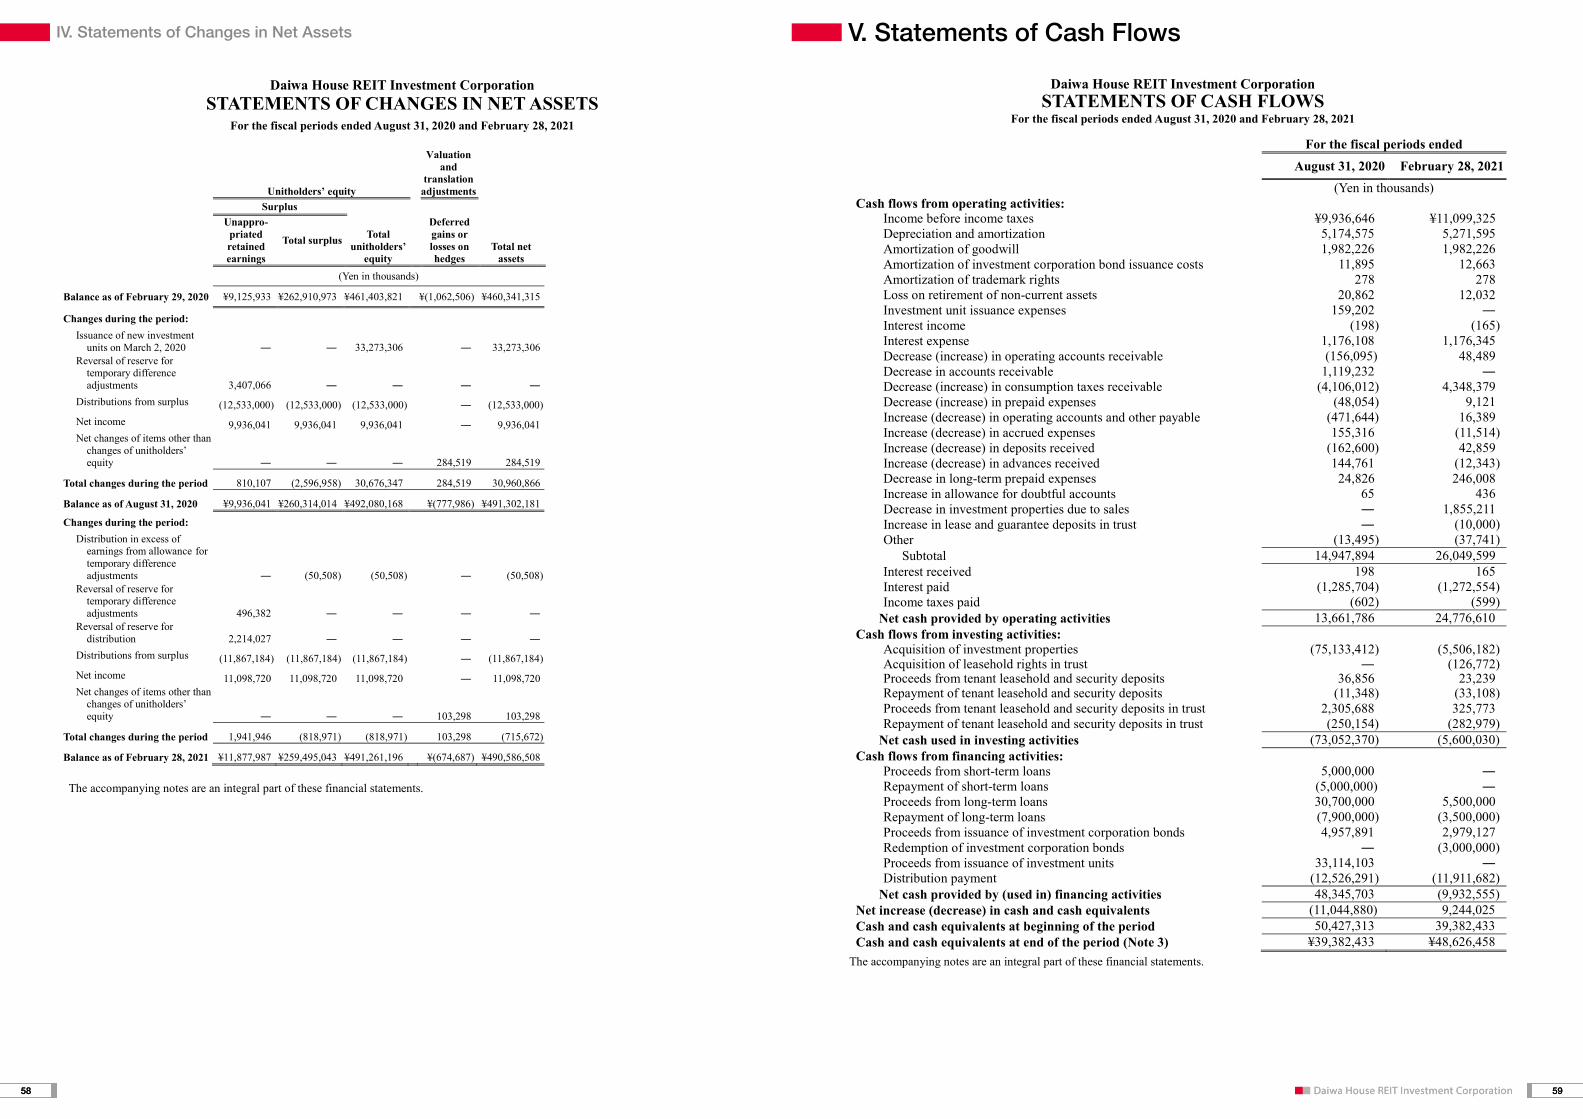
IV. Statements of Changes in Net Assets
Daiwa House REIT Investment Corporation STATEMENTS OF CHANGES IN NET ASSETS
For the fiscal periods ended August 31, 2020 and February 28, 2021
Unitholders’ equity
Valuation and
translation adjustments
Surplus
Unappro- priated retained earnings
Total surplus Total unitholders’
equity
Deferred gains or losses on hedges
Total net assets
(Yen in thousands)
Balance as of February 29, 2020 ¥9,125,933 ¥262,910,973 ¥461,403,821 ¥(1,062,506) ¥460,341,315
Changes during the period: Issuance of new investment
units on March 2, 2020 ― ― 33,273,306 ― 33,273,306 Reversal of reserve for
temporary difference adjustments 3,407,066 ― ― ― ―
Distributions from surplus (12,533,000) (12,533,000) (12,533,000) ― (12,533,000) Net income 9,936,041 9,936,041 9,936,041 ― 9,936,041 Net changes of items other than
changes of unitholders’ equity ― ― ― 284,519 284,519
Total changes during the period 810,107 (2,596,958) 30,676,347 284,519 30,960,866
Balance as of August 31, 2020 ¥9,936,041 ¥260,314,014 ¥492,080,168 ¥(777,986) ¥491,302,181
Changes during the period: Distribution in excess of
earnings from allowance for temporary difference adjustments ― (50,508) (50,508) ― (50,508)
Reversal of reserve for temporary difference adjustments 496,382 ― ― ― ―
Reversal of reserve for distribution 2,214,027 ― ― ― ―
Distributions from surplus (11,867,184) (11,867,184) (11,867,184) ― (11,867,184) Net income 11,098,720 11,098,720 11,098,720 ― 11,098,720 Net changes of items other than
changes of unitholders’ equity ― ― ― 103,298 103,298
Total changes during the period 1,941,946 (818,971) (818,971) 103,298 (715,672)
Balance as of February 28, 2021 ¥11,877,987 ¥259,495,043 ¥491,261,196 ¥(674,687) ¥490,586,508 The accompanying notes are an integral part of these financial statements.
V. Statements of Cash Flows
Daiwa House REIT Investment Corporation STATEMENTS OF CASH FLOWS
For the fiscal periods ended August 31, 2020 and February 28, 2021
For the fiscal periods ended August 31, 2020 February 28, 2021 (Yen in thousands) Cash flows from operating activities: Income before income taxes ¥9,936,646 ¥11,099,325 Depreciation and amortization 5,174,575 5,271,595 Amortization of goodwill 1,982,226 1,982,226 Amortization of investment corporation bond issuance costs 11,895 12,663 Amortization of trademark rights 278 278 Loss on retirement of non-current assets 20,862 12,032 Investment unit issuance expenses 159,202 ― Interest income (198) (165) Interest expense 1,176,108 1,176,345 Decrease (increase) in operating accounts receivable (156,095) 48,489 Decrease in accounts receivable 1,119,232 ― Decrease (increase) in consumption taxes receivable (4,106,012) 4,348,379 Decrease (increase) in prepaid expenses (48,054) 9,121 Increase (decrease) in operating accounts and other payable (471,644) 16,389 Increase (decrease) in accrued expenses 155,316 (11,514) Increase (decrease) in deposits received (162,600) 42,859 Increase (decrease) in advances received 144,761 (12,343) Decrease in long-term prepaid expenses 24,826 246,008 Increase in allowance for doubtful accounts 65 436
Decrease in investment properties due to sales ― 1,855,211 Increase in lease and guarantee deposits in trust ― (10,000) Other (13,495) (37,741)
Subtotal 14,947,894 26,049,599 Interest received 198 165 Interest paid (1,285,704) (1,272,554) Income taxes paid (602) (599)
Net cash provided by operating activities 13,661,786 24,776,610 Cash flows from investing activities: Acquisition of investment properties (75,133,412) (5,506,182)
Acquisition of leasehold rights in trust ― (126,772) Proceeds from tenant leasehold and security deposits 36,856 23,239
Repayment of tenant leasehold and security deposits (11,348) (33,108) Proceeds from tenant leasehold and security deposits in trust 2,305,688 325,773 Repayment of tenant leasehold and security deposits in trust (250,154) (282,979)
Net cash used in investing activities (73,052,370) (5,600,030) Cash flows from financing activities:
Proceeds from short-term loans 5,000,000 ― Repayment of short-term loans (5,000,000) ― Proceeds from long-term loans 30,700,000 5,500,000
Repayment of long-term loans (7,900,000) (3,500,000) Proceeds from issuance of investment corporation bonds 4,957,891 2,979,127 Redemption of investment corporation bonds ― (3,000,000) Proceeds from issuance of investment units 33,114,103 ― Distribution payment (12,526,291) (11,911,682)
Net cash provided by (used in) financing activities 48,345,703 (9,932,555) Net increase (decrease) in cash and cash equivalents (11,044,880) 9,244,025 Cash and cash equivalents at beginning of the period 50,427,313 39,382,433 Cash and cash equivalents at end of the period (Note 3) ¥39,382,433 ¥48,626,458
The accompanying notes are an integral part of these financial statements.
5958 5958

DHR’s fiscal period is a six-month period ending at end of February and August of each year.
Note 2 – Summary of Significant Accounting Policies
(a) Cash and Cash Equivalents
Cash and cash equivalents consist of cash on hand and in trust, bank deposits and deposits in trust redeemable on demand, and short-term investments, which are readily convertible to cash, with maturities of three months or less from the date of acquisition, and insignificant risk of market value fluctuation. (b) Investment Properties
Investment properties are stated at cost, net of accumulated depreciation. The cost of investment properties includes the allocated purchase price, related costs and expenses for acquisition. Depreciation is calculated on a straight-line basis over the estimated useful lives as stated below.
Years Buildings 2 – 69 Structures 3 – 63 Machinery and equipment 7 – 28 Tools, furniture and fixtures 2 – 28
Costs related to the renovation, construction and improvement of properties are capitalized. Expenditures for repairs
and maintenance, which do not add to the value or prolong the useful life of a property, are expensed as incurred.
(c) Intangible Assets
Intangible assets are amortized on a straight-line basis. The useful lives of major intangible assets are listed below.
Years Goodwill 20
Leasehold rights (general fixed-term land lease rights) are amortized on a straight-line basis over the life of each
contract.
(d) Investment Corporation Bond Issuance Costs
Investment corporation bond issuance costs are amortized on a straight-line basis over the redemption periods.
(e) Investment Unit Issuance Expenses The issuance costs of new investment units are expensed when incurred.
(f) Investment Securities
Held-to-maturity bonds are stated at amortized cost using the straight-line method.
Daiwa House REIT Investment Corporation Notes to Financial Statements
As of and for the fiscal periods ended August 31, 2020 and February 28, 2021
Note 1 – Organization and Basis of Presentation Organization
Daiwa House REIT Investment Corporation (“DHR”) is a real estate investment trust whose sponsor is Daiwa House Industry Co., Ltd. (“Daiwa House”) and whose asset manager is Daiwa House Asset Management Co., Ltd. (the “Asset Manager”), a wholly owned subsidiary of Daiwa House.
DHR was listed on the Real Estate Investment Trust (“REIT”) Market of Tokyo Stock Exchange, Inc. (“TSE”) on March 22, 2006, and then later merged with New City Residence Investment Corporation on April 1, 2010. Subsequently on December 1, 2011, DHR changed its corporate name to Daiwa House Residential Investment Corporation, and accordingly changed its investment targets to residential properties.
The former Daiwa House REIT Investment Corporation (the Daiwa House REIT Investment Corporation, which was dissolved upon the merger with DHR as of September 1, 2016, and hereinafter referred to as the “former DHR”) was established on September 14, 2007, whose asset manager was Daiwa House REIT Management Co., Ltd., a wholly owned subsidiary of Daiwa House. The former DHR was listed on the TSE REIT Market on November 28, 2012, as a REIT that targeted investment in logistics and retail properties.
On September 1, 2016, DHR merged with the former DHR in an absorption-type merger with DHR as the surviving corporation, and changed its corporate name from Daiwa House Residential Investment Corporation to Daiwa House REIT Investment Corporation.
After the merger, DHR shifted to a diversified portfolio strategy, targeting investment in new asset classes such as hotel and office properties, in addition to those that DHR and the former DHR had targeted for investment in the past. As of February 28, 2021, DHR’s portfolio included 227 properties at a total acquisition price of ¥820.1 billion.
Basis of Presentation
The accompanying financial statements have been prepared in accordance with the provisions set forth in the Act on Investment Trust and Investment Corporations (the “Investment Trust Act,” Act No. 198 of 1951, as amended), the Financial Instruments and Exchange Act of Japan and its related accounting regulations, and in conformity with accounting principles generally accepted in Japan (“Japanese GAAP”), which are different in certain respects as to application and disclosure requirements from International Financial Reporting Standards or accounting principles generally accepted in the United States of America.
The accompanying financial statements have been reformatted and translated into English from the financial statements of DHR prepared in accordance with Japanese GAAP. In preparing the accompanying financial statements, relevant notes have been expanded and certain reclassifications have been made from the Japanese GAAP financial statements. Certain supplementary information included in the statutory Japanese GAAP financial statements, but not required for fair presentation, is not presented in the accompanying financial statements.
DHR maintains its accounting records in Japanese yen, the currency of the country in which DHR operates. As permitted by the regulations under the Financial Instruments and Exchange Act, amounts of less than one thousand yen have been omitted. Unless otherwise specified, amounts of less than the units indicated are truncated, while values of ratios are rounded up or down to the nearest value of the last digit in the accompanying financial statements. As a result, totals shown in the accompanying financial statements do not necessarily agree with the sums of the individual amounts.
VI. Notes to Financial Statements
6160 6160
VI. Notes to Financial Statements
(g) Revenue Recognition
Rental revenues including fixed rent revenues, variable rent revenues and common area charges, are recognized on an accrual basis over the term of each lease agreement.
(h) Taxes on Property and Equipment
Property and equipment are subject to various taxes, such as property taxes and city planning taxes. An owner of a
property is registered in a record maintained by the local government of the applicable jurisdiction, and taxes are imposed on the owner registered in the record as of January 1, based on an assessment made by the local government. The taxes are determined in April to June of each year and are paid in four installments during the year.
When a property is purchased prior to January 1 of any given calendar year, taxes for the previous year are imposed on the seller. DHR pays the seller the corresponding amount of the taxes for the period from the property’s acquisition date to December 31 of the previous year as included in the purchase price of the property, and capitalizes this amount as an acquisition cost of the property.
(i) Income Taxes
Deferred tax assets and liabilities are computed based on the differences between the financial reporting and income
tax basis of assets and liabilities using the enacted tax rates.
(j) Allowance for Doubtful Accounts
To cover possible losses on collection, allowance for doubtful accounts is provided based on past experience for normal receivables and on an estimate of the collectability of receivables from companies in financial difficulty.
(k) Consumption Taxes
Consumption taxes withheld and consumption taxes paid are not included in the accompanying statements of
income and retained earnings. Non-deductible consumption taxes for acquisition of assets are added on to the acquisition cost of each asset.
(l) Trust Beneficiary Interests
For trust beneficiary interests in real estate, each of the trust assets and liabilities as well as all income generated
and expenses incurred in trusts are recorded in the relevant balance sheet and income statement accounts. (m) Derivatives and Hedge Accounting
Deferral hedge accounting is applied for derivatives. DHR uses interest-rate swaps as hedging instruments in order
to hedge the risk of interest rate fluctuations related to borrowings. Pursuant to Japanese GAAP, DHR applies the special accounting treatment to interest-rate swaps which qualify for hedge accounting and meet specific criteria. Under the special accounting treatment, the related differentials paid or received under such swap contracts can be recognized and included in interest expenses or income of the hedged assets or liabilities, and the interest-rate swaps are not required to be measured at fair value separately.
The assessment of hedge effectiveness is omitted when the significant terms of the hedged item and hedging instrument, including the notional principal amount, are the same and changes in cash flows of the hedged item can be expected to be offset in full from the commencement of a hedge relationship and continuously thereafter. The
assessment of hedge effectiveness is also omitted for all interest-rate swaps which meet the specific criteria under the special accounting treatment.
Note 3 – Cash and Cash Equivalents
Cash and cash equivalents shown in the statement of cash flows consist of the following balance sheet items.
As of August 31, 2020 February 28, 2021 (Yen in thousands) Cash and bank deposits ¥39,382,433 ¥48,626,458 Cash and cash equivalents ¥39,382,433 ¥48,626,458
Note 4 – Financial Instruments
(a) Qualitative Information on Financial Instruments
Policy on financial instruments
As a policy, when acquiring real estate and other properties, as well as when repaying its obligations, DHR raises necessary funds through loans from financial institutions, issuance of investment corporation bonds and issuance of investment units, etc. DHR carefully pays attention to ensure their financing to be long-term, cost effective and stable, while considering applying various financial methods and dispersing repayment dates.
DHR may use derivative financial instruments for such purposes as hedging interest rate fluctuation risk, but does not use them for speculative purposes. DHR currently uses interest-rate swaps to hedge interest rate fluctuation risk.
Surplus funds can be invested in securities or monetary claims; however, as a current policy of DHR, they are deposited in interest-bearing accounts.
Nature and extent of risks arising from financial instruments and risk management
The Asset Manager stipulates basic provisions of risk management in its risk management rules. Investment corporation bonds and loans are used to finance acquisitions of real estate and repayments of loans.
Although these financial instruments are exposed to liquidity risk, DHR controls such risk by maintaining the ratio of interest-bearing debt to total assets under a certain percentage, dispersing repayment dates, and retaining a certain amount of highly liquid cash and deposits.
Floating rate loans are exposed to the risk of interest rate fluctuations. In order to reduce the impact caused by rising interest rates, DHR closely monitors the movement of interest rates and intends to increase fixed rate loans.
Deposits are exposed to credit risks, including collapse of the financial institutions where deposits are made. DHR manages such risks through the use of liquid deposits.
6362

VI. Notes to Financial Statements
Supplemental explanation concerning fair value of financial instruments
The fair value of financial instruments is determined by market prices, if available. When there is no observable market price available, the fair value is based on a price that is reasonably estimated. Since certain assumptions and factors are reflected in estimating the fair value, different assumptions and factors could result in a different value.
(b) Estimated Fair Value of Financial Instruments
Book value on the balance sheet, fair value and the difference as of August 31, 2020 and February 28, 2021 are as follows:
As of August 31, 2020 February 28, 2021 (Yen in thousands) Assets Book value Fair value Difference Book value Fair value Difference (1) Cash and bank deposits ¥39,382,433 ¥39,382,433 ¥― ¥48,626,458 ¥48,626,458 ¥― (2) Investment securities:
Held-to-maturity bonds 9,411 9,317 (94) 9,428 9,221 (207)Total ¥39,391,844 ¥39,391,750 ¥(94) ¥48,635,887 ¥48,635,679 ¥(207)Liabilities (3) Current portion of
investment corporation bonds ¥3,000,000 ¥2,999,430 ¥(569) ¥4,000,000 ¥3,996,474 ¥(3,525)
(4) Current portion of long-term loans 16,000,000 16,027,321 27,321 26,358,000 26,389,911 31,911
(5) Investment corporation bonds 27,000,000 26,715,071 (284,928) 26,000,000 25,694,642 (305,357)
(6) Long-term loans 330,558,000 334,513,388 3,955,388 322,200,000 325,573,734 3,373,734 (7) Tenant leasehold and
security deposits in trust 513,958 504,710 (9,248) 480,948 470,352 (10,595)Total ¥377,071,958 ¥380,759,922 ¥3,687,964 ¥379,038,948 ¥382,125,116 ¥3,086,168 (8) Derivatives (*) ¥(777,986) ¥(777,986) ¥― ¥(674,687) ¥(674,687) ¥―
(*) Amounts arising from derivative transactions are shown on a net basis with any amounts inside parentheses ( )
indicating a net liability position. Notes: 1. Methods to estimate fair value of financial instruments and matters regarding derivatives
Assets:
(1) Cash and bank deposits These instruments are settled in the short term and their fair value is approximately equal to their book value. Thus, the book value is used as the fair value.
(2) Investment securities The fair value is based on reference statistical prices for OTC bond transactions. For the book value on the balance sheet and the fair value of held-to-maturity bonds, and the difference between the two values, please refer to Note 5 – “Investment Securities” below.
Liabilities:
(3) Current portion of investment corporation bonds and (5) Investment corporation bonds The fair value of these bonds is measured as the present value, which is calculated by discounting the total of principal and interest by the interest rate assumed based on the remaining period until maturity and credit risk.
(4) Current portion of long-term loans and (6) Long-term loans
For long-term loans with floating interest rates, their fair value is approximately equal to their book value. Thus, the book value is used as the fair value. However, for those which are hedged by interest rate swaps meeting hedge accounting criteria, DHR employs a method to calculate the fair value by discounting the total of the principal and interest accounted for under the special accounting treatment for interest rate swaps by an interest rate assumed to be applied if similar types of loans are entered into. For long-term loans with fixed interest rates, DHR employs a method to calculate the fair value by discounting the total of the principal and interest by an interest rate assumed to be applied if similar types of loans are entered into.
(7) Tenant leasehold and security deposits in trust For tenant leasehold and security deposit in trust whose fair value is reasonably estimated, the fair value is calculated by discounting future cash flows by the interest rate assumed for the remaining period of the lease.
(8) Derivatives
Please refer to Note 6 – “Derivative Transactions” below.
2. Financial instruments whose fair value is deemed extremely difficult to determine
As of August 31, 2020 February 28, 2021 (Yen in thousands) Tenant leasehold and security deposits ¥347,135 ¥333,342 Tenant leasehold and security deposits in trust 21,213,828 21,258,614
These are excluded from the scope of fair value disclosure because they are not marketable, and the actual deposit period is not estimable as leases may be cancelled, renewed or re-signed even if a lease term is set in the lease contract, which in turn makes it difficult to reasonably estimate future cash flows.
3. Redemption schedule for monetary claims after August 31, 2020 and February 28, 2021 is as follows:
As of August 31, 2020
Due within one year
Due after one to
two years
Due after two to
three years
Due after three to
four years
Due after four to five
years
Due after five years
(Yen in thousands) Cash and bank deposits ¥39,382,433 ¥― ¥― ¥― ¥― ¥― Investment securities ― ― ― ― ― 10,000 Total ¥39,382,433 ¥― ¥― ¥― ¥― ¥10,000
6564

VI. Notes to Financial Statements
As of February 28, 2021
Due within one year
Due after one to
two years
Due after two to
three years
Due after three to
four years
Due after four to five
years Due after five years
(Yen in thousands) Cash and bank deposits ¥48,626,458 ¥― ¥― ¥― ¥― ¥― Investment securities ― ― ― ― ― 10,000 Total ¥48,626,458 ¥― ¥― ¥― ¥― ¥10,000
4. Repayment schedule for investment corporation bonds and long-term loans after August 31, 2020 and February 28, 2021 is as follows:
As of August 31, 2020
Due within one year
Due after one to two
years
Due after two to
three years
Due after three to four
years
Due after four to five
years
Due after five years
(Yen in thousands) Investment corporation bonds (*) ¥3,000,000 ¥4,000,000 ¥― ¥― ¥7,400,000 ¥15,600,000 Long-term loans (*) 16,000,000 35,858,000 37,900,000 44,700,000 35,100,000 177,000,000 Total ¥19,000,000 ¥39,858,000 ¥37,900,000 ¥44,700,000 ¥42,500,000 ¥192,600,000
As of February 28, 2021
Due within one year
Due after one to two
years
Due after two to
three years
Due after three to four
years
Due after four to five
years
Due after five years
(Yen in thousands) Investment corporation bonds (*) ¥4,000,000 ¥― ¥― ¥5,000,000 ¥2,400,000 ¥18,600,000 Long-term loans (*) 26,358,000 42,500,000 42,100,000 35,100,000 44,600,000 157,900,000 Total ¥30,358,000 ¥42,500,000 ¥42,100,000 ¥40,100,000 ¥47,000,000 ¥176,500,000
(*) The figures above include the current portion.
Note 5 – Investment Securities
Investment securities held by DHR are Japanese government bonds deposited with the Tokyo Legal Affairs Bureau as business security deposits in accordance with the Building Lots and Building Transaction Business Act.
Book value on the balance sheet, fair value and the difference as of August 31, 2020 and February 28, 2021 are as follows:
As of August 31, 2020 February 28, 2021 (Yen in thousands) Book value Fair value Difference Book value Fair value Difference Fair value exceeding the book value
Held-to-maturity bonds: Government bonds ¥― ¥― ¥― ¥― ¥― ¥―
Subtotal ― ― ― ― ― ―
Fair value not exceeding the book value Held-to-maturity bonds: Government bonds 9,411 9,317 (94) 9,428 9,221 (207)
Subtotal 9,411 9,317 (94) 9,428 9,221 (207) Total ¥9,411 ¥9,317 ¥(94) ¥9,428 ¥9,221 ¥(207)
Note 6 – Derivative Transactions
(a) Derivative Transactions for Which Hedge Accounting Has Not Been Applied –– None
(b) Derivative Transactions for Which Hedge Accounting Has Been Applied
Contract amount or notional principal amount of derivative transactions classified by hedge accounting method is
as follows: As of August 31, 2020 February 28, 2021 (Yen in thousands)
Type of derivative transaction
Hedged item
Contract amount Fair value
Contract amount Fair value Total Due after
one year Total Due after
one year Principle method
Interest-rate swap Receive floating/ Pay fixed
Long-term loan ¥47,500,000 ¥44,500,000 ¥(777,986)
(Note 1)
¥47,500,000 ¥37,500,000 ¥(674,687)
(Note 1)
Special treatment for interest-rate swaps
Interest-rate swap Receive floating/ Pay fixed
Long-term loan 75,258,000 71,758,000 (Note 2)
71,758,000 64,900,000 (Note 2)
Total ¥122,758,000 ¥116,258,000 ¥(777,986) ¥119,258000 ¥102,400,000 ¥(674,687)
6766

VI. Notes to Financial Statements
Notes: 1. Fair value is quoted by counterparties based on the prevailing market interest rates. 2. Under the special accounting treatment, interest-rate swaps are accounted for as part of the long-term loans, the
hedged item; thus, the fair value is included in the fair value of the long-term loans. (Please refer to Note 4 – “Financial Instruments” above.)
Note 7 – Goodwill
On September 1, 2016, DHR merged with the former DHR in an absorption-type merger (the “Merger”) with DHR
as the surviving corporation and the former DHR as the absorbed corporation. On the business combination date, consideration given for the acquisition was ¥219,425,976 thousand, which was
the amount equivalent to the fair value of DHR investment units allotted, while the fair value of the net assets acquired from the former DHR was ¥140,136,912 thousand. The excess of the acquisition cost over the fair value of the net assets acquired, in the amount of ¥79,289,063 thousand, was recognized as goodwill upon the Merger. The amount of goodwill is amortized over 20 years using the straight-line method. As of August 31, 2020 and February 28, 2021, the unamortized balances of goodwill from the Merger were ¥63,431,250 thousand and ¥61,449,024 thousand, respectively.
Note 8 – Investment Properties
As of August 31, 2020 and February 28, 2021, investment properties consist of the following property and
equipment and property and equipment in trust. As of August 31, 2020 February 28, 2021 (Yen in thousands)
Acquisition cost
Accumulated depreciation Net Acquisition
cost Accumulated depreciation Net
Property and equipment: Land ¥22,350,209 ¥― ¥22,350,209 ¥21,711,324 ¥― ¥21,711,324 Buildings 26,599,067 5,413,936 21,185,130 25,375,403 5,404,035 19,971,367 Structures 249,240 53,848 195,392 231,826 51,462 180,364 Machinery and equipment 494,771 172,287 322,484 466,382 171,537 294,845 Tools, furniture and fixtures 748,522 455,107 293,414 714,203 453,849 260,353
Property and equipment in trust:
Land 385,966,267 ― 385,966,267 387,101,719 ― 387,101,719 Buildings 383,510,185 43,610,290 339,899,895 386,663,526 48,145,286 338,518,240 Structures 9,339,802 1,171,751 8,168,051 9,409,913 1,356,606 8,053,306 Machinery and equipment 2,722,078 1,285,302 1,436,775 2,742,297 1,372,731 1,369,566 Tools, furniture and fixtures 1,470,419 615,802 854,617 1,611,570 708,105 903,465 Construction in progress 170,792 ― 170,792 389,488 ― 389,488
Total ¥833,621,357 ¥52,778,326 ¥780,843,030 ¥836,417,656 ¥57,663,613 ¥778,754,043
Note 9 – Fair Value of Investment Properties
DHR owns logistics, residential, retail and hotel properties, and other assets for lease in the Tokyo metropolitan area and other areas for the purpose of earning rental revenues. The book value of these investment properties including leasehold rights in trust, net change in the book value and the fair value are as follows:
As of / For the fiscal periods ended August 31, 2020 February 28, 2021 (Yen in thousands) Book value:
Balance at beginning of the period ¥716,263,934 ¥786,688,719 Net change during the period 70,424,785 (2,009,627) Balance at end of the period ¥786,688,719 ¥784,679,091
Fair value at end of the period ¥906,406,000 ¥919,854,000
Notes: 1. The book value above includes leasehold rights in trust of ¥5,845,688 thousand and ¥5,925,048 thousand as of
August 31, 2020 and February 28, 2021, respectively. 2. For the period ended August 31, 2020, the increase is mainly due to acquisitions of four properties including
DPL Nagareyama I (¥74,081,988 thousand), while the decrease is mainly attributable to depreciation. For the period ended February 28, 2021, the increase is mainly due to acquisition of Candeo Hotels Nagasaki Shinchi Chinatown (¥3,162,154 thousand), while the decrease is mainly attributable to the sale of two properties including Castalia Maruyama Omotesando (¥1,840,959 thousand) and depreciation.
3. The fair value at end of the period represents the value assessed by third-party real estate appraisers. Note 10 – Rental Revenues and Expenses
Rental revenues generated from investment properties and related expenses for the periods ended August 31, 2020
and February 28, 2021 are as follows:
For the fiscal periods ended August 31, 2020 February 28, 2021 (Yen in thousands) Rental revenues:
Rental revenues ¥24,961,747 ¥25,543,608 Common area charges 537,592 559,314
Subtotal 25,499,339 26,102,923 Other revenues related to property leasing:
Facility charges 424,316 437,506 Incidental revenues 266,029 362,007 Other revenues 423,847 357,773 Subtotal 1,114,193 1,157,287
Total rental revenues ¥26,613,533 ¥27,260,211
6968
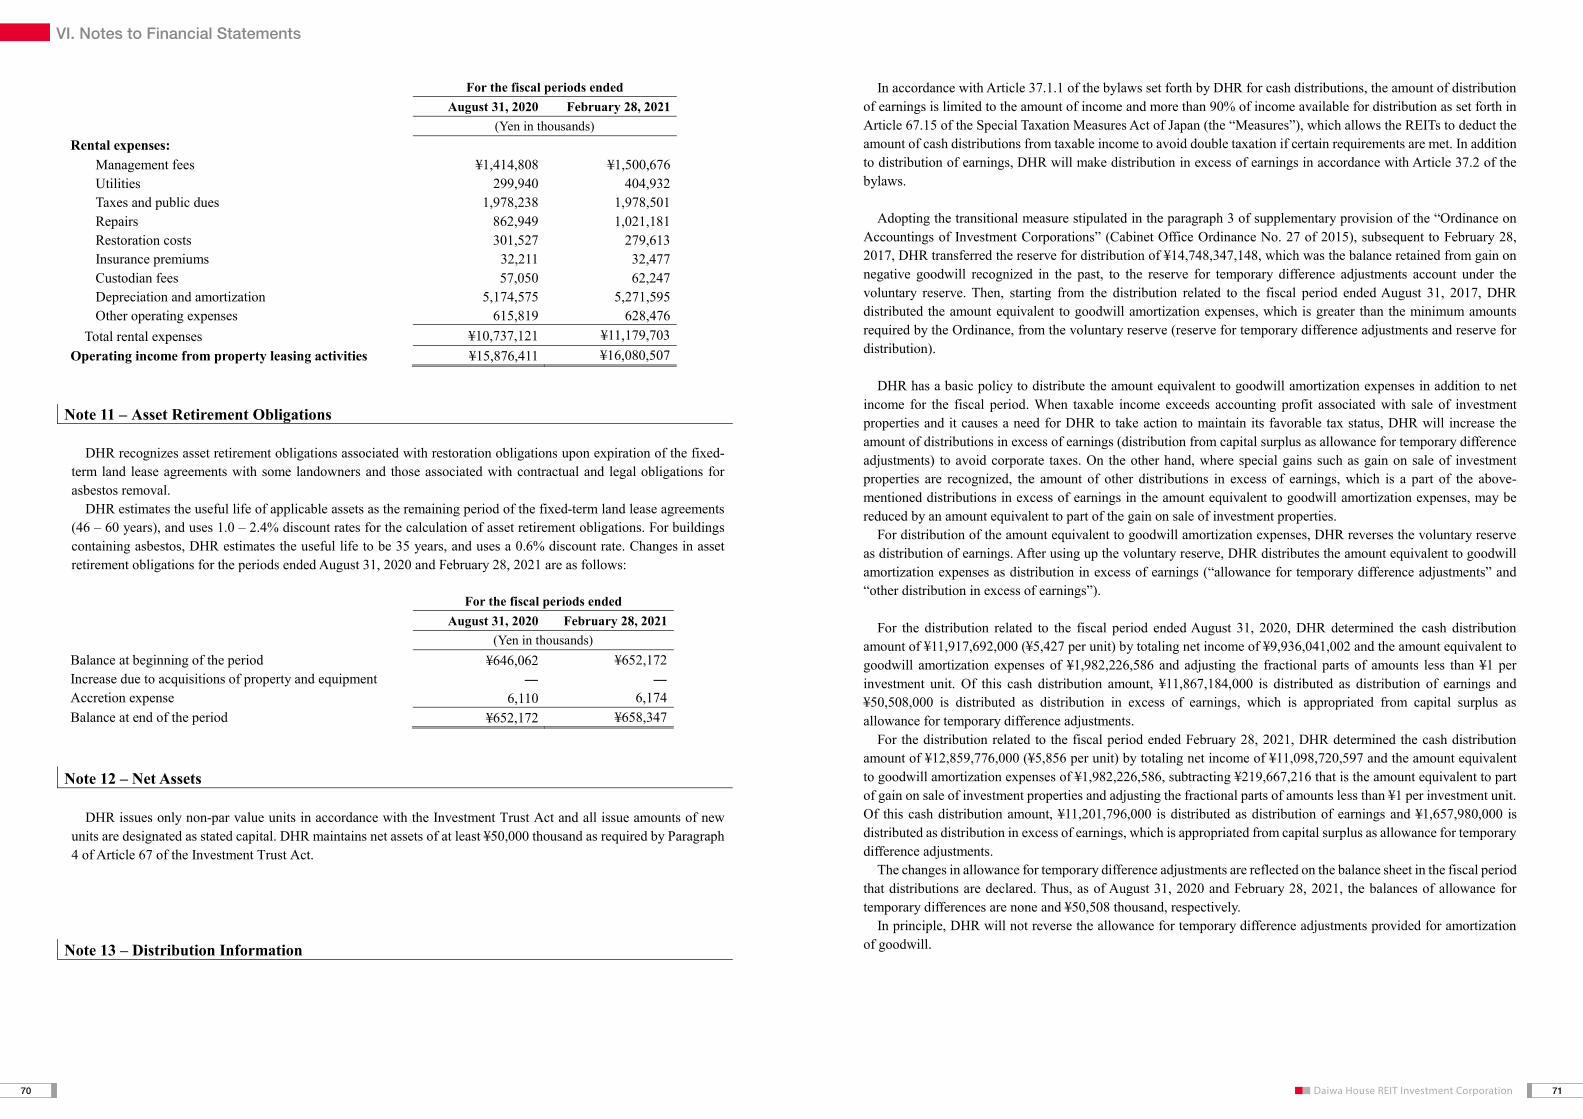
VI. Notes to Financial Statements
For the fiscal periods ended August 31, 2020 February 28, 2021 (Yen in thousands) Rental expenses:
Management fees ¥1,414,808 ¥1,500,676 Utilities 299,940 404,932 Taxes and public dues 1,978,238 1,978,501 Repairs 862,949 1,021,181 Restoration costs 301,527 279,613 Insurance premiums 32,211 32,477 Custodian fees 57,050 62,247 Depreciation and amortization 5,174,575 5,271,595 Other operating expenses 615,819 628,476
Total rental expenses ¥10,737,121 ¥11,179,703 Operating income from property leasing activities ¥15,876,411 ¥16,080,507
Note 11 – Asset Retirement Obligations
DHR recognizes asset retirement obligations associated with restoration obligations upon expiration of the fixed-
term land lease agreements with some landowners and those associated with contractual and legal obligations for asbestos removal.
DHR estimates the useful life of applicable assets as the remaining period of the fixed-term land lease agreements (46 – 60 years), and uses 1.0 – 2.4% discount rates for the calculation of asset retirement obligations. For buildings containing asbestos, DHR estimates the useful life to be 35 years, and uses a 0.6% discount rate. Changes in asset retirement obligations for the periods ended August 31, 2020 and February 28, 2021 are as follows: For the fiscal periods ended August 31, 2020 February 28, 2021 (Yen in thousands) Balance at beginning of the period ¥646,062 ¥652,172 Increase due to acquisitions of property and equipment ― ― Accretion expense 6,110 6,174 Balance at end of the period ¥652,172 ¥658,347
Note 12 – Net Assets
DHR issues only non-par value units in accordance with the Investment Trust Act and all issue amounts of new units are designated as stated capital. DHR maintains net assets of at least ¥50,000 thousand as required by Paragraph 4 of Article 67 of the Investment Trust Act.
Note 13 – Distribution Information
In accordance with Article 37.1.1 of the bylaws set forth by DHR for cash distributions, the amount of distribution of earnings is limited to the amount of income and more than 90% of income available for distribution as set forth in Article 67.15 of the Special Taxation Measures Act of Japan (the “Measures”), which allows the REITs to deduct the amount of cash distributions from taxable income to avoid double taxation if certain requirements are met. In addition to distribution of earnings, DHR will make distribution in excess of earnings in accordance with Article 37.2 of the bylaws.
Adopting the transitional measure stipulated in the paragraph 3 of supplementary provision of the “Ordinance on
Accountings of Investment Corporations” (Cabinet Office Ordinance No. 27 of 2015), subsequent to February 28, 2017, DHR transferred the reserve for distribution of ¥14,748,347,148, which was the balance retained from gain on negative goodwill recognized in the past, to the reserve for temporary difference adjustments account under the voluntary reserve. Then, starting from the distribution related to the fiscal period ended August 31, 2017, DHR distributed the amount equivalent to goodwill amortization expenses, which is greater than the minimum amounts required by the Ordinance, from the voluntary reserve (reserve for temporary difference adjustments and reserve for distribution).
DHR has a basic policy to distribute the amount equivalent to goodwill amortization expenses in addition to net
income for the fiscal period. When taxable income exceeds accounting profit associated with sale of investment properties and it causes a need for DHR to take action to maintain its favorable tax status, DHR will increase the amount of distributions in excess of earnings (distribution from capital surplus as allowance for temporary difference adjustments) to avoid corporate taxes. On the other hand, where special gains such as gain on sale of investment properties are recognized, the amount of other distributions in excess of earnings, which is a part of the above-mentioned distributions in excess of earnings in the amount equivalent to goodwill amortization expenses, may be reduced by an amount equivalent to part of the gain on sale of investment properties.
For distribution of the amount equivalent to goodwill amortization expenses, DHR reverses the voluntary reserve as distribution of earnings. After using up the voluntary reserve, DHR distributes the amount equivalent to goodwill amortization expenses as distribution in excess of earnings (“allowance for temporary difference adjustments” and “other distribution in excess of earnings”).
For the distribution related to the fiscal period ended August 31, 2020, DHR determined the cash distribution
amount of ¥11,917,692,000 (¥5,427 per unit) by totaling net income of ¥9,936,041,002 and the amount equivalent to goodwill amortization expenses of ¥1,982,226,586 and adjusting the fractional parts of amounts less than ¥1 per investment unit. Of this cash distribution amount, ¥11,867,184,000 is distributed as distribution of earnings and ¥50,508,000 is distributed as distribution in excess of earnings, which is appropriated from capital surplus as allowance for temporary difference adjustments.
For the distribution related to the fiscal period ended February 28, 2021, DHR determined the cash distribution amount of ¥12,859,776,000 (¥5,856 per unit) by totaling net income of ¥11,098,720,597 and the amount equivalent to goodwill amortization expenses of ¥1,982,226,586, subtracting ¥219,667,216 that is the amount equivalent to part of gain on sale of investment properties and adjusting the fractional parts of amounts less than ¥1 per investment unit. Of this cash distribution amount, ¥11,201,796,000 is distributed as distribution of earnings and ¥1,657,980,000 is distributed as distribution in excess of earnings, which is appropriated from capital surplus as allowance for temporary difference adjustments.
The changes in allowance for temporary difference adjustments are reflected on the balance sheet in the fiscal period that distributions are declared. Thus, as of August 31, 2020 and February 28, 2021, the balances of allowance for temporary differences are none and ¥50,508 thousand, respectively.
In principle, DHR will not reverse the allowance for temporary difference adjustments provided for amortization of goodwill.
7170

VI. Notes to Financial Statements
Distributions related to the period but declared after the balance sheet date are summarized as follows:
For the fiscal periods ended August 31, 2020 February 28, 2021
(Yen) Total Per unit Total Per unit Unappropriated retained earnings ¥9,936,041,002 ¥11,877,987,944 Reversal of voluntary reserve: Reserve for temporary difference adjustments 496,382,622 ― Reserve for distribution 2,214,027,723 ― Deduction from capital surplus: Allowance for temporary difference adjustments 50,508,000 1,657,980,000 ¥12,696,959,347 ¥13,535,967,944 Cash distributions: Distribution of earnings ¥11,867,184,000 ¥5,404 ¥11,201,796,000 ¥5,101 Distribution in excess of earnings 50,508,000 23 1,657,980,000 755 Total cash distributions ¥11,917,692,000 ¥5,427 ¥12,859,776,000 ¥5,856 Retained earnings carried forward ¥779,267,347 ¥676,191,944
Note 14 – Investment Corporation Bonds
The following summarizes the status of the DHR’s unsecured investment corporation bonds with special pari passu
conditions among specified investment corporation bonds as of August 31, 2020 and February 28, 2021. The bonds are to be repaid on a lump-sum basis on the maturity date.
As of
Bond series Issue date Maturity date Interest rate
August 31, 2020 February 28, 2021 (Yen in thousands)
Daiwa House REIT Investment Corporation 1st Unsecured Bonds
December 24, 2014
December 24, 2024 0.826% ¥2,000,000 ¥2,000,000
Daiwa House Residential Investment Corporation 2nd Unsecured Bonds
January 22, 2015
January 22, 2021 0.35% 3,000,000 ―
Daiwa House Residential Investment Corporation 3rd Unsecured Bonds
January 22, 2015
January 22, 2025 0.67% 3,000,000 3,000,000
Daiwa House REIT Investment Corporation 5th Unsecured Bonds
December 20, 2016
December 20, 2021 0.24% 4,000,000 4,000,000
Daiwa House REIT Investment Corporation 6th Unsecured Bonds
December 20, 2016
December 18, 2026 0.57% 4,000,000 4,000,000
Daiwa House REIT Investment Corporation 7th Unsecured Bonds
July 30, 2018 July 30, 2030 0.69% 2,000,000 2,000,000
As of
Bond series Issue date Maturity date Interest rate
August 31, 2020 February 28, 2021 (Yen in thousands)
Daiwa House REIT Investment Corporation 8th Unsecured Bonds
July 30, 2018 July 30, 2038 1.03% 1,000,000 1,000,000
Daiwa House REIT Investment Corporation 9th Unsecured Bonds (Green Bonds)
November 25, 2019
November 22, 2029 0.53% 6,000,000 6,000,000
Daiwa House REIT Investment Corporation 10th Unsecured Bonds (Green Bonds)
May 27, 2020 May 27, 2025 0.34% 2,400,000 2,400,000
Daiwa House REIT Investment Corporation 11th Unsecured Bonds (Green Bonds)
May 27, 2020 May 27, 2030 0.64% 1,600,000 1,600,000
Daiwa House REIT Investment Corporation 12th Unsecured Bonds (Green Bonds)
May 27, 2020 May 25, 2040 1.00% 1,000,000 1,000,000
Daiwa House REIT Investment Corporation 13th Unsecured Bonds
December 24, 2020
December 24, 2032 0.60% ― 3,000,000
Total ¥30,000,000 ¥30,000,000 Note 15 – Long-Term Loans
Long-term loans consist of borrowings from financial institutions under loan agreements. None of the loans are
secured by collateral or guaranteed. The following table summarizes long-term loans as of August 31, 2020 and February 28, 2021.
As of August 31, 2020 February 28, 2021
Due date (Yen in thousands) Interest rate (Yen in thousands) Interest
rate Long-term loans:
Floating-rate loan (*) January 31, 2021 ¥3,500,000 0.90% ¥― ―% Floating-rate loan (*) April 1, 2021 3,000,000 1.05 3,000,000 1.05 Floating-rate loan (*) November 30, 2021 7,000,000 0.51 7,000,000 0.51 Fixed-rate loan April 30, 2021 9,500,000 0.40 9,500,000 0.40 Floating-rate loan (*) January 31, 2022 6,858,000 0.61 6,858,000 0.61 Floating-rate loan (*) April 28, 2022 10,000,000 0.66 10,000,000 0.66 Floating-rate loan (*) December 28, 2022 10,500,000 0.59 10,500,000 0.59 Floating-rate loan (*) April 1, 2022 3,500,000 1.21 3,500,000 1.21 Floating-rate loan (*) October 3, 2022 3,000,000 0.87 3,000,000 0.87
7372

VI. Notes to Financial Statements
As of August 31, 2020 February 28, 2021
Due date (Yen in thousands) Interest rate (Yen in thousands) Interest
rate Floating-rate loan (*) September 28, 2022 4,000,000 0.65 4,000,000 0.65 Fixed-rate loan September 9, 2022 1,000,000 0.43 1,000,000 0.43 Fixed-rate loan April 28, 2022 6,500,000 0.42 6,500,000 0.42 Floating-rate loan August 31, 2022 2,000,000 0.24 2,000,000 0.25 Floating-rate loan October 31, 2022 2,000,000 0.29 2,000,000 0.29 Floating-rate loan (*) March 27, 2023 2,000,000 1.50 2,000,000 1.50 Fixed-rate loan September 29, 2023 1,000,000 1.00 1,000,000 1.00 Floating-rate loan (*) October 2, 2023 4,000,000 0.99 4,000,000 0.99 Floating-rate loan (*) May 31, 2023 4,000,000 0.71 4,000,000 0.71 Fixed-rate loan March 31, 2023 10,400,000 0.41 10,400,000 0.41 Fixed-rate loan September 29, 2023 10,000,000 0.57 10,000,000 0.57 Fixed-rate loan March 31, 2023 1,000,000 0.44 1,000,000 0.44 Fixed-rate loan September 29, 2023 1,000,000 0.43 1,000,000 0.43 Floating-rate loan September 29, 2023 6,700,000 0.27 6,700,000 0.28 Fixed-rate loan January 31, 2024 2,000,000 0.88 2,000,000 0.88 Floating-rate loan (*) April 1, 2024 3,000,000 1.52 3,000,000 1.52 Fixed-rate loan September 30, 2024 1,000,000 0.73 1,000,000 0.73 Fixed-rate loan March 29, 2024 11,000,000 0.48 11,000,000 0.48 Fixed-rate loan March 29, 2024 1,000,000 0.55 1,000,000 0.55 Fixed-rate loan April 30, 2024 5,000,000 0.52 5,000,000 0.52 Fixed-rate loan October 31, 2024 8,100,000 0.39 8,100,000 0.39 Fixed-rate loan October 31, 2024 6,000,000 0.35 6,000,000 0.35 Floating-rate loan (*) October 1, 2025 4,000,000 1.23 4,000,000 1.23 Fixed-rate loan October 1, 2025 3,000,000 1.18 3,000,000 1.18 Floating-rate loan (*) May 30, 2025 4,000,000 0.97 4,000,000 0.97 Fixed-rate loan September 29, 2025 9,000,000 0.63 9,000,000 0.63 Fixed-rate loan March 31, 2025 11,000,000 0.70 11,000,000 0.70 Fixed-rate loan April 30, 2025 5,000,000 0.60 5,000,000 0.60 Fixed-rate loan September 30, 2025 1,000,000 0.60 1,000,000 0.60 Fixed-rate loan September 30, 2025 7,600,000 0.43 7,600,000 0.43 Floating-rate loan (*) April 1, 2026 2,000,000 2.03 2,000,000 2.03 Floating-rate loan (*) May 29, 2026 4,000,000 1.09 4,000,000 1.09 Fixed-rate loan September 28, 2026 1,000,000 0.69 1,000,000 0.69 Fixed-rate loan November 30, 2026 15,000,000 0.87 15,000,000 0.87 Fixed-rate loan April 30, 2026 10,000,000 0.76 10,000,000 0.76 Fixed-rate loan April 30, 2026 2,000,000 0.65 2,000,000 0.65 Fixed-rate loan April 30, 2026 1,000,000 0.45 1,000,000 0.45 Fixed-rate loan April 30, 2026 1,000,000 0.40 1,000,000 0.40 Fixed-rate loan March 31, 2026 500,000 0.40 500,000 0.40 Fixed-rate loan September 30, 2026 500,000 0.41 500,000 0.41 Fixed-rate loan March 31, 2026 ― ― 1,000,000 0.44 Fixed-rate loan April 1, 2027 1,500,000 1.46 1,500,000 1.46 Fixed-rate loan March 31, 2027 2,000,000 0.85 2,000,000 0.85 Fixed-rate loan July 30, 2027 12,100,000 0.89 12,100,000 0.89
As of August 31, 2020 February 28, 2021
Due date (Yen in thousands) Interest rate (Yen in thousands) Interest
rate Fixed-rate loan November 30, 2027 16,000,000 0.90 16,000,000 0.90 Fixed-rate loan September 30, 2027 1,500,000 0.75 1,500,000 0.75 Fixed-rate loan April 30, 2027 500,000 0.50 500,000 0.50 Fixed-rate loan July 30, 2027 8,400,000 0.46 8,400,000 0.46 Fixed-rate loan September 30, 2027 ― ― 1,000,000 0.46 Fixed-rate loan April 28, 2028 10,000,000 1.02 10,000,000 1.02 Fixed-rate loan April 28, 2028 10,000,000 0.89 10,000,000 0.89 Fixed-rate loan December 29, 2028 5,000,000 0.88 5,000,000 0.88 Fixed-rate loan April 28, 2028 1,500,000 0.59 1,500,000 0.59 Fixed-rate loan September 29, 2028 1,000,000 0.51 1,000,000 0.51 Fixed-rate loan January 31, 2028 ― ― 3,500,000 0.37 Floating-rate loan (*) April 27, 2029 10,400,000 0.75 10,400,000 0.75 Floating-rate loan (*) November 30, 2029 10,000,000 0.66 10,000,000 0.66 Fixed-rate loan January 31, 2029 1,500,000 0.59 1,500,000 0.59 Floating-rate loan (*) April 27, 2029 5,000,000 0.51 5,000,000 0.51 Floating-rate loan (*) January 31, 2030 9,000,000 0.61 9,000,000 0.61 Floating-rate loan (*) April 30, 2030 10,000,000 0.62 10,000,000 0.62
Total long-term loans 346,558,000 348,558,000 Less: current portion (16,000,000) (26,358,000)
Long-term loans, less current portion ¥330,558,000 ¥322,200,000 (*) DHR entered into an interest-rate swap contract to hedge its exposure to interest rate fluctuation risk. The stated
interest rate includes the effect of the interest-rate swap. The stated interest rate is the weighted average interest rate for the applicable fiscal period and is rounded to the
second decimal place. The repayment schedule for long-term loans subsequent to August 31, 2020 and February 28, 2021 is disclosed in
Note 4 – “Financial Instruments.”
DHR has entered into a commitment line agreement with four financial institutions in order to secure flexible and stable financing. The status of the commitment line agreement as of August 31, 2020 and February 28, 2021 is as follows:
7574

VI. Notes to Financial Statements
As of August 31, 2020 February 28, 2021 (Yen in thousands) Total amount of commitment line ¥25,000,000 ¥25,000,000
Balance executed as loans ― ― Unused line of credit ¥25,000,000 ¥25,000,000
Note 16 – Lease Transactions
Future minimum lease revenues under existing non-cancelable operating leases as of August 31, 2020 and February 28, 2021 are as follows:
As of August 31, 2020 February 28, 2021 (Yen in thousands)
Due within one year ¥28,359,709 ¥28,549,133 Due after one year 197,790,715 187,631,003 Total ¥226,150,425 ¥216,180,136
Note 17 – Deferred Income Taxes
DHR is subject to Japanese corporate income taxes on all of its taxable income. However, DHR may deduct the amount distributed to its unitholders from its taxable income when certain requirements, including a requirement to distribute in excess of 90% of distributable profit for the fiscal period, are met under the Measures. If DHR does not satisfy all of the requirements as specified in the Measures, the entire taxable income of DHR will be subject to regular corporate income taxes in Japan.
(a) Significant Components of Deferred Tax Assets and Liabilities
As of August 31, 2020 February 28, 2021 (Yen in thousands)
Deferred tax assets:
Excess provision of allowance for doubtful accounts ¥333 ¥471 Deferred interest income 222,265 187,672 Valuation difference at the time of merger
(Land and Buildings) 2,405,915 2,329,948
Asset retirement obligations 205,173 207,115 Deferred gains or losses on hedges 244,754 212,256 Amortization of fixed-term land lease rights 166,616 181,532 Other 9,505 8,914
Subtotal 3,254,564 3,127,912 Valuation reserve (3,254,564) (3,127,912)
Total deferred tax assets ― ―
Deferred tax liabilities: Valuation difference at the time of merger
(Investment securities) ¥(677) ¥(657)
Valuation difference at the time of merger (Land and Buildings) (13,421,536) (13,376,015)
Asset retirement costs (176,025) (176,009) Subtotal (13,598,239) (13,552,682)
Valuation reserve 13,598,239 13,552,682 Total deferred tax liabilities ― ― Net deferred tax assets ¥― ¥―
Based on the cash distribution policy set forth in Article 37 of the Articles of Incorporation, DHR may distribute
an amount of cash that exceeds profit in order to minimize taxable income. DHR does not assume corporate income tax payments in future accounting periods; therefore, deferred tax liabilities are not recorded.
(b) Significant Differences Between the Statutory Tax Rate and the Effective Tax Rate After
Applying Deferred Income Tax Accounting The following table summarizes the significant differences between the statutory tax rate and DHR’s effective tax
rate for financial statement purposes.
7776

VI. Notes to Financial Statements
For the fiscal periods ended August 31, 2020 February 28, 2021 Statutory tax rate 31.46% 31.46% Adjustments:
Tax-deductible cash distributions paid (37.19) (36.45) Use of loss carryforward assumed at the time of merger ― (0.20) Amortization of goodwill 6.28 5.62 Change in valuation allowance (0.55) (0.44) Other 0.02 0.01
Effective tax rate 0.01% 0.01%
Note 18 – Gain on Sale of Investment Properties
For the period ended August 31, 2020, DHR did not sell any investment properties.
For the period ended February 28, 2021, DHR sold two investment properties and reported gains as follows:
For the fiscal period
ended February 28, 2021 (Yen in thousands) Castalia Maruyama Urasando
Proceeds from sale of investment properties ¥720,000 Cost of investment properties sold 350,389 Other sales expenses 25,260 Gain on sale of investment properties ¥344,350
Castalia Maruyama Omotesando Proceeds from sale of investment properties ¥2,055,000 Cost of investment properties sold 1,490,569 Other sales expenses 71,985 Gain on sale of investment properties ¥492,445
Note 19 – Per Unit Information
Earnings per unit for the periods ended August 31, 2020 and February 28, 2021 and net assets per unit as of August 31, 2020 and February 28, 2021 are as follows:
For the fiscal periods ended August 31, 2020 February 28, 2021
(Yen) Earnings per unit:
Net income per unit ¥4,525 ¥5,054 Weighted average number of units outstanding (units) 2,195,342 2,196,000
As of August 31, 2020 February 28, 2021 (Yen) Net assets per unit ¥223,725 ¥223,400
Net income per unit is calculated by dividing net income by the weighted average number of investment units
during the period. Net assets per unit are calculated by dividing net assets by the number of units outstanding at each balance sheet date. Diluted earnings per unit are not disclosed since there were no diluted units.
Note 20 – Related-Party Transactions
Related-party transactions for the periods ended August 31, 2020 and February 28, 2021 are as follows:
(a) Controlling Company and Major Corporate Investors –– None
(b) Affiliates –– None
(c) Transactions under Common Control –– None
(d) Directors and Major Individual Investors –– None
Note 21 – Segment Information
(a) Segment Information
Since DHR has been engaged in a single segment of the real estate leasing business, and there is no other business
segment for disclosure, segment information has been omitted.
(b) Related Information Information about products and services
Since operating revenues from external customers for a single segment of product and service account for over 90%
of total operating revenues in DHR’s statements of income and retained earnings for the periods ended August 31, 2020 and February 28, 2021, information about products and services has been omitted.
Information about geographic areas
(1) Operating revenues
Since operating revenues from external customers within Japan account for over 90% of total operating revenues in DHR’s statements of income and retained earnings for the periods ended August 31, 2020 and February 28, 2021, information about geographic areas has been omitted.
7978

VI. Notes to Financial Statements
(2) Investment properties Since over 90% of total investment properties on the balance sheets as of August 31, 2020 and February 28,
2021, are located within Japan, information about geographic areas on such investment properties has been omitted.
Information about major customers
Since there is not any customer accounting for 10% or more of total operating revenues in DHR’s statements of income and retained earnings for the periods ended August 31, 2020 and February 28, 2021, information about major customers has been omitted.
Note 22 – Accounting Standards Issued But Not Yet Applied
As of February 28, 2021, DHR has not yet applied the following accounting standards and their implementation
guidance.
(a) Accounting Standard for Revenue Recognition and its Implementation Guidance
“Accounting Standard for Revenue Recognition” (Accounting Standards Board of Japan (“ASBJ”) Statement No. 29, March 31, 2020)
“Implementation Guidance on Accounting Standard for Revenue Recognition” (ASBJ Guidance No. 30, March 31, 2020)
“Implementation Guidance on Disclosures about Fair Value of Financial Instruments” (ASBJ Guidance No. 19, March 31, 2020)
(1) Overview
Conducting a joint project to clarify the comprehensive principles for recognizing revenues, the International Accounting Standards Board (“IASB”) and the Financial Accounting Standards Board (“FASB”) in the U.S. issued “Revenue from Contracts with Customers” (IFRS 15 by IASB and Topic 606 by FASB) in May 2014. IFRS 15 became effective from fiscal periods beginning on or after January 1, 2018 and Topic 606 became effective from fiscal periods beginning after December 15, 2017. Under these circumstances, ASBJ also developed a comprehensive accounting standard for revenue recognition and issued a new standard together with its implementation guidance.
As a basic policy for the development of the new standard, ASBJ determined to adopt the core principles of IFRS 15 in order to enhance comparability of financial statements, which is one of the benefits of consistency with IFRS 15. In addition, for any item to be considered arising from business practices in Japan, alternative treatments shall be added to the extent that comparability is not impaired.
(2) Scheduled date of application
DHR will apply the aforementioned standard and guidance from the beginning of the fiscal period ending February 28, 2022.
(3) Effect of application of the new accounting standard
The effect of application of the aforementioned standard on DHR’s financial statements is currently under evaluation.
(b) Accounting Standard for Fair Value Measurement and its Implementation Guidance
“Accounting Standard for Fair Value Measurement” (ASBJ Statement No. 30, July 4, 2019) “Implementation Guidance on Accounting Standard for Fair Value Measurement” (ASBJ Guidance No. 31, July 4,
2019) “Implementation Guidance on Disclosures about Fair Value of Financial Instruments” (ASBJ Guidance No. 19,
March 31, 2020)
(1) Overview Developing accounting standards for fair value measurement, IASB and FASB issued new common fair value
measurement in May 2011 (IFRS 13 by IASB and update to Topic 820 by FASB). IFRS 13 became effective from fiscal periods beginning on or after January 1, 2013 and Topic 820 became effective from fiscal periods beginning after December 15, 2011. Under these circumstances, ASBJ also developed an accounting standard for fair value measurement and issued a new standard together with its implementation guidance.
As a basic policy for the development of the new standard, ASBJ determined to generally adopt all the principles of IFRS 13 in order to enhance comparability of financial statements among domestic and overseas companies, by applying the consistent measurement methods. However, for any item to be considered arising from business practices in Japan, other treatment for the item shall be determined to the extent that comparability is not impaired.
(2) Scheduled date of application
DHR will apply the aforementioned standard and guidance from the beginning of the fiscal period ending February 28, 2022.
(3) Effect of application of the new accounting standard
The effect of application of the aforementioned standard on DHR’s financial statements has not yet been evaluated.
(c) Accounting Standard for Disclosure of Accounting Estimates
“Accounting Standard for Disclosure of Accounting Estimates” (ASBJ Statement No. 31, March 31, 2020) (1) Overview
The ASBJ issued this accounting standard in response to requests to develop an accounting standard which requires a footnote information similar to the disclosure requirement as to “key sources of estimation uncertainty” prescribed in Paragraph 125 of the International Accounting Standard (“IAS”) 1 “Presentation of Financial Statements” issued in 2003, since it is very useful information for users of financial statements.
The basic policy of the ASBJ in developing this accounting standard is not to expand the number of individual notes, but to set out the disclosure principles. Thus, the entity shall judge the specific content of disclosure details based on the purpose of disclosure. In developing this standard, the ASBJ referred to the provisions of Paragraph 125 of IAS 1. (2) Scheduled date of application
DHR will apply the aforementioned standard from the end of the fiscal period ending August 31, 2021.
(d) Accounting Standard for Accounting Policy Disclosures, Accounting Changes and Error Corrections
“Accounting Standard for Accounting Policy Disclosures, Accounting Changes and Error Corrections” (ASBJ
Statement No. 24, March 31, 2020)
8180
VI. Notes to Financial Statements
(1) Overview This accounting standard was developed to enhance the footnote information as to the accounting principles and
procedures adopted in cases where related provisions of accounting standards are not clear. The accounting standard requires to take over the provisions of the explanatory paragraph of Corporate Accounting Principles (Note 1-2) in order not to affect the current practice when related provisions of accounting standards are clear. (2) Scheduled date of application
DHR will apply the aforementioned standard from the end of the fiscal period ending August 31, 2021.
Note 23 – Subsequent Events
Not applicable.
8382
VII. Independent Auditor’s Report
8584
VII. Independent Auditor's Report
8786 8786

180,000
240,000
300,000
360,000
60,000
120,000
Mar. 22,2006
May 31,2006
Nov. 30,2006
May 31,2007
Nov. 30,2007
May 31,2008
Nov. 30,2008
May 31,2009
Nov. 30,2009
Aug. 31,2010
Feb. 28,2011
Aug. 31,2011
Feb. 29,2012
Aug. 31,2012
Feb. 28,2013
Aug. 31,2013
Feb. 28,2014
Aug. 31,2014
Feb. 28,2015
Aug. 31,2015
Feb. 29,2016
Aug. 31,2016
Feb. 28,2017
Aug. 31,2017
Feb. 28,2018
Aug. 31,2018
Feb. 28,2019
Aug. 31,2019
Feb. 28,2021
Aug. 31,2020
Feb. 29,2020
0 0
10,000
20,000
30,000
40,000
80,000
120,000
Highest price during the 30th fiscal period (closing price): ¥298,300 Lowest price during the 30th fiscal period (closing price): ¥240,600 Investment unit price at the end of the 30th fiscal period (closing price):¥279,600
Investment unit price (closing price)
(Yen)
Trading volume
(Units)
Investment unit price (Yen)
Trading volume (Units)
(Note) A 2-for-1 split of investment units was implemented on two occasions, effective as of March 1, 2013 and March 1, 2015. With regard to investment unit price and trading volume until February 25, 2013, the value shown for investment unit price is divided by four, while the value shown for trading volume is multiplied by four in consideration of the said split of investment units. Furthermore, from February 26, 2013 to February 24, 2015, the value shown for investment unit price is divided by two, and the value shown for trading volume is multiplied by two.
Corporate Name : Daiwa House Asset Management Co., Ltd.
Location : 7th Floor, Nissei Nagatacho Building, 2-4-8, Nagatacho, Chiyoda-ku, Tokyo 100-0014
Established : September 1, 2004
Paid-in Capital : ¥300 million
Shareholder : Daiwa House Industry Co., Ltd. (100%)
Please submit changes of address, name, etc., to your securities company, etc. For procedures regarding investment units registered in
special accounts, please contact: Stock Transfer Agency Business Planning Dept. of Sumitomo Mitsui Trust Bank, Limited.
Procedures for Changes of Address, etc.
You can receive distributions when you bring your receipt for distributions to the local office of the Japan Post Bank in Japan or to a post office
(bank agent). If the period for receiving distributions has elapsed, please contact the transfer agent Sumitomo Mitsui Trust Bank, Limited.
If you would like to specify an account to which future distributions will be transferred, please follow the procedures of your securities company, etc.
We will not pay and have no obligation to pay cash distributions not claimed within three years of the distribution date, as stipulated in our Articles
of Incorporation. Please receive your distributions as soon as possible.
Receipt of Distributions
The “Distribution Statement” delivered upon payment of distributions includes the “Payment Notice,” referred to in the provisions of the Act on
Special Measures Concerning Taxation. This document may be used as a document when declaring income for tax purposes. However, for
unitholders who have selected the system of dividend allotment to securities company accounts in proportion to the number of shares held, the
amount of withholding tax will be calculated by your securities company, etc. For supporting documents when declaring income for tax purposes
please confirm with your securities company, etc. Furthermore, unitholders who receive distributions by way of a receipt for distributions also
receive a “Distribution Statement” enclosed with it.
Distribution Statement
Residents in Japan are notified of their Social Security and Tax Number (nicknamed “My Number”) by their city, town or village. My Number
is required when performing tax-related procedures with regard to investment units.
As stipulated by laws and regulations, it is now required to state the My Number of the unitholder on payment records that are submitted to the tax office.Unitholders are therefore requested to submit their My Number to their securities company.
Use of the My Number for Investment Unit Related Business
[Contact address for inquiries on submitting My Number] Unitholders whose investment units are managed by a securities account
Please direct your inquiries to your securities company, etc. Unitholders not conducting transactions via a securities company
Please call the following toll-free phone number. Stock Transfer Agency Business Planning Dept. of Sumitomo Mitsui Trust Bank, Limited TEL: 0120-782-031
Outline of the Social Security and Tax Number System Nicknamed “My Number System” with Regard to Investment Units
Account closing date Last day of February and August of each year
Date for determining distribution payments
Last day of February and August of each year(Distributions are to be paid within three months of each date.)
Unitholders’ Meeting To be held at least once every two years
Date for finalizing general meeting voting rights
Date set forth in Section 16.1 in the Articles of Incorporation by DHR
Listing REIT section of the Tokyo Stock Exchange (Securities code: 8984)
Public notices The “Nikkei” newspaper (Nihon Keizai Shimbun)
Transfer agent4-1, Marunouchi 1-chome, Chiyoda-ku, Tokyo 100-8233, JAPANSumitomo Mitsui Trust Bank, Limited
Inquiries
8-4, Izumi 2-chome, Suginami-ku, Tokyo 168-0063, JAPANStock Transfer Agency Business Planning Dept. of Sumitomo Mitsui Trust Bank, Limited TEL: 0120-782-031 (toll-free, available within Japan only) Weekdays 9 a.m. to 5 p.m.
Note for Unitholders
8988
Investment Unit Price
Unitholders Data (as of February 28, 2021)
Outline of the Asset Manager
Investor Information
(Note) Ratios in parentheses are rounded to the nearest tenth.
Number ofunitholders
(19,059)
Number ofinvestment
units(2,196,000 units)
226,364 units(10.3%)
507,413 units(23.1%)
103,882 units(4.7%)
122,330 units(5.6%)
17,847(93.6%)
410(2.2%)
27(0.1%)
554(2.9%)
221(1.2%)
1,236,011 units(56.3%)
Individuals / Other Foreign corporations and individuals Securities firms Other domestic corporations Financial institutions