30 August 2021 - bochk.com
35
30 August 2021
Transcript of 30 August 2021 - bochk.com

30 August 2021

2
Disclaimer
This presentation and subsequent discussions may contain forward-looking statements that involve risks anduncertainties. These statements are generally indicated by the use of forward-looking terminology such as believe,expect, anticipate, estimate, plan, project, target, may or will, or may be expressed as being the results of actions thatmay or are expected to occur in the future. You should not place undue reliance on these forward-looking statements,which reflect our belief only as of the date of this presentation. These forward-looking statements are based on ourown information and on information from other sources we believe to be reliable. Our actual results may be materiallyless favorable than those expressed or implied by these forward-looking statements which could depress the marketprice of our Level 1 ADSs and local shares.

OutlookStrategy Review
02
Financial & Business Results
0301

Strategy Review
01

Operating profit before impairment
allowances rebounded HoH*
5
Profit after taxationHK$13.6bn
8.42%Return on average
shareholders’ equity
Interim dividend per shareHK$0.447
1H20212H20201H2020
*After excluding the impact of disposal gain of debt securities investment, operating profit before impairment allowance was HK$17,017mn, -8.4% YoY, +13.7% HoH
HK$mn
21,154
16,973 17,468
-17.4%
YoY
+2.9%
HoH

6
Mid to high-end customers:
Wealth management income: +33%Asset under management: +18%
Sustained market leadership in new residential mortgage loans business
Monthly average number of online mortgage applications: +2.6x
BOC Life: Standard new premiums +15.5%; bancassurance sales rank#1 in 1Q2021
Personal Banking
Cemented market-leading position: HK/Macao syndicated loan, IPO receiving bank business
Cash pooling business covering 29countries and regions
Bond issue underwriting amount: +36%
Assets under custody: +6.2%
BOCI Prudential: MPF AUM +5.9%
Top 5 position in the MPF market
Corporate Banking
Captured market opportunities, RMB transaction volume for clients:
+34%
Built online trading platform to enhance service capability, incomefrom clients’ online transactions:
+14%
BOCHK Asset Management: steady increase in AUM
Financial Markets

Cross-border Remittance & PaymentRemittance amount under A/C Opening service
+142% with total transactions +119%
Launched GBA Youth Card to provide
young people with integrated services
Wealth Management Connect
Strive to be the first to launch cross-
border service and establish market
leadership
Solid customer base with cross-
border mid to high-end customer
AUM +7% YoY
Financial Intermediation
Support customers’ cross-border business
needs, with GBA loans +8%
Cross-border Mortgage ServiceProvided a series of loan products and enhanced the whole customer journey
Hong Kong
7
Innovative Technology EnterprisesSupported the development of innovative tech enterprises, with
number of customers +11% and
loans +7%

Laos
CambodiaThailand
Brunei
Philippines
Malaysia
Vietnam
Myanmar
Indonesia
HK$62.6bn+9.4% YTD
HK$55.5bn+2.6% YTD
HK$1,289mn 1.75%-0.15pp YTD-1.2% YoY
Customer deposits Customer loans
Net operating income NPL ratio
8
Remark: Customer deposits, customer loans and net operating income represent theconsolidated data for 9 Southeast Asian entities which were prepared in accordancewith Hong Kong Financial Reporting Standards; NPL ratio was calculated based ontheir local regulatory requirements.

+14.1%
RMB deposits
+23.6%
RMB loans
+27.6%
RMB clearingtransaction volume*
• Appointed Managing Director of RMB Business and established a flexible organisation to steer RMB business development
• Strengthened intra-group collaboration to expand business scenarios for offshore RMB financing, payment and settlement
• Launched innovative service such as the market-making mechanism of PBoC bills repo business, and onshore RMB interest rate swap
• Manila Branch officially launched RMB clearing service in January 2021
• Developed personal cross-border RMB business, with Jakarta Branch’s direct RMB salary remittance volume growing by 82%
• Established FXall e-trading platform at BOC Malaysia and BOC Thailand to promote direct RMB exchange with domestic currencies
*through RMB RTGS in Hong Kong
9

▪ Mobile banking: registered customers
+7.8%; transaction volume +60%
▪ iGTB platform extended to 8 Southeast
Asian entities with >90% customers online
▪ Improved efficiency of middle and back
office by 50% through greater use of robotic automation in relevant processes
▪ Introduced cybersecurity surveillanceservice to identify potential vulnerabilities
▪ Newly launched online WM services such as RM Chat, online investment, online insurance, NotALot and Stocks Widget
▪ Launched one-stop wealth planning service PlanAhead
▪ Online WM investment accounted for 80%
with total volume +106%
▪ BOCL’s standard new premium through
e-channel ranked #1 in the market
10
▪ Launched online real-time property valuation API with cumulative usage exceeded 5.5mn times
▪ BoC Bill: network coverage +7.9%;transaction volume +20.2%
▪ BoC Pay: customers +17.6%;transaction volume +68.8% ;supported merchant networks of 29mnin Mainland and 67,000 in HK
▪ FPS registered customers grew 20.1%
Enhance digital infrastructure Expand digital application Enrich digital service scenarios

Green financing
Caring for society
Social recognition
Green/Sustainable loans: +1.6x Green deposits: took HK$1.9bn
Launched BOCHK All-Weather ESG Multi-Asset Fund, the first ESG fund with RMB share class in Hong Kong market
Successfully issued a total of RMB1.5bn of Sustainable and Smart Living themed green bonds
Approx. 30% market share under Special 100% Personal Loan Guarantee Scheme
Subscription numbers of iBond and Silver Bond through BOCHK topped the market
Launched online service channels for Community Care Fund to help reduce poverty
Officially enrolled as supporter of Task Force on Climate-related Financial Disclosures (TCFD) in May 2021
MSCI ESG Research LLC rating: AA
Hong Kong Business Sustainability Index, Greater Bay Area Business Sustainability Index and Greater China Business Sustainability Index: Exemplar, the highest in banking industry
11

02
Financial & Business Results

Profit after taxation HK$13.6bn
Taxation & others
1H2020 Net interest income*
Impairment allowances
Net gain/(loss) from disposal of/fair value
adjustments on investment properties
1H2021Operating expenses
16,161 (3,564)
184 48513,591
7447
13
(1,351)
1,222
Net fee income
Other non-
interest income*
* Including the funding income or cost of FX swap contracts
HK$m
Operating Environment Weighed on Earnings

2,182,5942,295,051
2021.062020.12
68.8%66.8%
CASA*Balance:+8.3%
Customer deposits* up 5.2%
Enhanced Deposit Mix
Increase in market share*
14
Deposit market share
Market share* 15.21%
Up 0.22 ppt
* Adjusted for IPO-related impact
HK$m
Current and savingdeposits* (CASA)
Time and other deposits

Customers loan* up 6.1% Increase in market share*
15
+9.1%
588,494
+3.8%
468,957
+1.9%
448,465
+26.1%
83,850
2021.062020.12 Loan market share
Market share* 13.99%
up 0.23 ppt
Loans for use in HK –corporate*
Loans for use in HK -individuals
Loans for use outside HK
Trade financing
HK$m
Solid Customer Loan Growth
* Adjusted for IPO-related impact

Stabilising Margin Levels
Margin* impacted by market interest rates
16
2Q211Q20 2Q20 1Q213Q20 4Q20
Steady AIEA Growth
Net interest income*
Average interest - earnings assets (AIEA)
2,651,178
2,823,333 2,977,664
19,818
16,556 16,254
1H20 2H20 1H21
+12.3% YoY
1H20: 1.50%
1.61%
1.39%
1.17% 1.16% 1.11% 1.09%
0.0%
0.5%
1.0%
1.5%
2.0%
1H21: 1.10%
1M HIBORNIM* 1M LIBOR
2H20: 1.16%
*Including the funding income or cost of FX swap contracts
Market data source: Bloomberg
HK$m

2,687 2,782 2,882
2,722 3,014 3,441
1,389 921
1,793
Net fee income up 22.5% YoY Growth efforts paid off
17
Drove wealth business growth
Mid to high-end customers +18% YoY
Inv. & insurance commissions +26.4%
Traditional business underpinned by
economic recovery
Trust and custody service fees +16.1%
Bills commissions +15.5%1H20211H2020
5,407
6,657
2H2020
5,435
Net fee and commission incomeCredit related business - loan commissionsInvestment and insurance related businessesNon-credit related business - traditional fee services
HK$m
Strong Net Fee Income Growth

Cost to income ratio outperformed marketFlattish operating expenses
Good Operating Efficiency
18
29
7,589
5 (14) (27)
7,582
1H2020 1H2021
42.0%
49.2%
26.4%30.3%
1H20211H2020
*
Data source: Hong Kong Monetary Authority
*1Q2021
BOCHKMarket average
HK$m
Staff costs
Premises & equipment
OthersDepre-ciation
& amorti-sation

1H20211H2020
831
67 -40
72
682 504
408 429
733
0.18% 0.15% 0.16%
1,3111,1979,172
10,200
0.27%
0.32%
Prudent level of provisionsManageable asset quality risk
Solid Asset Quality
19
2021.062020.12
Loan impairment allowancesNPL ratio* Annualised
credit cost* Stage 1 Stage 2
Net charge of impairment allowances - advances & other accounts
Stage 3
1,178
2H2020
NPL provision coverage ratio
229.64% 200.91%
* Adjusted for IPO-related impact
HK$m HK$m

Sufficient capital
Adequate Capital and Liquidity
Sound liquidity positions
20
- 2.31ppt
19.79%
17.61%
15.95%
2021.062020.12
- 2.06ppt
- 1.80ppt
Average LCR Average NSFR
1H20212H2020
131.87%120.31%
134.15%121.70%Total
capital ratio
Tier 1capital ratio
CET 1capital ratio
*Negative impact from IPO-related business on total capital ratio, Tier 1 capital ratio and CET1 capital ratio is 1.40ppt, 1.25ppt and 1.13ppt respectively

03
Outlook

22
Divergent economic recovery due to the evolving global pandemic development
Low interest rate environment continues to weigh on banking sector
Digitalisation and low carbon transition prompts banks to expedite transformation
Solid growth of Mainland economy with high-level opening-up
Orderly implementation in GBA construction alongside deepened mutual market access schemes
Global focus gradually shifts to Asia with promising ASEAN economic outlook
Special position and advantages of Hong Kong as a “Super-connector”
Volatile financial markets driven by potential shift in monetary
policies of major economies

23
Strategic Goals & Values Work Priorities

Appendices

Income statement summary (HK$m) 1H2021 1H2020 Change
Net interest income 15,942 18,636 -14.5%
Net fee and commission income 6,657 5,435 22.5%
Other non-interest income 2,451 4,672 -47.5%
Net operating income before impairment allowances 25,050 28,743 -12.8%
Operating expenses (7,582) (7,589) -0.1%
Pre-provision Operating Profit (PPoP) 17,468 21,154 -17.4%
Net charge of impairment allowances (1,182) (1,366) -13.5%
Operating profit 16,286 19,788 -17.7%
Profit for the period 13,591 16,161 -15.9%
Balance sheet summary (HK$m) 2021.06 2020.12 Change
Total assets 3,834,870 3,320,981 15.5%
Advances to customers 1,744,953 1,497,864 16.5%
Advances to customers (ex-IPO) 1,589,766 1,497,864 6.1%
Total liabilities 3,512,577 3,001,326 17.0%
Deposits from customers 2,682,440 2,183,709 22.8%
Deposits from customers (ex-IPO ) 2,295,051 2,182,594 5.2%
Capital and reserves attributable to equity holders 322,293 319,655 0.8%
Income Statement and Balance Sheet Summary
Per share (HK$) 1H2021 1H2020 Change
Basic earnings per share 1.1895 1.4385 -0.2490
Dividend per share 0.4470 0.4470 -
25

(HK$m) / %Assets
1H2021 1H2020
Average balance Average yield Average balance Average yield
Balances and placements with banks and other financial institutions
385,213 0.80% 305,597 1.09%
Debt securities investments and other debt instruments 970,458 1.27% 839,362 2.04%
Advances to customers and other accounts 1,604,278 1.52% 1,478,356 2.52%
Other interest-earning assets 17,715 0.70% 27,863 1.09%
Total interest-earning assets 2,977,664 1.34% 2,651,178 2.19%
Net interest margin 1H2021 1H2020
Net interest margin 1.08% 1.41%
Net interest margin (adjusted)* 1.10% 1.50%
Liabilities1H2021 1H2020
Average balance Average rate Average balance Average rate
Deposits and balances from banks and other financial institutions
203,553 0.44% 197,300 0.77%
Current, savings and time deposits 2,263,622 0.30% 1,964,093 0.94%
Subordinated liabilities - - 2,920 5.50%
Other interest- bearing liabilities 18,178 1.09% 36,464 1.40%
Total interest-bearing liabilities 2,485,353 0.32% 2,200,777 0.94%
26
Average Balances and Average Interest Rates
* Included the funding income or cost of FX swap contracts

HK$m 1H2021 1H2020 Change
Securities brokerage 2,189 1,567 39.7%
Loan commissions 1,793 1,389 29.1%
Credit card business 996 924 7.8%
Insurance 734 713 2.9%
Funds distribution 518 442 17.2%
Payment services 374 358 4.5%
Trust and custody services 374 322 16.1%
Bills commissions 321 278 15.5%
Currency exchange 58 157 -63.1%
Safe deposit box 151 153 -1.3%
Others 608 495 22.8%
Fees and commission income 8,116 6,798 19.4%
Fees and commission expense (1,459) (1,363) 7.0%
Net fee and commission income 6,657 5,435 22.5%
27
Fee and Commission Income

HK$m 1H2021 1H2020 Change
Staff costs 4,389 4,384 0.1%
Premises & equipment expenses 579 550 5.3%
Depreciation and amortisation 1,515 1,529 -0.9%
Others 1,099 1,126 -2.4%
Total operating expenses 7,582 7,589 -0.1%
28
Operating Expenses

HK$m 2021.06 2020.12 Change
Total deposits from customers 2,682,440 2,183,709 22.8%
CASA 1,967,144 1,459,261 34.8%
Demand deposits and current accounts 776,366 310,226 150.3%
Saving deposits 1,190,778 1,149,035 3.6%
Time, call and notice deposits 715,296 724,448 -1.3%
Total deposits from customers (ex-IPO) 2,295,051 2,182,594 5.2%
CASA (ex-IPO) 1,579,755 1,458,146 8.3%
29
Customer Deposits

HK$m 2021.06 2020.12 Change
Loans for use in Hong Kong - industrial, commercial and financial 743,681 539,633 37.8%
Property development 155,058 132,966 16.6%
Property investment 83,542 64,768 29.0%
Financial concerns 25,558 24,110 6.0%
Stockbrokers 111,359 1,656 6624.6%
Wholesale and retail trade 31,533 30,523 3.3%
Manufacturing 45,164 53,629 -15.8%
Transport and transport equipment 73,872 74,633 -1.0%
Recreational activities 185 198 -6.6%
Information technology 28,980 25,579 13.3%
Others 188,430 131,571 43.2%
Loans for use in Hong Kong - individuals 468,957 451,824 3.8%
Loans for the purchase of flats in Home Ownership Scheme, Private Sector Participation Scheme and Tenants Purchase Scheme 28,475 27,809 2.4%
Loans for purchase of other residential properties 326,062 311,070 4.8%
Credit card advances 10,591 10,959 -3.4%
Others 103,829 101,986 1.8%
Trade financing 83,850 66,497 26.1%
Loans for use outside HK 448,465 439,910 1.9%
Gross advances to customers 1,744,953 1,497,864 16.5%
Gross advances to customers (ex-IPO) 1,589,766 1,497,864 6.1% 30
Advances to Customers

31
HK$m2021.06 2020.12
Stage 1 Stage 2 Stage 3 Total Stage 1 Stage 2 Stage 3 Total
Advances to customers 1,709,615 30,261 5,077 1,744,953 1,470,492 23,378 3,994 1,497,864
Pass 1,706,445 26,463 - 1,732,908 1,466,646 20,352 - 1,486,998
Special mention 3,170 3,798 - 6,968 3,846 3,026 - 6,872
Substandard or below - - 5,077 5,077 - - 3,994 3,994
Trade bills 11,746 - - 11,746 9,826 - - 9,826
Pass 11,746 - - 11,746 9,826 - - 9,826
Special mention - - - - - - - -
Substandard or below - - - - - - - -
Advances to banks and other financial institutions 1,355 - - 1,355 1,898 - - 1,898
Pass 1,355 - - 1,355 1,898 - - 1,898
Special mention - - - - - - - -
Substandard or below - - - - - - - -
Gross advances and other accounts 1,722,716 30,261 5,077 1,758,054 1,482,216 23,378 3,994 1,509,588
Impairment allowances (5,357) (1,599) (3,246) (10,202) (5,405) (1,115) (2,652) (9,172)
Advances and other accounts 1,717,359 28,662 1,831 1,747,852 1,476,811 22,263 1,342 1,500,416
Gross Advances and Other Accounts by Internal Credit Grade and Stage Classification

38%
13%
15%
34%
Central government, central government owned entities and theirsubsidiaries and joint venturesLocal governments, local government owned entities and theirsubsidiaries and joint venturesPRC nationals residing in Mainland or other entities incorporated inMainland and their subsidiaries and joint venturesOthers
39%
20%
16%
9%4%11%
Property development & investmentElectricity and gasManufacturingTransport and transport equipmentHotel, Inn and food & beverageOthers 32
HK$m (* Adjusted for IPO-related impact)On-balance sheet exposure
Off-balancesheet exposure
Total exposureTotal loans and
advancesO/W: for use in
MainlandDebt securities
and othersSubtotal
Central government, central government-owned entities and their subsidiaries and joint ventures*
295,205 85,092 96,753 391,958 43,072 435,030
Local governments, local government-owned entities and their subsidiaries and joint ventures*
63,663 27,978 2,011 65,674 8,388 74,061
PRC nationals residing in Mainland or other entities incorporated in Mainland and their subsidiaries and joint ventures *
115,528 33,609 8,844 124,372 31,846 156,218
Others* 109,579 75,974 1,125 110,704 12,984 123,689Sub-total 583,975 222,653 108,733 692,708 96,290 788,998IPO financing 37,601 - - 37,601 - 37,601
Total 621,576 222,653 108,733 730,309 96,290 826,599
With reference to the completion instructions for the HKMAreturn of Mainland activities (note 44 of Notes to the InterimFinancial Information of 2021 Interim Report), as of 30 June2021, the total on-balance sheet non-bank Mainlandexposure was HK$730.3bn.
Excluding the IPO impact, the total on-balance sheet non-bank Mainland exposure was HK$692.7bn, up 7% from theend of last year, accounting for 21.7% of total assets. Ofwhich, total loans and advances was HK$584.0bn, upHK$29.1bn or 5.3% YTD. Asset quality was stable with NPLratio of 0.22%. Loan for use in Mainland was HK$222.7bn,accounting for 14.0% of total loans of the Group.
CustomerStructure
Sector Structure
Non-bank Mainland Exposures
Analysis of the loans and advances for use in Mainland

33
As of 30 June 2021, customer loan exposure to industries (incl. trading, retail, aviation, tourism(incl. hospitality), F&B, entertainment) severely affected
by Covid-19 amounted to HK$162.8bn, accounting for 10.24% of total loans, an increase of HK$11.9 bn and 0.17 ppt from 31 Dec 2020, respectively
Exposure by customer type: 91.7% to large corporates, up 0.9ppt; 8.3% to SMEs
Asset quality: Special mention loans totalled HK$2,250m, accounting for 1.38% of the relevant loan balances; non-performing loans were HK$1,070m, accounting for 0.66% of the relevant loan balances. Overall asset quality remained stable
Pass97.96%
Special mention
1.38%
Non-performing
0.66%
Pass Special mention Non-performing
Exposure by customer type Asset quality
Loan Exposure to Vulnerable Sectors
91.7%
8.3%
Large corporates SMEs
34
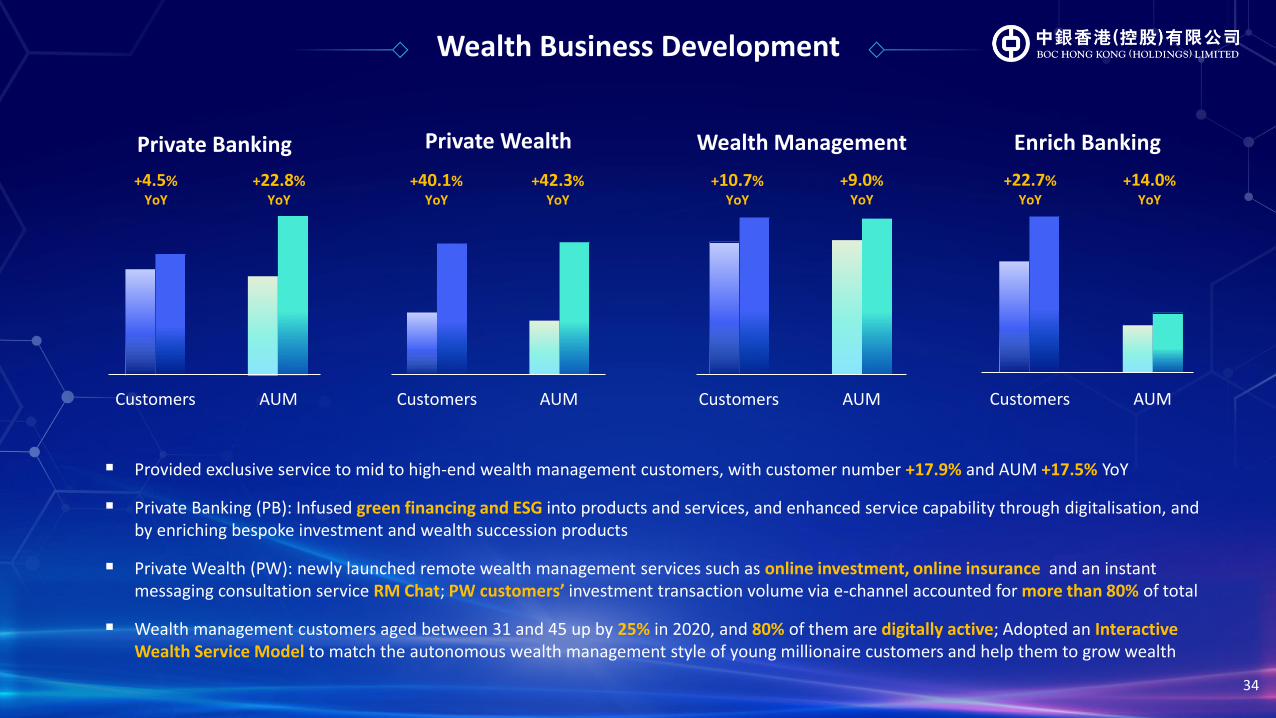
▪ Provided exclusive service to mid to high-end wealth management customers, with customer number +17.9% and AUM +17.5% YoY
▪ Private Banking (PB): Infused green financing and ESG into products and services, and enhanced service capability through digitalisation, and by enriching bespoke investment and wealth succession products
▪ Private Wealth (PW): newly launched remote wealth management services such as online investment, online insurance and an instant messaging consultation service RM Chat; PW customers’ investment transaction volume via e-channel accounted for more than 80% of total
▪ Wealth management customers aged between 31 and 45 up by 25% in 2020, and 80% of them are digitally active; Adopted an Interactive Wealth Service Model to match the autonomous wealth management style of young millionaire customers and help them to grow wealth
Private Banking Private Wealth Wealth Management Enrich Banking
Customers AUM
+4.5%YoY
+22.8%YoY
+40.1%YoY
+42.3%YoY
+10.7%YoY
+9.0%YoY
+22.7%YoY
+14.0%YoY
Customers AUM Customers AUM Customers AUM
Wealth Business Development

35
Rose to 2nd in the market
*Statistics from Insurance Authority: Direct Distribution Channel include online channel sales, direct mail and telesales with majority coming from online channel sales
◼ In 1Q21, BOC Life’s standard newpremium market share was 17.1%, a riseto 2nd place ranking from 3rd in 2020
◼ Kept diversifying distribution channels,maintained leading market position inbancassurance sales, and proactivelyexpanded its tied agency and brokerchannels. In 1H21, standard newpremiums conducted via tied agencyincreased by 95% YoY
◼ At the forefront of the Qualifying DeferredAnnuity Policy (QDAP) market sincelaunch in 2019
◼ Maintained RMB insurance marketleadership, with share of 89.6% in 1Q21
◼ In 1H21, RMB standard new premiumincreased by 65% YoY, proportion oftotal standard new premiums increasedfrom 28% to 40%
17.1%
BOC Life
Other Insurance Companies
89.6%
RMB insurance business
61.5%
E-Channel
BOC Life
Other Insurance Companies
◼ E-channel* market share reached61.5% in 1Q21, maintaining leadership
◼ Standard new premiums conducted viae-channel rose by 25% YoY in 1H21
BOC Life Business Development
Top RMB insurance business and E-Channel* Player
A
A1MOODY’S
STANDARD
&POOR’S
HK$m 1H2021 1H2020 Change
Standard new premium 6,286 5,442 15.5%
Profit before tax 513 392 30.9%
Total assets190,041
(2021.06)
164,982(2020.06)
15.2%
179,865(2020.12)
5.7%