30-Appendix XXX Organ Weight Statistical Report
54
E0219001 Statistical Report Analysis of Interim Sacrifice Organ Weight 1 NCTR PROTOCOL E0219001 TWO YEAR CHRONIC TOXICOLOGY STUDY OF BISPHENOL A (BPA) [CAS # 80-05-7] ADMINISTERED BY GAVAGE TO SPRAGUE-DAWLEY RATS (NCTR) FROM GESTATIONAL DAY 6 UNTIL BIRTH AND DIRECTLY TO F1 PUPS FROM POSTNATAL DAY (PND) 1; CONTINUOUS AND STOP DOSE (PND 21) EXPOSURES STATISTICAL REPORT STATISTICAL ANALYSIS OF INTERIM SACRIFICE ORGAN WEIGHT DATA PREPARED BY BETH E. JULIAR DIVISION OF BIOINFORMATICS AND BIOSTATISTICS FOR NATIONAL CENTER FOR TOXICOLOGICAL RESEARCH 3900 NCTR ROAD JEFFERSON, ARKANSAS 72079
Transcript of 30-Appendix XXX Organ Weight Statistical Report

E0219001 Statistical Report
Analysis of Interim Sacrifice Organ Weight
1
NCTR PROTOCOL E0219001
TWO YEAR CHRONIC TOXICOLOGY STUDY OF BISPHENOL A (BPA) [CAS # 80-05-7] ADMINISTERED BY GAVAGE TO SPRAGUE-DAWLEY RATS (NCTR) FROM GESTATIONAL DAY 6 UNTIL BIRTH AND DIRECTLY TO F1 PUPS FROM POSTNATAL DAY (PND) 1; CONTINUOUS AND
STOP DOSE (PND 21) EXPOSURES
STATISTICAL REPORT
STATISTICAL ANALYSIS OF INTERIM SACRIFICE ORGAN WEIGHT DATA
PREPARED BY
BETH E. JULIAR DIVISION OF BIOINFORMATICS AND BIOSTATISTICS
FOR
NATIONAL CENTER FOR TOXICOLOGICAL RESEARCH 3900 NCTR ROAD
JEFFERSON, ARKANSAS 72079

E0219001 Statistical Report
Analysis of Interim Sacrifice Organ Weight
2
Signatures
Report prepared by Statistician: Date
Beth E. Juliar, M.A., M.S., Division of Bioinformatics and Biostatistics/NCTR/FDA
Report reviewed by Statistician: Date
Paul Felton, M.S., Division of Bioinformatics and Biostatistics /NCTR/FDA
Statistical Team Leader: Date
Paul Felton, M.S., Division of Bioinformatics and Biostatistics /NCTR/FDA

E0219001 Statistical Report
Analysis of Interim Sacrifice Organ Weight
3
Table of Contents
1. Objectives .................................................................................................................................. 1
1.1 Project Objectives ............................................................................................................ 1
1.2 Analysis Objectives ......................................................................................................... 1
2. Experimental Design .................................................................................................................. 1
3. Statistical Methods ..................................................................................................................... 1
4. Results ........................................................................................................................................ 2
4.1 BPA Treatments Stop Dose Arm ..................................................................................... 2
4.2 BPA Treatments Continuous Dose Arm ......................................................................... 3
4.3 EE2 Treatments Continuous Dose ................................................................................... 4
5. Conclusions ................................................................................................................................ 5
5.1 BPA Treatments Stop Dose Arm ..................................................................................... 5
5.2 BPA Treatments Continuous Dose Arm ......................................................................... 6
5.3 EE2 Treatments Continuous Dose ................................................................................... 6
Appendices ......................................................................................................................................... 8
A. Statistical Tables ........................................................................................................................ 8
a) BPA Treatments Stop Dose Arm ............................................................................................. 10
b) BPA Treatments Continuous Dose Arm .................................................................................. 25
c) EE2 Treatments Continuous Dose ............................................................................................ 40
B. Data .......................................................................................................................................... 50
Quality Control ................................................................................................................................ 51

E0219001 Statistical Report
Analysis of Interim Sacrifice Organ Weight
1
Statistical Analysis of Organ Weight Data
1. Objectives
1.1 Project Objectives
The goal of this two year chronic study is to characterize the long term toxicity of orally
administered BPA, including developmental exposure, in the NCTR Sprague-Dawley (CD) rat
over a broad dose range.
1.2 Analysis Objectives
The goal of this analysis is to evaluate the effects of exposure to BPA in Sprague-Dawley rats on
organ weight data at one year sacrifice.
2. Experimental Design
The study design consisted of first generation female and male rats (F0) for up to 600 mating
pairs randomized to treatment groups in 5 loads. The goal of the F0 matings was to obtain 352
study litters, 50 per dose group for vehicle controls and five BPA dose groups, 2.5, 25, 250,
2500, and 25000 µg/kg bw/day, and 26 for each of two EE2 dose groups, 0.05 and 0.5 µg/kg
bw/day. Dams were dosed daily from gestation day (GD) 6 until parturition. Dosing was by
gavage for F0 dams and F1 pups, the second study generation. Litters were culled to 10 pups on
PND 1.There were two study dosing arms of F1 animals, daily continuous dosing to termination,
and daily dose stopped at post-natal day (PND) 21. There was a vehicle control group and five
BPA groups for each study dosing arm, and EE2 daily dose groups for the continuous dosing arm
only. From the F1 litters, pups were allocated at weaning, PND 21, to the interim (1 year) and
terminal (2 year) sacrifices for the core study. For vehicle and BPA terminal sacrifice groups,
there were 50 pups each; for the interim sacrifice and the EE2 terminal sacrifice groups, there
were 20-26 pups each. Pups within litter and sex were assigned to different dosing arms and
sacrifice times.
Organ Weight Data
Organ weight data were collected for animals allocated to the interim sacrifice at one year that
reached sacrifice.
3. Statistical Methods
Statistical analyses were performed separately for the BPA study arms, stop dose and continuous
dose, and for the EE2 continuous dose. Weights of paired organs were analyzed as combined
weight. An analysis of variance (ANOVA) was performed for each sex and organ to determine
the effect of treatment on organ weight. Analyses of covariance (ANOCOVA) were performed to
determine the effect of treatment on organ weight adjusted for receiving weight or brain weight.
Separate analyses were performed with each covariate. Comparisons of dosed groups versus
vehicle control were performed using Dunnett’s method for adjusted contrasts. Tests of trend,
increasing treatment effect with increasing dose, were performed for the BPA and vehicle control
treatments. Tests were conducted as two-sided at the 0.05 significance level.
For analysis of each compound and study arm, a sensitivity analysis was also performed for
organ weight data collected from animals that reached interim sacrifice. During initial

E0219001 Statistical Report
Analysis of Interim Sacrifice Organ Weight
2
preweaning, 129 pups later randomized to interim sacrifice were held in the same rooms as a
special BPA 250,000 µg/kg bw/day high dose requested by an academic laboratory (20 vehicle
control, 84 BPA 2.5, 25, 250, 2500, and 25000 µg/kg bw/day, and 25 EE2 dose animals with
organ weight data). In consultation with the Principal Investigator, to address the possibility of
inadvertent exposure of the core study animals, a sensitivity analysis excluding these animals
was also performed to test the robustness of the results. Additional statistically significant
pairwise comparisons from the sensitivity analysis are reported in the text.
4. Results
Results of analyses are presented in Tables (Appendix A). Organ weight data excluded from the
analysis of organ weight are listed in Table 1. Exclusions were determined by the Principal
Investigator taking pathology reports and statistical distributions into consideration.
4.1 BPA Treatments Stop Dose Arm
Summary statistics for females are presented for the BPA stop dose arm in Table 2 for organ
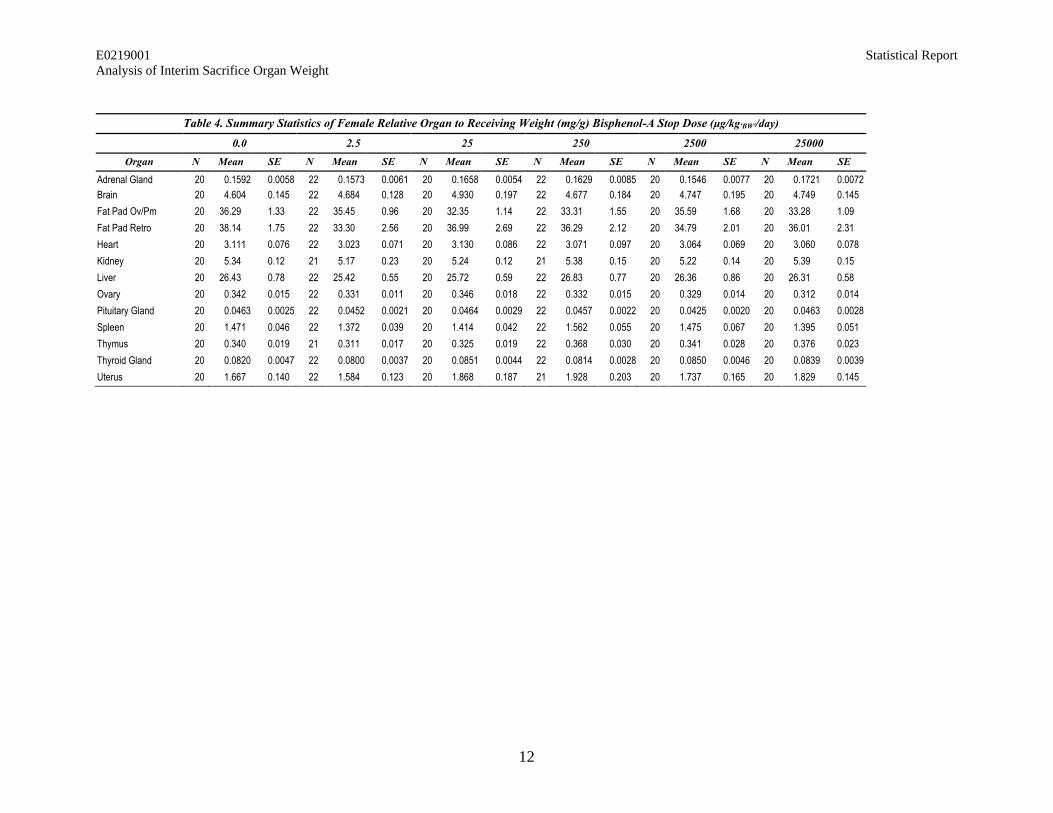
weight, Table 3 for organ relative to brain weight, and Table 4 for organ relative to receiving
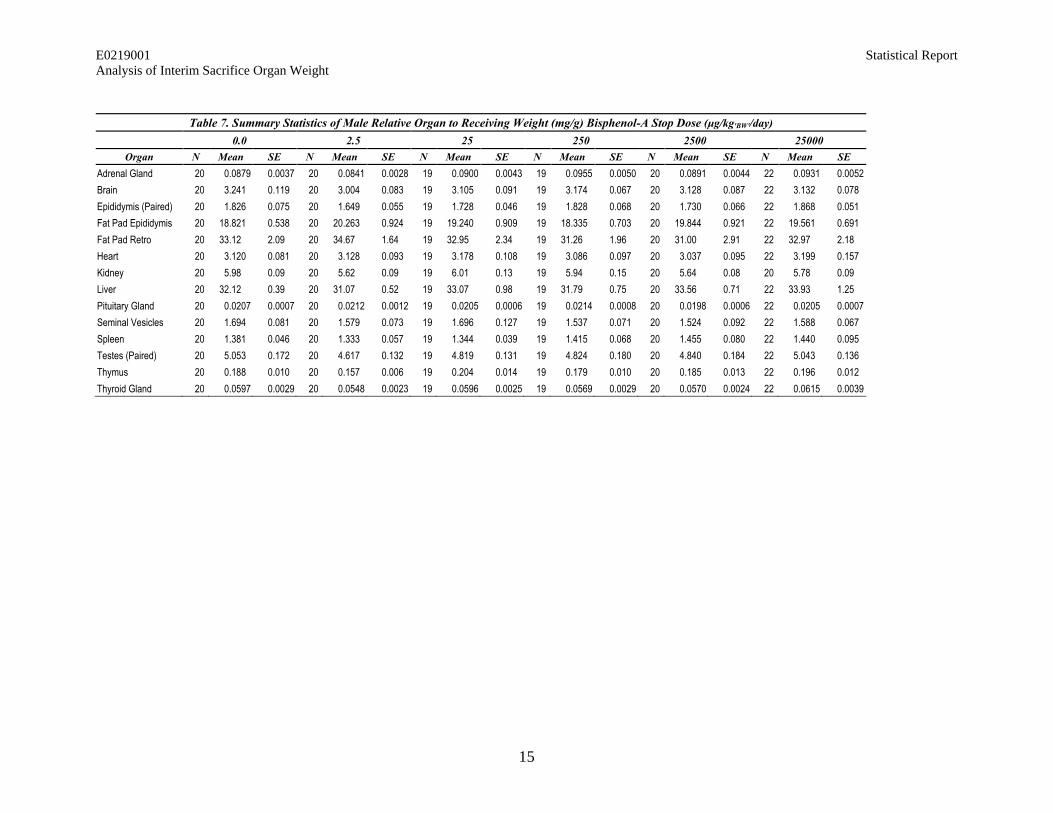
weight. Summary statistics for males are presented in Table 5 for organ weight, Table 6 for
organ relative to brain weight, and Table 7 for organ relative to receiving weight.
The ANOVA omnibus test results for females and males are presented in Table 8 for the null
hypothesis that all of the control and BPA stop dose treatment means for organ weights are equal.
For females, there was a significant dose effect for spleen. Pairwise comparisons of least squares
mean organ weight for females are presented in Table 9. For ovary, trend was significant
(p=0.016) and there was a significant difference from control for the BPA stop dose 25000 µg/kg
bw/day (p=0.037), with relatively lower mean weight in the dosed group (12.9% less than
control). Pairwise comparisons of least squares mean organ weight for males are presented in
Table 10. There were no statistically significant results in the analysis of organ weight for males.
In the sensitivity analysis of organ weight for female BPA stop dose, there were significant
pairwise comparisons for BPA stop dose 25 µg/kg bw/day for ovarian/parametrial fat pad
(p=0.010) and spleen (p=0.023), with lower mean weights in the dosed group relative to the
control (25.7% and 14.2% lower, respectively). There were no statistically significant results in
the sensitivity analysis of organ weight for males.
The ANOCOVA omnibus test results for females and males with covariate brain weight are
presented in Table 11 for the null hypothesis that all of the control and BPA stop dose treatment
means for organ weights are equal. For females, treatment effect was significant for spleen, and
covariate brain weight was significant for adrenal gland, ovarian/parametrial fat pad,
retroperitoneal fat pad, heart, kidney, liver, ovary, spleen, and thyroid gland. For males, covariate
brain weight was significant for adrenal gland, kidney, liver, and spleen. Pairwise comparisons
of least squares mean female organ weight adjusted for brain weight are presented in Table 12.
For ovary, trend was significant (p=0.025) and the BPA stop dose 25000 µg/kg bw/day differed
significantly from control (p=0.047), with relatively lower mean weight in the dosed group
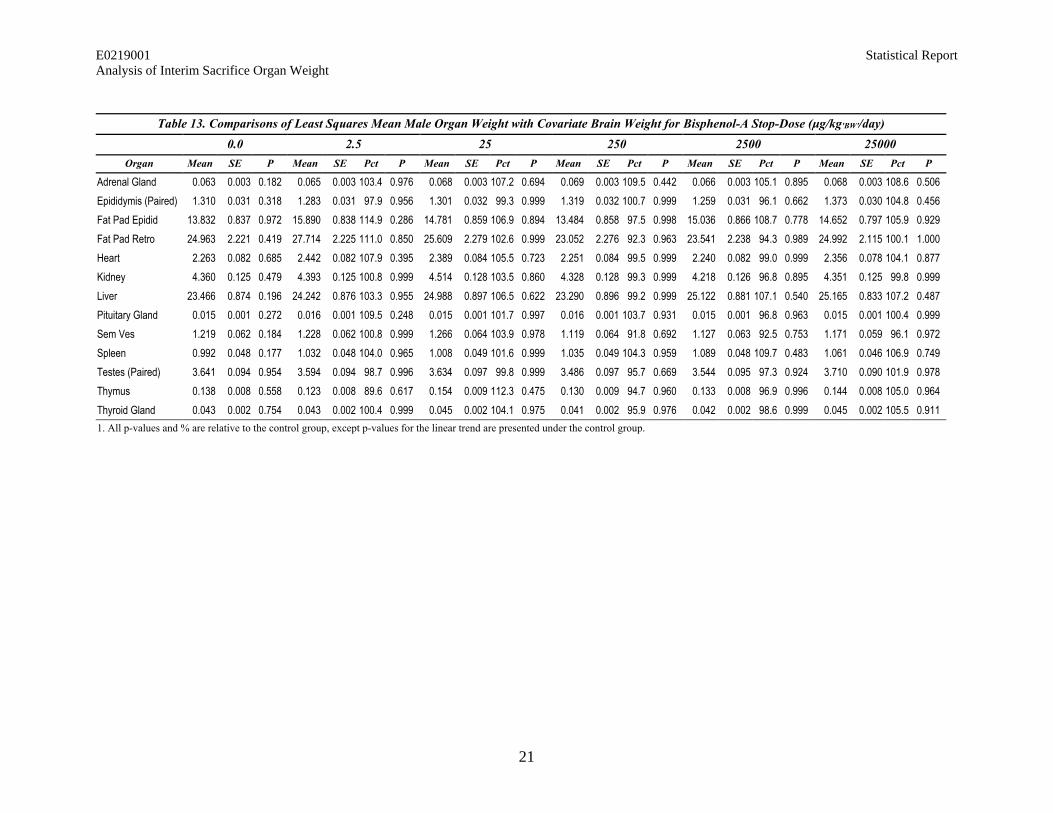
(11.9% less than control). Pairwise comparisons of least squares mean male organ weight
adjusted for brain weight are presented in Table 13. There were no statistically significant results
in the analysis of organ weight with covariate brain weight for males.
In the sensitivity analysis with covariate brain weight for female BPA stop dose, there was a
significant pairwise comparison for BPA stop dose 2.5 µg/kg bw/day for spleen (p=0.039), with
lower mean weight in the dosed group relative to the control (13.1% lower). For BPA stop dose

E0219001 Statistical Report
Analysis of Interim Sacrifice Organ Weight
3
25 µg/kg bw/day, there were significant differences from control for ovarian/parametrial fat pad
(p=0.010) and spleen (p=0.023), with relatively lower mean weights in the dosed group (25.0%
and 13.7% lower than control, respectively). There were no statistically significant results in the
sensitivity analysis with covariate brain weight for males.
The ANOCOVA omnibus test results for females and males with covariate receiving weight are
presented in Table 14 for the null hypothesis that all of the control and BPA stop dose treatment
means for organ weight are equal. For females, treatment effect was significant for spleen, and
covariate receiving weight was significant for adrenal gland, ovarian/parametrial fat pad,
retroperitoneal fat pad, heart, kidney, liver, ovary, pituitary gland, spleen, thymus, and thyroid
gland. For males, covariate receiving weight was significant for adrenal gland, epididymis fat
pad, retroperitoneal fat pad, heart, kidney, liver, pituitary gland, spleen, testes, thymus, and
thyroid gland. Pairwise comparisons of least squares mean female organ weight adjusted for
receiving weight are presented in Table 15. For ovary, trend was significant (p=0.019), but no
pairwise comparisons for females were statistically significant. Pairwise comparisons of least
squares mean male organ weight adjusted for receiving weight are presented in Table 16. For
liver, trend was significant (p=0.027), but no pairwise comparisons for males were statistically
significant.
In the sensitivity analysis with covariate receiving weight, there was a significant pairwise
comparison for female BPA stop dose 25 µg/kg bw/day compared to control for
ovarian/parametrial fat pad (p=0.035), with relatively lower mean weight in the dosed group
(13.7% lower than control). There were no additional statistically significant results for males.
4.2 BPA Treatments Continuous Dose Arm
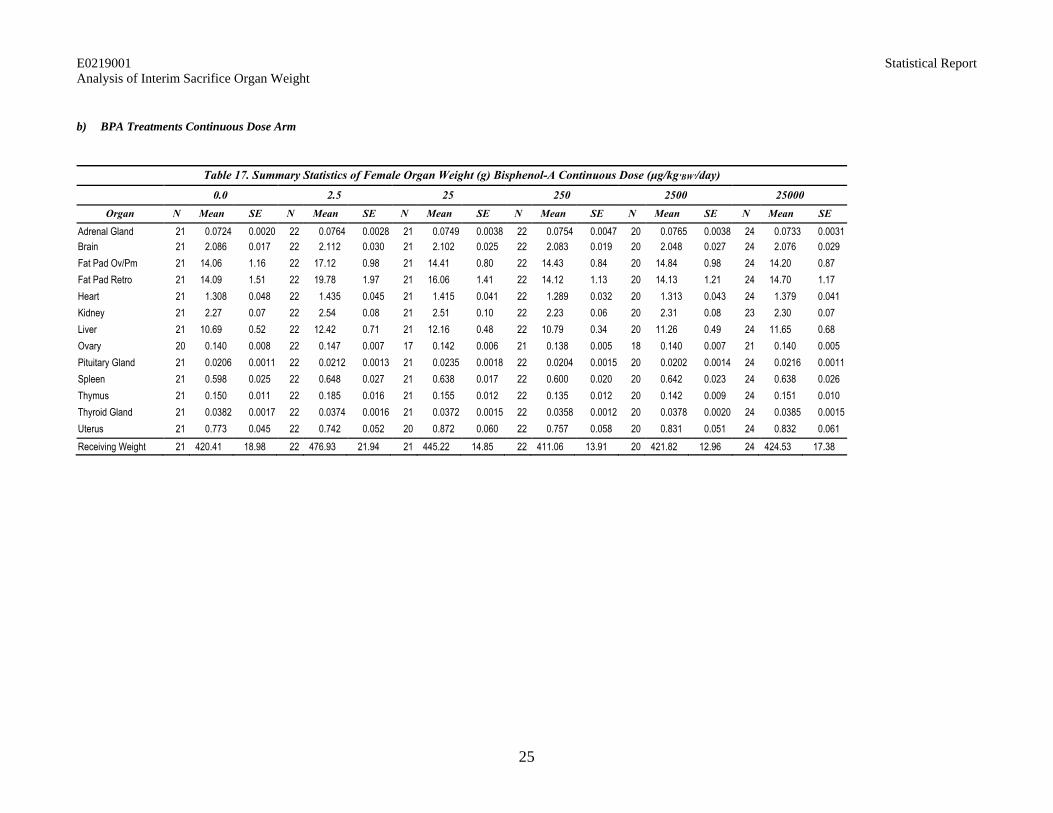
Summary statistics for females are presented for the BPA continuous dose arm in Table 17 for
organ weight, Table 18 for organ relative to brain weight, and Table 19 for organ relative to
receiving weight. Summary statistics for males are presented in Table 20 for organ weight, Table
21 for organ relative to brain weight, and Table 22 for organ relative to receiving weight.
The ANOVA omnibus test results for females and males are presented in Table 23 for the null
hypothesis that all of the control and BPA continuous dose treatment means for organ weights
are equal. There was a significant dose effect for retroperitoneal fat pad and kidney for females
and heart for males. Pairwise comparisons of least squares mean organ weight for females are
presented in Table 24. There was a significant difference compared to control for the BPA
continuous dose 2.5 µg/kg bw/day for retroperitoneal fat pad (p=0.025), with higher mean organ
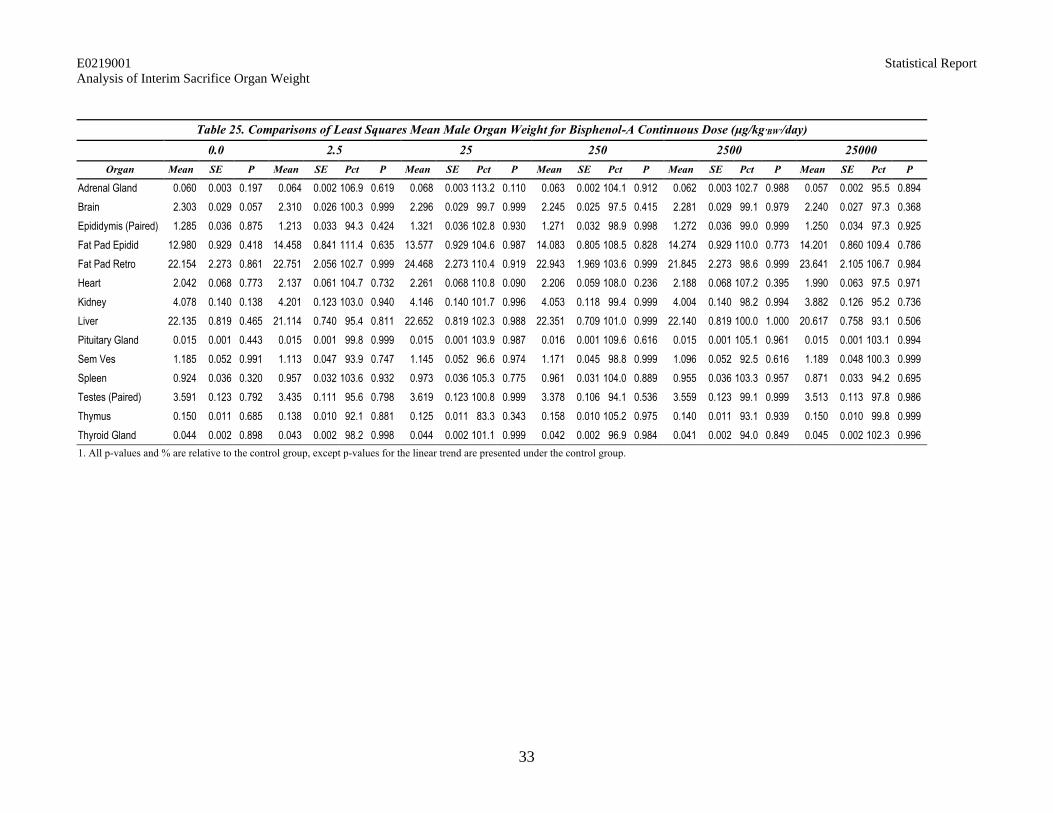
weight for the dosed group (40.3% greater than control). Pairwise comparisons of least squares
mean organ weight for males are presented in Table 25. There were no statistically significant
results in the analysis of organ weight for males.
In the sensitivity analysis of organ weight for the BPA continuous dose arm, there were no
additional statistically significant results for females or males.
The ANOCOVA omnibus test results for females and males with covariate brain weight are
presented in Table 26 for the null hypothesis that all of the control and BPA continuous dose
treatment means for organ weights are equal. For females, treatment effect was significant for
kidney, and the covariate brain weight was significant for ovarian/parametrial fat pad,
retroperitoneal fat pad, heart, kidney, liver, ovary, pituitary gland, and spleen. For males,
treatment effect was significant for heart; covariate brain weight was significant for adrenal
gland, epididymis, retroperitoneal fat pad, heart, kidney, liver, seminal vesicles, spleen, and
thyroid gland. Pairwise comparisons of least squares mean female organ weight adjusted for

E0219001 Statistical Report
Analysis of Interim Sacrifice Organ Weight
4
brain weight are presented in Table 27. For retroperitoneal fat pad, there was a significant
difference from control for the BPA continuous dose 2.5 µg/kg bw/day (p=0.033), with relatively
higher mean weight in the dosed group (38.4% greater than control). Pairwise comparisons of
least squares mean male organ weight adjusted for brain weight are presented in Table 28. There
were no statistically significant results in the analysis of organ weight with covariate brain
weight for males.
In the sensitivity analysis with covariate brain weight for the BPA continuous dose arm, there
were no additional statistically significant results for females or males.
The ANOCOVA omnibus test results for females and males with covariate receiving weight are
presented in Table 29 for the null hypothesis that all of the control and BPA continuous dose
treatment means for organ weights are equal. For females, covariate receiving weight was
significant for adrenal gland, ovarian/parametrial fat pad, retroperitoneal fat pad, heart, kidney,
liver, ovary, spleen, thymus, and thyroid gland. For males, treatment effect was significant for
heart and liver; covariate receiving weight was significant for adrenal gland, epididymis,
epididymis fat pad, retroperitoneal fat pad, heart, kidney, liver, pituitary gland, spleen, and
thyroid gland. Pairwise comparisons of least squares mean female organ weight adjusted for
receiving weight are presented in Table 30. Trend for liver was significant (p=0.049), although
no dosed group differed significantly from vehicle control. Pairwise comparisons of least squares
mean male organ weight adjusted for receiving weight are presented in Table 31. There was a
significant difference compared to control for liver for the BPA continuous dose 2.5 µg/kg
bw/day (p=0.033), with relatively lower mean weight in the dosed group (7.7% less than
control).
In the sensitivity analysis of BPA continuous dose organ weight with covariate receiving weight,
there were no additional statistically pairwise comparisons for females or males.
4.3 EE2 Treatments Continuous Dose
Summary statistics for females are presented for the EE2 continuous dose in Table 32 for organ
weight, Table 33 for organ relative to brain weight, and Table 34 for organ relative to receiving
weight. Summary statistics for males are presented in Table 35 for organ weight, Table 36 for
organ relative to brain weight, and Table 37 for organ relative to receiving weight.
The ANOVA omnibus test results for females and males are presented in Table 38 for the null
hypothesis that all of the control and EE2 continuous dose treatment means for organ weights are
equal. For females, treatment effect was significant for adrenal gland, ovarian/parametrial fat
pad, kidney, liver, ovary, and pituitary gland; for males, treatment effect was not significant for
any organ. Pairwise comparisons of least squares mean organ weight for females are presented in
Table 39. For the EE2 0.5 µg/kg bw/day group, there were significant differences from control
for adrenal gland, kidney, liver, ovary, and pituitary gland (p<0.001, =0.004, =0.006, =0.017, and
=0.003, respectively). Mean weight was relatively lower in the dosed group for ovary (18.2%
less than control); mean weights were relatively higher in the dosed group for adrenal gland,
kidney, liver, and pituitary gland (27.4%, 15.2%, 19.5%, and 30.6% greater than control,
respectively). Pairwise comparisons of least squares mean organ weight for males are presented
in Table 40. There were no statistically significant results in the analysis of organ weight for
males.
In the sensitivity analysis of organ weight for the EE2 continuous dose, there were no additional
statistically significant results for females or males.

E0219001 Statistical Report
Analysis of Interim Sacrifice Organ Weight
5
The ANOCOVA omnibus test results for females and males with covariate brain weight are
presented in Table 41 for the null hypothesis that all of the control and EE2 continuous dose
treatment means for organ weights are equal. For females, treatment effect was significant for
adrenal gland, ovarian/parametrial fat pad, kidney, liver, ovary, and pituitary gland; covariate
brain weight was significant for ovarian/parametrial fat pad, retroperitoneal fat pad, heart, liver,
spleen, and thymus. For males, covariate brain weight was significant for epididymis, epididymis
fat pad, retroperitoneal fat pad, heart, kidney, liver, pituitary gland, testes, and thyroid gland.
Pairwise comparisons of least squares mean female organ weight adjusted for brain weight are
presented in Table 42. For the EE2 0.5 µg/kg bw/day group compared to control, there were
significant differences for adrenal gland, kidney, liver, ovary, and pituitary gland (p<0.001,
=0.002, =0.001, =0.022, and =0.002, respectively). Mean weight was relatively lower in the
dosed group for ovary (17.8% less than control); mean weights were relatively higher in the
dosed group for adrenal gland, kidney, liver, and pituitary gland (28.0%, 16.0%, 21.0%, and
31.4% greater than control, respectively). Pairwise comparisons of least squares mean male
organ weight adjusted for brain weight are presented in Table 43. There were no statistically
significant results in the analysis of organ weight with covariate brain weight for males.
In the sensitivity analysis for the EE2 continuous dose with covariate brain weight, there were no
additional statistically significant results for females or males.
The ANOCOVA omnibus test results for females and males with covariate receiving weight are
presented in Table 44 for the null hypothesis that all of the control and EE2 continuous dose
treatment means for organ weights are equal. For females, treatment effect and covariate
receiving weight were significant for adrenal gland, ovarian/parametrial fat pad, heart, kidney,
liver, and pituitary gland; treatment effect was significant for ovary; and covariate receiving
weight was significant for retroperitoneal fat pad, spleen, thymus, and thyroid gland. For males,
treatment effect and covariate receiving weight were significant for thymus; covariate receiving
weight was significant for adrenal gland, epididymis, epididymis fat pad, retroperitoneal fat pad,
heart, kidney, liver, pituitary gland, spleen, testes, and thyroid gland. Pairwise comparisons of
least squares mean female organ weight adjusted for receiving weight are presented in Table 45.
For the EE2 0.5 µg/kg bw/day group, there were significant differences from control for adrenal
gland, ovarian/parametrial fat pad, heart, kidney, liver, ovary, and pituitary gland (p<0.001,
<0.001, =0.015, <0.001, <0.001, =0.021, and =0.002, respectively). Mean weights were
relatively lower in the dosed group for ovarian/parametrial fat pad and ovary (18.9% and 17.8%
less than control, respectively); mean weights were relatively higher in the dosed group for
adrenal gland, heart, kidney, liver, and pituitary gland (26.9%, 7.7%, 14.5%, 18.4%, and 29.9%
greater than control, respectively). Pairwise comparisons of least squares mean male organ
weight adjusted for receiving weight are presented in Table 46. There were no statistically
significant results in the analysis of organ weight with covariate receiving weight for males.
In the sensitivity analysis for the EE2 continuous dose with covariate receiving weight, there
were no additional statistically significant results for females or males.
5. Conclusions
5.1 BPA Treatments Stop Dose Arm
In pairwise comparisons of least squares mean organ weight for females, there was a significant
difference for the BPA stop dose 25000 µg/kg bw/day compared to control for ovary, with
relatively lower mean weight in the dosed group. In the sensitivity analysis for female BPA stop
dose, there were significant pairwise comparisons for BPA stop dose 25 µg/kg bw/day for

E0219001 Statistical Report
Analysis of Interim Sacrifice Organ Weight
6
ovarian/parametrial fat pad and spleen, with lower mean weights in the dosed group relative to
the control. There were no statistically significant results in the analysis of organ weight for male
BPA stop dose.
In the analysis of female organ weight adjusted for brain weight, ovary differed significantly
from control for the BPA stop dose 25000 µg/kg bw/day, with relatively lower mean weight in
the dosed group. In the sensitivity analysis, there was a significant pairwise comparison for BPA
stop dose 2.5 µg/kg bw/day for spleen, with lower mean weight in the dosed group relative to the
control. For BPA stop dose 25 µg/kg bw/day, there were significant differences from control for
ovarian/parametrial fat pad and spleen, with lower mean weights in the dosed group relative to
control. There were no statistically significant results in the analysis of organ weight with
covariate brain weight for male BPA stop dose.
In the analysis of organ weight adjusted for receiving weight, there were no significant pairwise
comparisons for female or male BPA stop dose. In the sensitivity analysis with covariate
receiving weight, there was a significant pairwise comparison to control for female BPA stop
dose 25 µg/kg bw/day for ovarian/parametrial fat pad, with relatively lower mean weight in the
dosed group.
5.2 BPA Treatments Continuous Dose Arm
In pairwise comparisons of least squares mean organ weight for females, there was a significant
difference compared to control for the BPA continuous dose 2.5 µg/kg bw/day for retroperitoneal
fat pad, with relatively higher mean organ weight for the dosed group. There were no statistically
significant results in the analysis of organ weight for male BPA continuous dose.
In analysis of female organ weight adjusted for brain weight, retroperitoneal fat pad was
significantly different from control for the BPA continuous dose 2.5 µg/kg bw/day, with
relatively higher mean weight in the dosed group. For BPA continuous dose males, there were no
statistically significant results in the analysis of organ weight with covariate brain weight.
For BPA continuous dose female organ weight adjusted for receiving weight, there were no
statistically significant pairwise comparisons to control. For males, there was a significant
difference compared to control for liver for the BPA continuous dose 2.5 µg/kg bw/day, with
lower mean weight in the dosed group relative to control.
5.3 EE2 Treatments Continuous Dose
For the female EE2 0.5 µg/kg bw/day group, there were significant comparisons to control for
adrenal gland, kidney, liver, ovary, and pituitary gland, with lower mean weight in the dosed
group for ovary and higher mean weight for adrenal gland, kidney, liver, and pituitary gland
relative to control. There were no statistically significant results in the analysis of organ weight
for male EE2 dose groups.
In pairwise comparisons of least squares mean female organ weight adjusted for brain weight,
the EE2 0.5 µg/kg bw/day group differed significantly from control for adrenal gland, kidney,
liver, ovary, and pituitary gland. Mean weight was relatively lower in the EE2 0.5 µg/kg bw/day
group for ovary and higher in the dosed group for adrenal gland, kidney, liver, and pituitary
gland compared to control. For male organ weight adjusted for brain weight, there were no
statistically significant differences compared to control for male EE2 dose groups.
For female organ weight with covariate receiving weight, pairwise comparisons to control for
adrenal gland, ovarian/parametrial fat pad, heart, kidney, liver, ovary, and pituitary gland were
significant for the EE2 0.5 µg/kg bw/day group. Compared to control, mean weights were

E0219001 Statistical Report
Analysis of Interim Sacrifice Organ Weight
7
relatively lower in the dosed group for ovarian/parametrial fat pad and ovary, and relatively
higher for adrenal gland, heart, kidney, liver, and pituitary gland. There were no statistically
significant pairwise comparisons to control in the analysis of organ weight with covariate
receiving weight for male EE2 dose groups.

E0219001 Statistical Report
Analysis of Interim Sacrifice Organ Weight
8
Appendices
A. Statistical Tables

E0219001 Statistical Report
Analysis of Interim Sacrifice Organ Weight
9
Table 1. Organ Weight Exclusions
Compound Sex Dose CID UIN Organ Weight (g) Reason1
Stop BPA F 2.5 21900301511 23000528957 Thymus 0.627 Outlier
21900305842 23000533708 Kidney 2.711 All organs with gross cysts will be excluded
250 21900301841 23000533932 Uterus 4.677 Only uterus noted as fluid filled
21900308032 23000535435 Kidney 2.427 All organs with gross cysts will be excluded
M 2500 21900034071 23000530435 Epidid Fat Pad 14.728 All organs with gross cysts will be excluded
25000 21900302071 23000528744 Kidney 11.552 Outlier
21900306381 23000533115 Kidney 11.920 Outlier
ContinuousBPA
F 0 21900300162 23000529217 Ovary 0.456 Outlier
25 21900300471 23000529095 Ovary 0.557 Outlier
21900304792 23000534826 Ovary 5.070 All organs with gross cysts will be excluded
21900306902 23000535711 Ovary 1.471 All organs with gross cysts will be excluded
21900308732 23000536210 Ovary 0.162 All organs with gross cysts will be excluded
21900308732 23000536210 Uterus 2.906 Outlier
250 21900302801 23000532773 Ovary 0.238 All organs with gross cysts will be excluded
2500 21900300802 23000529379 Ovary 0.623 Outlier
21900305102 23000532714 Ovary 0.658 All organs with gross cysts will be excluded
25000 21900300961 23000530323 Kidney 5.282 Outlier
21900307321 23000535770 Ovary 0.071 All organs with gross cysts will be excluded
21900307322 23000535723 Ovary 0.241 All organs with gross cysts will be excluded
21900309151 23000536139 Ovary 0.186 All organs with gross cysts will be excluded
M 0 21900308391 23000535588 Kidney 4.301 All organs with gross cysts will be excluded
25 21900308662 23000536176 Kidney 4.043 All organs with gross cysts will be excluded
2500 21900305031 23000533335 Kidney 3.800 All organs with gross cysts will be excluded
EE2 F 0.5 21900303341 23000529390 Ovary 0.552 Outlier
21900305501 23000530846 Ovary 2.592 All organs with gross cysts will be excluded
21900305522 23000533418 Ovary 1.212 All organs with gross cysts will be excluded
0.05 21900305391 23000533458 Kidney 2.373 All organs with gross cysts will be excluded
21900309241 23000535579 Ovary 0.177 All organs with gross cysts will be excluded
M 0.05 21900305331 23000533450 Kidney 4.267 All organs with gross cysts will be excluded
21900305342 23000533940 Adrenal Gl 0.235 Outlier
1 Exclusions were determined by the Principle Investigator taking pathology reports and statistical distributions into consideration.

E0219001 Statistical Report
Analysis of Interim Sacrifice Organ Weight
10
a) BPA Treatments Stop Dose Arm
Table 2. Summary Statistics of Female Organ Weight (g) Bisphenol-A Stop-Dose (μg/kg'BW'/day)
0.0 2.5 25 250 2500 25000
Organ N Mean SE N Mean SE N Mean SE N Mean SE N Mean SE N Mean SE
Adrenal Gland 20 0.0731 0.0029 22 0.0700 0.0016 20 0.0716 0.0027 22 0.0712 0.0024 20 0.0685 0.0029 20 0.0756 0.0031
Brain 20 2.091 0.023 22 2.095 0.017 20 2.090 0.027 22 2.049 0.021 20 2.090 0.018 20 2.071 0.017
Fat Pad Ov/Pm 20 17.20 1.23 22 16.18 0.72 20 14.31 0.95 22 15.33 1.07 20 16.31 1.13 20 14.97 0.87
Fat Pad Retro 20 18.24 1.55 22 15.41 1.53 20 16.96 1.84 22 17.10 1.53 20 16.18 1.33 20 16.44 1.41
Heart 20 1.433 0.049 22 1.359 0.023 20 1.350 0.045 22 1.366 0.042 20 1.377 0.045 20 1.347 0.038
Kidney 20 2.47 0.11 21 2.30 0.09 20 2.28 0.09 21 2.41 0.10 20 2.35 0.09 20 2.38 0.08
Liver 20 12.30 0.68 22 11.54 0.40 20 11.25 0.59 22 12.10 0.57 20 11.95 0.57 20 11.65 0.41
Ovary 20 0.157 0.006 22 0.149 0.004 20 0.148 0.006 22 0.147 0.004 20 0.147 0.006 20 0.136 0.005
Pituitary Gland 20 0.0211 0.0010 22 0.0203 0.0008 20 0.0199 0.0013 22 0.0201 0.0007 20 0.0190 0.0009 20 0.0203 0.0011
Spleen 20 0.678 0.030 22 0.618 0.016 20 0.612 0.024 22 0.693 0.024 20 0.659 0.030 20 0.611 0.017
Thymus 20 0.154 0.007 21 0.139 0.006 20 0.142 0.010 22 0.164 0.014 20 0.150 0.011 20 0.167 0.012
Thyroid Gland 20 0.0378 0.0022 22 0.0360 0.0016 20 0.0363 0.0017 22 0.0363 0.0013 20 0.0382 0.0023 20 0.0369 0.0017
Uterus 20 0.744 0.046 22 0.699 0.045 20 0.795 0.080 21 0.843 0.076 20 0.747 0.054 20 0.789 0.051
Receiving Weight 20 464.88 18.94 22 454.94 14.16 20 437.22 18.85 22 453.05 19.34 20 454.04 18.57 20 443.83 13.88

E0219001 Statistical Report
Analysis of Interim Sacrifice Organ Weight
11
Table 3. Summary Statistics of Female Relative Organ to Brain Weight (g/g) Bisphenol-A Stop Dose (μg/kg'BW'/day)
0.0 2.5 25 250 2500 25000
Organ N Mean SE N Mean SE N Mean SE N Mean SE N Mean SE N Mean SE
Adrenal Gland 20 0.0349 0.0013 22 0.0334 0.0007 20 0.0343 0.0013 22 0.0348 0.0012 20 0.0328 0.0013 20 0.0365 0.0014
Fat Pad Ov/Pm 20 8.17 0.53 22 7.72 0.33 20 6.84 0.45 22 7.47 0.51 20 7.79 0.53 20 7.22 0.41
Fat Pad Retro 20 8.66 0.67 22 7.36 0.73 20 8.10 0.87 22 8.28 0.69 20 7.71 0.61 20 7.93 0.68
Heart 20 0.684 0.019 22 0.649 0.011 20 0.647 0.022 22 0.666 0.018 20 0.658 0.020 20 0.651 0.019
Kidney 20 1.18 0.04 21 1.10 0.04 20 1.09 0.04 21 1.17 0.04 20 1.12 0.04 20 1.15 0.04
Liver 20 5.86 0.28 22 5.52 0.19 20 5.38 0.27 22 5.89 0.26 20 5.70 0.25 20 5.63 0.20
Ovary 20 0.075 0.003 22 0.071 0.002 20 0.071 0.003 22 0.072 0.002 20 0.070 0.003 20 0.066 0.003
Pituitary Gland 20 0.0100 0.0004 22 0.0097 0.0004 20 0.0096 0.0007 22 0.0098 0.0003 20 0.0091 0.0004 20 0.0098 0.0005
Spleen 20 0.323 0.011 22 0.295 0.007 20 0.293 0.011 22 0.339 0.012 20 0.315 0.014 20 0.295 0.008
Thymus 20 0.074 0.003 21 0.067 0.003 20 0.068 0.005 22 0.080 0.007 20 0.072 0.005 20 0.080 0.006
Thyroid Gland 20 0.0180 0.0010 22 0.0172 0.0008 20 0.0174 0.0008 22 0.0177 0.0006 20 0.0183 0.0011 20 0.0178 0.0008
Uterus 20 0.356 0.022 22 0.334 0.022 20 0.382 0.040 21 0.410 0.035 20 0.360 0.028 20 0.381 0.024
E0219001 Statistical Report
Analysis of Interim Sacrifice Organ Weight
12
Table 4. Summary Statistics of Female Relative Organ to Receiving Weight (mg/g) Bisphenol-A Stop Dose (μg/kg'BW'/day)
0.0 2.5 25 250 2500 25000
Organ N Mean SE N Mean SE N Mean SE N Mean SE N Mean SE N Mean SE
Adrenal Gland 20 0.1592 0.0058 22 0.1573 0.0061 20 0.1658 0.0054 22 0.1629 0.0085 20 0.1546 0.0077 20 0.1721 0.0072
Brain 20 4.604 0.145 22 4.684 0.128 20 4.930 0.197 22 4.677 0.184 20 4.747 0.195 20 4.749 0.145
Fat Pad Ov/Pm 20 36.29 1.33 22 35.45 0.96 20 32.35 1.14 22 33.31 1.55 20 35.59 1.68 20 33.28 1.09
Fat Pad Retro 20 38.14 1.75 22 33.30 2.56 20 36.99 2.69 22 36.29 2.12 20 34.79 2.01 20 36.01 2.31
Heart 20 3.111 0.076 22 3.023 0.071 20 3.130 0.086 22 3.071 0.097 20 3.064 0.069 20 3.060 0.078
Kidney 20 5.34 0.12 21 5.17 0.23 20 5.24 0.12 21 5.38 0.15 20 5.22 0.14 20 5.39 0.15
Liver 20 26.43 0.78 22 25.42 0.55 20 25.72 0.59 22 26.83 0.77 20 26.36 0.86 20 26.31 0.58
Ovary 20 0.342 0.015 22 0.331 0.011 20 0.346 0.018 22 0.332 0.015 20 0.329 0.014 20 0.312 0.014
Pituitary Gland 20 0.0463 0.0025 22 0.0452 0.0021 20 0.0464 0.0029 22 0.0457 0.0022 20 0.0425 0.0020 20 0.0463 0.0028
Spleen 20 1.471 0.046 22 1.372 0.039 20 1.414 0.042 22 1.562 0.055 20 1.475 0.067 20 1.395 0.051
Thymus 20 0.340 0.019 21 0.311 0.017 20 0.325 0.019 22 0.368 0.030 20 0.341 0.028 20 0.376 0.023
Thyroid Gland 20 0.0820 0.0047 22 0.0800 0.0037 20 0.0851 0.0044 22 0.0814 0.0028 20 0.0850 0.0046 20 0.0839 0.0039
Uterus 20 1.667 0.140 22 1.584 0.123 20 1.868 0.187 21 1.928 0.203 20 1.737 0.165 20 1.829 0.145

E0219001 Statistical Report
Analysis of Interim Sacrifice Organ Weight
13
Table 5. Summary Statistics of Male Organ Weight (g) Bisphenol-A Stop-Dose (μg/kg'BW'/day)
0.0 2.5 25 250 2500 25000
Organ N Mean SE N Mean SE N Mean SE N Mean SE N Mean SE N Mean SE
Adrenal Gland 20 0.0634 0.0020 20 0.0657 0.0021 19 0.0679 0.0033 19 0.0689 0.0027 20 0.0654 0.0035 22 0.0683 0.0033
Brain 20 2.325 0.021 20 2.331 0.019 19 2.325 0.026 19 2.303 0.031 20 2.275 0.021 22 2.304 0.029
Epididymis (Paired) 20 1.310 0.030 20 1.282 0.031 19 1.300 0.030 19 1.320 0.031 20 1.260 0.041 22 1.373 0.022
Fat Pad Epidid 20 13.901 0.697 20 15.990 0.927 19 14.852 1.040 19 13.452 0.643 19 14.850 0.994 22 14.625 0.713
Fat Pad Retro 20 25.01 2.29 20 27.78 2.01 19 25.65 2.29 19 23.03 1.69 20 23.43 2.69 22 24.97 2.12
Heart 20 2.269 0.066 20 2.451 0.088 19 2.395 0.082 19 2.248 0.078 20 2.225 0.071 22 2.354 0.098
Kidney 20 4.38 0.15 20 4.43 0.15 19 4.54 0.11 19 4.32 0.11 20 4.17 0.15 20 4.33 0.10
Liver 20 23.58 0.86 20 24.41 0.73 19 25.10 1.02 19 23.23 0.77 20 24.84 0.99 22 25.12 0.93
Pituitary Gland 20 0.0151 0.0006 20 0.0165 0.0009 19 0.0153 0.0003 19 0.0156 0.0006 20 0.0145 0.0004 22 0.0151 0.0005
Sem Ves 20 1.222 0.049 20 1.233 0.057 19 1.269 0.092 19 1.118 0.052 20 1.120 0.070 22 1.169 0.044
Spleen 20 0.999 0.029 20 1.043 0.044 19 1.015 0.034 19 1.031 0.053 20 1.071 0.063 22 1.058 0.060
Testes (Paired) 20 3.640 0.070 20 3.593 0.079 19 3.633 0.093 19 3.486 0.091 20 3.546 0.148 22 3.710 0.060
Thymus 20 0.137 0.009 20 0.123 0.005 19 0.154 0.010 19 0.130 0.008 20 0.134 0.009 22 0.145 0.008
Thyroid Gland 20 0.0431 0.0019 20 0.0434 0.0025 19 0.0449 0.0018 19 0.0412 0.0019 20 0.0422 0.0024 22 0.0454 0.0027
Receiving Weight 20 734.61 26.05 20 787.19 22.81 19 759.68 22.50 19 732.61 21.05 20 737.79 21.34 22 743.24 16.97

E0219001 Statistical Report
Analysis of Interim Sacrifice Organ Weight
14
Table 6. Summary Statistics of Male Relative Organ to Brain Weight (mg/g) Bisphenol-A Stop Dose (μg/kg'BW'/day)
0.0 2.5 25 250 2500 25000
Organ N Mean SE N Mean SE N Mean SE N Mean SE N Mean SE N Mean SE
Adrenal Gland 20 0.0273 0.0008 20 0.0282 0.0009 19 0.0293 0.0015 19 0.0300 0.0013 20 0.0287 0.0014 22 0.0296 0.0013
Epididymis (Paired) 20 0.564 0.014 20 0.551 0.015 19 0.560 0.014 19 0.574 0.015 20 0.556 0.020 22 0.598 0.012
Fat Pad Epididymis 20 5.994 0.313 20 6.850 0.376 19 6.384 0.435 19 5.824 0.255 20 6.521 0.411 22 6.381 0.331
Fat Pad Retro 20 10.79 1.02 20 11.90 0.84 19 11.04 0.98 19 10.01 0.73 20 10.30 1.17 22 10.90 0.94
Heart 20 0.978 0.030 20 1.052 0.038 19 1.033 0.037 19 0.974 0.026 20 0.980 0.033 22 1.025 0.046
Kidney 20 1.89 0.07 20 1.90 0.06 19 1.95 0.05 19 1.88 0.05 20 1.83 0.06 20 1.89 0.04
Liver 20 10.16 0.38 20 10.47 0.30 19 10.79 0.41 19 10.07 0.28 20 10.92 0.43 22 10.93 0.43
Pituitary Gland 20 0.0065 0.0002 20 0.0071 0.0004 19 0.0066 0.0001 19 0.0068 0.0002 20 0.0064 0.0002 22 0.0066 0.0002
Seminal Vesicles 20 0.526 0.021 20 0.529 0.024 19 0.544 0.037 19 0.485 0.022 20 0.494 0.032 22 0.511 0.022
Spleen 20 0.430 0.012 20 0.448 0.019 19 0.437 0.014 19 0.449 0.024 20 0.470 0.026 22 0.458 0.024
Testes (Paired) 20 1.568 0.032 20 1.544 0.037 19 1.568 0.047 19 1.517 0.043 20 1.562 0.066 22 1.615 0.033
Thymus 20 0.059 0.004 20 0.053 0.002 19 0.066 0.004 19 0.057 0.003 20 0.059 0.004 22 0.063 0.004
Thyroid Gland 20 0.0186 0.0008 20 0.0186 0.0011 19 0.0194 0.0008 19 0.0180 0.0009 20 0.0186 0.0010 22 0.0197 0.0011
E0219001 Statistical Report
Analysis of Interim Sacrifice Organ Weight
15
Table 7. Summary Statistics of Male Relative Organ to Receiving Weight (mg/g) Bisphenol-A Stop Dose (μg/kg'BW'/day)
0.0 2.5 25 250 2500 25000
Organ N Mean SE N Mean SE N Mean SE N Mean SE N Mean SE N Mean SE
Adrenal Gland 20 0.0879 0.0037 20 0.0841 0.0028 19 0.0900 0.0043 19 0.0955 0.0050 20 0.0891 0.0044 22 0.0931 0.0052
Brain 20 3.241 0.119 20 3.004 0.083 19 3.105 0.091 19 3.174 0.067 20 3.128 0.087 22 3.132 0.078
Epididymis (Paired) 20 1.826 0.075 20 1.649 0.055 19 1.728 0.046 19 1.828 0.068 20 1.730 0.066 22 1.868 0.051
Fat Pad Epididymis 20 18.821 0.538 20 20.263 0.924 19 19.240 0.909 19 18.335 0.703 20 19.844 0.921 22 19.561 0.691
Fat Pad Retro 20 33.12 2.09 20 34.67 1.64 19 32.95 2.34 19 31.26 1.96 20 31.00 2.91 22 32.97 2.18
Heart 20 3.120 0.081 20 3.128 0.093 19 3.178 0.108 19 3.086 0.097 20 3.037 0.095 22 3.199 0.157
Kidney 20 5.98 0.09 20 5.62 0.09 19 6.01 0.13 19 5.94 0.15 20 5.64 0.08 20 5.78 0.09
Liver 20 32.12 0.39 20 31.07 0.52 19 33.07 0.98 19 31.79 0.75 20 33.56 0.71 22 33.93 1.25
Pituitary Gland 20 0.0207 0.0007 20 0.0212 0.0012 19 0.0205 0.0006 19 0.0214 0.0008 20 0.0198 0.0006 22 0.0205 0.0007
Seminal Vesicles 20 1.694 0.081 20 1.579 0.073 19 1.696 0.127 19 1.537 0.071 20 1.524 0.092 22 1.588 0.067
Spleen 20 1.381 0.046 20 1.333 0.057 19 1.344 0.039 19 1.415 0.068 20 1.455 0.080 22 1.440 0.095
Testes (Paired) 20 5.053 0.172 20 4.617 0.132 19 4.819 0.131 19 4.824 0.180 20 4.840 0.184 22 5.043 0.136
Thymus 20 0.188 0.010 20 0.157 0.006 19 0.204 0.014 19 0.179 0.010 20 0.185 0.013 22 0.196 0.012
Thyroid Gland 20 0.0597 0.0029 20 0.0548 0.0023 19 0.0596 0.0025 19 0.0569 0.0029 20 0.0570 0.0024 22 0.0615 0.0039

E0219001 Statistical Report
Analysis of Interim Sacrifice Organ Weight
16
Table 8. ANOVA Results for Organ Weight1
for Bisphenol-A Stop-Dose (μg/kg'BW'/day)
Sex Organ Effect NumDF DenDF Fvalue P value
F Adrenal Gland Dose 5 118 0.877 0.499
Brain Dose 5 118 0.763 0.578
Fat Pad Ov/Pm Dose 5 118 1.048 0.393
Fat Pad Retro Dose 5 118 0.391 0.854
Heart Dose 5 118 0.587 0.710
Kidney Dose 5 116 0.615 0.688
Liver Dose 5 118 0.506 0.771
Ovary Dose 5 118 1.449 0.211
Pituitary Gland Dose 5 118 0.485 0.786
Spleen Dose 5 118 2.349 0.045
Thymus Dose 5 117 1.200 0.313
Thyroid Gland Dose 5 118 0.235 0.946
Uterus Dose 5 117 0.721 0.609
M Adrenal Gland Dose 5 114 0.542 0.744
Brain Dose 5 114 0.716 0.612
Epididymis (Paired) Dose 5 114 1.623 0.159
Fat Pad Epididymis Dose 5 114 1.083 0.373
Fat Pad Retro Dose 5 114 0.584 0.711
Heart Dose 5 114 1.193 0.316
Kidney Dose 5 112 0.890 0.490
Liver Dose 5 114 0.805 0.548
Pituitary Gland Dose 5 114 1.542 0.182
Seminal Vesicles Dose 5 114 0.996 0.423
Spleen Dose 5 114 0.294 0.915
Testes (Paired) Dose 5 114 0.710 0.617
Thymus Dose 5 114 1.737 0.131
Thyroid Gland Dose 5 114 0.484 0.787 1 Analyses were conducted separately for females and males.

E0219001 Statistical Report
Analysis of Interim Sacrifice Organ Weight
17
Table 9. Comparisons of Least Squares Mean Female Organ Weight for Bisphenol-A Stop-Dose (μg/kg'BW'/day)
0.0 2.5 25 250 2500 25000
Organ Mean SE P Mean SE Pct P Mean SE Pct P Mean SE Pct P Mean SE Pct P Mean SE Pct P
Adrenal Gland 0.073 0.003 0.724 0.070 0.003 95.8 0.871 0.072 0.003 98.0 0.993 0.071 0.003 97.4 0.979 0.069 0.003 93.7 0.617 0.076 0.003 103.5 0.938
Brain 2.091 0.021 0.379 2.095 0.020 100.2 0.999 2.090 0.021 100.0 0.999 2.049 0.020 98.0 0.458 2.090 0.021 100.0 0.999 2.071 0.021 99.1 0.943
Fat Pad Ov/Pm 17.197 1.021 0.254 16.176 0.974 94.1 0.921 14.314 1.021 83.2 0.174 15.327 0.974 89.1 0.539 16.307 1.021 94.8 0.958 14.973 1.021 87.1 0.395
Fat Pad Retro 18.240 1.566 0.616 15.407 1.494 84.5 0.551 16.960 1.566 93.0 0.967 17.099 1.494 93.7 0.978 16.175 1.566 88.7 0.814 16.441 1.566 90.1 0.882
Heart 1.433 0.041 0.297 1.359 0.040 94.9 0.566 1.350 0.041 94.2 0.481 1.366 0.040 95.3 0.654 1.377 0.041 96.1 0.798 1.347 0.041 94.0 0.445
Kidney 2.473 0.093 0.806 2.298 0.091 92.9 0.526 2.279 0.093 92.1 0.441 2.413 0.091 97.6 0.987 2.348 0.093 94.9 0.802 2.378 0.093 96.2 0.924
Liver 12.300 0.554 0.797 11.542 0.528 93.8 0.776 11.248 0.554 91.4 0.526 12.103 0.528 98.4 0.999 11.950 0.554 97.2 0.989 11.648 0.554 94.7 0.870
Ovary 0.157 0.005 0.016 0.149 0.005 95.1 0.741 0.148 0.005 94.2 0.634 0.147 0.005 93.6 0.526 0.147 0.005 93.6 0.539 0.136 0.005 87.1 0.037
Pituitary Gland 0.021 0.001 0.349 0.020 0.001 96.3 0.966 0.020 0.001 94.6 0.876 0.020 0.001 95.3 0.918 0.019 0.001 90.0 0.410 0.020 0.001 96.3 0.972
Spleen 0.678 0.024 0.511 0.618 0.023 91.0 0.251 0.612 0.024 90.2 0.195 0.693 0.023 102.2 0.990 0.659 0.024 97.1 0.970 0.611 0.024 90.0 0.184
Thymus 0.154 0.011 0.192 0.139 0.010 90.1 0.745 0.142 0.011 92.0 0.873 0.164 0.010 106.5 0.934 0.150 0.011 96.9 0.997 0.167 0.011 107.9 0.878
Thyroid Gland 0.038 0.002 0.899 0.036 0.002 95.3 0.933 0.036 0.002 96.2 0.973 0.036 0.002 96.0 0.965 0.038 0.002 101.1 0.999 0.037 0.002 97.6 0.996
Uterus 0.744 0.061 0.409 0.699 0.058 93.9 0.976 0.795 0.061 106.9 0.964 0.843 0.060 113.3 0.657 0.747 0.061 100.4 0.999 0.789 0.061 106.1 0.978
1. All p-values and % are relative to the control group, except p-values for the linear trend are presented under the control group.

E0219001 Statistical Report
Analysis of Interim Sacrifice Organ Weight
18
Table 10. Comparisons of Least Squares Mean Male Organ Weight for Bisphenol-A Stop-Dose (μg/kg'BW'/day)
0.0 2.5 25 250 2500 25000
Organ Mean SE P Mean SE Pct P Mean SE Pct P Mean SE Pct P Mean SE Pct P Mean SE Pct P
Adrenal Gland 0.063 0.003 0.295 0.066 0.003 103.6 0.970 0.068 0.003 107.2 0.704 0.069 0.003 108.7 0.536 0.065 0.003 103.2 0.982 0.068 0.003 107.8 0.603
Brain 2.325 0.025 0.154 2.331 0.025 100.3 0.999 2.325 0.026 100.0 1.000 2.303 0.026 99.1 0.962 2.275 0.025 97.8 0.472 2.304 0.024 99.1 0.964
Epididymis (Paired) 1.310 0.031 0.288 1.282 0.031 97.9 0.954 1.300 0.032 99.3 0.999 1.320 0.032 100.8 0.999 1.260 0.031 96.2 0.688 1.373 0.030 104.9 0.436
Fat Pad Epidid 13.901 0.840 0.862 15.990 0.840 115.0 0.277 14.852 0.862 106.8 0.895 13.452 0.862 96.8 0.995 14.850 0.862 106.8 0.896 14.625 0.801 105.2 0.957
Fat Pad Retro 25.007 2.209 0.386 27.777 2.209 111.1 0.844 25.654 2.267 102.6 0.999 23.030 2.267 92.1 0.956 23.433 2.209 93.7 0.982 24.974 2.107 99.9 0.999
Heart 2.269 0.082 0.552 2.451 0.082 108.0 0.384 2.395 0.084 105.5 0.725 2.248 0.084 99.1 0.999 2.225 0.082 98.0 0.994 2.354 0.078 103.7 0.914
Kidney 4.383 0.129 0.246 4.426 0.129 101.0 0.999 4.538 0.133 103.5 0.874 4.320 0.133 98.6 0.997 4.168 0.129 95.1 0.650 4.330 0.129 98.8 0.998
Liver 23.579 0.891 0.333 24.406 0.891 103.5 0.947 25.104 0.914 106.5 0.637 23.234 0.914 98.5 0.998 24.840 0.891 105.3 0.774 25.117 0.850 106.5 0.598
Pituitary Gland 0.015 0.001 0.193 0.017 0.001 109.6 0.241 0.015 0.001 101.7 0.997 0.016 0.001 103.3 0.959 0.014 0.001 95.8 0.889 0.015 0.001 100.0 1.000
Sem Ves 1.222 0.062 0.143 1.233 0.062 100.9 0.999 1.269 0.064 103.9 0.978 1.118 0.064 91.5 0.652 1.120 0.062 91.6 0.657 1.169 0.059 95.7 0.959
Spleen 0.999 0.049 0.333 1.043 0.049 104.3 0.957 1.015 0.051 101.6 0.999 1.031 0.051 103.2 0.989 1.071 0.049 107.2 0.755 1.058 0.047 105.9 0.858
Testes (Paired) 3.640 0.094 0.937 3.593 0.094 98.7 0.996 3.633 0.096 99.8 0.999 3.486 0.096 95.8 0.670 3.546 0.094 97.4 0.928 3.710 0.089 101.9 0.976
Thymus 0.137 0.008 0.499 0.123 0.008 89.5 0.606 0.154 0.008 112.3 0.472 0.130 0.008 95.0 0.968 0.134 0.008 97.6 0.998 0.145 0.008 105.3 0.954
Thyroid Gland 0.043 0.002 0.836 0.043 0.002 100.5 0.999 0.045 0.002 104.1 0.975 0.041 0.002 95.6 0.966 0.042 0.002 97.8 0.998 0.045 0.002 105.2 0.928
1. All p-values and % are relative to the control group, except p-values for the linear trend are presented under the control group.

E0219001 Statistical Report
Analysis of Interim Sacrifice Organ Weight
19
Table 11. ANOCOVA Results for Organ Weight with Covariate Brain Weight1
for Bisphenol-A Stop-Dose (μg/kg'BW'/day)
Sex Organ Effect NumDF DenDF Fvalue P value
F Adrenal Gland Brain Weight 1 117 9.860 0.002
Dose 5 117 1.130 0.348
Fat Pad Ov/Pm Brain Weight 1 117 11.149 0.001
Dose 5 117 0.999 0.421
Fat Pad Retro Brain Weight 1 117 11.202 0.001
Dose 5 117 0.563 0.728
Heart Brain Weight 1 117 17.905 <.001
Dose 5 117 0.651 0.661
Kidney Brain Weight 1 115 26.464 <.001
Dose 5 115 1.093 0.368
Liver Brain Weight 1 117 17.498 <.001
Dose 5 117 0.845 0.520
Ovary Brain Weight 1 117 12.983 <.001
Dose 5 117 1.380 0.236
Pituitary Gland Brain Weight 1 117 0.051 0.822
Dose 5 117 0.482 0.789
Spleen Brain Weight 1 117 10.755 0.001
Dose 5 117 2.975 0.014
Thymus Brain Weight 1 116 0.273 0.602
Dose 5 116 1.106 0.360
Thyroid Gland Brain Weight 1 117 4.506 0.035
Dose 5 117 0.223 0.951
Uterus Brain Weight 1 116 0.028 0.866
Dose 5 116 0.681 0.638
M Adrenal Gland Brain Weight 1 113 4.539 0.035
Dose 5 113 0.621 0.684
Epididymis (Paired) Brain Weight 1 113 0.146 0.702
Dose 5 113 1.621 0.159
Fat Pad Epididymis Brain Weight 1 113 2.236 0.137
Dose 5 113 1.052 0.391
Fat Pad Retro Brain Weight 1 113 0.133 0.716
Dose 5 113 0.537 0.747
Heart Brain Weight 1 113 1.961 0.164
Dose 5 113 1.029 0.404
Kidney Brain Weight 1 111 8.962 0.003
Dose 5 111 0.558 0.731
Liver Brain Weight 1 113 5.751 0.018
Dose 5 113 0.931 0.463
Pituitary Gland Brain Weight 1 113 2.284 0.133
Dose 5 113 1.337 0.253
Seminal Vesicles Brain Weight 1 113 0.876 0.351
Dose 5 113 0.855 0.514
Spleen Brain Weight 1 113 7.543 0.007
Dose 5 113 0.523 0.758
Testes (Paired) Brain Weight 1 113 0.022 0.882
Dose 5 113 0.708 0.618
Thymus Brain Weight 1 113 0.387 0.535
Dose 5 113 1.736 0.132
Thyroid Gland Brain Weight 1 113 0.653 0.420
Dose 5 113 0.452 0.810 1 Analyses were conducted separately for females and males.

E0219001 Statistical Report
Analysis of Interim Sacrifice Organ Weight
20
Table 12. Comparisons of Least Squares Mean Female Organ Weight with Covariate Brain Weight for Bisphenol-A Stop-Dose (μg/kg'BW'/day)
0.0 2.5 25 250 2500 25000
Organ Mean SE P Mean SE Pct P Mean SE Pct P Mean SE Pct P Mean SE Pct P Mean SE Pct P
Adrenal Gland 0.073 0.003 0.537 0.070 0.002 95.6 0.833 0.071 0.003 98.0 0.993 0.072 0.002 99.4 0.999 0.068 0.003 93.8 0.592 0.076 0.003 104.5 0.837
Fat Pad Ov/Pm 17.050 0.981 0.360 15.975 0.936 93.7 0.891 14.180 0.981 83.2 0.149 15.780 0.944 92.6 0.816 16.175 0.981 94.9 0.953 15.109 0.981 88.6 0.489
Fat Pad Retro 18.014 1.504 0.801 15.097 1.436 83.8 0.485 16.754 1.504 93.0 0.964 17.796 1.448 98.8 0.999 15.972 1.504 88.7 0.796 16.650 1.504 92.4 0.951
Heart 1.425 0.039 0.441 1.349 0.037 94.6 0.469 1.343 0.039 94.2 0.425 1.389 0.037 97.4 0.939 1.370 0.039 96.1 0.764 1.354 0.039 95.0 0.555
Kidney 2.453 0.085 0.927 2.282 0.083 93.0 0.460 2.260 0.085 92.1 0.355 2.469 0.083 100.7 0.999 2.329 0.085 94.9 0.748 2.396 0.085 97.7 0.986
Liver 12.203 0.519 0.948 11.408 0.495 93.5 0.695 11.160 0.519 91.4 0.472 12.403 0.500 101.6 0.998 11.863 0.519 97.2 0.987 11.738 0.519 96.2 0.953
Ovary 0.156 0.005 0.025 0.148 0.005 94.8 0.675 0.147 0.005 94.2 0.599 0.149 0.005 95.8 0.819 0.146 0.005 93.6 0.502 0.137 0.005 88.1 0.047
Pituitary Gland 0.021 0.001 0.362 0.020 0.001 96.2 0.966 0.020 0.001 94.6 0.879 0.020 0.001 95.5 0.934 0.019 0.001 90.0 0.414 0.020 0.001 96.4 0.975
Spleen 0.675 0.023 0.676 0.613 0.022 90.8 0.203 0.608 0.023 90.1 0.170 0.704 0.023 104.3 0.846 0.656 0.023 97.2 0.968 0.614 0.023 90.9 0.235
Thymus 0.155 0.011 0.208 0.139 0.010 90.1 0.746 0.142 0.011 92.0 0.874 0.164 0.010 105.9 0.959 0.150 0.011 96.9 0.997 0.166 0.011 107.6 0.896
Thyroid Gland 0.038 0.002 0.765 0.036 0.002 95.1 0.919 0.036 0.002 96.2 0.973 0.037 0.002 97.9 0.998 0.038 0.002 101.1 0.999 0.037 0.002 98.5 0.999
Uterus 0.744 0.061 0.420 0.699 0.058 93.9 0.977 0.795 0.061 106.8 0.965 0.842 0.060 113.1 0.684 0.747 0.061 100.4 0.999 0.789 0.061 106.0 0.980
1. All p-values and % are relative to the control group, except p-values for the linear trend are presented under the control group.
E0219001 Statistical Report
Analysis of Interim Sacrifice Organ Weight
21
Table 13. Comparisons of Least Squares Mean Male Organ Weight with Covariate Brain Weight for Bisphenol-A Stop-Dose (μg/kg'BW'/day)
0.0 2.5 25 250 2500 25000
Organ Mean SE P Mean SE Pct P Mean SE Pct P Mean SE Pct P Mean SE Pct P Mean SE Pct P
Adrenal Gland 0.063 0.003 0.182 0.065 0.003 103.4 0.976 0.068 0.003 107.2 0.694 0.069 0.003 109.5 0.442 0.066 0.003 105.1 0.895 0.068 0.003 108.6 0.506
Epididymis (Paired) 1.310 0.031 0.318 1.283 0.031 97.9 0.956 1.301 0.032 99.3 0.999 1.319 0.032 100.7 0.999 1.259 0.031 96.1 0.662 1.373 0.030 104.8 0.456
Fat Pad Epidid 13.832 0.837 0.972 15.890 0.838 114.9 0.286 14.781 0.859 106.9 0.894 13.484 0.858 97.5 0.998 15.036 0.866 108.7 0.778 14.652 0.797 105.9 0.929
Fat Pad Retro 24.963 2.221 0.419 27.714 2.225 111.0 0.850 25.609 2.279 102.6 0.999 23.052 2.276 92.3 0.963 23.541 2.238 94.3 0.989 24.992 2.115 100.1 1.000
Heart 2.263 0.082 0.685 2.442 0.082 107.9 0.395 2.389 0.084 105.5 0.723 2.251 0.084 99.5 0.999 2.240 0.082 99.0 0.999 2.356 0.078 104.1 0.877
Kidney 4.360 0.125 0.479 4.393 0.125 100.8 0.999 4.514 0.128 103.5 0.860 4.328 0.128 99.3 0.999 4.218 0.126 96.8 0.895 4.351 0.125 99.8 0.999
Liver 23.466 0.874 0.196 24.242 0.876 103.3 0.955 24.988 0.897 106.5 0.622 23.290 0.896 99.2 0.999 25.122 0.881 107.1 0.540 25.165 0.833 107.2 0.487
Pituitary Gland 0.015 0.001 0.272 0.016 0.001 109.5 0.248 0.015 0.001 101.7 0.997 0.016 0.001 103.7 0.931 0.015 0.001 96.8 0.963 0.015 0.001 100.4 0.999
Sem Ves 1.219 0.062 0.184 1.228 0.062 100.8 0.999 1.266 0.064 103.9 0.978 1.119 0.064 91.8 0.692 1.127 0.063 92.5 0.753 1.171 0.059 96.1 0.972
Spleen 0.992 0.048 0.177 1.032 0.048 104.0 0.965 1.008 0.049 101.6 0.999 1.035 0.049 104.3 0.959 1.089 0.048 109.7 0.483 1.061 0.046 106.9 0.749
Testes (Paired) 3.641 0.094 0.954 3.594 0.094 98.7 0.996 3.634 0.097 99.8 0.999 3.486 0.097 95.7 0.669 3.544 0.095 97.3 0.924 3.710 0.090 101.9 0.978
Thymus 0.138 0.008 0.558 0.123 0.008 89.6 0.617 0.154 0.009 112.3 0.475 0.130 0.009 94.7 0.960 0.133 0.008 96.9 0.996 0.144 0.008 105.0 0.964
Thyroid Gland 0.043 0.002 0.754 0.043 0.002 100.4 0.999 0.045 0.002 104.1 0.975 0.041 0.002 95.9 0.976 0.042 0.002 98.6 0.999 0.045 0.002 105.5 0.911
1. All p-values and % are relative to the control group, except p-values for the linear trend are presented under the control group.

E0219001 Statistical Report
Analysis of Interim Sacrifice Organ Weight
22
Table 14. ANOCOVA Results for Organ Weight with Covariate Receiving Weight1
for Bisphenol-A Stop-Dose Dose (μg/kg'BW'/day)
Sex Organ Effect NumDF DenDF Fvalue P value
F Adrenal Gland Receiving Weight 1 117 10.954 0.001
Dose 5 117 1.045 0.394
Fat Pad Ov/Pm Receiving Weight 1 117 283.111 <.001
Dose 5 117 1.215 0.306
Fat Pad Retro Receiving Weight 1 117 335.986 <.001
Dose 5 117 1.703 0.139
Heart Receiving Weight 1 117 144.094 <.001
Dose 5 117 0.521 0.759
Kidney Receiving Weight 1 115 109.310 <.001
Dose 5 115 0.617 0.687
Liver Receiving Weight 1 117 214.147 <.001
Dose 5 117 0.513 0.765
Ovary Receiving Weight 1 117 18.287 <.001
Dose 5 117 1.334 0.254
Pituitary Gland Receiving Weight 1 117 8.563 0.004
Dose 5 117 0.463 0.803
Spleen Receiving Weight 1 117 52.038 <.001
Dose 5 117 2.601 0.028
Thymus Receiving Weight 1 116 5.246 0.023
Dose 5 116 1.258 0.286
Thyroid Gland Receiving Weight 1 117 21.692 <.001
Dose 5 117 0.224 0.951
Uterus Receiving Weight 1 116 3.833 0.052
Dose 5 116 0.699 0.625
M Adrenal Gland Receiving Weight 1 113 4.601 0.034
Dose 5 113 0.605 0.696
Epididymis (Paired) Receiving Weight 1 113 1.744 0.189
Dose 5 113 1.724 0.134
Fat Pad Epididymis Receiving Weight 1 113 134.052 <.001
Dose 5 113 0.605 0.696
Fat Pad Retro Receiving Weight 1 113 142.030 <.001
Dose 5 113 0.224 0.951
Heart Receiving Weight 1 113 23.425 <.001
Dose 5 113 0.664 0.651
Kidney Receiving Weight 1 111 207.403 <.001
Dose 5 111 2.001 0.084
Liver Receiving Weight 1 113 135.960 <.001
Dose 5 113 1.915 0.097
Pituitary Gland Receiving Weight 1 113 12.671 <.001
Dose 5 113 1.126 0.350
Seminal Vesicles Receiving Weight 1 113 3.355 0.069
Dose 5 113 0.830 0.531
Spleen Receiving Weight 1 113 12.623 <.001
Dose 5 113 0.408 0.842
Testes (Paired) Receiving Weight 1 113 10.231 0.001
Dose 5 113 0.778 0.567
Thymus Receiving Weight 1 113 6.357 0.013
Dose 5 113 2.010 0.082
Thyroid Gland Receiving Weight 1 113 17.080 <.001
Dose 5 113 0.513 0.766 1 Analyses were conducted separately for females and males.

E0219001 Statistical Report
Analysis of Interim Sacrifice Organ Weight
23
Table 15. Comparisons of Least Squares Mean Female Organ Weight with Covariate Receiving Weight for Bisphenol-A Stop-Dose (μg/kg'BW'/day)
0.0 2.5 25 250 2500 25000
Organ Mean SE P Mean SE Pct P Mean SE Pct P Mean SE Pct P Mean SE Pct P Mean SE Pct P
Adrenal Gland 0.072 0.003 0.578 0.070 0.002 96.4 0.913 0.072 0.003 99.6 0.999 0.071 0.002 98.1 0.993 0.068 0.003 94.3 0.676 0.076 0.003 104.8 0.796
Fat Pad Ov/Pm 16.545 0.556 0.257 16.005 0.529 96.7 0.929 15.002 0.556 90.7 0.188 15.247 0.529 92.2 0.308 16.180 0.555 97.8 0.987 15.341 0.555 92.7 0.401
Fat Pad Retro 17.215 0.801 0.944 15.138 0.762 87.9 0.219 18.040 0.802 104.8 0.920 16.974 0.762 98.6 0.999 15.975 0.800 92.8 0.704 17.019 0.800 98.9 0.999
Heart 1.409 0.028 0.390 1.353 0.027 96.0 0.443 1.375 0.028 97.5 0.849 1.363 0.027 96.7 0.630 1.372 0.028 97.4 0.805 1.360 0.028 96.5 0.597
Kidney 2.423 0.067 0.839 2.293 0.066 94.7 0.502 2.330 0.067 96.2 0.787 2.403 0.066 99.2 0.999 2.337 0.067 96.4 0.830 2.405 0.067 99.3 0.999
Liver 11.962 0.331 0.681 11.453 0.315 95.7 0.691 11.605 0.331 97.0 0.905 12.062 0.315 100.8 0.999 11.884 0.330 99.3 0.999 11.838 0.331 99.0 0.999
Ovary 0.155 0.005 0.019 0.148 0.005 95.7 0.798 0.149 0.005 96.1 0.867 0.146 0.005 94.4 0.594 0.146 0.005 94.3 0.594 0.137 0.005 88.5 0.054
Pituitary Gland 0.021 0.001 0.425 0.020 0.001 96.9 0.983 0.020 0.001 96.5 0.974 0.020 0.001 96.1 0.955 0.019 0.001 90.7 0.454 0.020 0.001 97.8 0.996
Spleen 0.668 0.020 0.710 0.615 0.019 92.0 0.214 0.622 0.020 93.2 0.371 0.692 0.019 103.5 0.867 0.657 0.020 98.3 0.994 0.616 0.020 92.3 0.258
Thymus 0.153 0.010 0.143 0.138 0.010 90.6 0.775 0.144 0.010 94.1 0.960 0.164 0.010 107.5 0.885 0.149 0.010 97.7 0.999 0.168 0.010 109.7 0.765
Thyroid Gland 0.037 0.002 0.686 0.036 0.002 96.3 0.967 0.037 0.002 99.2 0.999 0.036 0.002 97.3 0.991 0.038 0.002 102.3 0.996 0.037 0.002 99.9 0.999
Uterus 0.752 0.060 0.467 0.700 0.057 93.2 0.958 0.786 0.060 104.5 0.993 0.846 0.059 112.6 0.687 0.748 0.060 99.5 0.999 0.784 0.060 104.3 0.994
1. All p-values and % are relative to the control group, except p-values for the linear trend are presented under the control group.

E0219001 Statistical Report
Analysis of Interim Sacrifice Organ Weight
24
Table 16. Comparisons of Least Squares Mean Male Organ Weight with Covariate Receiving Weight for Bisphenol-A Stop-Dose (μg/kg'BW'/day)
0.0 2.5 25 250 2500 25000
Organ Mean SE P Mean SE Pct P Mean SE Pct P Mean SE Pct P Mean SE Pct P Mean SE Pct P
Adrenal Gland 0.064 0.003 0.228 0.065 0.003 101.5 0.999 0.068 0.003 106.1 0.803 0.069 0.003 108.7 0.513 0.066 0.003 103.1 0.984 0.068 0.003 107.4 0.631
Epididymis (Paired) 1.312 0.031 0.249 1.275 0.031 97.2 0.872 1.298 0.032 98.9 0.998 1.323 0.032 100.8 0.999 1.262 0.031 96.2 0.677 1.374 0.030 104.7 0.457
Fat Pad Epidid 14.308 0.572 0.576 14.911 0.578 104.2 0.918 14.551 0.586 101.7 0.998 13.916 0.587 97.3 0.985 15.206 0.586 106.3 0.707 14.788 0.544 103.4 0.961
Fat Pad Retro 26.104 1.480 0.632 24.903 1.497 95.4 0.970 24.857 1.517 95.2 0.966 24.279 1.519 93.0 0.858 24.290 1.479 93.0 0.854 25.419 1.409 97.4 0.997
Heart 2.292 0.075 0.751 2.391 0.076 104.3 0.820 2.379 0.077 103.8 0.887 2.274 0.077 99.2 0.999 2.243 0.075 97.8 0.987 2.363 0.071 103.1 0.938
Kidney 4.459 0.077 0.210 4.251 0.078 95.3 0.216 4.494 0.079 100.8 0.997 4.405 0.079 98.8 0.984 4.228 0.077 94.8 0.134 4.329 0.077 97.1 0.634
Liver 24.018 0.604 0.027 23.258 0.611 96.8 0.848 24.786 0.619 103.2 0.844 23.733 0.620 98.8 0.997 25.182 0.604 104.8 0.515 25.295 0.575 105.3 0.404
Pituitary Gland 0.015 0.001 0.262 0.016 0.001 106.7 0.532 0.015 0.001 100.3 0.999 0.016 0.001 103.4 0.944 0.015 0.001 95.7 0.851 0.015 0.001 99.5 0.999
Sem Ves 1.229 0.062 0.176 1.214 0.062 98.8 0.999 1.264 0.063 102.9 0.993 1.126 0.063 91.6 0.652 1.125 0.062 91.5 0.636 1.172 0.059 95.4 0.943
Spleen 1.010 0.047 0.209 1.015 0.048 100.6 0.999 1.008 0.048 99.8 0.999 1.043 0.048 103.3 0.984 1.079 0.047 106.9 0.744 1.062 0.045 105.2 0.885
Testes (Paired) 3.658 0.090 0.764 3.546 0.091 96.9 0.854 3.620 0.093 99.0 0.998 3.506 0.093 95.8 0.652 3.560 0.090 97.3 0.904 3.717 0.086 101.6 0.986
Thymus 0.139 0.008 0.388 0.119 0.008 86.2 0.336 0.153 0.008 110.6 0.585 0.132 0.008 95.2 0.968 0.135 0.008 97.5 0.998 0.145 0.008 104.7 0.967
Thyroid Gland 0.044 0.002 0.614 0.042 0.002 96.0 0.969 0.045 0.002 101.9 0.998 0.042 0.002 95.8 0.963 0.043 0.002 97.5 0.996 0.046 0.002 104.4 0.950
1. All p-values and % are relative to the control group, except p-values for the linear trend are presented under the control group.
E0219001 Statistical Report
Analysis of Interim Sacrifice Organ Weight
25
b) BPA Treatments Continuous Dose Arm
Table 17. Summary Statistics of Female Organ Weight (g) Bisphenol-A Continuous Dose (μg/kg'BW'/day)
0.0 2.5 25 250 2500 25000
Organ N Mean SE N Mean SE N Mean SE N Mean SE N Mean SE N Mean SE
Adrenal Gland 21 0.0724 0.0020 22 0.0764 0.0028 21 0.0749 0.0038 22 0.0754 0.0047 20 0.0765 0.0038 24 0.0733 0.0031
Brain 21 2.086 0.017 22 2.112 0.030 21 2.102 0.025 22 2.083 0.019 20 2.048 0.027 24 2.076 0.029
Fat Pad Ov/Pm 21 14.06 1.16 22 17.12 0.98 21 14.41 0.80 22 14.43 0.84 20 14.84 0.98 24 14.20 0.87
Fat Pad Retro 21 14.09 1.51 22 19.78 1.97 21 16.06 1.41 22 14.12 1.13 20 14.13 1.21 24 14.70 1.17
Heart 21 1.308 0.048 22 1.435 0.045 21 1.415 0.041 22 1.289 0.032 20 1.313 0.043 24 1.379 0.041
Kidney 21 2.27 0.07 22 2.54 0.08 21 2.51 0.10 22 2.23 0.06 20 2.31 0.08 23 2.30 0.07
Liver 21 10.69 0.52 22 12.42 0.71 21 12.16 0.48 22 10.79 0.34 20 11.26 0.49 24 11.65 0.68
Ovary 20 0.140 0.008 22 0.147 0.007 17 0.142 0.006 21 0.138 0.005 18 0.140 0.007 21 0.140 0.005
Pituitary Gland 21 0.0206 0.0011 22 0.0212 0.0013 21 0.0235 0.0018 22 0.0204 0.0015 20 0.0202 0.0014 24 0.0216 0.0011
Spleen 21 0.598 0.025 22 0.648 0.027 21 0.638 0.017 22 0.600 0.020 20 0.642 0.023 24 0.638 0.026
Thymus 21 0.150 0.011 22 0.185 0.016 21 0.155 0.012 22 0.135 0.012 20 0.142 0.009 24 0.151 0.010
Thyroid Gland 21 0.0382 0.0017 22 0.0374 0.0016 21 0.0372 0.0015 22 0.0358 0.0012 20 0.0378 0.0020 24 0.0385 0.0015
Uterus 21 0.773 0.045 22 0.742 0.052 20 0.872 0.060 22 0.757 0.058 20 0.831 0.051 24 0.832 0.061
Receiving Weight 21 420.41 18.98 22 476.93 21.94 21 445.22 14.85 22 411.06 13.91 20 421.82 12.96 24 424.53 17.38

E0219001 Statistical Report
Analysis of Interim Sacrifice Organ Weight
26
Table 18. Summary Statistics of Female Relative Organ to Brain Weight (g/g) Bisphenol-A Continuous Dose (μg/kg'BW'/day)
0.0 2.5 25 250 2500 25000
Organ N Mean SE N Mean SE N Mean SE N Mean SE N Mean SE N Mean SE
Adrenal Gland 21 0.0348 0.0010 22 0.0362 0.0014 21 0.0356 0.0017 22 0.0362 0.0022 20 0.0374 0.0019 24 0.0354 0.0015
Fat Pad Ov/Pm 21 6.72 0.54 22 8.13 0.47 21 6.83 0.35 22 6.93 0.40 20 7.21 0.44 24 6.83 0.40
Fat Pad Retro 21 6.72 0.70 22 9.41 0.97 21 7.64 0.67 22 6.76 0.52 20 6.84 0.55 24 7.09 0.56
Heart 21 0.628 0.023 22 0.682 0.024 21 0.674 0.020 22 0.619 0.014 20 0.641 0.019 24 0.664 0.017
Kidney 21 1.09 0.03 22 1.21 0.04 21 1.20 0.05 22 1.07 0.03 20 1.12 0.03 23 1.11 0.03
Liver 21 5.12 0.24 22 5.90 0.36 21 5.81 0.25 22 5.18 0.16 20 5.49 0.21 24 5.60 0.30
Ovary 20 0.067 0.003 22 0.070 0.004 17 0.068 0.003 21 0.066 0.002 18 0.068 0.003 21 0.068 0.003
Pituitary Gland 21 0.0099 0.0005 22 0.0100 0.0006 21 0.0112 0.0009 22 0.0098 0.0007 20 0.0099 0.0007 24 0.0104 0.0005
Spleen 21 0.286 0.011 22 0.307 0.013 21 0.304 0.008 22 0.288 0.009 20 0.314 0.010 24 0.307 0.011
Thymus 21 0.072 0.005 22 0.088 0.008 21 0.074 0.006 22 0.065 0.006 20 0.070 0.005 24 0.073 0.005
Thyroid Gland 21 0.0183 0.0008 22 0.0178 0.0008 21 0.0178 0.0007 22 0.0172 0.0006 20 0.0185 0.0010 24 0.0186 0.0007
Uterus 21 0.371 0.022 22 0.354 0.026 20 0.414 0.026 22 0.364 0.028 20 0.411 0.029 24 0.403 0.030

E0219001 Statistical Report
Analysis of Interim Sacrifice Organ Weight
27
Table 19. Summary Statistics of Female Relative Organ to Receiving Weight (mg/g) Bisphenol-A Continuous Dose (μg/kg'BW'/day)
0.0 2.5 25 250 2500 25000
Organ N Mean SE N Mean SE N Mean SE N Mean SE N Mean SE N Mean SE
Adrenal Gland 21 0.1781 0.0087 22 0.1633 0.0061 21 0.1690 0.0066 22 0.1863 0.0125 20 0.1832 0.0088 24 0.1776 0.0090
Brain 21 5.156 0.226 22 4.601 0.193 21 4.816 0.155 22 5.182 0.170 20 4.926 0.133 24 5.044 0.182
Fat Pad Ov/Pm 21 32.34 1.75 22 36.28 1.67 21 32.18 1.24 22 34.76 1.25 20 34.69 1.62 24 33.15 1.34
Fat Pad Retro 21 32.37 2.73 22 40.04 2.81 21 35.04 2.12 22 33.47 1.71 20 32.92 2.46 24 33.70 1.62
Heart 21 3.156 0.081 22 3.059 0.077 21 3.214 0.095 22 3.176 0.087 20 3.130 0.081 24 3.296 0.077
Kidney 21 5.50 0.17 22 5.43 0.17 21 5.69 0.22 22 5.47 0.12 20 5.51 0.17 23 5.59 0.13
Liver 21 25.52 0.58 22 25.94 0.76 21 27.31 0.60 22 26.40 0.56 20 26.67 0.70 24 27.22 0.67
Ovary 20 0.334 0.018 22 0.316 0.018 17 0.327 0.013 21 0.342 0.013 18 0.334 0.013 21 0.339 0.019
Pituitary Gland 21 0.0506 0.0034 22 0.0455 0.0025 21 0.0537 0.0045 22 0.0502 0.0034 20 0.0492 0.0040 24 0.0526 0.0032
Spleen 21 1.443 0.050 22 1.373 0.044 21 1.453 0.046 22 1.477 0.046 20 1.535 0.051 24 1.524 0.049
Thymus 21 0.369 0.031 22 0.387 0.026 21 0.348 0.024 22 0.329 0.028 20 0.340 0.021 24 0.357 0.021
Thyroid Gland 21 0.0927 0.0038 22 0.0809 0.0044 21 0.0846 0.0035 22 0.0889 0.0039 20 0.0907 0.0047 24 0.0923 0.0036
Uterus 21 1.916 0.150 22 1.644 0.145 20 1.981 0.148 22 1.890 0.164 20 2.046 0.169 24 2.072 0.211

E0219001 Statistical Report
Analysis of Interim Sacrifice Organ Weight
28
Table 20. Summary Statistics of Male Organ Weight (g) Bisphenol-A Continuous Dose (μg/kg'BW'/day)
0.0 2.5 25 250 2500 25000
Organ N Mean SE N Mean SE N Mean SE N Mean SE N Mean SE N Mean SE
Adrenal Gland 18 0.0601 0.0028 22 0.0642 0.0028 18 0.0680 0.0024 24 0.0625 0.0021 18 0.0617 0.0026 21 0.0574 0.0017
Brain 18 2.303 0.024 22 2.310 0.027 18 2.296 0.036 24 2.245 0.026 18 2.281 0.030 21 2.240 0.021
Epididymis (Paired) 18 1.285 0.037 22 1.213 0.037 18 1.321 0.025 24 1.271 0.040 18 1.272 0.035 21 1.250 0.025
Fat Pad Epidid 18 12.980 0.663 22 14.458 0.831 18 13.577 0.595 24 14.083 0.847 18 14.274 1.159 21 14.201 0.999
Fat Pad Retro 18 22.15 1.82 22 22.75 1.58 18 24.47 2.51 24 22.94 1.87 18 21.84 2.69 21 23.64 2.42
Heart 18 2.042 0.061 22 2.137 0.050 18 2.261 0.084 24 2.206 0.073 18 2.188 0.070 21 1.990 0.037
Kidney 17 4.08 0.15 22 4.20 0.12 17 4.15 0.17 24 4.05 0.11 17 4.00 0.17 21 3.88 0.08
Liver 18 22.14 0.93 22 21.11 0.69 18 22.65 0.96 24 22.35 0.58 18 22.14 0.97 21 20.62 0.59
Pituitary Gland 18 0.0146 0.0007 22 0.0146 0.0006 18 0.0152 0.0006 24 0.0161 0.0012 18 0.0154 0.0008 21 0.0151 0.0006
Sem Ves 18 1.185 0.043 22 1.113 0.047 18 1.145 0.049 24 1.171 0.053 18 1.096 0.057 21 1.189 0.043
Spleen 18 0.924 0.030 22 0.957 0.033 18 0.973 0.036 24 0.961 0.027 18 0.955 0.042 21 0.871 0.034
Testes (Paired) 18 3.591 0.117 22 3.435 0.127 18 3.619 0.079 24 3.378 0.135 18 3.559 0.079 21 3.513 0.115
Thymus 18 0.150 0.011 22 0.138 0.009 18 0.125 0.012 24 0.158 0.010 18 0.140 0.010 21 0.150 0.011
Thyroid Gland 18 0.0435 0.0020 22 0.0427 0.0024 18 0.0440 0.0025 24 0.0422 0.0016 18 0.0409 0.0019 21 0.0445 0.0018
Receiving Weight 18 700.86 19.23 22 722.41 20.17 18 709.29 21.23 24 713.39 15.46 18 703.99 25.55 21 694.74 17.93

E0219001 Statistical Report
Analysis of Interim Sacrifice Organ Weight
29
Table 21. Summary Statistics of Male Relative Organ to Brain Weight (g/g) Bisphenol-A Continuous Dose (μg/kg'BW'/day)
0.0 2.5 25 250 2500 25000
Organ N Mean SE N Mean SE N Mean SE N Mean SE N Mean SE N Mean SE
Adrenal Gland 18 0.0261 0.0012 22 0.0278 0.0011 18 0.0297 0.0011 24 0.0278 0.0008 18 0.0270 0.0010 21 0.0257 0.0008
Epididymis (Paired) 18 0.559 0.016 22 0.527 0.018 18 0.578 0.014 24 0.565 0.016 18 0.558 0.013 21 0.559 0.011
Fat Pad Epididymis 18 5.617 0.263 22 6.281 0.366 18 5.910 0.230 24 6.294 0.390 18 6.241 0.496 21 6.349 0.449
Fat Pad Retro 18 9.59 0.74 22 9.88 0.69 18 10.57 1.02 24 10.19 0.81 18 9.56 1.21 21 10.59 1.09
Heart 18 0.886 0.022 22 0.926 0.021 18 0.987 0.037 24 0.983 0.031 18 0.960 0.029 21 0.890 0.017
Kidney 17 1.77 0.05 22 1.82 0.05 17 1.80 0.06 24 1.80 0.04 17 1.75 0.07 21 1.73 0.04
Liver 18 9.58 0.34 22 9.15 0.29 18 9.84 0.34 24 9.97 0.26 18 9.71 0.43 21 9.21 0.26
Pituitary Gland 18 0.0063 0.0002 22 0.0063 0.0003 18 0.0067 0.0003 24 0.0071 0.0005 18 0.0067 0.0004 21 0.0067 0.0003
Seminal Vesicles 18 0.514 0.017 22 0.481 0.019 18 0.502 0.025 24 0.522 0.023 18 0.481 0.025 21 0.531 0.018
Spleen 18 0.401 0.012 22 0.415 0.014 18 0.425 0.016 24 0.428 0.011 18 0.419 0.018 21 0.389 0.014
Testes (Paired) 18 1.559 0.047 22 1.496 0.061 18 1.581 0.037 24 1.501 0.057 18 1.561 0.032 21 1.571 0.051
Thymus 18 0.065 0.005 22 0.060 0.004 18 0.054 0.005 24 0.071 0.004 18 0.062 0.005 21 0.067 0.005
Thyroid Gland 18 0.0188 0.0008 22 0.0185 0.0010 18 0.0191 0.0010 24 0.0188 0.0007 18 0.0178 0.0007 21 0.0199 0.0008

E0219001 Statistical Report
Analysis of Interim Sacrifice Organ Weight
30
Table 22. Summary Statistics of Male Relative Organ to Receiving Weight (mg/g) Bisphenol-A Continuous Dose (μg/kg'BW'/day)
0.0 2.5 25 250 2500 25000
Organ N Mean SE N Mean SE N Mean SE N Mean SE N Mean SE N Mean SE
Adrenal Gland 18 0.0862 0.0037 22 0.0896 0.0041 18 0.0967 0.0036 24 0.0881 0.0029 18 0.0884 0.0036 21 0.0831 0.0025
Brain 18 3.316 0.072 22 3.249 0.097 18 3.271 0.080 24 3.179 0.076 18 3.301 0.103 21 3.263 0.081
Epididymis (Paired) 18 1.849 0.061 22 1.705 0.069 18 1.889 0.061 24 1.793 0.063 18 1.831 0.058 21 1.821 0.055
Fat Pad Epididymis 18 18.463 0.780 22 19.759 0.707 18 19.186 0.703 24 19.489 0.999 18 19.984 1.124 21 20.225 1.152
Fat Pad Retro 18 31.27 1.98 22 30.94 1.49 18 33.70 2.63 24 31.46 2.26 18 29.69 2.72 21 33.25 2.87
Heart 18 2.925 0.074 22 2.995 0.094 18 3.204 0.103 24 3.106 0.095 18 3.140 0.094 21 2.882 0.049
Kidney 17 5.83 0.14 22 5.85 0.14 17 5.87 0.15 24 5.70 0.12 17 5.67 0.16 21 5.62 0.11
Liver 18 31.42 0.63 22 29.28 0.62 18 31.89 0.85 24 31.35 0.51 18 31.39 0.65 21 29.72 0.50
Pituitary Gland 18 0.0210 0.0009 22 0.0203 0.0007 18 0.0217 0.0010 24 0.0225 0.0016 18 0.0220 0.0010 21 0.0220 0.0011
Seminal Vesicles 18 1.701 0.060 22 1.559 0.071 18 1.638 0.088 24 1.660 0.085 18 1.585 0.097 21 1.734 0.076
Spleen 18 1.327 0.046 22 1.330 0.039 18 1.390 0.062 24 1.356 0.041 18 1.363 0.046 21 1.258 0.040
Testes (Paired) 18 5.162 0.181 22 4.823 0.208 18 5.178 0.187 24 4.769 0.209 18 5.118 0.132 21 5.135 0.223
Thymus 18 0.216 0.015 22 0.197 0.015 18 0.178 0.017 24 0.224 0.014 18 0.204 0.018 21 0.219 0.018
Thyroid Gland 18 0.0622 0.0024 22 0.0594 0.0029 18 0.0626 0.0036 24 0.0595 0.0022 18 0.0586 0.0027 21 0.0644 0.0027

E0219001 Statistical Report
Analysis of Interim Sacrifice Organ Weight
31
Table 23. ANOVA Results for Organ Weight1
for Bisphenol-A Continuous Dose (μg/kg'BW'/day)
Sex Organ Effect NumDF DenDF Fvalue P value
F Adrenal Gland Dose 5 124 0.226 0.950
Brain Dose 5 124 0.756 0.583
Fat Pad Ov/Pm Dose 5 124 1.499 0.195
Fat Pad Retro Dose 5 124 2.466 0.036
Heart Dose 5 124 2.131 0.066
Kidney Dose 5 123 2.868 0.017
Liver Dose 5 124 1.592 0.167
Ovary Dose 5 113 0.261 0.933
Pituitary Gland Dose 5 124 0.754 0.584
Spleen Dose 5 124 0.904 0.481
Thymus Dose 5 124 2.180 0.060
Thyroid Gland Dose 5 124 0.383 0.859
Uterus Dose 5 123 0.851 0.516
M Adrenal Gland Dose 5 115 2.180 0.061
Brain Dose 5 115 1.250 0.290
Epididymis (Paired) Dose 5 115 1.092 0.368
Fat Pad Epididymis Dose 5 115 0.370 0.868
Fat Pad Retro Dose 5 115 0.184 0.968
Heart Dose 5 115 2.546 0.031
Kidney Dose 5 112 0.768 0.574
Liver Dose 5 115 1.064 0.383
Pituitary Gland Dose 5 115 0.450 0.812
Seminal Vesicles Dose 5 115 0.603 0.697
Spleen Dose 5 115 1.282 0.276
Testes (Paired) Dose 5 115 0.678 0.640
Thymus Dose 5 115 1.247 0.291
Thyroid Gland Dose 5 115 0.407 0.843 1 Analyses were conducted separately for females and males.

E0219001 Statistical Report
Analysis of Interim Sacrifice Organ Weight
32
Table 24. Comparisons of Least Squares Mean Female Organ Weight for Bisphenol-A Continuous Dose (μg/kg'BW'/day)
0.0 2.5 25 250 2500 25000
Organ Mean SE P Mean SE Pct P Mean SE Pct P Mean SE Pct P Mean SE Pct P Mean SE Pct P
Adrenal Gland 0.072 0.004 0.846 0.076 0.003 105.5 0.884 0.075 0.004 103.5 0.980 0.075 0.003 104.1 0.960 0.076 0.004 105.7 0.880 0.073 0.003 101.3 0.999
Brain 2.086 0.026 0.213 2.112 0.025 101.3 0.912 2.102 0.026 100.8 0.988 2.083 0.025 99.9 0.999 2.048 0.026 98.2 0.753 2.076 0.024 99.5 0.998
Fat Pad Ov/Pm 14.056 0.957 0.438 17.117 0.935 121.8 0.092 14.411 0.957 102.5 0.999 14.428 0.935 102.6 0.998 14.837 0.981 105.6 0.969 14.205 0.896 101.1 0.999
Fat Pad Retro 14.094 1.451 0.184 19.778 1.418 140.3 0.025 16.060 1.451 114.0 0.798 14.123 1.418 100.2 0.999 14.135 1.487 100.3 0.999 14.700 1.357 104.3 0.998
Heart 1.308 0.043 0.690 1.435 0.042 109.7 0.133 1.415 0.043 108.1 0.270 1.289 0.042 98.5 0.997 1.313 0.044 100.3 0.999 1.379 0.040 105.4 0.620
Kidney 2.269 0.079 0.193 2.541 0.077 112.0 0.061 2.507 0.079 110.5 0.132 2.229 0.077 98.2 0.995 2.306 0.081 101.6 0.997 2.296 0.075 101.2 0.999
Liver 10.690 0.571 0.992 12.422 0.558 116.2 0.121 12.163 0.571 113.8 0.243 10.787 0.558 100.9 0.999 11.263 0.585 105.4 0.931 11.652 0.534 109.0 0.608
Ovary 0.140 0.006 0.618 0.147 0.006 104.7 0.906 0.142 0.007 101.0 0.999 0.138 0.006 98.3 0.999 0.140 0.007 99.5 0.999 0.140 0.006 100.0 1.000
Pituitary Gland 0.021 0.001 0.928 0.021 0.001 102.9 0.998 0.023 0.001 113.7 0.453 0.020 0.001 99.0 0.999 0.020 0.001 97.9 0.999 0.022 0.001 104.9 0.976
Spleen 0.598 0.024 0.453 0.648 0.023 108.3 0.419 0.638 0.024 106.6 0.638 0.600 0.023 100.3 0.999 0.642 0.024 107.4 0.554 0.638 0.022 106.7 0.605
Thymus 0.150 0.012 0.148 0.185 0.012 123.8 0.130 0.155 0.012 103.6 0.997 0.135 0.012 90.3 0.849 0.142 0.012 95.3 0.992 0.151 0.011 100.8 0.999
Thyroid Gland 0.038 0.002 0.910 0.037 0.002 97.7 0.994 0.037 0.002 97.4 0.989 0.036 0.002 93.7 0.717 0.038 0.002 98.9 0.999 0.039 0.002 100.8 0.999
Uterus 0.773 0.056 0.322 0.742 0.054 96.0 0.993 0.872 0.057 112.8 0.602 0.757 0.054 98.0 0.999 0.831 0.057 107.6 0.917 0.832 0.052 107.7 0.896
1. All p-values and % are relative to the control group, except p-values for the linear trend are presented under the control group.
E0219001 Statistical Report
Analysis of Interim Sacrifice Organ Weight
33
Table 25. Comparisons of Least Squares Mean Male Organ Weight for Bisphenol-A Continuous Dose (μg/kg'BW'/day)
0.0 2.5 25 250 2500 25000
Organ Mean SE P Mean SE Pct P Mean SE Pct P Mean SE Pct P Mean SE Pct P Mean SE Pct P
Adrenal Gland 0.060 0.003 0.197 0.064 0.002 106.9 0.619 0.068 0.003 113.2 0.110 0.063 0.002 104.1 0.912 0.062 0.003 102.7 0.988 0.057 0.002 95.5 0.894
Brain 2.303 0.029 0.057 2.310 0.026 100.3 0.999 2.296 0.029 99.7 0.999 2.245 0.025 97.5 0.415 2.281 0.029 99.1 0.979 2.240 0.027 97.3 0.368
Epididymis (Paired) 1.285 0.036 0.875 1.213 0.033 94.3 0.424 1.321 0.036 102.8 0.930 1.271 0.032 98.9 0.998 1.272 0.036 99.0 0.999 1.250 0.034 97.3 0.925
Fat Pad Epidid 12.980 0.929 0.418 14.458 0.841 111.4 0.635 13.577 0.929 104.6 0.987 14.083 0.805 108.5 0.828 14.274 0.929 110.0 0.773 14.201 0.860 109.4 0.786
Fat Pad Retro 22.154 2.273 0.861 22.751 2.056 102.7 0.999 24.468 2.273 110.4 0.919 22.943 1.969 103.6 0.999 21.845 2.273 98.6 0.999 23.641 2.105 106.7 0.984
Heart 2.042 0.068 0.773 2.137 0.061 104.7 0.732 2.261 0.068 110.8 0.090 2.206 0.059 108.0 0.236 2.188 0.068 107.2 0.395 1.990 0.063 97.5 0.971
Kidney 4.078 0.140 0.138 4.201 0.123 103.0 0.940 4.146 0.140 101.7 0.996 4.053 0.118 99.4 0.999 4.004 0.140 98.2 0.994 3.882 0.126 95.2 0.736
Liver 22.135 0.819 0.465 21.114 0.740 95.4 0.811 22.652 0.819 102.3 0.988 22.351 0.709 101.0 0.999 22.140 0.819 100.0 1.000 20.617 0.758 93.1 0.506
Pituitary Gland 0.015 0.001 0.443 0.015 0.001 99.8 0.999 0.015 0.001 103.9 0.987 0.016 0.001 109.6 0.616 0.015 0.001 105.1 0.961 0.015 0.001 103.1 0.994
Sem Ves 1.185 0.052 0.991 1.113 0.047 93.9 0.747 1.145 0.052 96.6 0.974 1.171 0.045 98.8 0.999 1.096 0.052 92.5 0.616 1.189 0.048 100.3 0.999
Spleen 0.924 0.036 0.320 0.957 0.032 103.6 0.932 0.973 0.036 105.3 0.775 0.961 0.031 104.0 0.889 0.955 0.036 103.3 0.957 0.871 0.033 94.2 0.695
Testes (Paired) 3.591 0.123 0.792 3.435 0.111 95.6 0.798 3.619 0.123 100.8 0.999 3.378 0.106 94.1 0.536 3.559 0.123 99.1 0.999 3.513 0.113 97.8 0.986
Thymus 0.150 0.011 0.685 0.138 0.010 92.1 0.881 0.125 0.011 83.3 0.343 0.158 0.010 105.2 0.975 0.140 0.011 93.1 0.939 0.150 0.010 99.8 0.999
Thyroid Gland 0.044 0.002 0.898 0.043 0.002 98.2 0.998 0.044 0.002 101.1 0.999 0.042 0.002 96.9 0.984 0.041 0.002 94.0 0.849 0.045 0.002 102.3 0.996
1. All p-values and % are relative to the control group, except p-values for the linear trend are presented under the control group.

E0219001 Statistical Report
Analysis of Interim Sacrifice Organ Weight
34
Table 26. ANOCOVA Results for Organ Weight with Covariate Brain Weight1
for Bisphenol-A Continuous Dose (μg/kg'BW'/day)
Sex Organ Effect NumDF DenDF Fvalue P value
F Adrenal Gland Brain Weight 1 123 2.096 0.150
Dose 5 123 0.240 0.944
Fat Pad Ov/Pm Brain Weight 1 123 10.117 0.001
Dose 5 123 1.351 0.247
Fat Pad Retro Brain Weight 1 123 4.182 0.042
Dose 5 123 2.142 0.064
Heart Brain Weight 1 123 8.708 0.003
Dose 5 123 1.833 0.111
Kidney Brain Weight 1 122 5.851 0.017
Dose 5 122 2.500 0.034
Liver Brain Weight 1 123 5.562 0.019
Dose 5 123 1.409 0.225
Ovary Brain Weight 1 112 6.397 0.012
Dose 5 112 0.166 0.974
Pituitary Gland Brain Weight 1 123 4.011 0.047
Dose 5 123 0.649 0.663
Spleen Brain Weight 1 123 9.432 0.002
Dose 5 123 0.992 0.425
Thymus Brain Weight 1 123 1.664 0.199
Dose 5 123 1.965 0.088
Thyroid Gland Brain Weight 1 123 1.722 0.191
Dose 5 123 0.425 0.830
Uterus Brain Weight 1 122 0.464 0.497
Dose 5 122 0.808 0.546
M Adrenal Gland Brain Weight 1 114 10.377 0.001
Dose 5 114 1.913 0.097
Epididymis (Paired) Brain Weight 1 114 6.705 0.010
Dose 5 114 1.226 0.301
Fat Pad Epididymis Brain Weight 1 114 2.676 0.104
Dose 5 114 0.458 0.806
Fat Pad Retro Brain Weight 1 114 4.321 0.039
Dose 5 114 0.272 0.927
Heart Brain Weight 1 114 12.930 <.001
Dose 5 114 2.703 0.023
Kidney Brain Weight 1 111 37.330 <.001
Dose 5 111 0.430 0.826
Liver Brain Weight 1 114 18.544 <.001
Dose 5 114 1.238 0.295
Pituitary Gland Brain Weight 1 114 3.876 0.051
Dose 5 114 0.678 0.640
Seminal Vesicles Brain Weight 1 114 5.397 0.021
Dose 5 114 0.866 0.506
Spleen Brain Weight 1 114 9.359 0.002
Dose 5 114 1.128 0.349
Testes (Paired) Brain Weight 1 114 3.041 0.083
Dose 5 114 0.596 0.703
Thymus Brain Weight 1 114 0.466 0.496
Dose 5 114 1.317 0.261
Thyroid Gland Brain Weight 1 114 14.282 <.001
Dose 5 114 0.643 0.667 1 Analyses were conducted separately for females and males.

E0219001 Statistical Report
Analysis of Interim Sacrifice Organ Weight
35
Table 27. Comparisons of Least Squares Mean Female Organ Weight with Covariate Brain Weight for Bisphenol-A Continuous Dose (μg/kg'BW'/day)
0.0 2.5 25 250 2500 25000
Organ Mean SE P Mean SE Pct P Mean SE Pct P Mean SE Pct P Mean SE Pct P Mean SE Pct P
Adrenal Gland 0.072 0.004 0.723 0.076 0.003 104.8 0.926 0.075 0.004 103.1 0.988 0.075 0.003 104.2 0.957 0.077 0.004 106.6 0.804 0.073 0.003 101.5 0.999
Fat Pad Ov/Pm 14.047 0.924 0.656 16.832 0.907 119.8 0.126 14.234 0.926 101.3 0.999 14.445 0.903 102.8 0.998 15.216 0.954 108.3 0.846 14.298 0.865 101.8 0.999
Fat Pad Retro 14.084 1.433 0.266 19.495 1.407 138.4 0.033 15.883 1.435 112.8 0.842 14.140 1.400 100.4 0.999 14.512 1.480 103.0 0.999 14.793 1.341 105.0 0.995
Heart 1.308 0.041 0.936 1.423 0.041 108.8 0.178 1.407 0.041 107.6 0.304 1.290 0.040 98.6 0.997 1.328 0.043 101.5 0.996 1.383 0.039 105.7 0.540
Kidney 2.268 0.077 0.314 2.521 0.076 111.2 0.082 2.494 0.078 110.0 0.150 2.229 0.076 98.3 0.996 2.329 0.080 102.7 0.973 2.306 0.074 101.7 0.996
Liver 10.686 0.561 0.800 12.294 0.551 115.0 0.157 12.083 0.562 113.1 0.274 10.795 0.548 101.0 0.999 11.433 0.579 107.0 0.819 11.694 0.525 109.4 0.550
Ovary 0.140 0.006 0.814 0.145 0.006 103.8 0.958 0.141 0.007 100.6 0.999 0.138 0.006 98.7 0.999 0.142 0.007 101.4 0.999 0.140 0.006 100.1 0.999
Pituitary Gland 0.021 0.001 0.894 0.021 0.001 101.6 0.999 0.023 0.001 112.9 0.498 0.020 0.001 99.2 0.999 0.021 0.001 99.7 0.999 0.022 0.001 105.4 0.964
Spleen 0.598 0.023 0.267 0.641 0.022 107.2 0.527 0.633 0.023 106.0 0.701 0.600 0.022 100.4 0.999 0.651 0.024 108.9 0.346 0.640 0.021 107.1 0.521
Thymus 0.149 0.012 0.193 0.184 0.012 122.8 0.156 0.154 0.012 103.0 0.998 0.135 0.012 90.4 0.853 0.144 0.012 96.6 0.998 0.151 0.011 101.2 0.999
Thyroid Gland 0.038 0.002 0.796 0.037 0.002 97.2 0.985 0.037 0.002 97.0 0.982 0.036 0.002 93.7 0.721 0.038 0.002 99.7 0.999 0.039 0.002 101.0 0.999
Uterus 0.773 0.056 0.363 0.746 0.055 96.5 0.996 0.873 0.057 113.0 0.592 0.757 0.055 98.0 0.999 0.827 0.058 106.9 0.943 0.831 0.052 107.5 0.905
1. All p-values and % are relative to the control group, except p-values for the linear trend are presented under the control group.

E0219001 Statistical Report
Analysis of Interim Sacrifice Organ Weight
36
Table 28. Comparisons of Least Squares Mean Male Organ Weight with Covariate Brain Weight for Bisphenol-A Continuous Dose (μg/kg'BW'/day)
0.0 2.5 25 250 2500 25000
Organ Mean SE P Mean SE Pct P Mean SE Pct P Mean SE Pct P Mean SE Pct P Mean SE Pct P
Adrenal Gland 0.059 0.002 0.449 0.063 0.002 106.6 0.625 0.068 0.002 113.6 0.080 0.063 0.002 106.6 0.617 0.062 0.002 103.6 0.955 0.058 0.002 98.1 0.997
Epididymis (Paired) 1.278 0.036 0.766 1.203 0.032 94.1 0.375 1.316 0.036 102.9 0.907 1.280 0.031 100.2 0.999 1.271 0.036 99.5 0.999 1.261 0.033 98.7 0.996
Fat Pad Epidid 12.858 0.926 0.276 14.301 0.840 111.2 0.650 13.489 0.924 104.9 0.983 14.241 0.805 110.8 0.677 14.254 0.923 110.9 0.715 14.381 0.861 111.8 0.622
Fat Pad Retro 21.779 2.248 0.590 22.268 2.040 102.2 0.999 24.196 2.245 111.1 0.900 23.428 1.955 107.6 0.971 21.785 2.241 100.0 1.000 24.198 2.092 111.1 0.890
Heart 2.023 0.065 0.739 2.113 0.059 104.4 0.739 2.248 0.065 111.1 0.060 2.230 0.056 110.2 0.069 2.185 0.064 108.0 0.261 2.018 0.060 99.8 0.999
Kidney 4.031 0.122 0.460 4.126 0.108 102.4 0.963 4.103 0.122 101.8 0.991 4.129 0.103 102.5 0.955 3.976 0.122 98.7 0.997 3.970 0.111 98.5 0.995
Liver 21.871 0.765 0.987 20.774 0.694 95.0 0.717 22.461 0.764 102.7 0.972 22.693 0.665 103.8 0.879 22.098 0.763 101.0 0.999 21.010 0.712 96.1 0.872
Pituitary Gland 0.015 0.001 0.268 0.014 0.001 99.5 0.999 0.015 0.001 104.2 0.982 0.016 0.001 111.9 0.425 0.015 0.001 105.9 0.928 0.015 0.001 105.5 0.940
Sem Ves 1.175 0.051 0.691 1.101 0.047 93.7 0.706 1.138 0.051 96.8 0.979 1.183 0.045 100.7 0.999 1.095 0.051 93.1 0.682 1.203 0.048 102.4 0.993
Spleen 0.915 0.034 0.632 0.946 0.031 103.3 0.942 0.967 0.034 105.6 0.718 0.972 0.030 106.2 0.599 0.953 0.034 104.1 0.894 0.883 0.032 96.5 0.935
Testes (Paired) 3.574 0.122 0.964 3.413 0.111 95.5 0.774 3.606 0.122 100.9 0.999 3.400 0.106 95.1 0.711 3.556 0.121 99.5 0.999 3.538 0.113 99.0 0.999
Thymus 0.150 0.011 0.605 0.138 0.010 91.9 0.877 0.125 0.011 83.3 0.352 0.159 0.010 106.1 0.954 0.140 0.011 93.4 0.951 0.151 0.010 100.8 0.999
Thyroid Gland 0.043 0.002 0.595 0.042 0.002 97.7 0.995 0.044 0.002 101.5 0.999 0.043 0.002 100.1 0.999 0.041 0.002 95.1 0.916 0.045 0.002 106.0 0.821
1. All p-values and % are relative to the control group, except p-values for the linear trend are presented under the control group.

E0219001 Statistical Report
Analysis of Interim Sacrifice Organ Weight
37
Table 29. ANOCOVA Results for Organ Weight with Covariate Receiving Weight1
for Bisphenol-A Continuous Dose (μg/kg'BW'/day)
Sex Organ Effect NumDF DenDF Fvalue P value
F Adrenal Gland Receiving Weight 1 123 12.973 <.001
Dose 5 123 0.261 0.933
Fat Pad Ov/Pm Receiving Weight 1 123 138.773 <.001
Dose 5 123 0.790 0.558
Fat Pad Retro Receiving Weight 1 123 254.121 <.001
Dose 5 123 0.679 0.640
Heart Receiving Weight 1 123 134.178 <.001
Dose 5 123 1.144 0.341
Kidney Receiving Weight 1 122 85.752 <.001
Dose 5 122 1.168 0.328
Liver Receiving Weight 1 123 317.401 <.001
Dose 5 123 1.301 0.267
Ovary Receiving Weight 1 112 10.566 0.001
Dose 5 112 0.014 0.999
Pituitary Gland Receiving Weight 1 123 2.317 0.130
Dose 5 123 0.661 0.653
Spleen Receiving Weight 1 123 78.918 <.001
Dose 5 123 0.957 0.447
Thymus Receiving Weight 1 123 22.100 <.001
Dose 5 123 0.996 0.423
Thyroid Gland Receiving Weight 1 123 16.097 <.001
Dose 5 123 0.639 0.670
Uterus Receiving Weight 1 122 3.354 0.069
Dose 5 122 0.862 0.509
M Adrenal Gland Receiving Weight 1 114 20.032 <.001
Dose 5 114 2.113 0.068
Epididymis (Paired) Receiving Weight 1 114 7.748 0.006
Dose 5 114 1.276 0.279
Fat Pad Epididymis Receiving Weight 1 114 110.607 <.001
Dose 5 114 0.655 0.658
Fat Pad Retro Receiving Weight 1 114 149.524 <.001
Dose 5 114 0.786 0.561
Heart Receiving Weight 1 114 40.517 <.001
Dose 5 114 2.846 0.018
Kidney Receiving Weight 1 111 115.172 <.001
Dose 5 111 0.819 0.538
Liver Receiving Weight 1 114 234.755 <.001
Dose 5 114 3.317 0.007
Pituitary Gland Receiving Weight 1 114 10.883 0.001
Dose 5 114 0.509 0.768
Seminal Vesicles Receiving Weight 1 114 1.556 0.214
Dose 5 114 0.656 0.657
Spleen Receiving Weight 1 114 30.880 <.001
Dose 5 114 1.173 0.326
Testes (Paired) Receiving Weight 1 114 3.886 0.051
Dose 5 114 0.787 0.561
Thymus Receiving Weight 1 114 0.089 0.765
Dose 5 114 1.230 0.299
Thyroid Gland Receiving Weight 1 114 16.636 <.001
Dose 5 114 0.601 0.699 1 Analyses were conducted separately for females and males.

E0219001 Statistical Report
Analysis of Interim Sacrifice Organ Weight
38
Table 30. Comparisons of Least Squares Mean Female Organ Weight with Covariate Receiving Weight for Bisphenol-A Continuous Dose (μg/kg'BW'/day)
0.0 2.5 25 250 2500 25000
Organ Mean SE P Mean SE Pct P Mean SE Pct P Mean SE Pct P Mean SE Pct P Mean SE Pct P
Adrenal Gland 0.073 0.003 0.545 0.074 0.003 100.6 0.999 0.074 0.003 101.4 0.999 0.077 0.003 104.9 0.906 0.077 0.003 105.5 0.870 0.074 0.003 100.9 0.999
Fat Pad Ov/Pm 14.577 0.660 0.839 15.370 0.661 105.4 0.867 13.936 0.660 95.6 0.937 15.323 0.648 105.1 0.884 15.301 0.676 105.0 0.904 14.560 0.617 99.9 0.999
Fat Pad Retro 14.982 0.834 0.603 16.793 0.834 112.1 0.407 15.248 0.834 101.8 0.999 15.653 0.819 104.5 0.968 14.927 0.854 99.6 0.999 15.307 0.779 102.2 0.998
Heart 1.331 0.030 0.466 1.358 0.030 102.0 0.956 1.394 0.030 104.7 0.429 1.329 0.029 99.8 0.999 1.333 0.030 100.1 0.999 1.395 0.028 104.8 0.380
Kidney 2.303 0.061 0.725 2.406 0.061 104.4 0.647 2.467 0.061 107.1 0.214 2.291 0.060 99.5 0.999 2.335 0.062 101.4 0.995 2.345 0.058 101.8 0.983
Liver 11.052 0.304 0.049 11.207 0.304 101.4 0.996 11.832 0.304 107.1 0.249 11.410 0.298 103.2 0.866 11.585 0.311 104.8 0.610 11.899 0.284 107.7 0.159
Ovary 0.141 0.006 0.913 0.142 0.006 101.1 0.999 0.141 0.007 100.4 0.999 0.140 0.006 99.7 0.999 0.141 0.006 100.1 0.999 0.141 0.006 100.0 1.000
Pituitary Gland 0.021 0.001 0.935 0.021 0.001 99.9 1.000 0.023 0.001 112.3 0.549 0.021 0.001 99.5 0.999 0.020 0.001 97.9 0.999 0.022 0.001 104.7 0.980
Spleen 0.609 0.019 0.053 0.611 0.019 100.3 0.999 0.628 0.019 103.1 0.928 0.619 0.018 101.6 0.994 0.652 0.019 107.1 0.349 0.645 0.017 106.0 0.464
Thymus 0.153 0.011 0.302 0.173 0.011 113.4 0.559 0.152 0.011 99.2 0.999 0.141 0.011 92.1 0.897 0.146 0.011 95.1 0.986 0.153 0.010 100.1 1.000
Thyroid Gland 0.039 0.002 0.570 0.036 0.002 93.1 0.614 0.037 0.002 95.4 0.873 0.037 0.001 94.5 0.770 0.038 0.002 98.8 0.999 0.039 0.001 100.4 0.999
Uterus 0.766 0.055 0.433 0.765 0.055 99.8 0.999 0.880 0.057 114.9 0.466 0.745 0.054 97.4 0.999 0.825 0.057 107.8 0.911 0.828 0.052 108.1 0.880
1. All p-values and % are relative to the control group, except p-values for the linear trend are presented under the control group.

E0219001 Statistical Report
Analysis of Interim Sacrifice Organ Weight
39
Table 31. Comparisons of Least Squares Mean Male Organ Weight with Covariate Receiving Weight for Bisphenol-A Continuous Dose (μg/kg'BW'/day)
0.0 2.5 25 250 2500 25000
Organ Mean SE P Mean SE Pct P Mean SE Pct P Mean SE Pct P Mean SE Pct P Mean SE Pct P
Adrenal Gland 0.060 0.002 0.234 0.064 0.002 105.1 0.778 0.068 0.002 112.5 0.097 0.062 0.002 103.1 0.958 0.062 0.002 102.4 0.989 0.058 0.002 96.0 0.907
Epididymis (Paired) 1.288 0.035 0.972 1.206 0.032 93.6 0.288 1.320 0.035 102.5 0.949 1.268 0.031 98.4 0.990 1.274 0.035 98.9 0.998 1.256 0.033 97.5 0.938
Fat Pad Epidid 13.200 0.665 0.110 14.006 0.603 106.1 0.829 13.535 0.665 102.5 0.995 13.913 0.576 105.4 0.877 14.396 0.665 109.1 0.569 14.612 0.617 110.7 0.378
Fat Pad Retro 22.733 1.502 0.414 21.565 1.362 94.9 0.966 24.356 1.502 107.1 0.900 22.496 1.301 99.0 0.999 22.166 1.502 97.5 0.998 24.720 1.393 108.7 0.782
Heart 2.053 0.058 0.963 2.113 0.053 102.9 0.904 2.259 0.058 110.0 0.057 2.197 0.051 107.0 0.227 2.195 0.058 106.9 0.294 2.012 0.054 98.0 0.979
Kidney 4.114 0.099 0.083 4.135 0.087 100.5 0.999 4.154 0.099 101.0 0.998 4.029 0.083 97.9 0.939 4.005 0.099 97.3 0.888 3.944 0.089 95.9 0.557
Liver 22.362 0.470 0.563 20.649 0.426 92.3 0.033 22.608 0.470 101.1 0.995 22.175 0.407 99.2 0.998 22.266 0.470 99.6 0.999 21.040 0.436 94.1 0.149
Pituitary Gland 0.015 0.001 0.344 0.014 0.001 97.9 0.998 0.015 0.001 103.2 0.993 0.016 0.001 108.5 0.681 0.015 0.001 104.8 0.963 0.015 0.001 103.6 0.987
Sem Ves 1.187 0.052 0.963 1.109 0.047 93.4 0.685 1.145 0.052 96.4 0.966 1.169 0.045 98.5 0.999 1.097 0.052 92.4 0.605 1.193 0.048 100.5 0.999
Spleen 0.929 0.032 0.387 0.946 0.029 101.7 0.994 0.972 0.032 104.6 0.793 0.957 0.027 102.9 0.945 0.958 0.032 103.0 0.951 0.881 0.029 94.8 0.678
Testes (Paired) 3.599 0.121 0.859 3.419 0.110 95.0 0.696 3.617 0.121 100.5 0.999 3.372 0.105 93.7 0.468 3.563 0.121 99.0 0.999 3.527 0.112 98.0 0.990
Thymus 0.150 0.011 0.697 0.139 0.010 92.3 0.894 0.125 0.011 83.3 0.352 0.158 0.010 105.3 0.973 0.140 0.011 93.1 0.941 0.150 0.010 99.7 0.999
Thyroid Gland 0.044 0.002 0.961 0.042 0.002 96.4 0.964 0.044 0.002 100.3 0.999 0.042 0.002 95.8 0.934 0.041 0.002 93.8 0.790 0.045 0.002 102.8 0.988
1. All p-values and % are relative to the control group, except p-values for the linear trend are presented under the control group.

E0219001 Statistical Report
Analysis of Interim Sacrifice Organ Weight
40
c) EE2 Treatments Continuous Dose
Table 32. Summary Statistics of Female Organ Weight (g)
Ethinyl Estradiol Dose (μg/kg'BW'/day)
0.0 0.05 0.5
Organ N Mean SE N Mean SE N Mean SE
Adrenal Gland 21 0.0724 0.0020 24 0.0753 0.0042 26 0.0922 0.0038
Brain 21 2.086 0.017 24 2.094 0.017 26 2.068 0.018
Fat Pad Ov/Pm 21 14.06 1.16 24 15.53 0.76 26 11.41 0.65
Fat Pad Retro 21 14.09 1.51 24 15.56 1.25 26 12.97 0.94
Heart 21 1.308 0.048 24 1.404 0.035 26 1.415 0.038
Kidney 21 2.27 0.07 23 2.42 0.08 26 2.61 0.08
Liver 21 10.69 0.52 24 12.09 0.45 26 12.77 0.47
Ovary 20 0.140 0.008 23 0.143 0.004 23 0.115 0.008
Pituitary Gland 21 0.0206 0.0011 24 0.0227 0.0017 26 0.0269 0.0012
Spleen 21 0.598 0.025 24 0.645 0.021 26 0.646 0.025
Thymus 21 0.150 0.011 24 0.137 0.010 26 0.137 0.009
Thyroid Gland 21 0.0382 0.0017 24 0.0390 0.0018 26 0.0365 0.0012
Uterus 21 0.773 0.045 24 0.777 0.038 26 0.827 0.037
Receiving Weight 21 420.41 18.98 24 453.14 13.31 26 422.72 11.99

E0219001 Statistical Report
Analysis of Interim Sacrifice Organ Weight
41
Table 33. Summary Statistics of Female Relative Organ to Brain Weight (g/g)
Ethinyl Estradiol Dose (μg/kg'BW'/day)
0.0 0.05 0.5
Organ N Mean SE N Mean SE N Mean SE
Adrenal Gland 21 0.0348 0.0010 24 0.0360 0.0019 26 0.0447 0.0019
Fat Pad Ov/Pm 21 6.72 0.54 24 7.42 0.35 26 5.50 0.30
Fat Pad Retro 21 6.72 0.70 24 7.41 0.58 26 6.26 0.44
Heart 21 0.628 0.023 24 0.670 0.015 26 0.684 0.016
Kidney 21 1.09 0.03 23 1.15 0.04 26 1.26 0.04
Liver 21 5.12 0.24 24 5.77 0.20 26 6.17 0.21
Ovary 20 0.067 0.003 23 0.068 0.002 23 0.056 0.004
Pituitary Gland 21 0.0099 0.0005 24 0.0108 0.0008 26 0.0131 0.0006
Spleen 21 0.286 0.011 24 0.308 0.010 26 0.311 0.011
Thymus 21 0.072 0.005 24 0.065 0.005 26 0.066 0.004
Thyroid Gland 21 0.0183 0.0008 24 0.0186 0.0008 26 0.0177 0.0006
Uterus 21 0.371 0.022 24 0.372 0.019 26 0.399 0.016
Table 34. Summary Statistics of Female Relative Organ to Receiving Weight (mg/g)
Ethinyl Estradiol Dose (μg/kg'BW'/day)
0.0 0.05 0.5
Organ N Mean SE N Mean SE N Mean SE
Adrenal Gland 21 0.1781 0.0087 24 0.1691 0.0098 26 0.2184 0.0071
Brain 21 5.156 0.226 24 4.709 0.137 26 4.979 0.132
Fat Pad Ov/Pm 21 32.34 1.75 24 34.06 0.98 26 26.69 1.04
Fat Pad Retro 21 32.37 2.73 24 33.72 1.95 26 30.02 1.53
Heart 21 3.156 0.081 24 3.133 0.086 26 3.360 0.041
Kidney 21 5.50 0.17 23 5.34 0.10 26 6.19 0.10
Liver 21 25.52 0.58 24 26.73 0.68 26 30.12 0.53
Ovary 20 0.334 0.018 23 0.323 0.014 23 0.280 0.021
Pituitary Gland 21 0.0506 0.0034 24 0.0504 0.0036 26 0.0645 0.0029
Spleen 21 1.443 0.050 24 1.434 0.039 26 1.525 0.039
Thymus 21 0.369 0.031 24 0.302 0.020 26 0.324 0.018
Thyroid Gland 21 0.0927 0.0038 24 0.0860 0.0026 26 0.0877 0.0032
Uterus 21 1.916 0.150 24 1.760 0.114 26 1.971 0.088

E0219001 Statistical Report
Analysis of Interim Sacrifice Organ Weight
42
Table 35. Summary Statistics of Male Organ Weight (g)
Ethinyl Estradiol Dose (μg/kg'BW'/day)
0.0 0.05 0.5
Organ N Mean SE N Mean SE N Mean SE
Adrenal Gland 18 0.0601 0.0028 21 0.0626 0.0022 23 0.0629 0.0018
Brain 18 2.303 0.024 22 2.290 0.016 23 2.318 0.021
Epididymis (Paired) 18 1.285 0.037 22 1.243 0.034 23 1.335 0.031
Fat Pad Epidid 18 12.980 0.663 22 14.180 0.768 23 12.838 0.779
Fat Pad Retro 18 22.15 1.82 22 22.65 2.34 23 20.95 2.30
Heart 18 2.042 0.061 22 2.106 0.056 23 2.116 0.048
Kidney 17 4.08 0.15 21 4.01 0.13 23 4.17 0.12
Liver 18 22.14 0.93 22 22.16 0.74 23 23.06 0.64
Pituitary Gland 18 0.0146 0.0007 22 0.0156 0.0006 23 0.0160 0.0005
Sem Ves 18 1.185 0.043 22 1.270 0.059 23 1.124 0.042
Spleen 18 0.924 0.030 22 0.936 0.035 23 1.010 0.050
Testes (Paired) 18 3.591 0.117 22 3.478 0.093 23 3.564 0.090
Thymus 18 0.150 0.011 22 0.124 0.011 23 0.154 0.010
Thyroid Gland 18 0.0435 0.0020 22 0.0436 0.0020 23 0.0437 0.0015
Receiving Weight 18 700.86 19.23 22 712.31 21.34 23 704.45 15.59

E0219001 Statistical Report
Analysis of Interim Sacrifice Organ Weight
43
Table 36. Summary Statistics of Male Relative Organ to Brain Weight (g/g)
Ethinyl Estradiol Dose (μg/kg'BW'/day)
0.0 0.05 0.5
Organ N Mean SE N Mean SE N Mean SE
Adrenal Gland 18 0.0261 0.0012 21 0.0274 0.0009 23 0.0271 0.0007
Epididymis (Paired) 18 0.559 0.016 22 0.543 0.014 23 0.576 0.013
Fat Pad Epididymis 18 5.617 0.263 22 6.181 0.320 23 5.540 0.333
Fat Pad Retro 18 9.59 0.74 22 9.79 0.97 23 9.04 1.01
Heart 18 0.886 0.022 22 0.919 0.021 23 0.913 0.020
Kidney 17 1.77 0.05 21 1.75 0.05 23 1.80 0.05
Liver 18 9.58 0.34 22 9.66 0.29 23 9.96 0.29
Pituitary Gland 18 0.0063 0.0002 22 0.0068 0.0003 23 0.0069 0.0002
Seminal Vesicles 18 0.514 0.017 22 0.555 0.026 23 0.486 0.019
Spleen 18 0.401 0.012 22 0.408 0.015 23 0.436 0.021
Testes (Paired) 18 1.559 0.047 22 1.519 0.040 23 1.538 0.037
Thymus 18 0.065 0.005 22 0.054 0.005 23 0.067 0.004
Thyroid Gland 18 0.0188 0.0008 22 0.0190 0.0009 23 0.0189 0.0006
Table 37. Summary Statistics of Male Relative Organ to Receiving Weight (mg/g)
Ethinyl Estradiol Dose (μg/kg'BW'/day)
0.0 0.05 0.5
Organ N Mean SE N Mean SE N Mean SE
Adrenal Gland 18 0.0862 0.0037 21 0.0893 0.0032 23 0.0898 0.0027
Brain 18 3.316 0.072 22 3.266 0.086 23 3.323 0.072
Epididymis (Paired) 18 1.849 0.061 22 1.765 0.055 23 1.903 0.041
Fat Pad Epidid 18 18.463 0.780 22 19.759 0.723 23 17.991 0.771
Fat Pad Retro 18 31.27 1.98 22 30.88 2.47 23 28.95 2.72
Heart 18 2.925 0.074 22 2.986 0.085 23 3.023 0.075
Kidney 17 5.83 0.14 21 5.63 0.10 23 5.91 0.09
Liver 18 31.42 0.63 22 31.11 0.47 23 32.69 0.44
Pituitary Gland 18 0.0210 0.0009 22 0.0221 0.0008 23 0.0230 0.0009
Seminal Vesicles 18 1.701 0.060 22 1.815 0.100 23 1.601 0.054
Spleen 18 1.327 0.046 22 1.320 0.043 23 1.438 0.072
Testes (Paired) 18 5.162 0.181 22 4.957 0.181 23 5.086 0.129
Thymus 18 0.216 0.015 22 0.173 0.013 23 0.218 0.012
Thyroid Gland 18 0.0622 0.0024 22 0.0616 0.0026 23 0.0623 0.0021

E0219001 Statistical Report
Analysis of Interim Sacrifice Organ Weight
44
Table 38. ANOVA Results for Organ Weight1
for Ethinyl Estradiol Dose (μg/kg'BW'/day)
Sex Organ Effect NumDF DenDF Fvalue P value
F Adrenal Gland Dose 2 68 9.275 <.001
Brain Dose 2 68 0.578 0.563
Fat Pad Ov/Pm Dose 2 68 6.431 0.002
Fat Pad Retro Dose 2 68 1.187 0.311
Heart Dose 2 68 2.027 0.139
Kidney Dose 2 67 5.064 0.008
Liver Dose 2 68 4.744 0.011
Ovary Dose 2 63 5.639 0.005
Pituitary Gland Dose 2 68 5.675 0.005
Spleen Dose 2 68 1.237 0.296
Thymus Dose 2 68 0.465 0.630
Thyroid Gland Dose 2 68 0.696 0.502
Uterus Dose 2 68 0.612 0.545
M Adrenal Gland Dose 2 59 0.444 0.643
Brain Dose 2 60 0.506 0.605
Epididymis (Paired) Dose 2 60 1.989 0.145
Fat Pad Epididymis Dose 2 60 0.995 0.375
Fat Pad Retro Dose 2 60 0.165 0.848
Heart Dose 2 60 0.503 0.607
Kidney Dose 2 58 0.403 0.670
Liver Dose 2 60 0.501 0.608
Pituitary Gland Dose 2 60 1.411 0.251
Seminal Vesicles Dose 2 60 2.383 0.100
Spleen Dose 2 60 1.320 0.274
Testes (Paired) Dose 2 60 0.356 0.701
Thymus Dose 2 60 2.524 0.088
Thyroid Gland Dose 2 60 0.004 0.995 1 Analyses were conducted separately for females and males.

E0219001 Statistical Report
Analysis of Interim Sacrifice Organ Weight
45
Table 39. Comparisons of Least Squares Mean Female Organ Weight
for Ethinyl Estradiol Dose (μg/kg'BW'/day)
0.0 0.05 0.5
Organ Mean SE Mean SE Pct P Mean SE Pct P
Adrenal Gland 0.072 0.004 0.075 0.004 104.0 0.792 0.092 0.003 127.4 <.001
Brain 2.086 0.019 2.094 0.018 100.4 0.926 2.068 0.017 99.2 0.709
Fat Pad Ov/Pm 14.056 0.900 15.530 0.842 110.5 0.380 11.407 0.809 81.2 0.057
Fat Pad Retro 14.094 1.294 15.556 1.210 110.4 0.615 12.974 1.163 92.1 0.739
Heart 1.308 0.042 1.404 0.040 107.3 0.181 1.415 0.038 108.2 0.115
Kidney 2.269 0.082 2.415 0.078 106.5 0.327 2.615 0.073 115.2 0.004
Liver 10.690 0.508 12.093 0.475 113.1 0.085 12.775 0.457 119.5 0.006
Ovary 0.140 0.007 0.143 0.007 102.0 0.938 0.115 0.007 81.8 0.017
Pituitary Gland 0.021 0.001 0.023 0.001 110.1 0.463 0.027 0.001 130.6 0.003
Spleen 0.598 0.025 0.645 0.024 107.9 0.293 0.646 0.023 108.0 0.276
Thymus 0.150 0.011 0.137 0.010 91.8 0.607 0.137 0.010 91.8 0.594
Thyroid Gland 0.038 0.002 0.039 0.002 102.0 0.917 0.037 0.001 95.6 0.657
Uterus 0.773 0.042 0.777 0.039 100.5 0.996 0.827 0.038 107.1 0.523
1. All p-values and % are relative to the control group.
Table 40. Comparisons of Least Squares Mean Male Organ Weight
for Ethinyl Estradiol Dose (μg/kg'BW'/day)
0.0 0.05 0.5
Organ Mean SE Mean SE Pct P Mean SE Pct P
Adrenal Gland 0.060 0.002 0.063 0.002 104.2 0.654 0.063 0.002 104.7 0.578
Brain 2.303 0.022 2.290 0.020 99.5 0.876 2.318 0.020 100.7 0.813
Epididymis (Paired) 1.285 0.036 1.243 0.033 96.7 0.589 1.335 0.032 103.8 0.486
Fat Pad Epidid 12.980 0.813 14.180 0.735 109.2 0.438 12.838 0.719 98.9 0.987
Fat Pad Retro 22.154 2.400 22.651 2.171 102.2 0.982 20.953 2.123 94.6 0.899
Heart 2.042 0.059 2.106 0.053 103.2 0.621 2.116 0.052 103.6 0.537
Kidney 4.078 0.145 4.014 0.130 98.4 0.922 4.175 0.125 102.4 0.824
Liver 22.135 0.822 22.156 0.743 100.1 0.999 23.059 0.727 104.2 0.602
Pituitary Gland 0.015 0.001 0.016 0.001 106.7 0.408 0.016 0.001 109.6 0.175
Sem Ves 1.185 0.053 1.270 0.048 107.2 0.380 1.124 0.047 94.9 0.593
Spleen 0.924 0.044 0.936 0.040 101.3 0.971 1.010 0.039 109.3 0.254
Testes (Paired) 3.591 0.106 3.478 0.096 96.8 0.638 3.564 0.094 99.2 0.972
Thymus 0.150 0.011 0.124 0.010 82.5 0.161 0.154 0.010 102.8 0.944
Thyroid Gland 0.044 0.002 0.044 0.002 100.2 0.999 0.044 0.002 100.5 0.994
1. All p-values and % are relative to the control group.

E0219001 Statistical Report
Analysis of Interim Sacrifice Organ Weight
46
Table 41. ANOCOVA Results for Organ Weight with Covariate Brain Weight1
for Ethinyl Estradiol Dose (μg/kg'BW'/day)
Sex Organ Effect NumDF DenDF Fvalue P value
F Adrenal Gland Brain Weight 1 67 0.746 0.390
Dose 2 67 9.551 <.001
Fat Pad Ov/Pm Brain Weight 1 67 4.956 0.029
Dose 2 67 5.680 0.005
Fat Pad Retro Brain Weight 1 67 6.270 0.014
Dose 2 67 0.816 0.446
Heart Brain Weight 1 67 9.624 0.002
Dose 2 67 2.627 0.079
Kidney Brain Weight 1 66 3.707 0.058
Dose 2 66 5.860 0.004
Liver Brain Weight 1 67 8.376 0.005
Dose 2 67 5.939 0.004
Ovary Brain Weight 1 62 0.169 0.682
Dose 2 62 5.188 0.008
Pituitary Gland Brain Weight 1 67 0.948 0.333
Dose 2 67 5.958 0.004
Spleen Brain Weight 1 67 14.924 <.001
Dose 2 67 1.802 0.172
Thymus Brain Weight 1 67 6.868 0.010
Dose 2 67 0.489 0.615
Thyroid Gland Brain Weight 1 67 0.728 0.396
Dose 2 67 0.559 0.574
Uterus Brain Weight 1 67 1.216 0.274
Dose 2 67 0.762 0.470
M Adrenal Gland Brain Weight 1 58 0.899 0.347
Dose 2 58 0.436 0.648
Epididymis (Paired) Brain Weight 1 59 5.148 0.026
Dose 2 59 1.537 0.223
Fat Pad Epididymis Brain Weight 1 59 5.776 0.019
Dose 2 59 1.511 0.229
Fat Pad Retro Brain Weight 1 59 6.709 0.012
Dose 2 59 0.430 0.652
Heart Brain Weight 1 59 18.141 <.001
Dose 2 59 0.678 0.511
Kidney Brain Weight 1 57 16.439 <.001
Dose 2 57 0.093 0.911
Liver Brain Weight 1 59 12.112 <.001
Dose 2 59 0.250 0.779
Pituitary Gland Brain Weight 1 59 5.810 0.019
Dose 2 59 1.364 0.263
Seminal Vesicles Brain Weight 1 59 0.772 0.383
Dose 2 59 2.583 0.084
Spleen Brain Weight 1 59 3.739 0.057
Dose 2 59 1.045 0.358
Testes (Paired) Brain Weight 1 59 5.808 0.019
Dose 2 59 0.238 0.789
Thymus Brain Weight 1 59 2.274 0.136
Dose 2 59 2.163 0.123
Thyroid Gland Brain Weight 1 59 9.282 0.003
Dose 2 59 0.054 0.947 1 Analyses were conducted separately for females and males.

E0219001 Statistical Report
Analysis of Interim Sacrifice Organ Weight
47
Table 42. Comparisons of Least Squares Mean Female Organ Weight
with Covariate Brain Weight for Ethinyl Estradiol Dose (μg/kg'BW'/day)
0.0 0.05 0.5
Organ Mean SE Mean SE Pct P Mean SE Pct P
Adrenal Gland 0.072 0.004 0.075 0.004 103.8 0.814 0.093 0.003 128.0 <.001
Fat Pad Ov/Pm 14.011 0.875 15.382 0.821 109.8 0.411 11.581 0.790 82.7 0.077
Fat Pad Retro 14.021 1.247 15.318 1.170 109.3 0.661 13.252 1.126 94.5 0.856
Heart 1.306 0.040 1.394 0.038 106.8 0.189 1.426 0.036 109.3 0.051
Kidney 2.266 0.080 2.402 0.077 106.0 0.363 2.629 0.072 116.0 0.002
Liver 10.658 0.483 11.987 0.453 112.5 0.086 12.899 0.436 121.0 0.001
Ovary 0.140 0.007 0.143 0.007 101.9 0.945 0.115 0.007 82.2 0.022
Pituitary Gland 0.021 0.001 0.023 0.001 109.8 0.488 0.027 0.001 131.4 0.002
Spleen 0.596 0.023 0.639 0.022 107.2 0.302 0.654 0.021 109.7 0.120
Thymus 0.149 0.010 0.135 0.010 90.8 0.517 0.140 0.009 93.8 0.721
Thyroid Gland 0.038 0.002 0.039 0.002 101.8 0.933 0.037 0.001 96.0 0.709
Uterus 0.772 0.042 0.773 0.040 100.2 0.999 0.832 0.038 107.8 0.466
1. All p-values and % are relative to the control group.
Table 43. Comparisons of Least Squares Mean Male Organ Weight
with Covariate Brain Weight for Ethinyl Estradiol Dose (μg/kg'BW'/day)
0.0 0.05 0.5
Organ Mean SE Mean SE Pct P Mean SE Pct P
Adrenal Gland 0.060 0.002 0.063 0.002 104.5 0.613 0.063 0.002 104.3 0.625
Epididymis (Paired) 1.286 0.035 1.250 0.032 97.2 0.655 1.328 0.031 103.3 0.567
Fat Pad Epidid 12.994 0.782 14.332 0.711 110.3 0.342 12.681 0.695 97.6 0.934
Fat Pad Retro 22.200 2.293 23.130 2.083 104.2 0.934 20.458 2.038 92.2 0.788
Heart 2.043 0.052 2.124 0.047 104.0 0.405 2.097 0.046 102.6 0.651
Kidney 4.091 0.129 4.057 0.116 99.2 0.970 4.126 0.111 100.9 0.967
Liver 22.156 0.755 22.368 0.685 101.0 0.967 22.841 0.671 103.1 0.715
Pituitary Gland 0.015 0.001 0.016 0.001 107.4 0.315 0.016 0.001 108.7 0.211
Sem Ves 1.185 0.053 1.274 0.048 107.5 0.357 1.120 0.047 94.5 0.556
Spleen 0.925 0.043 0.942 0.039 101.9 0.933 1.003 0.039 108.5 0.301
Testes (Paired) 3.593 0.102 3.498 0.093 97.3 0.708 3.544 0.091 98.6 0.906
Thymus 0.150 0.011 0.125 0.010 83.3 0.183 0.153 0.010 101.8 0.977
Thyroid Gland 0.044 0.002 0.044 0.002 101.1 0.971 0.043 0.002 99.3 0.989
1. All p-values and % are relative to the control group.

E0219001 Statistical Report
Analysis of Interim Sacrifice Organ Weight
48
Table 44. ANOCOVA Results for Organ Weight with Covariate Receiving Weight1
for Ethinyl Estradiol Dose (μg/kg'BW'/day)
Sex Organ Effect NumDF DenDF Fvalue P value
F Adrenal Gland Receiving Weight 1 67 7.424 0.008
Dose 2 67 11.188 <.001
Fat Pad Ov/Pm Receiving Weight 1 67 189.877 <.001
Dose 2 67 13.043 <.001
Fat Pad Retro Receiving Weight 1 67 91.001 <.001
Dose 2 67 0.619 0.541
Heart Receiving Weight 1 67 90.028 <.001
Dose 2 67 4.094 0.021
Kidney Receiving Weight 1 66 115.696 <.001
Dose 2 66 17.260 <.001
Liver Receiving Weight 1 67 143.118 <.001
Dose 2 67 15.122 <.001
Ovary Receiving Weight 1 62 0.734 0.394
Dose 2 62 4.985 0.009
Pituitary Gland Receiving Weight 1 67 4.643 0.034
Dose 2 67 6.364 0.002
Spleen Receiving Weight 1 67 59.158 <.001
Dose 2 67 1.843 0.166
Thymus Receiving Weight 1 67 7.477 0.007
Dose 2 67 0.959 0.388
Thyroid Gland Receiving Weight 1 67 25.133 <.001
Dose 2 67 0.459 0.633
Uterus Receiving Weight 1 67 0.651 0.422
Dose 2 67 0.698 0.501
M Adrenal Gland Receiving Weight 1 58 8.296 0.005
Dose 2 58 0.428 0.653
Epididymis (Paired) Receiving Weight 1 59 15.433 <.001
Dose 2 59 2.813 0.068
Fat Pad Epididymis Receiving Weight 1 59 76.254 <.001
Dose 2 59 1.404 0.253
Fat Pad Retro Receiving Weight 1 59 66.767 <.001
Dose 2 59 0.252 0.778
Heart Receiving Weight 1 59 23.478 <.001
Dose 2 59 0.530 0.591
Kidney Receiving Weight 1 57 126.613 <.001
Dose 2 57 2.409 0.099
Liver Receiving Weight 1 59 220.484 <.001
Dose 2 59 3.141 0.050
Pituitary Gland Receiving Weight 1 59 4.510 0.037
Dose 2 59 1.407 0.252
Seminal Vesicles Receiving Weight 1 59 2.162 0.146
Dose 2 59 2.291 0.110
Spleen Receiving Weight 1 59 11.982 0.001
Dose 2 59 1.635 0.203
Testes (Paired) Receiving Weight 1 59 7.307 0.008
Dose 2 59 0.538 0.586
Thymus Receiving Weight 1 59 9.675 0.002
Dose 2 59 3.276 0.044
Thyroid Gland Receiving Weight 1 59 14.716 <.001
Dose 2 59 0.027 0.973 1 Analyses were conducted separately for females and males.

E0219001 Statistical Report
Analysis of Interim Sacrifice Organ Weight
49
Table 45. Comparisons of Least Squares Mean Female Organ Weight
with Covariate Receiving Weight for Ethinyl Estradiol Dose (μg/kg'BW'/day)
0.0 0.05 0.5
Organ Mean SE Mean SE Pct P Mean SE Pct P
Adrenal Gland 0.073 0.004 0.074 0.003 100.5 0.995 0.093 0.003 126.9 <.001
Fat Pad Ov/Pm 14.651 0.465 14.490 0.440 98.9 0.954 11.887 0.418 81.1 <.001
Fat Pad Retro 14.848 0.852 14.236 0.806 95.9 0.821 13.582 0.765 91.5 0.432
Heart 1.333 0.028 1.361 0.027 102.1 0.701 1.435 0.025 107.7 0.015
Kidney 2.318 0.050 2.326 0.048 100.3 0.990 2.654 0.045 114.5 <.001
Liver 11.013 0.290 11.529 0.275 104.7 0.334 13.035 0.261 118.4 <.001
Ovary 0.140 0.007 0.142 0.007 101.2 0.979 0.116 0.007 82.2 0.021
Pituitary Gland 0.021 0.001 0.022 0.001 106.3 0.722 0.027 0.001 129.9 0.002
Spleen 0.611 0.019 0.622 0.018 101.7 0.882 0.657 0.017 107.4 0.132
Thymus 0.152 0.010 0.133 0.010 87.3 0.294 0.139 0.009 91.6 0.544
Thyroid Gland 0.039 0.001 0.038 0.001 97.3 0.810 0.037 0.001 95.3 0.527
Uterus 0.776 0.042 0.771 0.040 99.4 0.994 0.830 0.038 107.0 0.533
1. All p-values and % are relative to the control group.
Table 46. Comparisons of Least Squares Mean Male Organ Weight
with Covariate Receiving Weight for Ethinyl Estradiol Dose (μg/kg'BW'/day)
0.0 0.05 0.5
Organ Mean SE Mean SE Pct P Mean SE Pct P
Adrenal Gland 0.060 0.002 0.062 0.002 103.7 0.687 0.063 0.002 104.4 0.576
Epididymis (Paired) 1.290 0.033 1.238 0.030 96.0 0.394 1.336 0.029 103.6 0.456
Fat Pad Epidid 13.139 0.542 13.996 0.490 106.5 0.393 12.889 0.479 98.1 0.913
Fat Pad Retro 22.611 1.659 22.122 1.501 97.8 0.964 21.100 1.467 93.3 0.711
Heart 2.050 0.050 2.097 0.046 102.3 0.705 2.118 0.045 103.3 0.486
Kidney 4.116 0.082 3.968 0.073 96.4 0.301 4.189 0.070 101.8 0.716
Liver 22.326 0.381 21.936 0.345 98.3 0.659 23.121 0.337 103.6 0.208
Pituitary Gland 0.015 0.001 0.016 0.001 106.0 0.458 0.016 0.001 109.4 0.171
Sem Ves 1.188 0.053 1.267 0.048 106.7 0.420 1.125 0.047 94.7 0.571
Spleen 0.929 0.041 0.930 0.037 100.1 0.999 1.011 0.036 108.9 0.226
Testes (Paired) 3.600 0.101 3.467 0.092 96.3 0.514 3.567 0.090 99.1 0.955
Thymus 0.151 0.011 0.123 0.010 81.0 0.091 0.155 0.009 102.3 0.956
Thyroid Gland 0.044 0.002 0.043 0.002 99.0 0.976 0.044 0.002 100.2 0.999
1. All p-values and % are relative to the control group.

E0219001 Statistical Report
Analysis of Interim Sacrifice Organ Weight
50
B. Data
Organ weight data were extracted from the Genesis database using SAS Proc SQL, utilizing the
Vortex ODBC driver.

E0219001 Statistical Report
Analysis of Interim Sacrifice Organ Weight
51
Quality Control
1. Data Verification
The extraction of the data into SAS was verified by the statistical reviewer by review of the
SAS code used to extract and verify the data.
2. Computer Program Verification
SAS programs were used to extract the data, explore the distributional properties of the data,
and perform the statistical analysis.
The SAS programs were verified by detailed review of the program code, the program log,
and the program output.
3. Statistical Report Review
3.1 Statistical Report Text
The statistical report was reviewed for logic, internal completeness, technical
appropriateness, technical accuracy, and grammar. Technical appropriateness was
reviewed based on statistical expertise.
Comments and questions were provided from the reviewer to the statistician. The
statistician made appropriate changes and returned the report to the reviewer for final
verification.
The text of the final statistical report was considered by the reviewer to be logical,
internally complete, and technically appropriate and accurate. The statistical results stated
in the text accurately presented those in the tables.
3.2 Table Verification
Analysis results were output from SAS to .rtf files using PROC REPORT, which were
then copied into the statistical report.
Statistical report tables were verified by checking the procedure used to create the tables
and, additionally, by checking numbers sufficiently to conclude that the tables are
correct.
4. Conclusions
The final statistical report has been fully reviewed and is considered by the reviewer to be
logical, internally complete, and technically appropriate and accurate.