3.ethesis.nitrkl.ac.in/109/1/Department_of_Chemical... · Web viewConcentrated NaOH = dropwise...
74
Department of Chemical Engineering National Institute of Technology Rourkela 2008 HYDROLYSIS OF LIGNOCELLULOSIC MATERIALS FOR ETHANOL PRODUCTION 2008-09 A thesis submitted in partial fulfillment of the requirements for the degree of Bachelor of Technology in Chemical Engineering By 1
Transcript of 3.ethesis.nitrkl.ac.in/109/1/Department_of_Chemical... · Web viewConcentrated NaOH = dropwise...

Department of Chemical Engineering
National Institute of Technology
Rourkela
2008
HYDROLYSIS OF LIGNOCELLULOSIC MATERIALS
FORETHANOL PRODUCTION
2008-09
A thesis submitted in partial fulfillment of the requirements for the degree of
Bachelor of Technology in Chemical Engineering
By
Nirbhay Gupta
Roll no. 10500027
1

Under guidance of
National Institute of Technology
Rourkela
CERTIFICATE
This is to certify that the thesis entitled “HYDROLYSIS OF LIGNOCELLULOSIC MATERIALS FOR ETHANOL PRODUCTION” submitted by Mr. Nirbhay Gupta in partial fulfillments for the requirements for the award of Bachelor of Technology Degree in Chemical Engineering at National Institute of Technology, Rourkela is an authentic work carried out by him under my supervision and guidance.
To the best of my knowledge the matter embodied in the thesis has not been submitted by any other University/Institute for the award of any Degree or Diploma.
Date: Dr. A. Kumar
Department of Chemical Engineering
National Institute of Technology
Rourkela-769008
2

ACKNOWLEDGEMENT
I would like to make my deepest appreciation and gratitude to Prof. A. Kumar
for his invaluable guidance, constructive criticism and encouragement during the
course of this project.
I would like to thank Prof. R.K.Singh for being a uniformly excellent advisor. He
was always open minded, helpful and provided us with a strong broad idea.
Grateful acknowledgement is made to all the staff and faculty members of
Chemical Engineering Department, National Institute of Technology, Rourkela for
their consistent encouragement.
In spite of the numerous citations above the author accepts full responsibility for
the contents that follow.
DATE: Nirbhay Gupta
Roll: 10500027
3

CONTENTS
Contents iii
List of figures v
List of Tables v
Abstract vi
Chapter 1 INTRODUCTION 1
Chapter 2 LITERATURE REVIEW 3
2.1 Ethanol from Cellulose 4
2.2 Ethyl Alcohol: Overview 7
Chapter 3 PRODUCTION METHODS 12
3.1 Pretreatment of lignocellulosic materials 13
3.2 Physical Pretreatment 14
3.3 Chemical Pretreatment 14
3.4 Biological Pretreatment 17
3.5 Hydrolysis Process 18
Chapter 4 MATERIALS & EQUIPMENT USED 21
4.1 Materials Used 22
4.2 Equipments Required 22
4

Chapter 5 PROCEDURE OF EXPERIMENT 25
5.1 Pretreatment of bagasse 26
5.2 Hydrolysis 26
5.3 pH adjustment 27
5.4 Fermentation 27
Chapter 6 RESULTS 29
6.1 Standard plot for ethanol 30
6.2 Analysis of ethanol for different days 33
6.3 Comparison of ethanol concentration
with increasing no. of days. 40
Chapter 7 DISCUSSION 43
Chapter 8 REFERENCES 45
5

LIST OF GRAPHS
6.1 Standard plot for ethanol 32
6.2 Absorbance vs Molarity curve for day 1
33
6.3 Absorbance vs Molarity curve for day 2 34
6.4 Absorbance vs Molarity curve for day 3 35
6.5 Absorbance vs Molarity curve for day 7 36
6.6 Absorbance vs Molarity curve for day 8 37
6.7 Absorbance vs Molarity curve for day 9 38
6.8 Absorbance vs Molarity curve for day 10 39
6.9 Ethanol conc. Vs no. of days curve for 0.2 M 40
6.10 Ethanol conc. Vs no. of days curve for 0.3 M 41
6.11 Ethanol conc. Vs no. of days curve for 0.5 M 42
LIST OF TABLES
6.1 Standard data for ethanol concentration 30
6.2 Standard for ethanol concentration (revised) 31
6.3-6.9 Data for molarity vs absorbance for 10 days 33-39
6.10 Ethanol conc. Vs no.of days table for 0.2 M 40
6.11 Ethanol conc. Vs no. of days table for 0.3 M 41
6.12 Ethanol conc. Vs no. of days table for 0.5 M 42
6

ABSTRACT
PURPOSE OF THE PROJECT
Biofuel is defined as solid, liquid or gaseous fuel derived from relatively recently dead biological
material and is distinguished from fossil fuels, which are derived from long dead biological
material. Theoretically, biofuels can be produced from any carbon source; although, the most
common sources are photosynthetic plants. Various plants and plant-derived materials are used
for biofuel manufacturing. Increasing the use of bio-fuels for energy generation purpose is of
particular experiment nowadays because they allow mitigation of greenhouse gases, provide
independence and even may offer new employment possibilities. Bio-fuels are being investigated
as potential substitutes for current high pollutant fuels obtained from conventional sources.
There are two common strategies of producing liquid and gaseous agrofuels. One is to grow
crops high in sugar, and then use yeast fermentation to produce ethyl alcohol. The second is to
grow plants that contain high amounts of vegetable oil, such as oil palm, soybean, and algae.
When these oils are heated, their viscosity is reduced, and they can be burned directly in a diesel
engine, or they can be chemically processed to produce fuels such as biodiesel.
BREIF DESCRIPTION OF THE EXPERIMENT
The raw material used for the experiment is bagasse. First the bagasse is chipped and grinded
(may be up to powder form). Then this is taken for acid hydrolysis. Dilute sulphuric acid of 0.2
M, 0.3 M, and 0.5 M concentration were used in this process. For the acid hydrolysis, 5 gms of
bagasse was put in 100 ml of each of the concentrations and was allowed to soak for 1 day. Then
it was autoclaved for half an hour and allowed to cool. The fermentation media was prepared. 5
gms of yeast was added to the above media and kept in incubator for 1 day. 10 ml of this media
was added to each of the sample in asceptical (laminar flow hood) manner and placed in orbital
shaking incubator. The pH was adjusted to 5 and the fermenting temperature was kept at 350C.
Fermentation may take up to 10 days.
7

Chapter 1
INTRODUCTION
8

Energy consumption has increased steadily over the last century as the world population has
grown and more countries have become industrialized. Crude oil has been the major resource to
meet the increased energy demand. Scientists used several different techniques to estimate the
current known crude oil reserves and the reserves as yet undiscovered and concluded that the
decline in worldwide crude oil production will begin before 2010. They also predicted that
annual global oil production would decline from the current 25 billion barrels to approximately 5
billion barrels in 2050. Because the economy in the US and many other nations depends on oil,
the consequences of inadequate oil availability could be severe. Therefore, there is a great
interest in exploring alternative energy sources
Unlike fossil fuels, ethanol is a renewable energy source produced through fermentation of
sugars. Ethanol is widely used as a partial gasoline replacement in the US. Fuel ethanol that is
produced from corn has been used in gasohol or oxygenated fuels since the 1980s. These
gasoline fuels contain up to 10% ethanol by volume. As a result, the US transportation sector
now consumes about 4540 million liters of ethanol annually, about 1% of the total consumption
of gasoline. Recently, US automobile manufacturers have announced plans to produce
significant numbers of flexible-fueled vehicles that can use an ethanol blend – E85 (85% ethanol
and 15% gasoline by volume) – alone or in combination with gasoline. Using ethanol-blended
fuel for automobiles can significantly reduce petroleum use and exhaust greenhouse gas
emission.
However, the cost of ethanol as an energy source is relatively high compared to fossil fuels. A
dramatic increase in ethanol production using the current cornstarch-based technology may not
be practical because corn production for ethanol will compete for the limited agricultural land
needed for food and feed production. A potential source for low-cost ethanol production is to
utilize lignocellulosic materials such as crop residues, grasses, sawdust, wood chips, and solid
animal waste.
9

Chapter 2
LITERATURE REVIEW
10

Cellulose molecules consist of long chains of glucose molecules as do starch molecules, but have
a different structural configuration. These structural characteristics plus the encapsulation by
lignin makes cellulosic materials more difficult to hydrolyze than starchy materials.
Hemicellulose is also comprised of long chains of sugar molecules; but contains, in addition to
glucose (a 6-carbon or hexose sugar), contains pentoses (5-carbon sugars). To complicate
matters, the exact sugar composition of hemicellulose can vary depending on the type of plant.
Since 5-carbon sugars comprise a high percentage of the available sugars, the ability to recover
and ferment them into ethanol is important for the efficiency and economics of the process.
Recently, special microorganisms have been genetically engineered which can ferment 5-carbon
sugars into ethanol with relatively high efficiency
2.1 ETHANOL-FROM-CELLULOSE
In times of fuel shortages, fermentation ethanol has been commercially manufactured in the US
from cellulosic biomass feedstock using acid hydrolysis techniques. However, it is only recently
that cost-effective technologies for producing ethanol-from-cellulose (EFC) in the US have
started to emerge.
There are three basic types of EFC processes—acid hydrolysis, enzymatic hydrolysis, and
thermo chemical—with variations for each. The most common is acid hydrolysis. Virtually any
acid can be used; however, sulfuric acid is most commonly used since it is usually the least
11

expensive
12

13

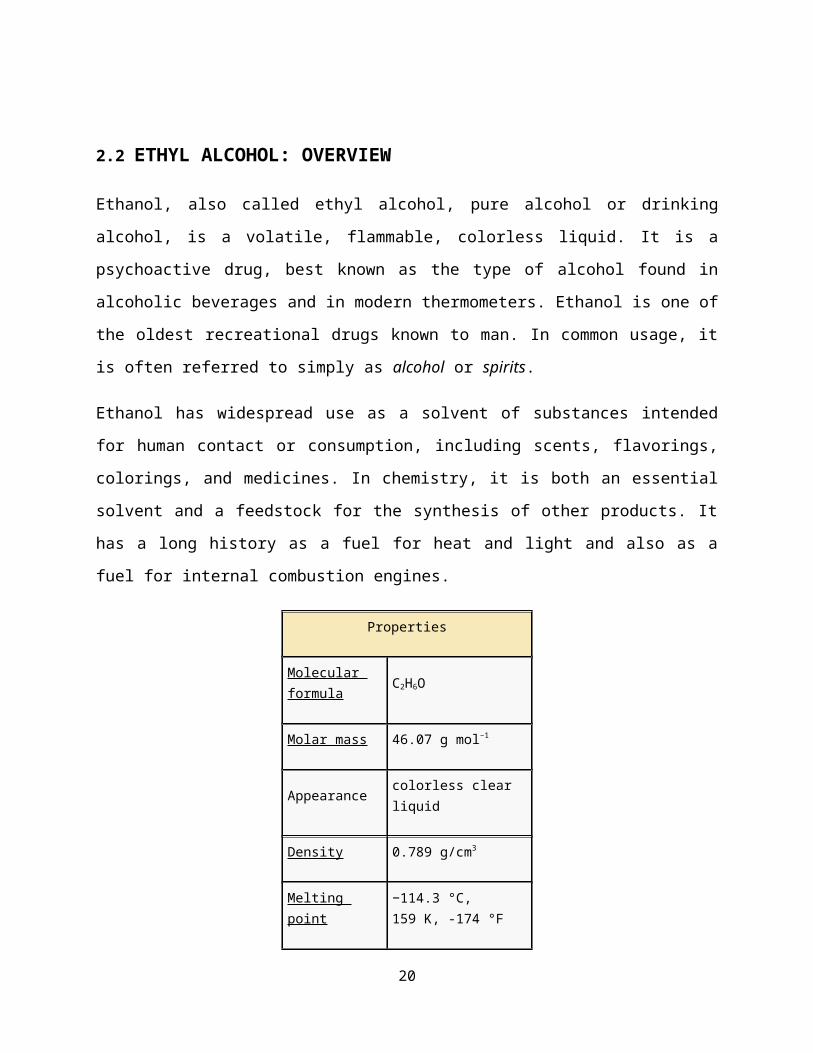
2.2 ETHYL ALCOHOL: OVERVIEW
Ethanol, also called ethyl alcohol, pure alcohol or drinking alcohol, is a volatile, flammable,
colorless liquid. It is a psychoactive drug, best known as the type of alcohol found in alcoholic
beverages and in modern thermometers. Ethanol is one of the oldest recreational drugs known to
man. In common usage, it is often referred to simply as alcohol or spirits.
Ethanol has widespread use as a solvent of substances intended for human contact or
consumption, including scents, flavorings, colorings, and medicines. In chemistry, it is both an
essential solvent and a feedstock for the synthesis of other products. It has a long history as a fuel
for heat and light and also as a fuel for internal combustion engines.
Properties
Molecular formula
C2H6O
Molar mass 46.07 g mol−1
Appearance colorless clear liquid
Density 0.789 g/cm3
Melting point−114.3 °C, 159 K, -174 °F
Boiling point 78.4 °C, 352 K, 173 °F
Solubility in water
Fully miscible
Acidity (pKa) 15.9
Viscosity1.200 mPa·s (cP) at 20.0 °C
Dipole moment 5.64 fC·fm (1.69 D) (gas
14

2.2.1 PHYSICAL PROPERTIES
Ethanol is a volatile, colorless liquid that has a strong characteristic odor. It burns with a
smokeless blue flame that is not always visible in normal light. It is also used in finger nail
polish remover.
The physical properties of ethanol stem primarily from the presence of its hydroxyl group and
the shortness of its carbon chain. Ethanol’s hydroxyl group is able to participate in hydrogen
bonding, rendering it more viscous and less volatile than less polar organic compounds of similar
molecular weight.
Ethanol is a versatile solvent, miscible with water and with many organic solvents
2.2.2 CHEMICAL PROPERTIESEthanol is classified as a primary alcohol, meaning that the carbon to which its hydroxyl group is
attached has at least two hydrogen atoms attached to it.
2.2.2.1 Acid-base chemistryEthanol's hydroxyl group causes the molecule to be slightly basic. It is almost neutral like water.
The pH of 100% ethanol is 7.33, compared to 7.00 for pure water. Ethanol can be quantitatively
converted to its conjugate base, the ethoxide ion (CH3CH2O−), by reaction with an alkali metal
such as sodium:
2CH3CH2OH + 2Na → 2CH3CH2ONa + H2,
or a very strong base such as sodium hydride:
CH3CH2OH + NaH → CH3CH2ONa + H2.
This reaction is not possible in an aqueous solution, as water is more acidic, so that hydroxide is
preferred over ethoxide formation.
15

2.2.2.2 Halogenation
Ethanol reacts with hydrogen halides to produce ethyl halides such as ethyl chloride and ethyl
bromide:
CH3CH2OH + HCl → CH3CH2Cl + H2O
HCl reaction requires a catalyst such as zinc chloride. Hydrogen chloride in the presence of their
respective zinc chloride is known as Lucas reagent.
CH3CH2OH + HBr → CH3CH2Br + H2O
HBr requires refluxing with a sulfuric acid catalyst.
Ethyl halides can also be produced by reacting ethanol with more specialized halogenating
agents, such as thionyl chloride for preparing ethyl chloride, or phosphorus tribromide for
preparing ethyl bromide.
CH3CH2OH + SOCl2 → CH3CH2Cl + SO2 + HCl
2.2.2.3 Haloform reaction
The haloform reaction is a chemical reaction where a haloform (CHX3, where X is a halogen) is
produced by the exhaustive halogenation of a methyl ketone (a molecule containing the R-CO-
CH3 group) in the presence of a base.
2.2.2.4 Ester formation
Under acid-catalyzed conditions, ethanol reacts with carboxylic acids to produce ethyl esters and
water:
RCOOH + HOCH2CH3 → RCOOCH2CH3 + H2O.
For this reaction to produce useful yields it is necessary to remove water from the reaction
mixture as it is formed.
16

Ethanol can also form esters with inorganic acids. Diethyl sulfate and triethyl phosphate,
prepared by reacting ethanol with sulfuric and phosphoric acid respectively, are both useful
ethylating agents in organic synthesis. Ethyl nitrite, prepared from the reaction of ethanol with
sodium nitrite and sulfuric acid, was formerly a widely-used diuretic.
2.2.2.5 Dehydration
Strong acid desiccants, such as sulfuric acid, cause ethanol's dehydration to form either diethyl ether or ethylene:
2 CH3CH2OH → CH3CH2OCH2CH3 + H2O
CH3CH2OH → H2C=CH2 + H2O
Which product, diethyl ether or ethylene, predominates depends on the precise reaction conditions
2.2.2.6 Oxidation
Ethanol can be oxidized to acetaldehyde, and further oxidized to acetic acid. In the human body,
these oxidation reactions are catalyzed by enzymes. In the laboratory, aqueous solutions of
strong oxidizing agents, such as chromic acid or potassium permanganate, oxidize ethanol to
acetic acid, and it is difficult to stop the reaction at acetaldehyde at high yield. Ethanol can be
oxidized to acetaldehyde, without over oxidation to acetic acid, by reacting it with pyridinium
chromic chloride.[19]
The direct oxidation of ethanol to acetic acid using chromic acid is given below.
C2H5OH + 2[O] → CH3COOH + H2O
The oxidation product of ethanol, acetic acid, is spent as nutrient by the human body as acetyl
CoA, where the acetyl group can be spent as energy or used for biosynthesis.
2.2.2.7 Chlorination
When exposed to chlorine, ethanol is both oxidized and its alpha carbon chlorinated to form the
compound, chloral.
4Cl2 + C2H5OH → CCl3CHO + 5HCl
17

2.2.2.8 Combustion
Combustion of ethanol forms carbon dioxide and water:
C2H5OH(g) + 3 O2(g) → 2 CO2(g) + 3 H2O(l); (ΔHr = −1409 kJ/mol[21])
18

Chapter 3
PRODUCTION METHODS
19
The basic five stages of this process are:
1. A “pre- treatment” phase to make the raw material such as wood or straw amenable to
hydrolysis.
2. Hydrolysis, to break down the molecules of cellulose into sugars.
3. Separation of the sugar solution from the residual materials, notably lignin.
4. Yeast fermentation of the sugar solution.
5. Distillation to produce 99.5% pure alcohol.
3.1 Pretreatment of lignocellulosic materials
The effect of pretreatment of lignocellulosic materials has been recognized for a long time. The
purpose of the pretreatment is to remove lignin and hemicellulose, reduce cellulose crystallinity,
and increase the porosity of the materials. Pretreatment must meet the following requirements:
(1) improve the formation of sugars or the ability to subsequently form sugars by enzymatic
hydrolysis;
(2) avoid the degradation or loss of carbohydrate;
(3) avoid the formation of byproducts inhibitory to the subsequent hydrolysis and fermentation
processes; and
(4) be cost-effective. Physical, physico-chemical, chemical, and biological processes have been
used for pretreatment of lignocellulosic materials
20

3.2. Physical pretreatment
3.2.1. Mechanical comminution
Waste materials can be comminuted by a combination of chipping, grinding and milling to
reduce cellulose crystallinity. The size of the materials is usually 10–30 mm after chipping and
0.2–2 mm after milling or grinding. Vibratory ball milling has been found to be more effective in
breaking down the cellulose crystallinity of spruce and aspen chips and improving the
digestibility of the biomass than ordinary ball milling. The power requirement of mechanical
comminution of agricultural materials depends on the final particle size and the waste biomass
characteristics.
3.2.2. Pyrolysis
Pyrolysis has also been used for pretreatment of lignocellulosic materials. When the materials are
treated at temperatures greater than 300 °C, cellulose rapidly decomposes to produce gaseous
products and residual char. The decomposition is much slower and less volatile products are
formed at lower temperatures. Mild acid hydrolysis (1 N H2SO4, 97 °C, 2.5 h) of the residues
from pyrolysis pretreatment has resulted in 80–85% conversion of cellulose to reducing sugars
with more than 50% glucose .The process can be enhanced with the presence of oxygen When
zinc chloride or sodium carbonate is added as a catalyst, the decomposition of pure cellulose can
occur at a lower temperature
3.3 Chemical pretreatment
3.3.1 Ozonolysis
Ozone can be used to degrade lignin and hemicellulose in many lignocellulosic materials such as
wheat straw, bagasse, green hay, peanut, pine, cotton straw, and poplar sawdust. The degradation
was essentially limited to lignin and hemicellulose was slightly attacked, but cellulose was
hardly affected.The rate of enzymatic hydrolysis increased by a factor of 5 following 60%
21

removal of the lignin from wheat straw in ozone pretreatment. Enzymatic hydrolysis yield
increased from 0% to 57% as the percentage of lignin decreased from 29% to 8% after
ozonolysis pretreatment of poplar sawdust. Ozonolysis pretreatment has the following
advantages: (1) it effectively removes lignin; (2) it does not produce toxic residues for the
downstream processes; and (3) the reactions are carried out at room temperature and pressure.
However, a large amount of ozone is required, making the process expensive.
3.3.2. Acid hydrolysis
Concentrated acids such as H2SO4 and HCl have been used to treat lignocellulosic materials.
Although they are powerful agents for cellulose hydrolysis, concentrated acids are toxic,
corrosive and hazardous and require reactors that are resistant to corrosion. In addition, the
concentrated acid must be recovered after hydrolysis to make the process economically feasible.
Dilute acid hydrolysis has been successfully developed for pretreatment of lignocellulosic
materials. The dilute sulfuric acid pretreatment can achieve high reaction rates and significantly
improve cellulose hydrolysis. At moderate temperature, direct saccharification suffered from low
yields because of sugar decomposition. High temperature in dilute acid treatment is favorable for
cellulose hydrolysis. There are primarily two types of dilute acid pretreatment processes: high
temperature (T greater than 160 °C), continuous-flow process for low solids loading (5–10%
[weight of substrate/weight of reaction mixture]), and low temperature (T less than 160 °C),
batch process for high solids loading (10–40%). Although dilute acid pretreatment can
significantly improve the cellulose hydrolysis, its cost is usually higher than some physico-
chemical pretreatment processes. A neutralization of pH is necessary for the downstream
enzymatic hydrolysis or fermentation processes.
3.3.3. Alkaline hydrolysis
Some bases can also be used for pretreatment of lignocellulosic materials and the effect of
alkaline pretreatment depends on the lignin content of the materials. The mechanism of alkaline
hydrolysis is believed to be saponification of intermolecular ester bonds crosslinking xylan
hemicelluloses and other components, for example, lignin and other hemicellulose. The porosity
22

of the lignocellulosic materials increases with the removal of the crosslinks. Dilute NaOH
treatment of lignocellulosic materials caused swelling, leading to an increase in internal surface
area, a decrease in the degree of polymerization, a decrease in crystallinity, separation of
structural linkages between lignin and carbohydrates, and disruption of the lignin structure ( Fan
et al., 1987). The digestibility of NaOH-treated hardwood increased from 14% to 55% with the
decrease of lignin content from 24–55% to 20%. However, no effect of dilute NaOH
pretreatment was observed for softwoods with lignin content greater than 26%. Dilute NaOH
pretreatment was also effective for the hydrolysis of straws with relatively low lignin content of
10–18% used the combination of irradiation and 2% NaOH for pretreatment of corn stalk,
cassava bark and peanut husk. The glucose yield of corn stalk was 20% in untreated samples
compared to 43% after treatment with electron beam irradiation at the dose of 500 kGy and 2%
NaOH, but the glucose yields of cassava bark and peanut husk were only 3.5% and 2.5%,
respectively.
Ammonia was also used for the pretreatment to remove lignin. Iyer et al. (1996) described an
ammonia recycled percolation process (temperature, 170 °C; ammonia concentration, 2.5–20%;
reaction time, 1 h) for the pretreatment of corn cobs/stover mixture and switchgrass. The
efficiency of delignification was 60–80% for corn cobs and 65–85% for switchgrass.
3.3.4. Oxidative delignification
Lignin biodegradation could be catalyzed by the peroxidase enzyme with the presence of H2O2.
The pretreatment of cane bagasse with hydrogen peroxide greatly enhanced its susceptibility to
enzymatic hydrolysis. About 50% lignin and most hemicellulose were solubilized by 2% H 2O2 at
30 °C within 8 h, and 95% efficiency of glucose production from cellulose was achieved in the
subsequent saccharification by cellulase at 45 °C for 24 h. used wet oxidation and alkaline
hydrolysis of wheat straw (20 g straw/l, 170 °C, 5–10 min), and achieved 85% conversion yield
of cellulose to glucose.
23

3.3.5. Organosolv process
In the organosolv process, an organic or aqueous organic solvent mixture with inorganic acid
catalysts (HCl or H2SO4) is used to break the internal lignin and hemicellulose bonds. The
organic solvents used in the process include methanol, ethanol, acetone, ethylene glycol,
triethylene glycol and tetrahydrofurfuryl alcohol. Organic acids such as oxalic, acetylsalicylic
and salicylic acid can also be used as catalysts in the organosolv process. At high temperatures
(above 185 °C), the addition of catalyst was unnecessary for satisfactory delignification. Usually,
a high yield of xylose can be obtained with the addition of acid. Solvents used in the process
need to be drained from the reactor, evaporated, condensed and recycled to reduce the cost.
Removal of solvents from the system is necessary because the solvents may be inhibitory to the
growth of organisms, enzymatic hydrolysis, and fermentation.
3.4. Biological pretreatment
In biological pretreatment processes, microorganisms such as brown-, white- and soft-rot fungi
are used to degrade lignin and hemicellulose in waste materials. Brown rots mainly attack
cellulose, while white and soft rots attack both cellulose and lignin. White-rot fungi are the most
effective basidiomycetes for biological pretreatment of lignocellulosic materials. Hatakka (1983)
studied the pretreatment of wheat straw by 19 white-rot fungi and found that 35% of the straw
was converted to reducing sugars by Pleurotus ostreatus in five weeks. Similar conversion was
obtained in the pretreatment by Phanerochaete sordida 37 and Pycnoporus cinnabarinus 115 in
four weeks. In order to prevent the loss of cellulose, a cellulase-less mutant of Sporotrichum
pulverulentum was developed for the degradation of lignin in wood chips also reported the
delignification of Bermuda grass by white-rot fungi. The biodegradation of Bermuda grass stems
was improved by 29–32% using Ceriporiopsis subvermispora and 63–77% using Cyathus
stercoreus after 6 weeks.
The white-rot fungus P. chrysosporium produces lignin-degrading enzymes, lignin peroxidases
and manganese-dependent peroxidases, during secondary metabolism in response to carbon or
nitrogen limitation (Boominathan and Reddy, 1992K. Boominathan and C.A. Reddy , cAMP-
mediated differential regulation of lignin peroxidase and manganese-dependent peroxidase
24

production in the white-rot basidiomycete Phanerochaete chrysosporium. Proc. Natl. Acad. Sci.
(USA) 12 (1992), pp. 5586–5590. Full Text via CrossRef | View Record in Scopus | Cited By in
Scopus (18)Boominathan and Reddy, 1992). Both enzymes have been found in the extracellular
filtrates of many white-rot fungi for the degradation of wood cell walls. Other enzymes including
polyphenol oxidases, laccases, H2O2 producing enzymes and quinone-reducing enzymes can also
degrade lignin. The advantages of biological pretreatment include low energy requirement and
mild environmental conditions. However, the rate of hydrolysis in most biological pretreatment
processes is very low
3.5 Hydrolysis processes
The cellulose molecules are composed of long chains of glucose molecules. In the hydrolysis
process, these chains are broken down to "free" the sugar, before it is fermented for alcohol
production. There are two major hydrolysis processes: a chemical reaction using acids, or an
enzymatic reaction.
3.5.1 Acid hydrolysis
Acid hydrolysis has been investigated as a possible process for treating lignocellulosic
materials such as wood chips, rice straw, sugar beet pulp and wheat straw. The mineral
acids act simply and rapidly as reaction catalyzers of polysacharide fractions.
Sugarcane bagasse can be hydrolyzed using dilute acid to obtain a mixture of sugars
with xylose as the major component. However, in the hydrolyzate some by-products
generated in the hydrolysis, such as acetic acid, furfural, phenolic compounds, or
lignin degradation products, can be present. These are potential inhibitors of a
microbiological utilization of this hydrolyzate.
Processes such as two-stage acid hydrolysis can be employed to produce xylose and
glucose. Treatment with dilute sulphuric acid at moderate temperatures (the first stage
of acid hydrolysis) has proven to be an efficient means of producing xylose from
hemicellulose. In the second stage more drastic reaction conditions are employed and
glucose can be produced from cellulose hydrolysis.
25

In general, acid treatment is effective in solubilizing the hemicellulosic component of
biomass. Proper combinations of pH, temperature, and reaction time can result in high
yields of sugars, primarily xylose from hemicelluloses. Sulphuric acid is a catalyst for
this reaction and, in this work, was used to study the hydrolysis of sugarcane bagasse
hemicellulose. The effects of temperature, acid concentration and reaction time were
studied, and the effectiveness of the hydrolysis was evaluated in terms of
hemicellulose solubilization.
3.6 Sugar Fermentation in Yeast
Yeast are able to metabolize some foods, but not others. In order for an organism to make use of
a potential source of food, it must be capable of transporting the food into its cells. It must also
have the proper enzymes capable of breaking the food’s chemical bonds in a useful way. Sugars
are vital to all living organisms. Yeast are capable of using some, but not all sugars as a food
source. Yeast can metabolize sugar in two ways, aerobically, with the aid of oxygen, or
anaerobically, without oxygen.
In this lab, you will try to determine whether yeast are capable of metabolizing a variety of
sugars. Although aerobic fermentation of sugar is much more efficient, in this experiment we
will have yeast ferment sugars anaerobically. When the yeast respire aerobically, oxygen gas is
consumed at the same rate that CO2 is produced—there would be no change in the gas pressure
in the test tube. When yeast ferments the sugars anaerobically, however, CO2 production will
cause a change in the pressure of a closed test tube, since no oxygen is being consumed. We can
use this pressure change to monitor the respiration rate and metabolic activity of the organism. A
gas pressure sensor will be used to monitor the fermentation of sugar.
The fermentation of glucose can be described by the following equation:
C6Hl2O6 →2 CH3CH2OH +2 CO2 + energy
Note that alcohol is a byproduct of this fermentation.
26

1. Yeast cannot utilize all of the sugars equally well. While glucose, sucrose, and
fructose all can be metabolized by yeast, lactose is not utilized at all.
2. Yeast may not have the proper enzymes to either transport lactose across its cell
membrane, or it may not have the enzyme needed to convert it from a disaccharide to
a monosaccharide.
3. The yeast need to be incubated so that the oxygen in the test tube will be completely
consumed. If the yeast respire aerobically, no pressure change occurs, because much
oxygen is consumed as CO2 is produced. It also takes a few minutes for the yeast to
transport the sugar into the cell, to respire at a constant rate, and to reach the proper
temperature.
4. Some yeast live on other organisms. If they are warm blooded, they may be near the
optimal temperature for yeast respiration, 37°C. Many yeast live in soils. The
temperature of soils may easily be measured at different times of the year.
27

Chapter 4
MATERIALS & EQUIPMENT USED
28

4.1 MATERIALS USED
4.1.1 Chemicals Required
i. Dilute Sulfuric acid = 0.2 M, 0.3 M, 0.5 M
ii. Concentrated NaOH = dropwise
iii. Phenol = 2 gm
iv. Sodium hydroxide = 10 gm
4.2 EQUIPMENTS REQUIRED
4.2.1 Vertical autoclave
This equipment is primarily used for sterilization purpose. It is an enclosed space where steam
bath is given to any equipment placed inside it. Water filled in it is heated by electric coils
present at bottom. It has a vent at top, from where the steam can be released to maintain the
required pressure. For our case, sterilization is required after maintaining the pH and also for
each filtration. Pressure around 2.02 kg/cm2 is used. Once the pressure reaches 2.02 kg/cm2, it is
maintained for half an hour. The equipments are allowed to cool down before removing from the
autoclave.
Figure 1 Vertical autoclave
29

4.2.2 Laminar flow chamber
A laminar flow cabinet or laminar flow closet or tissue culture hood is a carefully enclosed bench
designed to prevent contamination of semiconductor wafers, biological samples, or any particle
sensitive device. Air is drawn through a HEPA filter and blown in a very smooth, laminar flow
towards the user. The cabinet is usually made of stainless steel with no gaps or joints where
spores might collect.
Such hoods exist in both horizontal and vertical configurations, and there are many different
types of cabinets with a variety of airflow patterns and acceptable uses
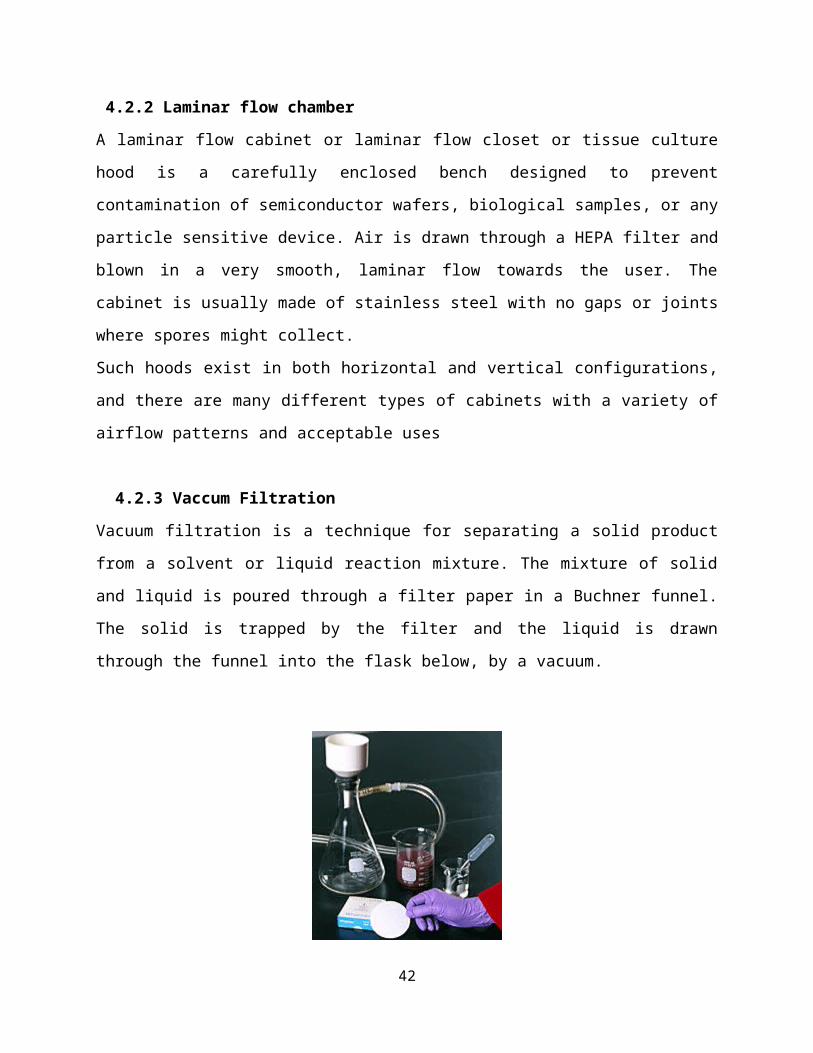
4.2.3 Vaccum Filtration
Vacuum filtration is a technique for separating a solid product from a solvent or liquid reaction
mixture. The mixture of solid and liquid is poured through a filter paper in a Buchner funnel. The
solid is trapped by the filter and the liquid is drawn through the funnel into the flask below, by a
vacuum.
4.2.4 UV-Spectrophotometer
The UV-Visible spectrophotometer uses two light sources, a deuterium (D2) lamp for ultraviolet
light and a tungsten (W) lamp for visible light. After bouncing off a mirror (mirror 1), the light
beam passes through a slit and hits a diffraction grating. The grating can be rotated allowing for a
specific wavelength to be selected. At any specific orientation of the grating, only
monochromatic (single wavelength) successfully passes through a slit. A filter is used to remove
30

unwanted higher orders of diffraction. The light beam hits a second mirror before it gets split by
a half mirror (half of the light is reflected, the other half passes through). One of the beams is
allowed to pass through a reference cuvette (which contains the solvent only), the other passes
through the sample cuvette. The intensities of the light beams are then measured at the end.
4.2.5 Shaking incubator
Incubator Shaker is a large capacity shaking incubator which may be stacked up to 3 high,
offering a large capacity in a minimum of floor space. The ingenious design of the Infors shakers
features a front-loading pullout platform, stainless steel interior panels, panoramic front window
and inspection light. The patented drive system provides uniform motion and quiet operation
without vibration.
4.2.6 pH- meter
A pH meter is an electronic instrument used to measure the pH (acidity or alkalinity) of a liquid.
A typical pH meter consists of a special measuring probe (a glass electrode) connected to an
electronic meter that measures and displays the pH reading
31

Chapter 5
PROCEDURE OF EXPERIMENT
32

5.1 Pretreatment of bagasse
About 1 kg of post harvest sugarcane bagasse is taken and dried to remove all the moisture
present in it. This dried sugarcane bagasse undergoes size reduction by the help of a grinder.
Even the powdered form is used for hydrolysis.
5.2 Hydrolysis
The cellulose molecules are composed of long chains are broken down to “free” the sugar, before
it is fermented for alcohol production. Though hydrolysis is of many types, dilute acid hydrolysis
is an easy and productive process. Also the amount of alcohol produced in case of acid
hydrolysis is more than that of alkaline hydrolysis. Concentrated acid hydrolysis is not used as it
is a hazardous and corrosive process and also acid has to be separated out after hydrolysis for the
experiment has to be feasible.
5.2.1 Steps involved in dilute acid hydrolysis are
1. 4 nos. of 250 ml of conical flasks were taken and to each of them 5 gm of grinded
sugarcane bagasse is added carefully.
2. Another flask of 500 ml size is taken and to it 5 gm of grinded sugarcane bagasse is
added carefully.
3. 100 ml of dilute sulfuric acid of concentration 0.2 M is added to the 500 ml flask.
4. 100 ml of dilute sulfuric acid of concentration 0.3 M is added to two of them 250 ml
flasks.
5. 100 ml of dilute sulfuric acid of concentration 0.5 M is added to the remaining two 250
ml flasks.
6. All this samples are left to be soaked to dilute sulfuric acid for 24 hrs.
7. The bottles were then capped with the help of cotton plugs.
33

5.3 pH adjustmentBefore addition of any micro-organism to the above prepared samples, pH of these samples has
to be adjusted. Otherwise the micro-organism will die in hyper acidic or basic state. A pH of
around 5-5.5 is maintained.
5.3.1 Steps involved in pH adjustment are1. The 500 ml flask containing 0.2 M dilute sulfuric acid hydrolyzed bagasse is taken and its
pH is checked with the help of a pH meter.
2. As samples are acid hydrolyzed, a highly basic solution is added to bring the pH in the
range of 5-5.5.
3. For this purpose, a highly concentrated NaOH solution is prepared by mixing weater with
Na pellets.
4. This NaOH solution is added drop wise to the 0.2 M 500 ml flask with constant stirring
until the pH reaches to a range of 5-5.5
5. If suppose the pH goes beyond 5-5.5, concentrated HCl acid is added drop wise to
maintain the pH in the range.
6. The above steps are repeated for the 0.3 M and 0.5 M dilute sulfuric acid hydrolyzed
bagasse.
After maintaining the pH, the samples are kept in a Vertical autoclave for ½ hr at 120 0C (around
2.02 kg/cm2 pressure) and allowed to cool.
5.4 Fermentation
5.4.1 Media preparation For preparing 100 ml media, we add
Sugar (Dextrose) = 10 gm
Yeast extract = 0.2 gm
Urea = 1 gm
Make up water = 100 ml
34

5.4.2 Steps involved in fermentation are1. To the above 100 ml media, 0.5 gm of yeast ( Saccharomyces cerevisiae) is added in
a 250 ml conical flask.
2. This conical flask is then placed in a shaking incubator for 24 hrs.
3. 10 ml of this medium is then added to each of the 5 autoclaved samples aseptically in
a Laminar flow chamber.
4. These flasks are properly covered with cotton plug.
5. These flasks are then placed in the shaking incubator at a temperature of 35oC and
120 rpm.
6. After 24 hrs, the flasks are covered with aluminium foils over the cotton plug.
35

Chapter 6
RESULTS
36

6.1 Standard plot for ethanol
16 ml of absolute ethanol was mixed with 24 ml of water and an absorbance of 0.897 nm was
found in the UV spectrophotometer. This was assumed to be 100 % ethanol and the standard plot
was drawn.
SL.NO. Amount of
ethanol (in ml)
Amount of water
(in ml)
Conc. Of ethanol Absorbance
1 0 3.0 0 0
2 0.3 2.7 10 0.185
3 0.6 2.4 20 0.223
4 0.9 2.1 30 0.291
5 1.2 1.8 40 0.376
6 1.5 1.5 50 0.419
7 1.8 1.2 60 0.611
8 2.1 0.9 70 0.665
9 2.4 0.6 80 0.734
10 2.7 0.3 90 0.8
11 3.0 0 100 0.897
Table 6.1
37

The 100 percent of this ethanol is actually the 40 percent concentration of absolute alcohol. Therefore the actual standard plate is given in the next table.
SL.NO. Amount of
ethanol ( in ml)
Amount of water
( in ml)
Conc. Of ethanol Absorbance
1 0 3.0 0 0
2 0.3 2.7 40 0.185
3 0.6 2.4 180 0.223
4 0.9 2.1 120 0.291
5 1.2 1.8 160 0.376
6 1.5 1.5 200 0.419
7 1.8 1.2 240 0.611
8 2.1 0.9 280 0.665
9 2.4 0.6 320 0.734
10 2.7 0.3 360 0.8
11 3.0 0 400 0.897
Table 6.2
38

0 100 200 300 400 5000
0.1
0.2
0.3
0.4
0.5
0.6
0.7
0.8
0.9
1
Ethanol conc.
Abso
rban
ce
Figure 6.1
39

6.2 ANALYSIS OF ETHANOL FOR DIFFERENT DAYS
Day 1 Table 6.3
Sl. No. Sample Absorbance (210 nm)1 0.2 0.622 0.3 (I) 0.543 0.3(II) 0.5814 0.5(I) 0.5235 0.5(II) 0.568
0 0.2 0.4 0.60.5
0.52
0.54
0.56
0.58
0.6
0.62
0.64
Figure 6.2
40

Day 2 Table 6.4
Sl. No. Sample Absorbance (210 nm)1 0.2 0.6672 0.3 (I) 0.6053 0.3(II) 0.5894 0.5(I) 0.5585 0.5(II) 0.529
0 0.2 0.4 0.60.5
0.52
0.54
0.56
0.58
0.6
0.62
0.64
0.66
0.68
Figure 6.3
41
Day 3 Table 6.5
Sl. No. Sample Absorbance (210 nm)1 0.2 0.6782 0.3 (I) 0.6673 0.3(II) 0.6244 0.5(I) 0.6375 0.5(II) 0.563
0 0.2 0.4 0.60.56
0.58
0.6
0.62
0.64
0.66
0.68
0.7
Figure 6.4
42

Day 7 Table 6.6
Sl. No. Sample Absorbance (210 nm)1 0.2 0.7122 0.3 (I) 0.6723 0.3(II) 0.6714 0.5(I) 0.6675 0.5(II) 0.598
0 0.2 0.4 0.60.58
0.6
0.62
0.64
0.66
0.68
0.7
0.72
Figure 6.5
43

Day 8 Table 6.7
Sl. No. Sample Absorbance (210 nm)1 0.2 0.7232 0.3 (I) 0.6783 0.3(II) 0.6914 0.5(I) 0.6955 0.5(II) 0.601
0 0.2 0.4 0.60.6
0.62
0.64
0.66
0.68
0.7
0.72
0.74
Figure 6.6
44

Day 9 Table 6.8
Sl. No. Sample Absorbance (210 nm)1 0.2 0.7352 0.3 (I) 0.7013 0.3(II) 0.7424 0.5(I) 0.7185 0.5(II) 0.655
0 0.2 0.4 0.60.66
0.67
0.68
0.69
0.7
0.71
0.72
0.73
0.74
Figure 6.7
45
Day 10 Table 6.9
Sl. No. Sample Absorbance (210 nm)1 0.2 0.7532 0.3 (I) 0.7213 0.3(II) 0.7424 0.5(I) 0.7365 0.5(II) 0.698
0 0.2 0.4 0.60.69
0.7
0.71
0.72
0.73
0.74
0.75
0.76
Figure 6.8
46

6.3 COMPARISON OF ETHANOL CONCENTRATION WITH INCREASING NUMBER OF DAYS
For 0.2 M acid concentration
Table 6.10
SL. NO. NO. OF DAYS ETHANOL CONC.1 1 276.472 2 297.433 3 302.344 45 56 67 7 317.508 8 322.409 9 327.7610 10 335.78
The graph of the above table is as follows
0 2 4 6 8 10 12200
220
240
260
280
300
320
340
360
no. of days
Etha
nol c
onc.
Figure 6.9
47

For 0.3 M acid concentration
SL. NO. NO. OF DAYS ETHANOL CONC.1 1 249.942 2 275.393 3 287.854 45 56 67 7 299.448 8 305.249 9 321.7410 10 326.19
Table 6.11
The graph of the above table is as follows
0 2 4 6 8 10 12200
220
240
260
280
300
320
340
No. of days
Etha
nol c
onc.
Figure 6.10
48

For 0.5 M acid concentration
SL. NO. NO. OF DAYS ETHANOL CONC. ( ml/lt)1 1 243.252 2 251.363 3 267.554 45 56 67 7 288.748 8 295.969 9 306.1310 10 328.73
Table 6.12
The graph of the above table is as follows
0 2 4 6 8 10 12200
220
240
260
280
300
320
340
No. of days
Etha
nol c
onc.
Figure 6.11
49

Chapter 7
DISCUSSION
50

1. The ethanol concentration in ml/lt of acid hydrolyzed bagasse increases with
the increasing number of days.
2. This shows that the sugar is being fermented by the help of micro organism
yeast for the production of ethanol.
3. The maximum concentration of ethanol is 328.73 ml/lt of acid hydrolyzed
bagasse which was found on the 10th day of fermentation.
4. In absorbance vs molarity curve , after each progressive data the curve tends
to come in a straight line.
5. For 0.3 M and 0.5 M we have taken two identical samples for each for better
accuracy.
6. For drawing graphs, in case of 0.3 M, 0.5 M samples average is taken.
7. Still some deflection in the graphs can be considered due to precision error,
long duration of experiment, and human errors.
51

Chapter 8
REFERENCES
52

1. Biosource technology, Volume 83 Issue 1, May 2002.
2. Biosource Technology, Volume 77, Issue 2, April 2001.
3. Cellulosic Ehanol- Wikipedia, The free encyclopedia.
4. “Ethanol From Cellulose: A General Review” Trends in new crops and
new uses. 2002. J. Janick and A. Whipkey (eds.). ASHS Press, Alexandria,
VA.
5. “Ethanol production via enzymatic hydrolysis of sugar” edition 1996
Elba P.S. Bon
6. www.osti.gov/bridge/servlets/purl/755492-CufN/webviewable/
755492
7. www.ethtec.com.au/downloads/Latest_News/
ETHANOL_FROM_BAGASSE_MEETINGS
8. Renewable and Sustainable Energy Reviews, Volume 13, Issues 6-7,
August-September 2009, Pages 1418-1427
9. www.cellulosicroundtable.com/greenfieldethanol.htm
10. www.bioresourcesjournal.com/index.php/BioRes
11. sciencestage.com/d/29329/lime-pretreatment-of-sugarcane-bagasse-
for-bioethanol-production
12. www.academicjournals.org/ajb/PDF/pdf2008/18Jul/Damisa%20et
%20al.
13. aiche.confex.com/aiche/2006/preliminaryprogram/
abstract_58322.htm
14. www.rurdev.usda.gov/rbs/pub/sep06/ethanol.htm
53

54

55

Dr. Arvind Kumar
56