
3. Spot Finding 7(i). 2D Integration 2. Image Handling 7(ii). 3D Integration 4. Indexing 8. Results...
2
3. Spot Finding 7(i). 2D Integration 2. Image Handling 7(ii). 3D Integration 4. Indexing 8. Results Gwyndaf Evans 1 , Graeme Winter 1 , David Waterman 2 , James Parkhurst 1 , Luis Fuentes-Montero 1 , Richard Gildea 1 , Aaron Brewster 3 , Nicholas Sauter 3 , 1 Diamond Light Source, 2 CCP4, 3 Lawrence Berkeley National Laboratory 1. Introduction 5. Refinement Diffraction Integration for Advanced Light Sources Background mask and plane determination using background pixels, equivalent to that of MOSFLM Default refinement parameterization in DIALS, where the detector, sample and beam are refined: extensions allow for more complex detectors such as CS-PAD at LCLS and the Dectris P12M Background pixel identification via outliers similar to that used in XDS 6. Background Determination Spot finding – raw image, mean, variance map… … dispersion map, threshold map and final centroids Indexing of six lattices from 1° sweep of micro- crystal data 2D profile fitting: averaging of background subtracted reflection profiles to determine optimum 3D profile fitting: background subtracted reflection data mapped to reciprocal space before averaging and fitting Correlation of reflection profiles with reference, over detector and intensity Low resolution limit 42.40 42.40 1.32 High resolution limit 1.30 7.12 1.30 Rmerge (within I+/I-) 0.064 0.023 1.154 Rmeas (within I+/I-) 0.064 0.023 1.167 Rpim (within I+/I-) 0.009 0.004 0.172 Total number of observations 798525 5592 37737 Total number unique 9366 85 451 Mean((I)/sd(I)) 55.2 220.9 5.9 Mn(I) half-set CC(1/2) 1.000 1.000 0.962 Completeness 99.9 99.8 99.4 Multiplicity 85.3 65.8 83.7 Anomalous completeness 100.0 100.0 99.7 Anomalous multiplicity 46.6 56.1 44.1 DelAnom correlation half-sets 0.977 0.993 0.110 Mid-Slope of Anom Probability 2.102 References: Evans, P. R. & Murshudov, G. N. (2013). Acta Crystallogr. D. Biol. Crystallogr. 69, 1204–1214. Grosse-Kunstleve, R. W., et al. (2002). J. Appl. Crystallogr. 35, 126–136. Kabsch, W. (2010a). Acta Crystallogr. Sect. D Biol. Crystallogr. 66, 133–144. Kabsch, W. (2010b). Acta Crystallogr. Sect. D Biol. Crystallogr. 66, 125–132. Leslie, A. G. W. (1999). Acta Crystallogr. Sect. D Biol. Crystallogr. 1696–1702. Leslie, A. G. W. & Powell, H. R. (2007). Evolving Methods for Macromolecular Experimental electron density from fast_ep (SHELX C/D/E) and merging statistics from AIMLESS, from DNA / ligand complex Low resolution limit 71.03 71.03 1.32 High resolution limit 1.30 7.12 1.30 Rmerge (all I+ and I-) 0.087 0.037 0.887 Rmeas (all I+ & I-) 0.096 0.040 0.982 Rpim (all I+ & I-) 0.040 0.017 0.415 Total number of observations 649690 4514 30623 Total number unique 115431 793 5655 Mean((I)/sd(I)) 10.6 34.4 1.7 Mn(I) half-set CC(1/2) 0.998 0.999 0.688 Completeness 100.0 100.0 99.9 Multiplicity 5.6 5.7 5.4 R* 23.50 Rfree* 24.31 *non protein atoms removed from refinement for difference map calculation Difference density from glucose isomerase test sample, calculated using dimple (CCP4 / REFMAC5) Time varying refinement of unit cell parameters of a 720° radiation damaged thaumatin data set DIALS is a collaborative initiative to produce an open source software toolbox encompassing all aspects of diffraction data analysis. DIALS has been developed as a modular framework that permits flexibility not only in the development of new methods and algorithms but also in the application of these methods to data analysis as illustrated above. DIALS builds on the computational crystallography toolbox cctbx. Positional (i.e. pixel offset x, y) and parallax correction tables for DECTRIS Pilatus 6M SN 100 at Diamond Light Source, I04 ( x ) ( y ) ( x ) ( y ) http://dials.sourceforge.net
-
Upload
rebecca-todd -
Category
Documents
-
view
214 -
download
1
Transcript of 3. Spot Finding 7(i). 2D Integration 2. Image Handling 7(ii). 3D Integration 4. Indexing 8. Results...
3. Spot Finding
7(i). 2D Integration
2. Image Handling
7(ii). 3D Integration
4. Indexing
8. Results
Gwyndaf Evans1, Graeme Winter1, David Waterman2, James Parkhurst1, Luis Fuentes-Montero1, Richard Gildea1,
Aaron Brewster3, Nicholas Sauter3,1Diamond Light Source, 2CCP4, 3Lawrence Berkeley National Laboratory
1. Introduction 5. RefinementDiffraction Integration for Advanced Light Sources
Background mask and plane determination using background pixels, equivalent to that of MOSFLM
Default refinement parameterization in DIALS, where the detector, sample and beam are refined: extensions allow for more complex detectors such as CS-PAD at LCLS and the Dectris P12M
Background pixel identification via outliers similar to that used in XDS
6. Background Determination
Spot finding – raw image, mean, variance map…
… dispersion map, threshold map and final centroids
Indexing of six lattices from 1° sweep of micro-crystal data
2D profile fitting: averaging of background subtracted reflection profiles to determine optimum
3D profile fitting: background subtracted reflection data mapped to reciprocal space before averaging and fitting
Correlation of reflection profiles with reference, over detector and intensity
Low resolution limit 42.40 42.40 1.32High resolution limit 1.30 7.12 1.30
Rmerge (within I+/I-) 0.064 0.023 1.154Rmeas (within I+/I-) 0.064 0.023 1.167Rpim (within I+/I-) 0.009 0.004 0.172Total number of observations 798525 5592 37737Total number unique 9366 85 451Mean((I)/sd(I)) 55.2 220.9 5.9Mn(I) half-set CC(1/2) 1.000 1.000 0.962Completeness 99.9 99.8 99.4Multiplicity 85.3 65.8 83.7
Anomalous completeness 100.0 100.0 99.7Anomalous multiplicity 46.6 56.1 44.1DelAnom correlation half-sets 0.977 0.993 0.110Mid-Slope of Anom Probability 2.102
References: Evans, P. R. & Murshudov, G. N. (2013). Acta Crystallogr. D. Biol. Crystallogr. 69, 1204–1214.Grosse-Kunstleve, R. W., et al. (2002). J. Appl. Crystallogr. 35, 126–136.Kabsch, W. (2010a). Acta Crystallogr. Sect. D Biol. Crystallogr. 66, 133–144.Kabsch, W. (2010b). Acta Crystallogr. Sect. D Biol. Crystallogr. 66, 125–132.Leslie, A. G. W. (1999). Acta Crystallogr. Sect. D Biol. Crystallogr. 1696–1702.Leslie, A. G. W. & Powell, H. R. (2007). Evolving Methods for Macromolecular Crystallography, pp. 41–51.
Experimental electron density from fast_ep (SHELX C/D/E) and merging statistics from AIMLESS, from DNA / ligand complex
Low resolution limit 71.03 71.03 1.32High resolution limit 1.30 7.12 1.30
Rmerge (all I+ and I-) 0.087 0.037 0.887Rmeas (all I+ & I-) 0.096 0.040 0.982Rpim (all I+ & I-) 0.040 0.017 0.415Total number of observations 649690 4514 30623Total number unique 115431 793 5655Mean((I)/sd(I)) 10.6 34.4 1.7Mn(I) half-set CC(1/2) 0.998 0.999 0.688Completeness 100.0 100.0 99.9Multiplicity 5.6 5.7 5.4R* 23.50 Rfree* 24.31
*non protein atoms removed from refinement for difference map calculation
Difference density from glucose isomerase test sample, calculated using dimple (CCP4 / REFMAC5)
Time varying refinement of unit cell parameters of a 720° radiation damaged thaumatin data set
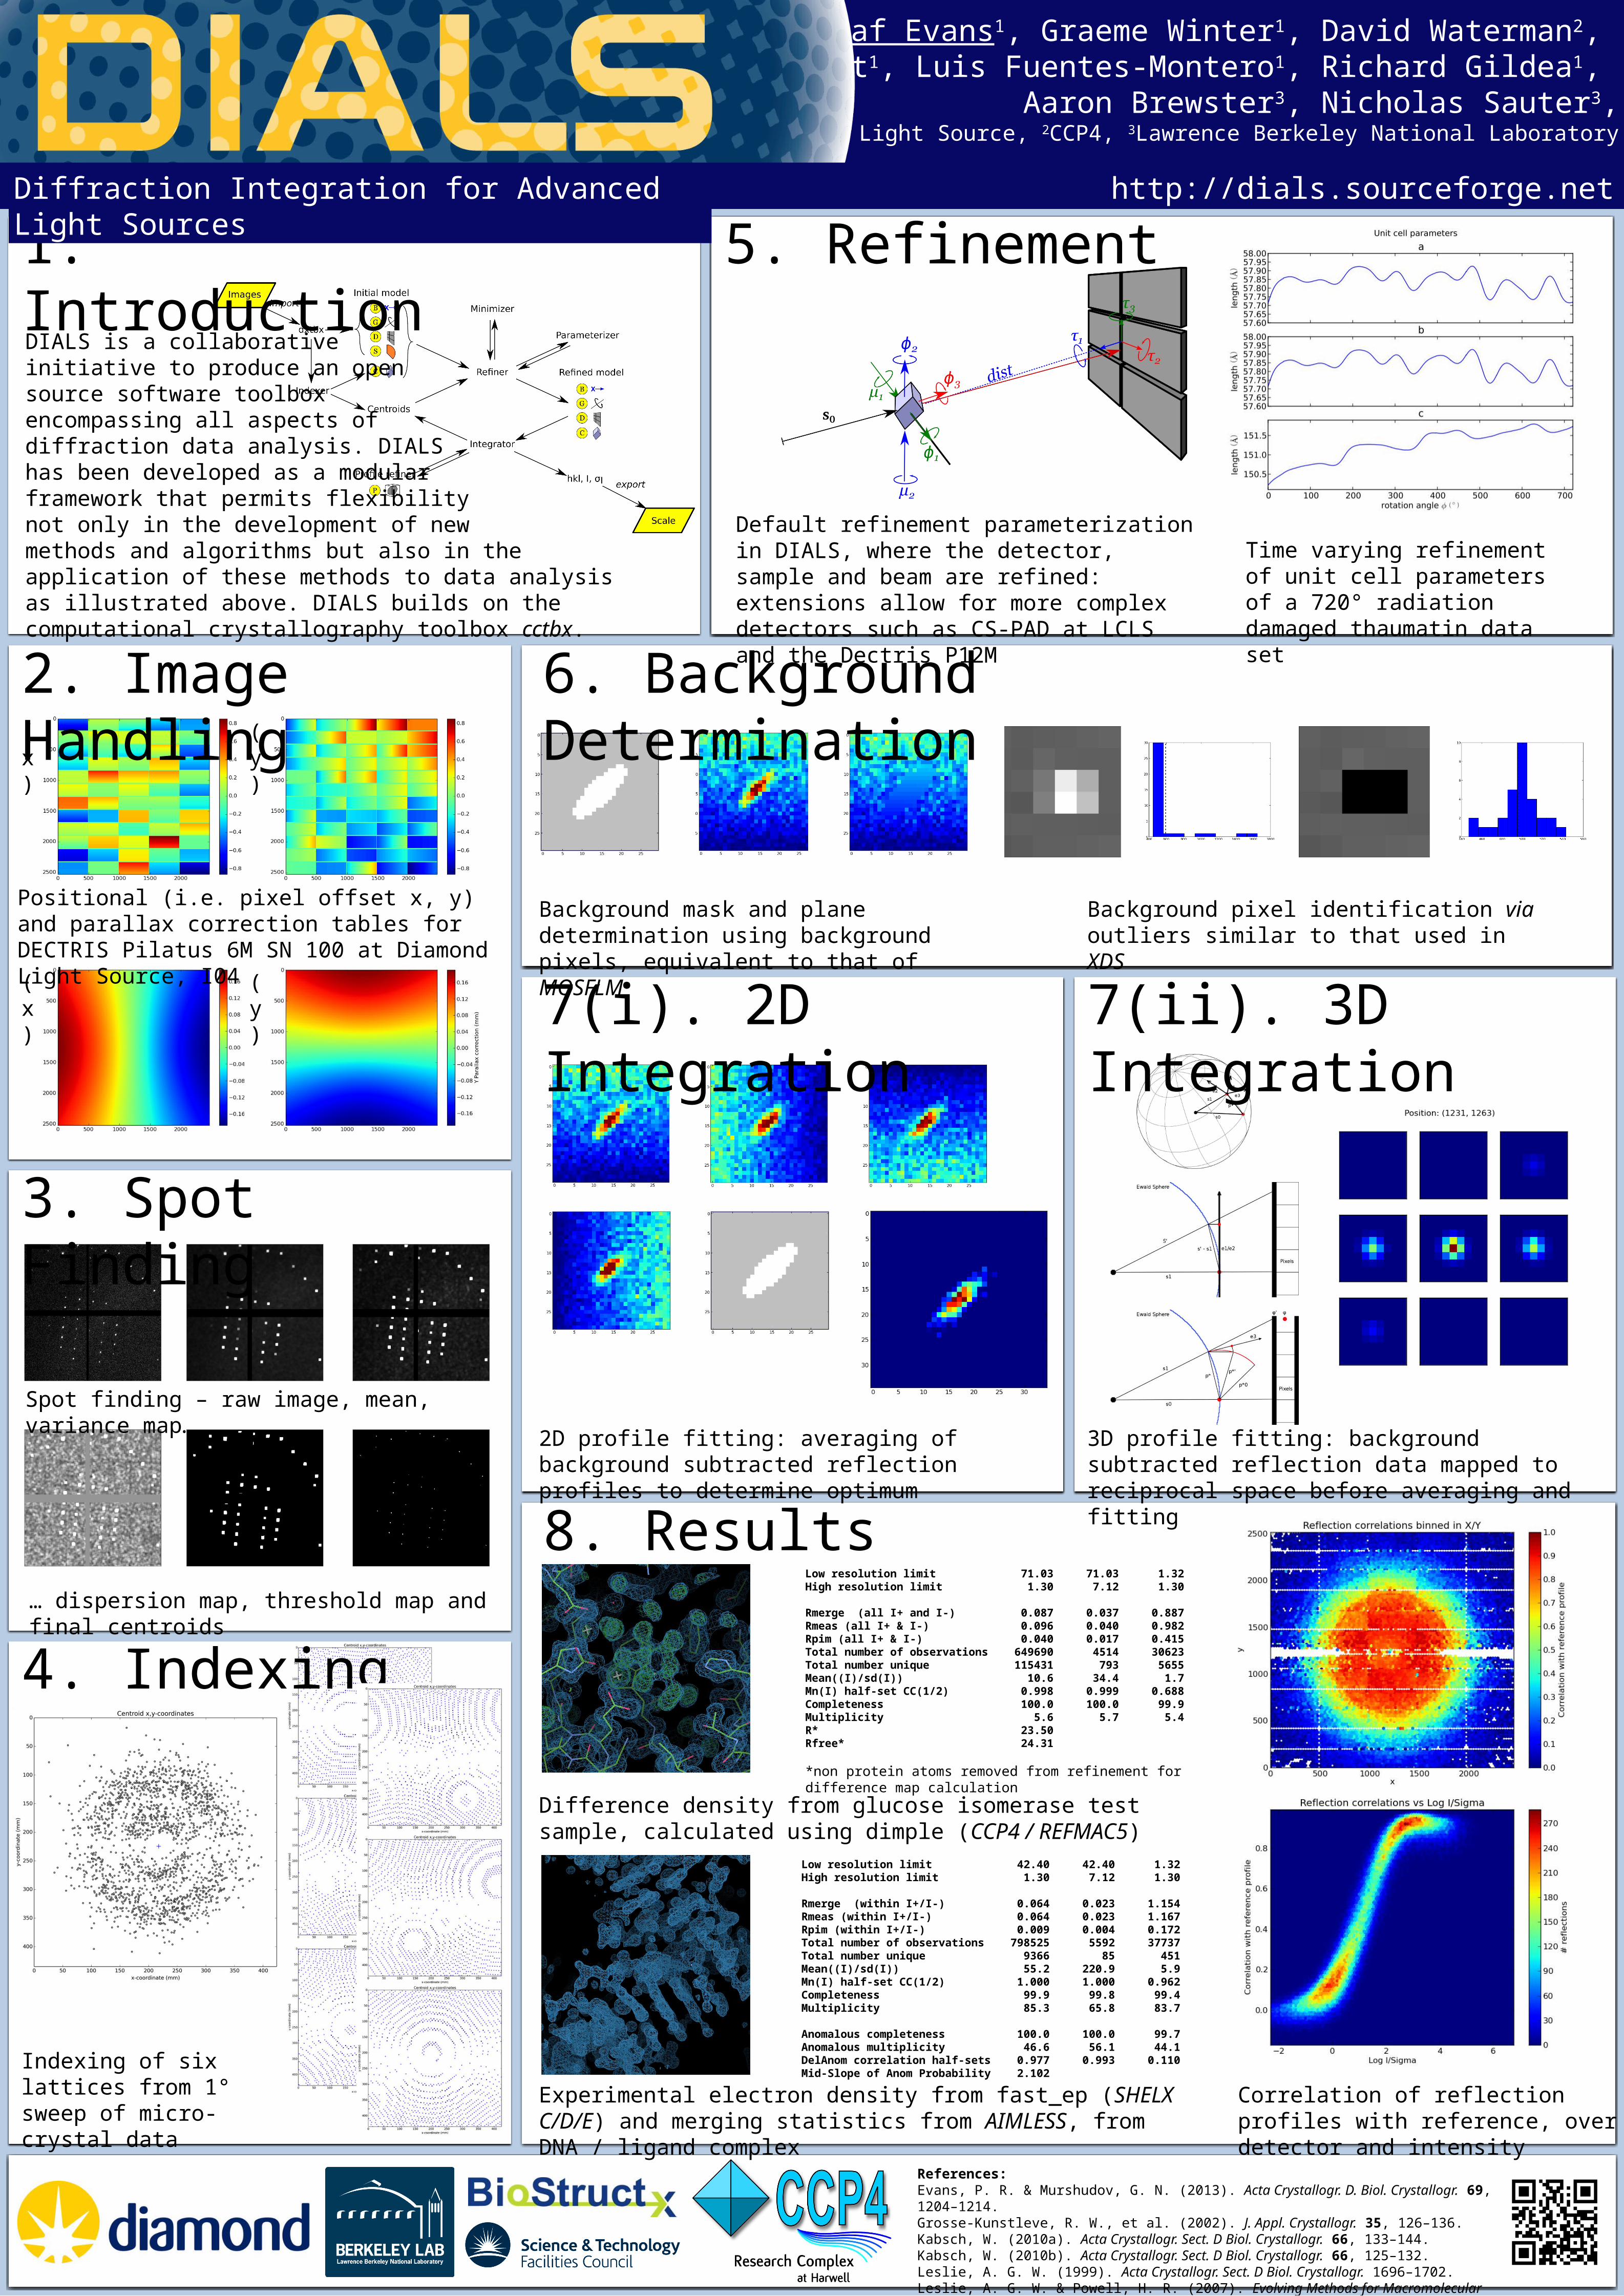
DIALS is a collaborative initiative to produce an open source software toolbox encompassing all aspects of diffraction data analysis. DIALS has been developed as a modular framework that permits flexibility not only in the development of new methods and algorithms but also in the application of these methods to data analysis as illustrated above. DIALS builds on the computational crystallography toolbox cctbx.
Positional (i.e. pixel offset x, y) and parallax correction tables for DECTRIS Pilatus 6M SN 100 at Diamond Light Source, I04
(x) (y)
(x) (y)
http://dials.sourceforge.net
References: Evans, P. R. & Murshudov, G. N. (2013). Acta Crystallogr. D. Biol. Crystallogr. 69, 1204–1214.Grosse-Kunstleve, R. W., et al. (2002). J. Appl. Crystallogr. 35, 126–136.Kabsch, W. (2010a). Acta Crystallogr. Sect. D Biol. Crystallogr. 66, 133–144.Kabsch, W. (2010b). Acta Crystallogr. Sect. D Biol. Crystallogr. 66, 125–132.Leslie, A. G. W. (1999). Acta Crystallogr. Sect. D Biol. Crystallogr. 1696–1702.Leslie, A. G. W. & Powell, H. R. (2007). Evolving Methods for Macromolecular Crystallography, pp. 41–51.
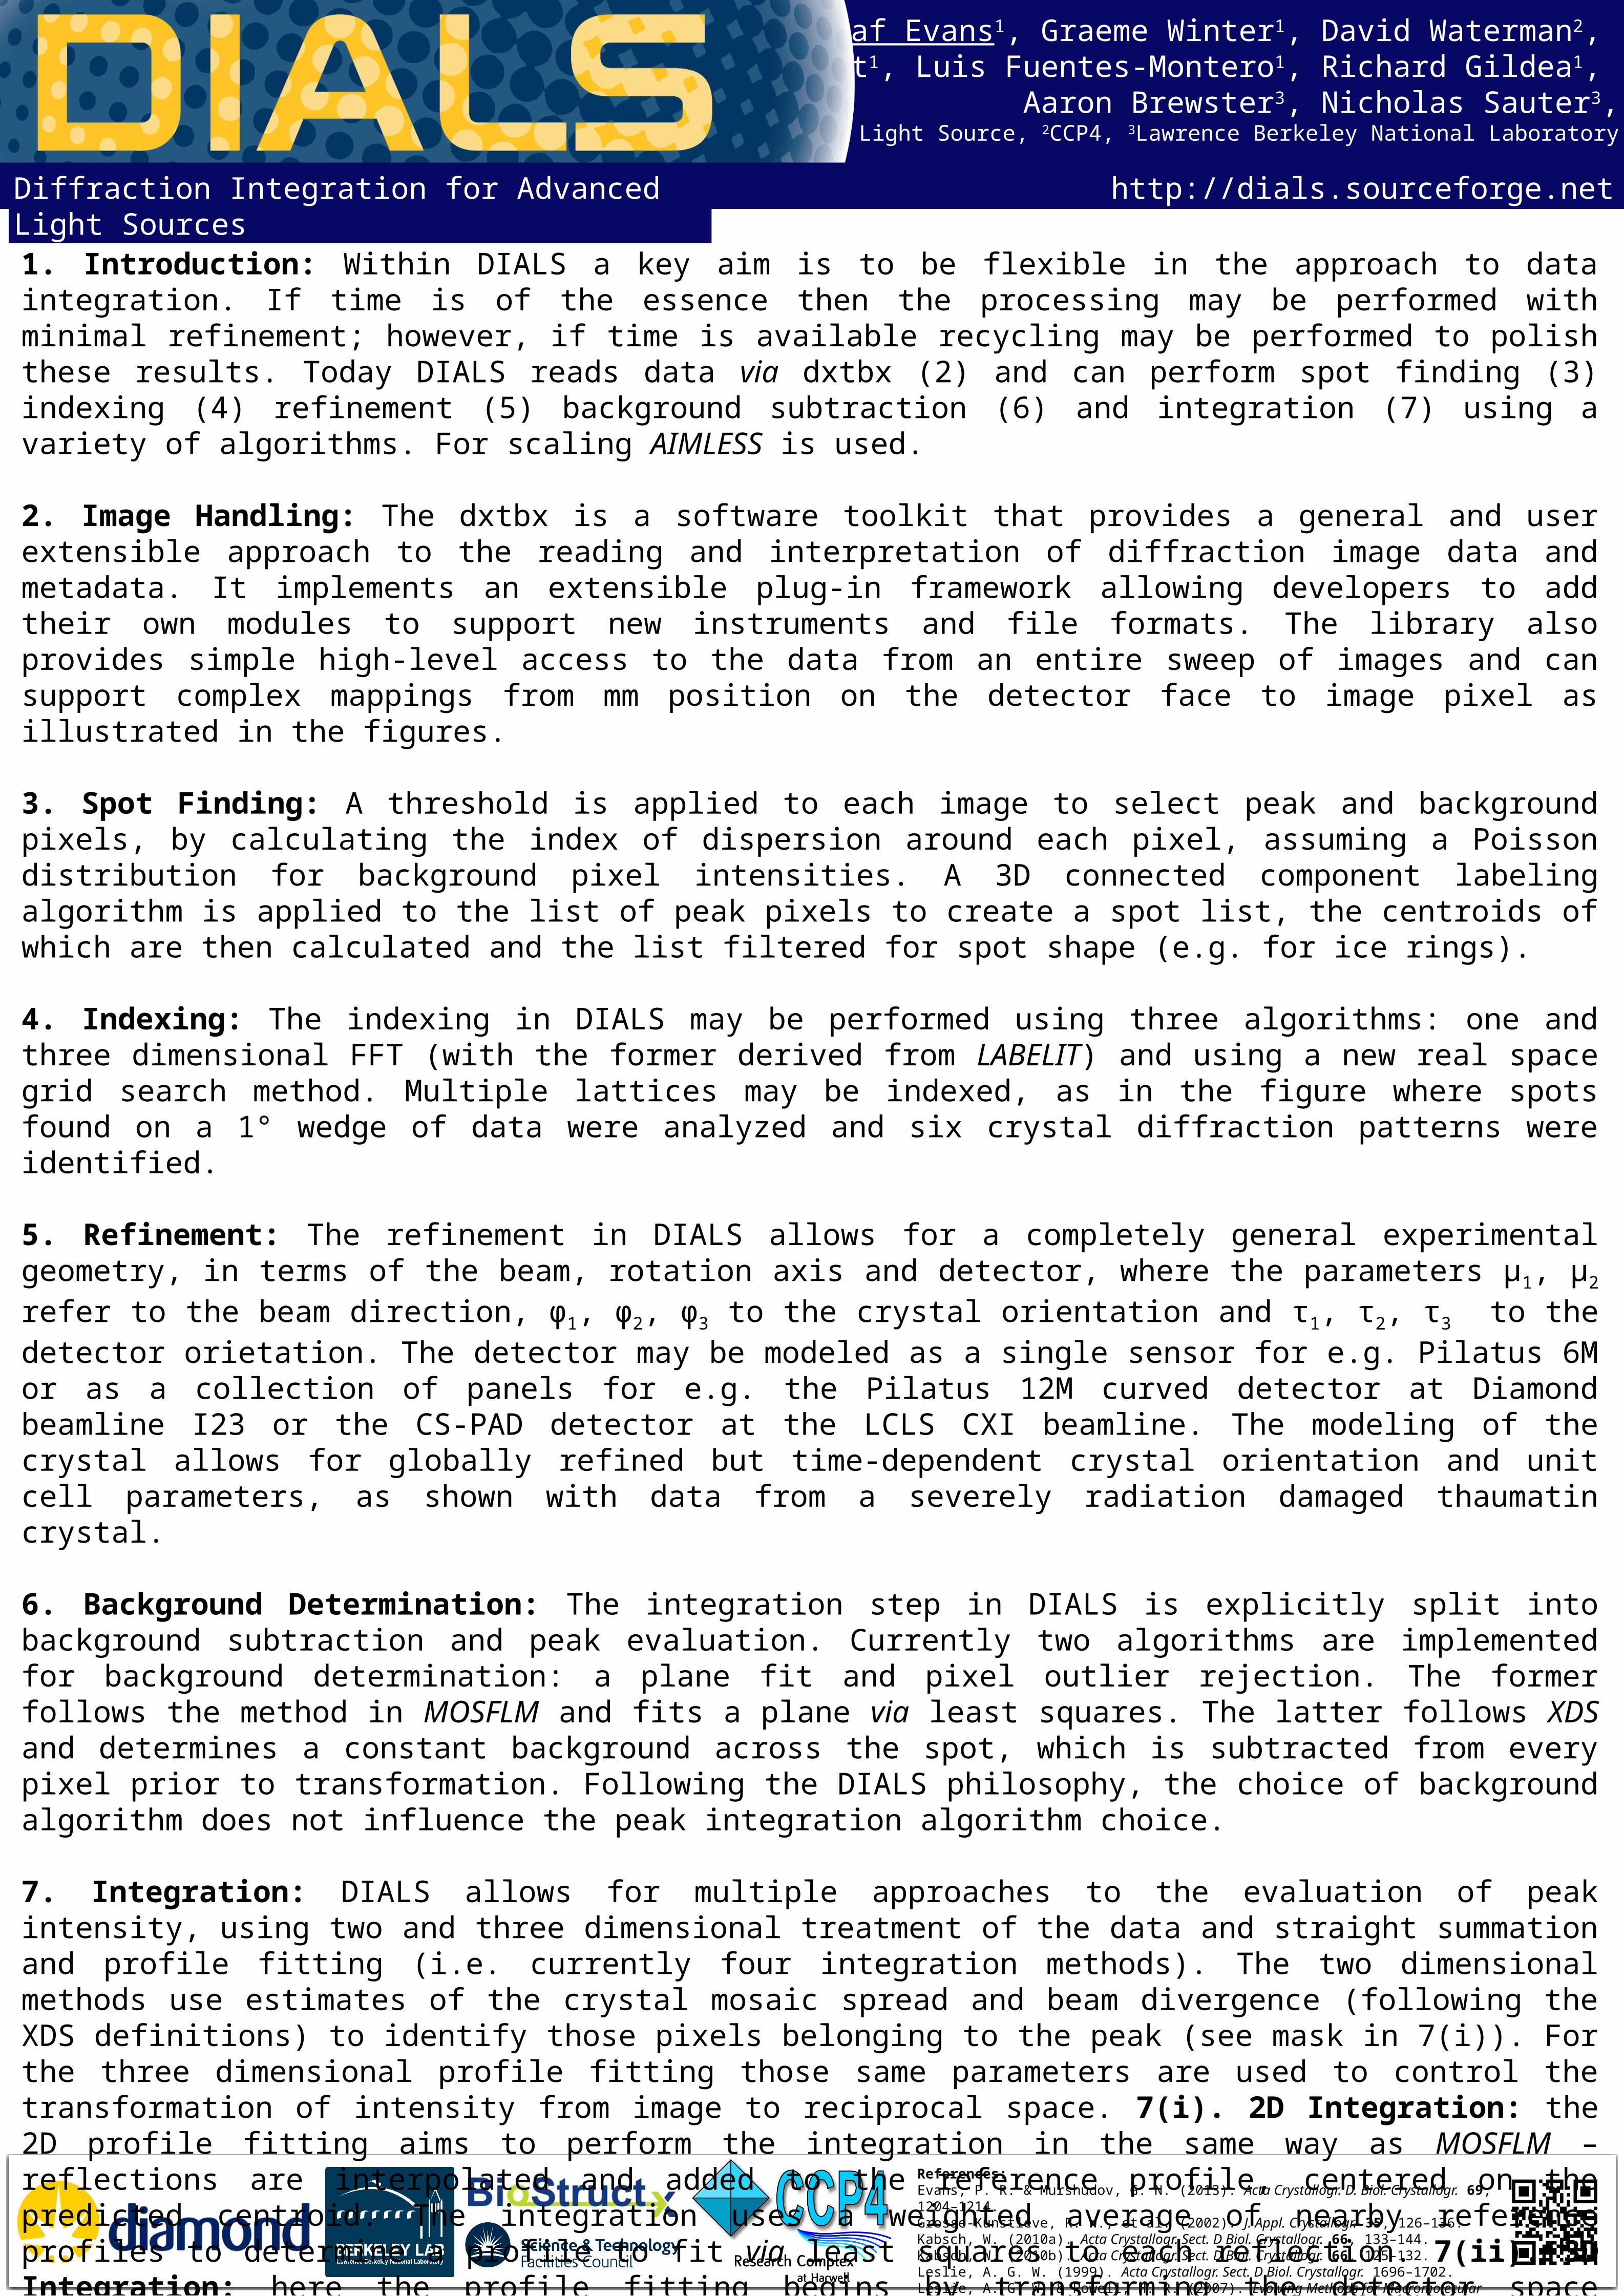
1. Introduction: Within DIALS a key aim is to be flexible in the approach to data integration. If time is of the essence then the processing may be performed with minimal refinement; however, if time is available recycling may be performed to polish these results. Today DIALS reads data via dxtbx (2) and can perform spot finding (3) indexing (4) refinement (5) background subtraction (6) and integration (7) using a variety of algorithms. For scaling AIMLESS is used.
2. Image Handling: The dxtbx is a software toolkit that provides a general and user extensible approach to the reading and interpretation of diffraction image data and metadata. It implements an extensible plug-in framework allowing developers to add their own modules to support new instruments and file formats. The library also provides simple high-level access to the data from an entire sweep of images and can support complex mappings from mm position on the detector face to image pixel as illustrated in the figures.
3. Spot Finding: A threshold is applied to each image to select peak and background pixels, by calculating the index of dispersion around each pixel, assuming a Poisson distribution for background pixel intensities. A 3D connected component labeling algorithm is applied to the list of peak pixels to create a spot list, the centroids of which are then calculated and the list filtered for spot shape (e.g. for ice rings).
4. Indexing: The indexing in DIALS may be performed using three algorithms: one and three dimensional FFT (with the former derived from LABELIT) and using a new real space grid search method. Multiple lattices may be indexed, as in the figure where spots found on a 1° wedge of data were analyzed and six crystal diffraction patterns were identified.
5. Refinement: The refinement in DIALS allows for a completely general experimental geometry, in terms of the beam, rotation axis and detector, where the parameters μ1, μ2 refer to the beam direction, φ1, φ2, φ3 to the crystal orientation and τ1, τ2, τ3 to the detector orietation. The detector may be modeled as a single sensor for e.g. Pilatus 6M or as a collection of panels for e.g. the Pilatus 12M curved detector at Diamond beamline I23 or the CS-PAD detector at the LCLS CXI beamline. The modeling of the crystal allows for globally refined but time-dependent crystal orientation and unit cell parameters, as shown with data from a severely radiation damaged thaumatin crystal.
6. Background Determination: The integration step in DIALS is explicitly split into background subtraction and peak evaluation. Currently two algorithms are implemented for background determination: a plane fit and pixel outlier rejection. The former follows the method in MOSFLM and fits a plane via least squares. The latter follows XDS and determines a constant background across the spot, which is subtracted from every pixel prior to transformation. Following the DIALS philosophy, the choice of background algorithm does not influence the peak integration algorithm choice.
7. Integration: DIALS allows for multiple approaches to the evaluation of peak intensity, using two and three dimensional treatment of the data and straight summation and profile fitting (i.e. currently four integration methods). The two dimensional methods use estimates of the crystal mosaic spread and beam divergence (following the XDS definitions) to identify those pixels belonging to the peak (see mask in 7(i)). For the three dimensional profile fitting those same parameters are used to control the transformation of intensity from image to reciprocal space. 7(i). 2D Integration: the 2D profile fitting aims to perform the integration in the same way as MOSFLM – reflections are interpolated and added to the reference profile, centered on the predicted centroid. The integration uses a weighted average of nearby reference profiles to determine a profile to fit via least squares to each reflection. 7(ii). 3D Integration: here the profile fitting begins by transforming the detector space profiles of each reflection into a local reflection-specific coordinate frame on the Ewald sphere (illustrated on the left of the figure.) This transformation standardizes the appearance of the reflection profiles improving profile fitting. Reference profiles are constructed at 9 points on the detector surface and each reflection is then integrated using the nearest reference profile.
8. Results: the results of processing two data sets with DIALS. Glucose isomerase (top) showing the difference density in the active site calculated with DIMPLE, and the merging statistics from AIMLESS. The second example (bottom) is SAD data from a complex of Λ-[Ru(TAP)2(dppz)]2+ and d(TCGGCGCCGA) the data for which were also scaled with AIMLESS and solved using fast_ep employing SHELX C/D/E. The correlation of reflection profiles for this second data set are shown on the right, indicating that the correlation of stronger reflections to the reference profile is higher as should be expected. These diagnostics were generated after DIALS processing with the tool dials.analyse_output.
Gwyndaf Evans1, Graeme Winter1, David Waterman2, James Parkhurst1, Luis Fuentes-Montero1, Richard Gildea1,
Aaron Brewster3, Nicholas Sauter3,1Diamond Light Source, 2CCP4, 3Lawrence Berkeley National Laboratory
Diffraction Integration for Advanced Light Sources http://dials.sourceforge.net