
3 Rivers Project - Final Report · Three Rivers Project Final Report ... RS9C02340 Camac Toyota...
26
APPENDIX 6H CAMAC PILOT STUDY AREA (URBAN) For inspection purposes only. Consent of copyright owner required for any other use. EPA Export 26-07-2013:01:29:45
Transcript of 3 Rivers Project - Final Report · Three Rivers Project Final Report ... RS9C02340 Camac Toyota...
APPENDIX 6H
CAMAC PILOT STUDY AREA (URBAN)
For
insp
ectio
n pur
pose
s only
.
Conse
nt of
copy
right
owne
r req
uired
for a
ny ot
her u
se.
EPA Export 26-07-2013:01:29:45
Three Rivers Project Final Report
MCOS/192/001/002/Rp0036 1 Rev F01
1 CAMAC PILOT STUDY AREA
1.1 INTRODUCTION Urbanisation accounts for 6% of the landuse in the Liffey catchment compared to approximately 1% in both the Boyne and the Suir catchments. Because of the significance of this landuse in the Liffey the Project developed a study area in a predominantly urban catchment to ascertain the effects that the various sectors (residential, industrial, roads, and developing areas) may have on water quality. The catchment that was chosen was the Camac system that flows through a considerable area of South County Dublin. The catchment comprises of:
�� 3734 hectares – Rural �� 1144 hectares – Residential �� 883 hectares – Industrial �� 137 hectares – Developing �� 76 hectares – Naas Road and M50.
1.1.1 Description of the Study Area The River Camac rises in the Dublin Mountains at Mount Seskin and flows westerly before entering Brittas pond. The river exits Brittas pond and takes a generally north/north-westerly course through South West Dublin before discharging to the Liffey from a new culvert under Heuston Railway Station just downstream of the Liffey freshwater limit at Islandbridge weir. The Camac is 24km in length, and has a catchment area of 59km2. The fall of the river from Mount Seskin to the Liffey outfall is approximately 330m. The population of the catchment was approximately 117,000 persons according to census of 1996, although recent development has seen this figure increase.
The Camac River catchment has significantly different landuse characteristics over its run from source to sea. The upper 7km of river length has a rural catchment. The remaining catchment is either developing, or has existing major suburban conurbations, or consists of highly industrialised areas. The river also drains two major roads, the Western Parkway Motorway (M50) and the N7, Naas Road.
Rural Area
This comprises of the area between the source at Mount Seskin and the first Water Quality (WQ) sampling point at Slade Road (CO2100) just upstream of Saggart Village. The area contains the proposed National Heritage Area at Slade of Saggart/Crooksling as well as some agriculture and discontinued quarrying operations. The farming in this area would be of medium to high intensity in the lower sections, with low intensity on the higher and more inaccessible ground.
Developing Area
The developing area of the catchment is situated between Slade Road, Saggart, and the north-west end of Corkagh Park Clondalkin. This area comprises of the partially completed Citywest Business Campus off the Naas Road, Baldonnel Business Park, Roadstone Belgard, Westbrook Housing Estate, Saggart Village and Fettercairn Housing Estate in West Tallaght. There is also agriculture in this section around Baldonnel but large swathes of land are being developed for industry particularly in the vicinity of the Citywest complex.
Urban Area
This area extends from Corkagh Park to the confluence with the Liffey. The area comprises of 2,280 hectares that can be sub-divided into residential and industrial sectors. The major residential areas are Clondalkin village and the housing estates of Drimnagh and Walkinstown. The principal industrial areas are Galblack, Ballymount, Fox and Geese, and Nangor.
For
insp
ectio
n pur
pose
s only
.
Conse
nt of
copy
right
owne
r req
uired
for a
ny ot
her u
se.
EPA Export 26-07-2013:01:29:45
Three Rivers Project Final Report
MCOS/192/001/002/Rp0036 2 Rev F01
1.2 WATER QUALITY MONITORING NETWORK The water quality monitoring network was designed to sample from three land use types in the Camac catchment: developing, residential, and industrial/urban. There were ten weekly grab sampling points established on the Camac (Figure 2, Table 1) and eight of these sites were biologically monitored on a yearly basis. Three of the ten stations are EPA sites (Camac Close, Bridge SW Saggart and Kylemore Road Bridge). As well as sampling the main channel, sampling was also carried out on three tributaries in the catchment: Brownsbarn, Robinhood and Walkinstown.
1.2.1 Grab Sample Sites RS9 CO2100: This was the control site for the Study Area (SA) and was situated upstream of Saggart Village. Agriculture was the predominant landuse although there were a significant number of domestic dwellings.
RS9 BO61000: This site was chosen, as it was the largest tributary in the upper catchment.
Table 1 – Grab Sample Sites
Site ID River Name Station Location WQ Monitoring
Station Type
RS9C02340 Camac Toyota Ireland weekly special study area
RS9R03700 Robinhood Stream 150M us Camac Confluence weekly special study area
RS9D03100 Walkinstown Stream 100m u/s Camac Confluence weekly special study area
RS9B061000 Brownsbarn Stream Br on Naas Dual Carr weekly special study area
RS9C02260 Camac End of Cherrywood Crescent weekly special study area
RS9C02325 Camac Yellow Meadows weekly special study area
RS9C02453 Camac Landsdowne Valley Park weekly special study area
RS9C02100 Camac Br. 1km SW Saggart weekly special study area
RS9C02400 Camac Kylemore Rd Br weekly special study area
RS9C02500 Camac Camac Close Emmet Rd Weekly/temp special study area
RS9 CO2260: This site at Corcagh Park was situated downstream of most of the developing industrial areas but upstream of the major urban sectors at Cherrywood Crescent. The site was upstream of the residential sector in Clondalkin and also indicated the background influence of the WWTP at Saggart.
RS9 CO2325: The Yellow Meadows station was situated downstream of Clondalkin and upstream of the Western Parkway at Yellow Meadows housing estate. It was designed to act as a downstream site for the Clondalkin residential area. All of Clondalkin (except Woodford/Monksfield) has drained to the river by this sampling point.
RS9 CO2340: This site was chosen because of an existing hydrometric station situated in the grounds of Toyota Ireland. This was the only completely rated hydrometric station on the system and was used to estimate flows at other water quality sites.
For
insp
ectio
n pur
pose
s only
.
Conse
nt of
copy
right
owne
r req
uired
for a
ny ot
her u
se.
EPA Export 26-07-2013:01:29:45

Three Rivers Project Final Report
MCOS/192/001/002/Rp0036 3 Rev F01
Figure 1: Camac Special Study Catchment – Location
Figure 2: Camac Special Study Catchment – Water Quality Sites
For
insp
ectio
n pur
pose
s only
.
Conse
nt of
copy
right
owne
r req
uired
for a
ny ot
her u
se.
EPA Export 26-07-2013:01:29:45

Three Rivers Project Final Report
MCOS/192/001/002/Rp0036 4 Rev F01
RS9 RO3700: The water quality station on the Robinhood stream was situated 200 meters upstream of the confluence with the Camac. This stream drains a catchment of 580 hectares with significant industrial developments.
RS9 CO2400: This site was situated at Kylemore Road Bridge beside the Sheldon Hotel. It was downstream of the Robinhood confluence and outfalls from large industrial developments around the Fox and Geese.
RS9 DO3100: The Walkinstown Stream is the last significant tributary of the Camac and was used to monitor the runoff from a catchment that was predominantly residential. The sampling point was situated on the Walkinstown Stream upstream of its confluence with the Camac.
RS9 CO2453: This site was added to the network soon after monitoring began because of its suitability as a hydrometric station and was therefore a suitable end point for the study area.
RS9 CO2500: The site at Emmet Close was monitored by the project for seven months from January 2000 to the end of July 2000 to assess whether the water quality (WQ) characteristics were similar to the preferred site above. The WQ characteristics proved similar and this site was subsequently excluded.
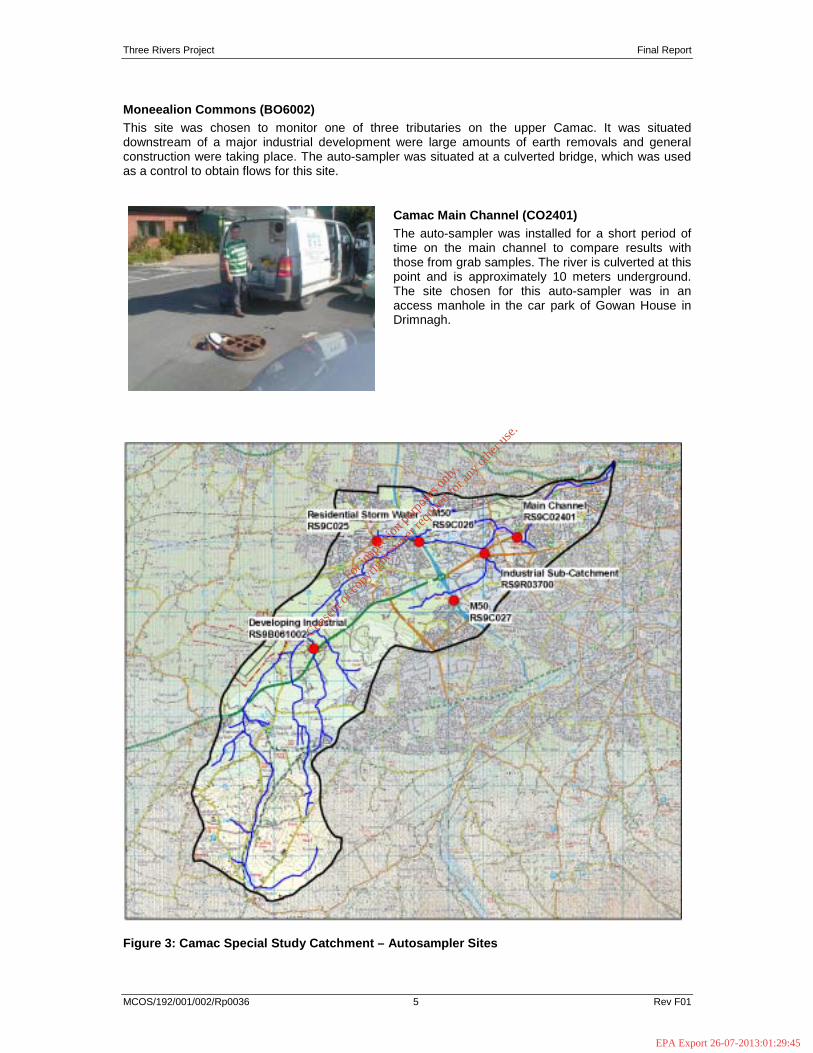
1.2.2 Auto-sampler Sites An auto-sampler was utilised in four different locations in the catchment to monitor water from different landuses. It was installed at each location for two months to sample low flows and two months to sample high flows (Figure 3 Auto-sampler Sites). Culverts or pipes were used extensively for the installations, enabling flow measurement. A second auto-sampler was obtained in August 2001 and was used to collect data on water quality at the end of the main channel. This was used to compare and contrast data collected by weekly grab samples to data collected daily by the auto-sampler.
Most of the auto-sampling stations on the Camac were set to sample on a flow proportional basis, except the main channel site that had to be left on half hour sampling due to operational problems.
Robinhood (RO3700)
The Robinhood Stream is a sub-catchment of the Camac River with an area of 580 hectares comprising both residential and commercial components. Approximately 50% of the catchment is industrial (Ballymount 215ha, Kingswood 11ha). The rest comprises of residential (56ha), motorway (17ha) and parkland (140ha). The auto-sampler site for this location was in a 2,800 mm culvert at the confluence with the Camac. As in all the sites on the Camac, security of the auto-sampler had a major influence on the choice of site.
Lock and Key (CO25)
The Lock and Key auto-sampler was situated in a stormwater drain that serviced a 62-hectare area. The land use of the area was principally residential. The access to this 1,350mm stormwater pipe was located in the car park of the Lock and Key public house in Clondalkin.
M-50 (CO26 and 27)
The objective of this part of the Camac study was to monitor drainage from major infrastructure, in this case the M-50 motorway and part of the Naas Road (N7). Two sites were used, the first site being a service manhole of a 450-mm pipe that drained approximately 2.5km of the M50 (CO26) and part of the Naas Road. The site was influenced by some other source other than runoff from roads, judging from the amount of detergent evident, indicative of extraneous connections possibly from the Naas Road. The second site (CO27) chosen was in a 975-mm pipe that serviced both sides of the motorway between the Ballymount and the Redcow interchanges. Both of these pipes drained the motorway through a “French Drain” system that would have filtered some particulate matter.
For
insp
ectio
n pur
pose
s only
.
Conse
nt of
copy
right
owne
r req
uired
for a
ny ot
her u
se.
EPA Export 26-07-2013:01:29:45
Three Rivers Project Final Report
MCOS/192/001/002/Rp0036 5 Rev F01
Moneealion Commons (BO6002)
This site was chosen to monitor one of three tributaries on the upper Camac. It was situated downstream of a major industrial development were large amounts of earth removals and general construction were taking place. The auto-sampler was situated at a culverted bridge, which was used as a control to obtain flows for this site.
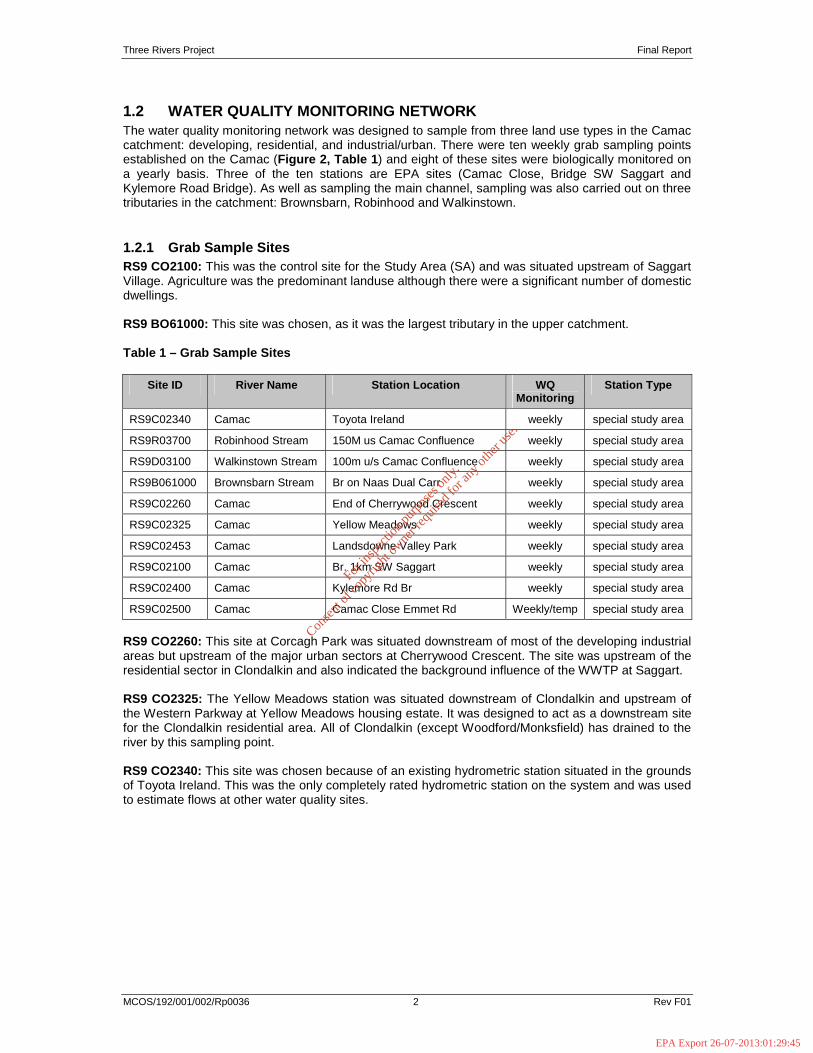
Camac Main Channel (CO2401)
The auto-sampler was installed for a short period of time on the main channel to compare results with those from grab samples. The river is culverted at this point and is approximately 10 meters underground. The site chosen for this auto-sampler was in an access manhole in the car park of Gowan House in Drimnagh.
Figure 3: Camac Special Study Catchment – Autosampler Sites
For
insp
ectio
n pur
pose
s only
.
Conse
nt of
copy
right
owne
r req
uired
for a
ny ot
her u
se.
EPA Export 26-07-2013:01:29:45

Three Rivers Project Final Report
MCOS/192/001/002/Rp0036 6 Rev F01
1.3 WATER QUALITY RESULTS
1.3.1 Biological Monitoring Biological monitoring of the Camac was carried out at eight sites on the Camac main channel and tributaries. The EPA has monitored three of these sites for more than twenty years (CO2100, CO2400, and CO2500). Results for all the sites monitored on the Camac are shown in Table 2.
Table 2 – Camac - SA Biological Monitoring Results
Site Code River Name Station Name Pre 1999 Q rating
1999 Q rating
2000 Q rating
RS9R03700 Robinhood Stream 150M us Camac Confluence - 2-3 2-3
RS9D03100 Walkinstown Stream 100m us Camac Confluence - 2-3 2-3
RS9B061000 Brownsbarn Stream Br on Naas Road - 3 3
RS9C02260 Camac End of Cherrywood Crescent - 3 3
RS9C02325 Camac Yellow Meadows - 3 3
RS9C02100 Camac Br. 1km SW Saggart 4-5 4 3-4
RS9C02400 Camac Kylemore Rd Br 3 2 -
RS9C02500 Camac Camac Close Emmet Rd 1-2 2 2
The results show that there are some significant problems with the water quality from Kylemore Road Bridge downstream. For the last twenty years the Kylemore Bridge site (CO2400) has had Q values fluctuating between 1 and 3 indicative of moderate to serious pollution. The control site above Saggart (CO2100) has also shown a decrease in its biological rating going from indicative Q value of “unpolluted” to “slightly polluted”. All the other sites monitored have shown no change in their biological status.
1.3.2 Physico/Chemical – Grab Sampling Grab sampling was carried out at nine sites in the Camac catchment for the duration of the project, and at one site, CO2500 for seven months (dropped in favour of site CO2453). Grab samples were also taken at the auto-sampler sites for short selected periods.
In this section results are analysed for eight water quality parameters and the full results are shown in Appendix A. The EPA uses a number of these parameters in assessing impaired water quality in Irish rivers, pH, dissolved oxygen percentage saturation (DO), dissolved oxygen (mgO2/l), total ammonia (mgN/l), oxidised nitrogen (mgN/l), and ortho-Phosphate (mgP/l). Where limit values for these parameters have been exceeded they are highlighted in red.
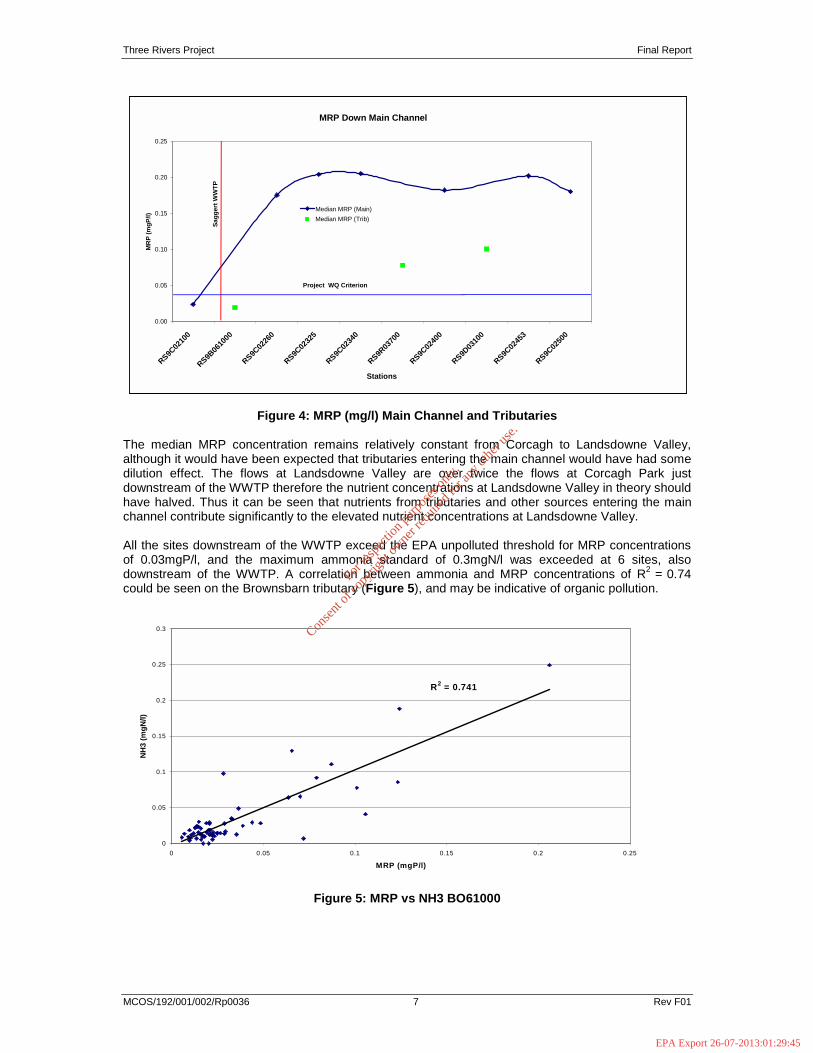
The median MRP concentration results for the main channel and tributaries are shown in Figure 4.There is a dramatic increase in the median MRP (mg/l) concentration from site CO2100 above Saggart to C02260 at Corkagh Park. This increase in median MRP concentration was primarily due to Saggart Wastewater Treatment Plant (WWTP).
For
insp
ectio
n pur
pose
s only
.
Conse
nt of
copy
right
owne
r req
uired
for a
ny ot
her u
se.
EPA Export 26-07-2013:01:29:45
Three Rivers Project Final Report
MCOS/192/001/002/Rp0036 7 Rev F01
Figure 4: MRP (mg/l) Main Channel and Tributaries
The median MRP concentration remains relatively constant from Corcagh to Landsdowne Valley, although it would have been expected that tributaries entering the main channel would have had some dilution effect. The flows at Landsdowne Valley are over twice the flows at Corcagh Park just downstream of the WWTP therefore the nutrient concentrations at Landsdowne Valley in theory should have halved. Thus it can be seen that nutrients from tributaries and other sources entering the main channel contribute significantly to the elevated nutrient concentrations at Landsdowne Valley.
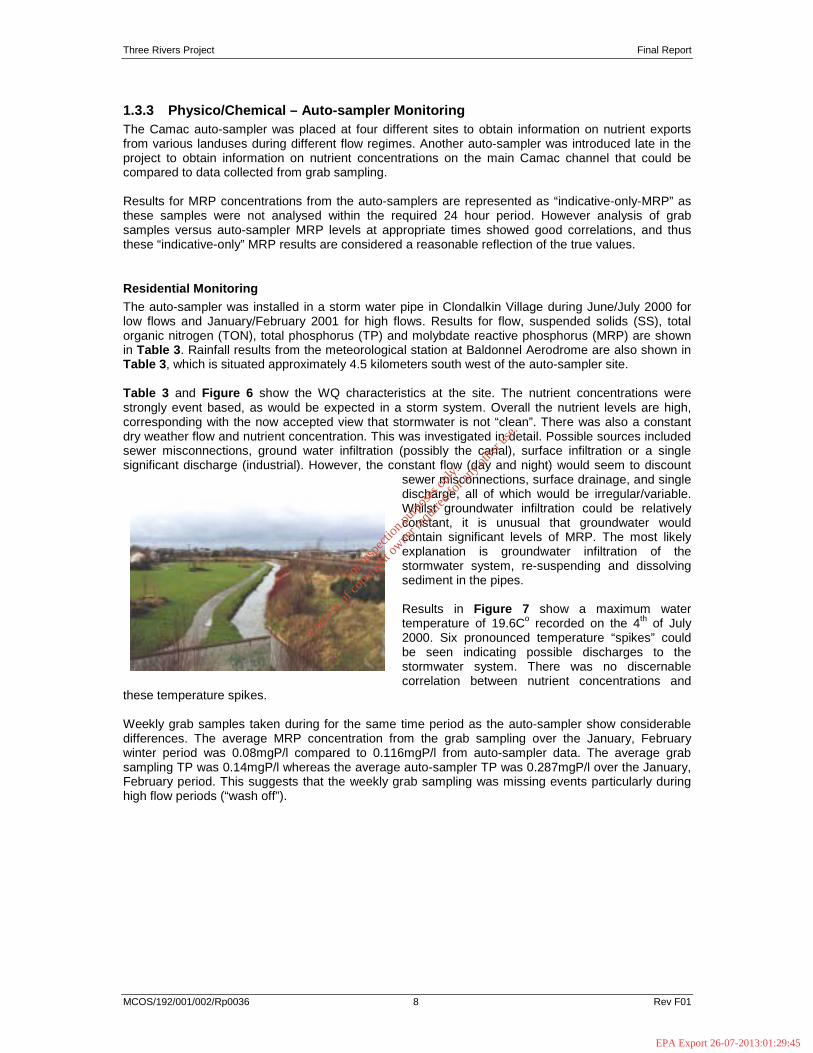
All the sites downstream of the WWTP exceed the EPA unpolluted threshold for MRP concentrations of 0.03mgP/l, and the maximum ammonia standard of 0.3mgN/l was exceeded at 6 sites, also downstream of the WWTP. A correlation between ammonia and MRP concentrations of R2 = 0.74 could be seen on the Brownsbarn tributary (Figure 5), and may be indicative of organic pollution.
Figure 5: MRP vs NH3 BO61000
R2 = 0.741
0
0.05
0.1
0.15
0.2
0.25
0.3
0 0.05 0.1 0.15 0.2 0.25
MRP (mgP/l)
NH
3 (
mg
N/l)
MRP Down Main Channel
0.00
0.05
0.10
0.15
0.20
0.25
RS9C02
100
RS9B06
1000
RS9C02
260
RS9C02
325
RS9C02
340
RS9R03
700
RS9C02
400
RS9D03
100
RS9C02
453
RS9C02
500
Stations
MR
P (
mg
P/l
)
Median MRP (Main)
Median MRP (Trib)S
ag
ge
rt W
WT
P
Project WQ Criterion
For
insp
ectio
n pur
pose
s only
.
Conse
nt of
copy
right
owne
r req
uired
for a
ny ot
her u
se.
EPA Export 26-07-2013:01:29:45
Three Rivers Project Final Report
MCOS/192/001/002/Rp0036 8 Rev F01
1.3.3 Physico/Chemical – Auto-sampler Monitoring The Camac auto-sampler was placed at four different sites to obtain information on nutrient exports from various landuses during different flow regimes. Another auto-sampler was introduced late in the project to obtain information on nutrient concentrations on the main Camac channel that could be compared to data collected from grab sampling.
Results for MRP concentrations from the auto-samplers are represented as “indicative-only-MRP” as these samples were not analysed within the required 24 hour period. However analysis of grab samples versus auto-sampler MRP levels at appropriate times showed good correlations, and thus these “indicative-only” MRP results are considered a reasonable reflection of the true values.
Residential Monitoring
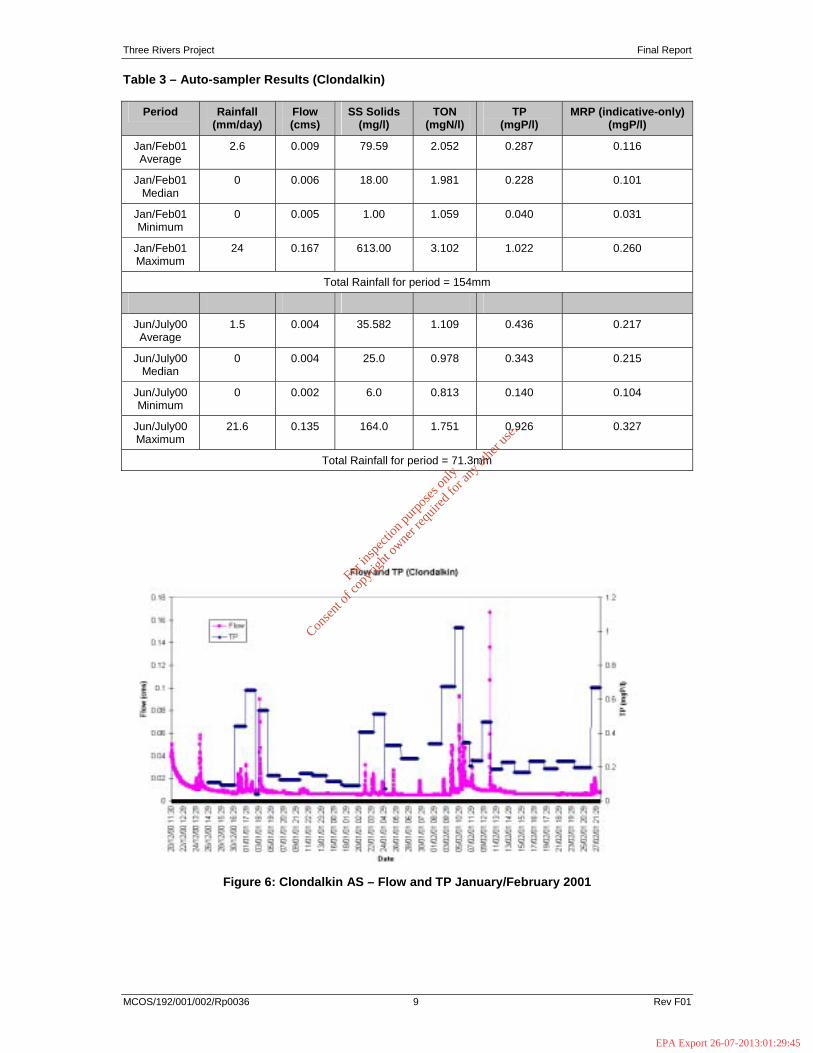
The auto-sampler was installed in a storm water pipe in Clondalkin Village during June/July 2000 for low flows and January/February 2001 for high flows. Results for flow, suspended solids (SS), total organic nitrogen (TON), total phosphorus (TP) and molybdate reactive phosphorus (MRP) are shown in Table 3. Rainfall results from the meteorological station at Baldonnel Aerodrome are also shown in Table 3, which is situated approximately 4.5 kilometers south west of the auto-sampler site.
Table 3 and Figure 6 show the WQ characteristics at the site. The nutrient concentrations were strongly event based, as would be expected in a storm system. Overall the nutrient levels are high, corresponding with the now accepted view that stormwater is not “clean”. There was also a constant dry weather flow and nutrient concentration. This was investigated in detail. Possible sources included sewer misconnections, ground water infiltration (possibly the canal), surface infiltration or a single significant discharge (industrial). However, the constant flow (day and night) would seem to discount
sewer misconnections, surface drainage, and single discharge, all of which would be irregular/variable. Whilst groundwater infiltration could be relatively constant, it is unusual that groundwater would contain significant levels of MRP. The most likely explanation is groundwater infiltration of the stormwater system, re-suspending and dissolving sediment in the pipes.
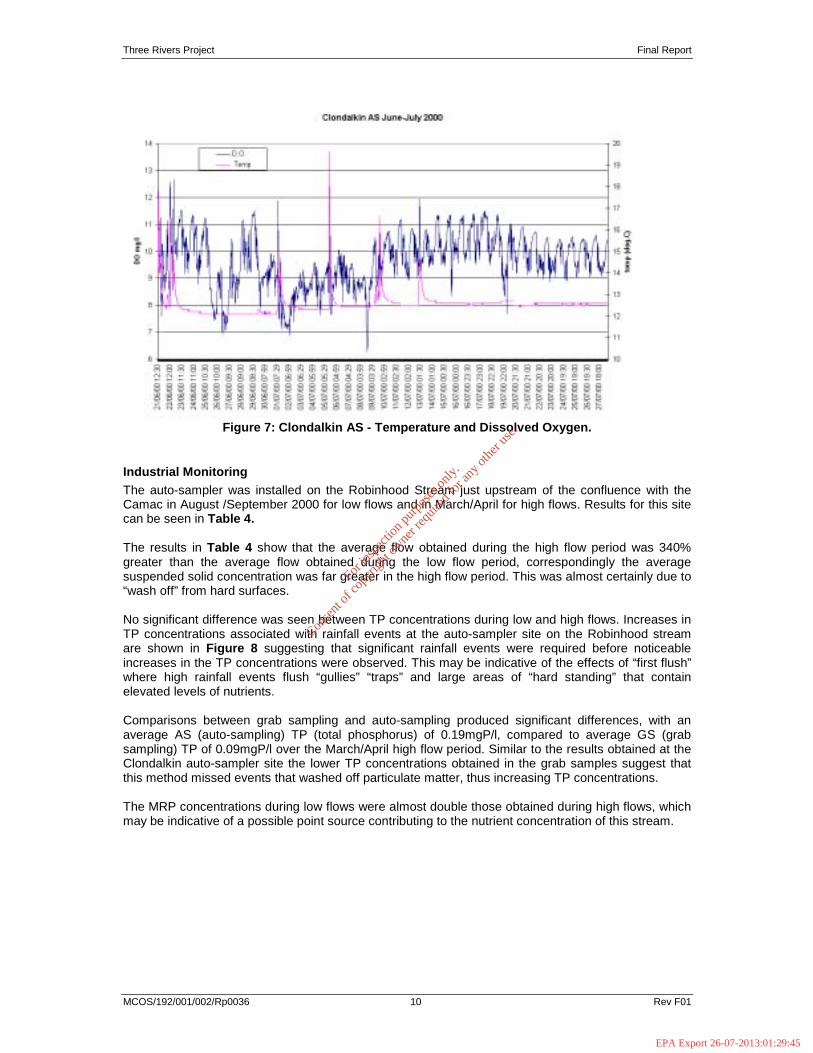
Results in Figure 7 show a maximum water temperature of 19.6Co recorded on the 4th of July 2000. Six pronounced temperature “spikes” could be seen indicating possible discharges to the stormwater system. There was no discernable correlation between nutrient concentrations and
these temperature spikes.
Weekly grab samples taken during for the same time period as the auto-sampler show considerable differences. The average MRP concentration from the grab sampling over the January, February winter period was 0.08mgP/l compared to 0.116mgP/l from auto-sampler data. The average grab sampling TP was 0.14mgP/l whereas the average auto-sampler TP was 0.287mgP/l over the January, February period. This suggests that the weekly grab sampling was missing events particularly during high flow periods (“wash off”).
For
insp
ectio
n pur
pose
s only
.
Conse
nt of
copy
right
owne
r req
uired
for a
ny ot
her u
se.
EPA Export 26-07-2013:01:29:45
Three Rivers Project Final Report
MCOS/192/001/002/Rp0036 9 Rev F01
Table 3 – Auto-sampler Results (Clondalkin)
Period Rainfall(mm/day)
Flow (cms)
SS Solids (mg/l)
TON (mgN/l)
TP(mgP/l)
MRP (indicative-only)(mgP/l)
Jan/Feb01 Average
2.6 0.009 79.59 2.052 0.287 0.116
Jan/Feb01 Median
0 0.006 18.00 1.981 0.228 0.101
Jan/Feb01 Minimum
0 0.005 1.00 1.059 0.040 0.031
Jan/Feb01 Maximum
24 0.167 613.00 3.102 1.022 0.260
Total Rainfall for period = 154mm
Jun/July00 Average
1.5 0.004 35.582 1.109 0.436 0.217
Jun/July00 Median
0 0.004 25.0 0.978 0.343 0.215
Jun/July00 Minimum
0 0.002 6.0 0.813 0.140 0.104
Jun/July00 Maximum
21.6 0.135 164.0 1.751 0.926 0.327
Total Rainfall for period = 71.3mm
Figure 6: Clondalkin AS – Flow and TP January/February 2001
For
insp
ectio
n pur
pose
s only
.
Conse
nt of
copy
right
owne
r req
uired
for a
ny ot
her u
se.
EPA Export 26-07-2013:01:29:45
Three Rivers Project Final Report
MCOS/192/001/002/Rp0036 10 Rev F01
Figure 7: Clondalkin AS - Temperature and Dissolved Oxygen.
Industrial Monitoring
The auto-sampler was installed on the Robinhood Stream just upstream of the confluence with the Camac in August /September 2000 for low flows and in March/April for high flows. Results for this site can be seen in Table 4.
The results in Table 4 show that the average flow obtained during the high flow period was 340% greater than the average flow obtained during the low flow period, correspondingly the average suspended solid concentration was far greater in the high flow period. This was almost certainly due to “wash off” from hard surfaces.
No significant difference was seen between TP concentrations during low and high flows. Increases in TP concentrations associated with rainfall events at the auto-sampler site on the Robinhood stream are shown in Figure 8 suggesting that significant rainfall events were required before noticeable increases in the TP concentrations were observed. This may be indicative of the effects of “first flush” where high rainfall events flush “gullies” “traps” and large areas of “hard standing” that contain elevated levels of nutrients.
Comparisons between grab sampling and auto-sampling produced significant differences, with an average AS (auto-sampling) TP (total phosphorus) of 0.19mgP/l, compared to average GS (grab sampling) TP of 0.09mgP/l over the March/April high flow period. Similar to the results obtained at the Clondalkin auto-sampler site the lower TP concentrations obtained in the grab samples suggest that this method missed events that washed off particulate matter, thus increasing TP concentrations.
The MRP concentrations during low flows were almost double those obtained during high flows, which may be indicative of a possible point source contributing to the nutrient concentration of this stream.
For
insp
ectio
n pur
pose
s only
.
Conse
nt of
copy
right
owne
r req
uired
for a
ny ot
her u
se.
EPA Export 26-07-2013:01:29:45

Three Rivers Project Final Report
MCOS/192/001/002/Rp0036 11 Rev F01
Flow and TP (Robinhood)
0
0.2
0.4
0.6
0.8
1
1.2
1.4
Date
0.000
0.100
0.200
0.300
0.400
0.500
0.600
0.700
Flow 1
TP
Table 4 – Auto-sampler Results (Robinhood)
Period Rainfall(mm/day)
Flow (cms)
SS Solids (mg/l)
TON (mgN/l)
TP(mgP/l)
MRP (indicative-only) (mgP/l)
Mar/Apr01 Average
2.0 0.252 36.028 2.728 0.190 0.065
Mar/Apr01 Median
0.35 0.238 17.500 2.939 0.124 0.048
Mar/Apr01 Minimum
0 0.104 3.000 1.641 0.060 0.027
Mar/Apr01 Maximum
30 1.154 180.000 3.311 0.639 0.184
Total Rainfall for period = 123mm
Sept/Oct00 Average
2.5 0.074 13.919 1.787 0.170 0.112
Sept/Oct00 Median
1.10 0.048 5.800 1.806 0.154 0.111
Sept/Oct00 Minimum
0 0.002 1.500 0.856 0.089 0.053
Sept/Oct00 Maximum
10.8 1.784 67.300 2.288 0.433 0.194
Total Rainfall for period = 153mm
Figure 8: Robinhood AS - TP and Flow
For
insp
ectio
n pur
pose
s only
.
Conse
nt of
copy
right
owne
r req
uired
for a
ny ot
her u
se.
EPA Export 26-07-2013:01:29:45

Three Rivers Project Final Report
MCOS/192/001/002/Rp0036 12 Rev F01
Major Infrastructure Monitoring
The auto-sampler was installed at two sites on the M50 motorway to monitor drainage from a major infrastructure. The first site (CO26) monitored 2.5km of drainage from one side of the M50 motorway, and the Naas dual carriageway between the Canal/Camac crossover on the M50 to Newlands-Cross during November and December 2000. The second site monitored drainage from both sides of the M50 between the Ballymount and Redcow inter-changes during September and October 2001.
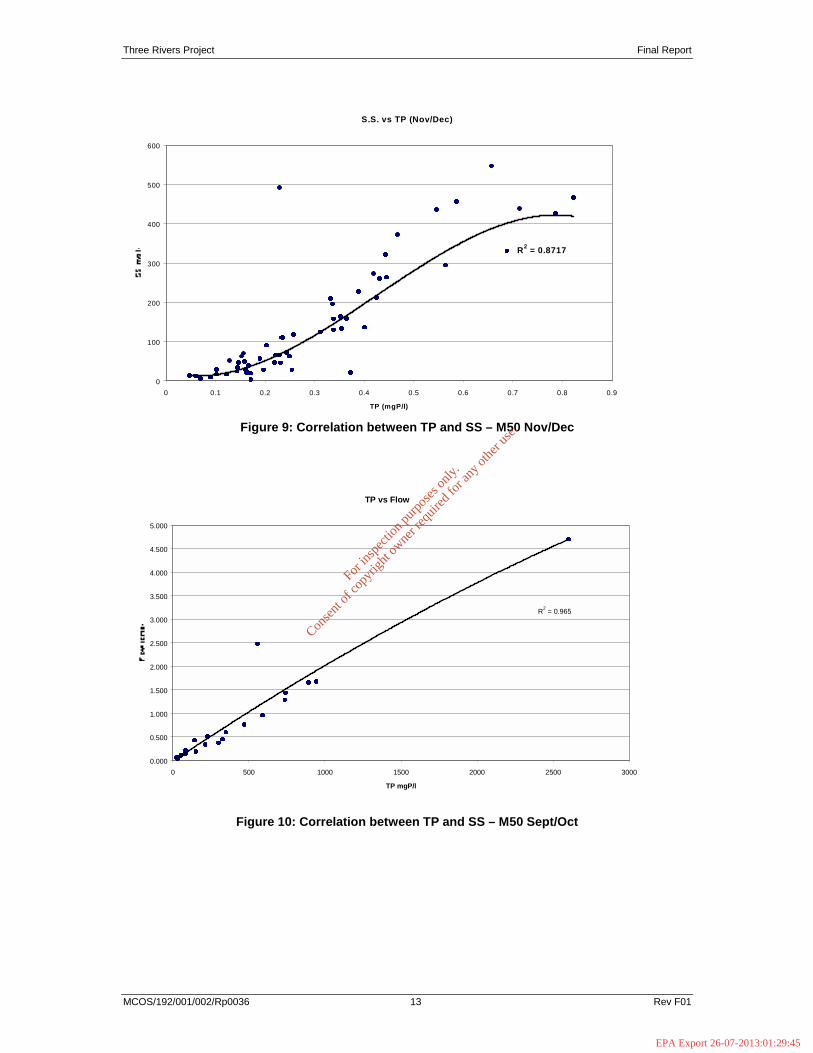
The results in Table 5 show that suspended solids (SS) concentrations from the CO27 site monitored in September/October were much higher than the SS concentrations at CO26. This was due to the high levels of silt that were deposited in the pipe in which the “intake” for the auto-sampler was situated. Correlations between TP and SS at both sites were high (Figure 9 and 10) and it can be seen that phosphorus adhered to particulate matter constituted the major source of phosphorus in these drainage pipes.
The Naas Rd/M50 monitoring (CO26) was suspected of being influenced by a mis-connection in a truck wash premises due to the quantities of foam observed at this site. Even with this mis-connection to the road drainage at CO26 the Three Rivers Project felt that an averaging of water quality results from both sites is appropriate to give a true reflection of the nutrient concentrations in road drainage affecting the Camac.
The median MRP (indicative) concentrations at the CO26 are 4.5 times greater than the CO27 site and the ratio between median TP concentration and median MRP concentration at the CO26 site was 3:1 whereas the same ratio at CO27 was 20:1. These results suggest that a great deal of the phosphorus at CO27 emanates from TP associated with particulate matter washed off by rainfall events, whereas the CO26 site may have been more influenced by a point source.
Table 5 – Auto-sampler Results (M-50)
Period Rainfall(mm/day)
Flow (cms)
SS Solids (mg/l)
TON (mgN/l)
TP(mgP/l)
MRP (indicative-only) (mgP/l)
CO26 Nov/Dec00
Average
4.9 0.005 131.411 0.634 0.303 0.086
CO26 Nov/Dec00
Median
1.3 0.002 91.500 0.545 0.250 0.081
CO26 Nov/Dec00 Minimum
0 0.000 4.200 0.298 0.047 0.009
CO26 Nov/Dec00 Maximum
82 0.076 547.000 2.103 0.823 0.339
Total Rainfall for period = 286mm
CO27 Sept/Oct01
Average
0.001 580.984 0.822 1.098 0.053
CO27 Sept/Oct01
Median
0.001 228.700 0.929 0.373 0.018
CO27 Sept/Oct01 Minimum
0.001 23.800 0.026 0.044 0.005
CO27 Sept/Oct01 Maximum
0.043 2602.000 1.858 4.702 0.323
For
insp
ectio
n pur
pose
s only
.
Conse
nt of
copy
right
owne
r req
uired
for a
ny ot
her u
se.
EPA Export 26-07-2013:01:29:45
Three Rivers Project Final Report
MCOS/192/001/002/Rp0036 13 Rev F01
Figure 9: Correlation between TP and SS – M50 Nov/Dec
Figure 10: Correlation between TP and SS – M50 Sept/Oct
S.S. vs TP (Nov/Dec)
R2 = 0.8717
0
100
200
300
400
500
600
0 0.1 0.2 0.3 0.4 0.5 0.6 0.7 0.8 0.9
TP (mgP/l)
TP vs Flow
R2 = 0.965
0.000
0.500
1.000
1.500
2.000
2.500
3.000
3.500
4.000
4.500
5.000
0 500 1000 1500 2000 2500 3000
TP mgP/l
For
insp
ectio
n pur
pose
s only
.
Conse
nt of
copy
right
owne
r req
uired
for a
ny ot
her u
se.
EPA Export 26-07-2013:01:29:45
Three Rivers Project Final Report
MCOS/192/001/002/Rp0036 14 Rev F01
Developing Area Monitoring
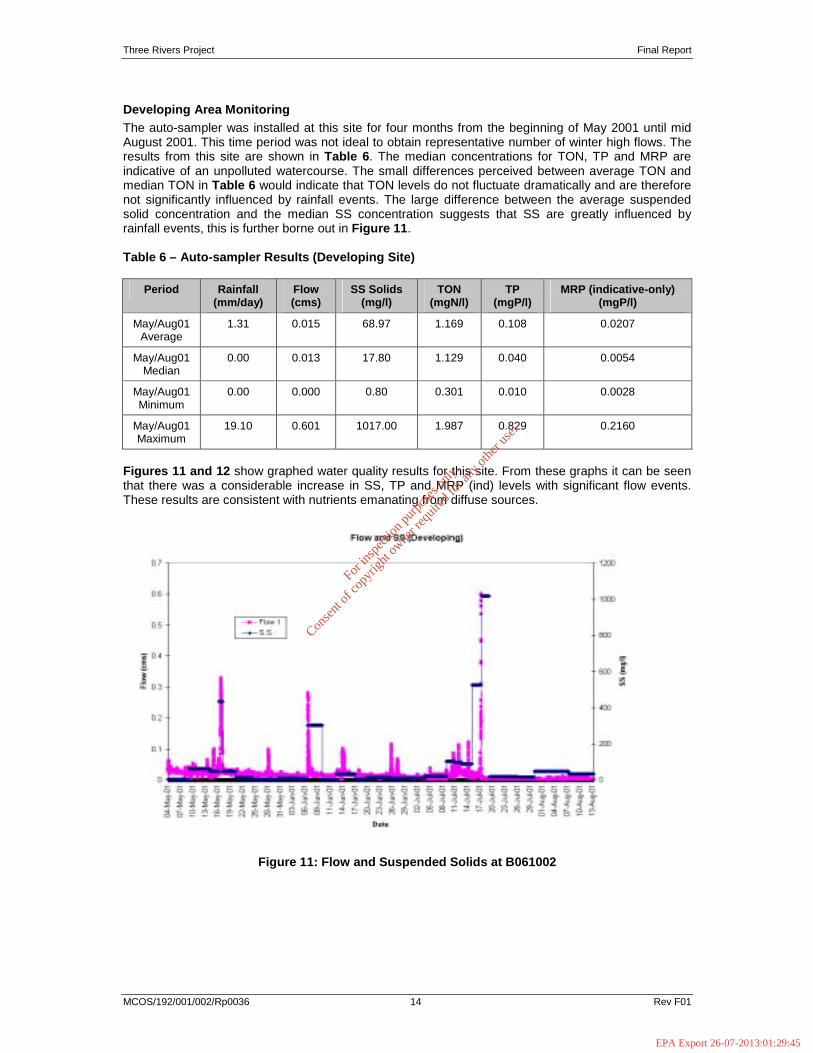
The auto-sampler was installed at this site for four months from the beginning of May 2001 until mid August 2001. This time period was not ideal to obtain representative number of winter high flows. The results from this site are shown in Table 6. The median concentrations for TON, TP and MRP are indicative of an unpolluted watercourse. The small differences perceived between average TON and median TON in Table 6 would indicate that TON levels do not fluctuate dramatically and are therefore not significantly influenced by rainfall events. The large difference between the average suspended solid concentration and the median SS concentration suggests that SS are greatly influenced by rainfall events, this is further borne out in Figure 11.
Table 6 – Auto-sampler Results (Developing Site)
Period Rainfall(mm/day)
Flow (cms)
SS Solids (mg/l)
TON (mgN/l)
TP(mgP/l)
MRP (indicative-only) (mgP/l)
May/Aug01 Average
1.31 0.015 68.97 1.169 0.108 0.0207
May/Aug01 Median
0.00 0.013 17.80 1.129 0.040 0.0054
May/Aug01 Minimum
0.00 0.000 0.80 0.301 0.010 0.0028
May/Aug01 Maximum
19.10 0.601 1017.00 1.987 0.829 0.2160
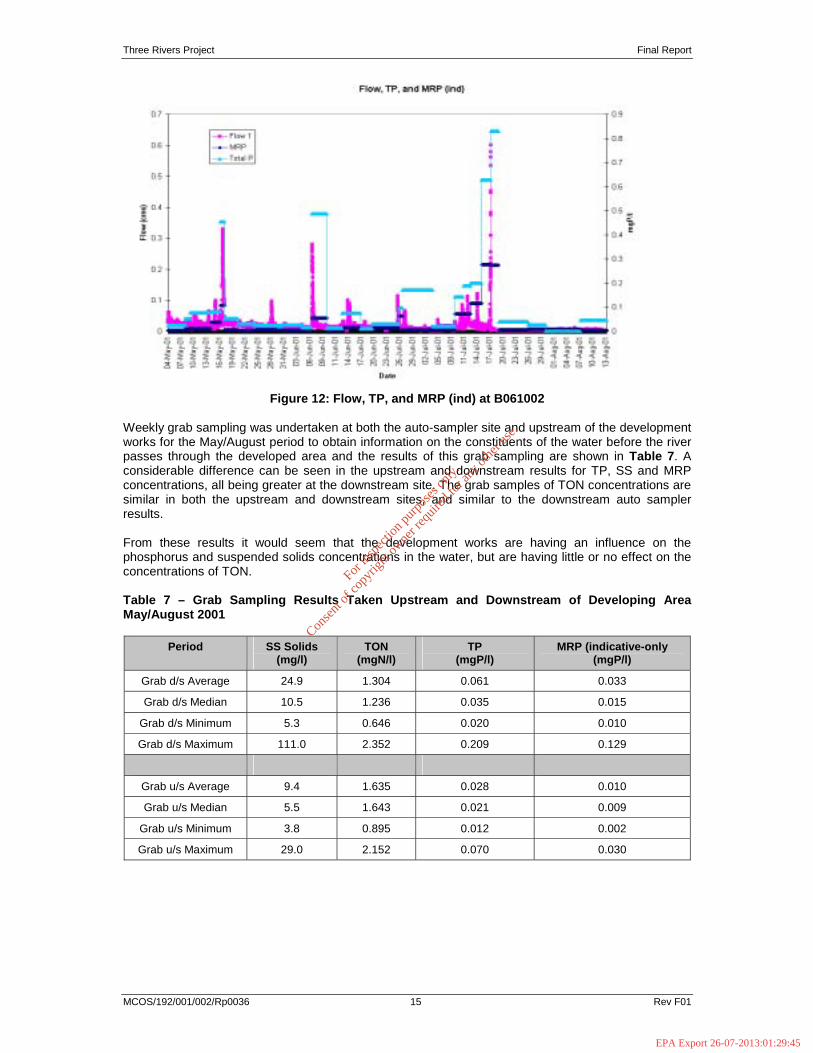
Figures 11 and 12 show graphed water quality results for this site. From these graphs it can be seen that there was a considerable increase in SS, TP and MRP (ind) levels with significant flow events. These results are consistent with nutrients emanating from diffuse sources.
Figure 11: Flow and Suspended Solids at B061002
For
insp
ectio
n pur
pose
s only
.
Conse
nt of
copy
right
owne
r req
uired
for a
ny ot
her u
se.
EPA Export 26-07-2013:01:29:45
Three Rivers Project Final Report
MCOS/192/001/002/Rp0036 15 Rev F01
Figure 12: Flow, TP, and MRP (ind) at B061002
Weekly grab sampling was undertaken at both the auto-sampler site and upstream of the development works for the May/August period to obtain information on the constituents of the water before the river passes through the developed area and the results of this grab sampling are shown in Table 7. A considerable difference can be seen in the upstream and downstream results for TP, SS and MRP concentrations, all being greater at the downstream site. The grab samples of TON concentrations are similar in both the upstream and downstream sites, and similar to the downstream auto sampler results.
From these results it would seem that the development works are having an influence on the phosphorus and suspended solids concentrations in the water, but are having little or no effect on the concentrations of TON.
Table 7 – Grab Sampling Results Taken Upstream and Downstream of Developing Area May/August 2001
Period SS Solids (mg/l)
TON (mgN/l)
TP(mgP/l)
MRP (indicative-only (mgP/l)
Grab d/s Average 24.9 1.304 0.061 0.033
Grab d/s Median 10.5 1.236 0.035 0.015
Grab d/s Minimum 5.3 0.646 0.020 0.010
Grab d/s Maximum 111.0 2.352 0.209 0.129
Grab u/s Average 9.4 1.635 0.028 0.010
Grab u/s Median 5.5 1.643 0.021 0.009
Grab u/s Minimum 3.8 0.895 0.012 0.002
Grab u/s Maximum 29.0 2.152 0.070 0.030
For
insp
ectio
n pur
pose
s only
.
Conse
nt of
copy
right
owne
r req
uired
for a
ny ot
her u
se.
EPA Export 26-07-2013:01:29:45
Three Rivers Project Final Report
MCOS/192/001/002/Rp0036 16 Rev F01
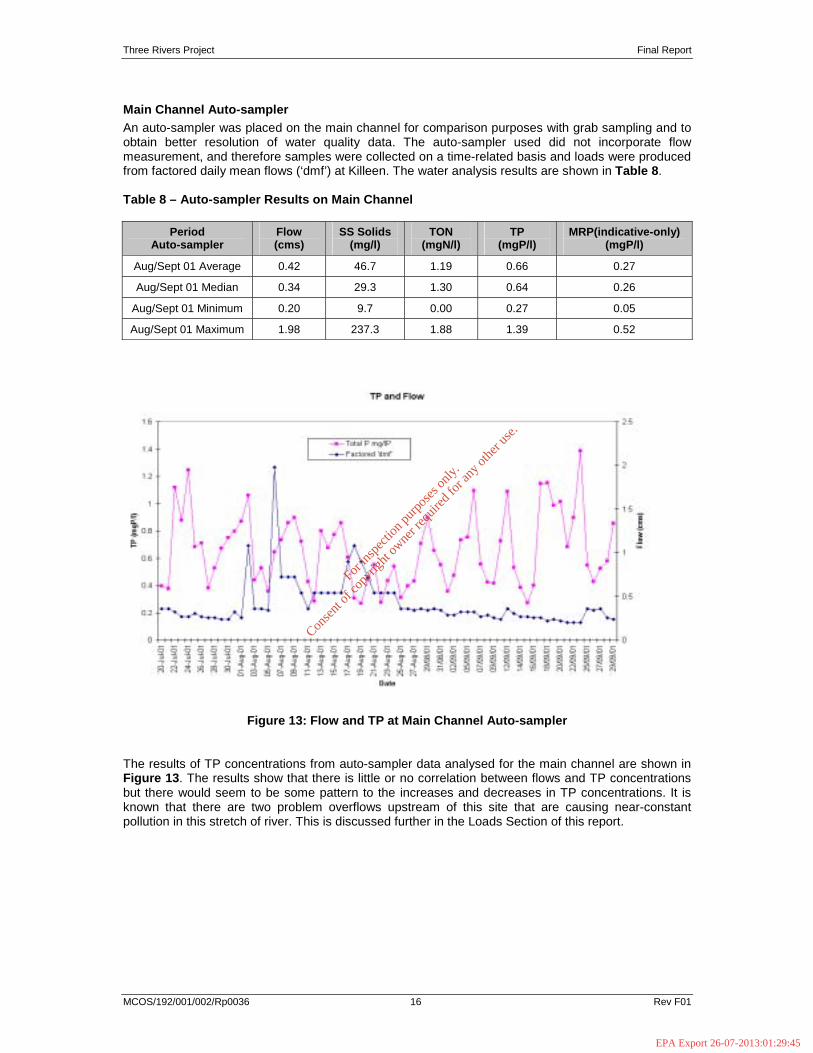
Main Channel Auto-sampler
An auto-sampler was placed on the main channel for comparison purposes with grab sampling and to obtain better resolution of water quality data. The auto-sampler used did not incorporate flow measurement, and therefore samples were collected on a time-related basis and loads were produced from factored daily mean flows (‘dmf’) at Killeen. The water analysis results are shown in Table 8.
Table 8 – Auto-sampler Results on Main Channel
PeriodAuto-sampler
Flow (cms)
SS Solids (mg/l)
TON (mgN/l)
TP(mgP/l)
MRP(indicative-only) (mgP/l)
Aug/Sept 01 Average 0.42 46.7 1.19 0.66 0.27
Aug/Sept 01 Median 0.34 29.3 1.30 0.64 0.26
Aug/Sept 01 Minimum 0.20 9.7 0.00 0.27 0.05
Aug/Sept 01 Maximum 1.98 237.3 1.88 1.39 0.52
Figure 13: Flow and TP at Main Channel Auto-sampler
The results of TP concentrations from auto-sampler data analysed for the main channel are shown in Figure 13. The results show that there is little or no correlation between flows and TP concentrations but there would seem to be some pattern to the increases and decreases in TP concentrations. It is known that there are two problem overflows upstream of this site that are causing near-constant pollution in this stretch of river. This is discussed further in the Loads Section of this report.
For
insp
ectio
n pur
pose
s only
.
Conse
nt of
copy
right
owne
r req
uired
for a
ny ot
her u
se.
EPA Export 26-07-2013:01:29:45
Three Rivers Project Final Report
MCOS/192/001/002/Rp0036 17 Rev F01
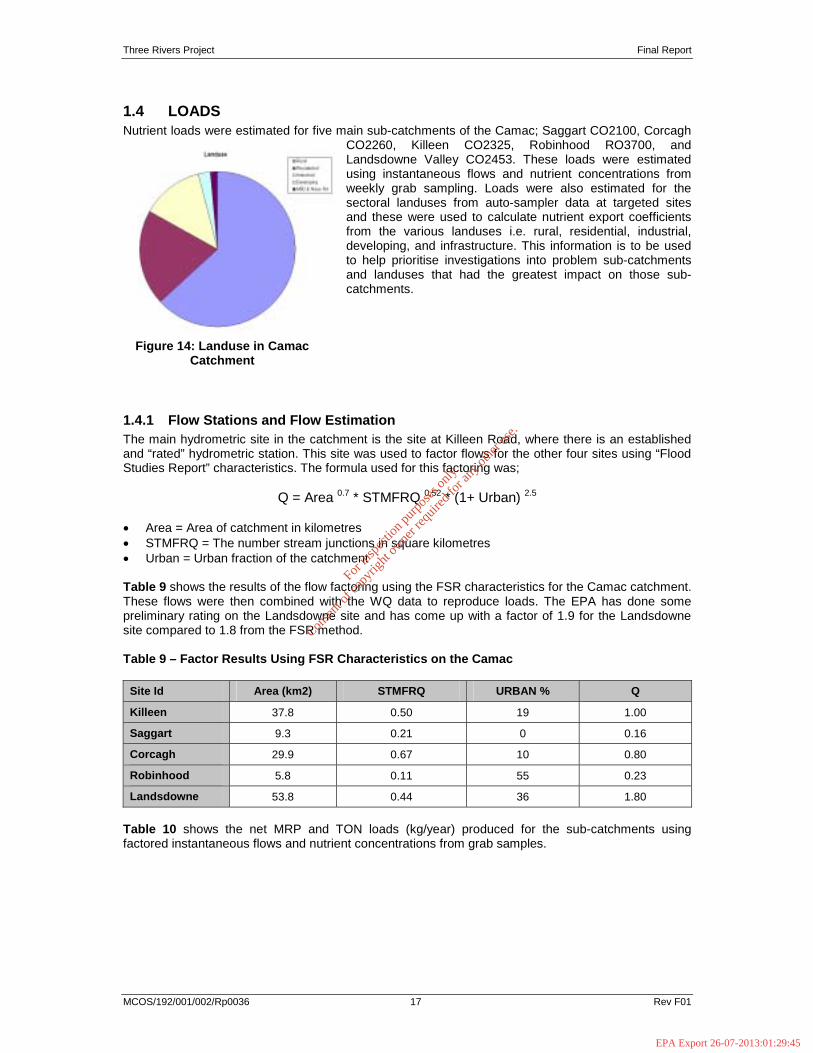
1.4 LOADS Nutrient loads were estimated for five main sub-catchments of the Camac; Saggart CO2100, Corcagh
CO2260, Killeen CO2325, Robinhood RO3700, and Landsdowne Valley CO2453. These loads were estimated using instantaneous flows and nutrient concentrations from weekly grab sampling. Loads were also estimated for the sectoral landuses from auto-sampler data at targeted sites and these were used to calculate nutrient export coefficients from the various landuses i.e. rural, residential, industrial, developing, and infrastructure. This information is to be used to help prioritise investigations into problem sub-catchments and landuses that had the greatest impact on those sub-catchments.
1.4.1 Flow Stations and Flow Estimation The main hydrometric site in the catchment is the site at Killeen Road, where there is an established and “rated” hydrometric station. This site was used to factor flows for the other four sites using “Flood Studies Report” characteristics. The formula used for this factoring was;
Q = Area 0.7 * STMFRQ 0.52 * (1+ Urban) 2.5
�� Area = Area of catchment in kilometres �� STMFRQ = The number stream junctions in square kilometres �� Urban = Urban fraction of the catchment
Table 9 shows the results of the flow factoring using the FSR characteristics for the Camac catchment. These flows were then combined with the WQ data to reproduce loads. The EPA has done some preliminary rating on the Landsdowne site and has come up with a factor of 1.9 for the Landsdowne site compared to 1.8 from the FSR method.
Table 9 – Factor Results Using FSR Characteristics on the Camac
Site Id Area (km2) STMFRQ URBAN % Q
Killeen 37.8 0.50 19 1.00
Saggart 9.3 0.21 0 0.16
Corcagh 29.9 0.67 10 0.80
Robinhood 5.8 0.11 55 0.23
Landsdowne 53.8 0.44 36 1.80
Table 10 shows the net MRP and TON loads (kg/year) produced for the sub-catchments using factored instantaneous flows and nutrient concentrations from grab samples.
Figure 14: Landuse in Camac Catchment
For
insp
ectio
n pur
pose
s only
.
Conse
nt of
copy
right
owne
r req
uired
for a
ny ot
her u
se.
EPA Export 26-07-2013:01:29:45

Three Rivers Project Final Report
MCOS/192/001/002/Rp0036 18 Rev F01
Table 10 – Net MRP and TON loads for Sub-catchments
Loads Saggart Corcagh Killeen Robinhood Landsdowne Total
Net MRP (kg/yr) 51 2661 238 308 1976 5234
Net TON (kg/yr) 4254 35103 6167 9758 23337 78619
1.4.2 Auto-sampler Loads A fundamental element of the Camac study was the establishment of coefficients for sectoral loads. These coefficients were developed by target monitoring the various landuse sectors using auto-samplers.
The auto-samplers were placed at specific sites to monitor the affects of urbanisation at high and low flow regimes and the data from these auto-samplers was used to establish load coefficients for the various sectors that may be affecting the Camac. As the auto-samplers were in place for typically 4 months, the loads calculated for that period needed to be converted to an annual load. The strongest method involves relating the flows at the auto-sampler site to the overall flows in the Camac system during the period, and then relating the Camac flows during the period to the yearly flow. This method is particularly appropriate to Irish conditions, as whilst monthly flows/rainfall tend to vary considerably, yearly flows/rainfall tend to remain relatively constant. Furthermore, the yearly rainfall during the study period and the average annual rainfall are presented to allow sectoral loads to be adjusted for rainfall amounts where used in future studies/assessments. For example, Table 11 shows the flows for the Robinhood auto-sampler and the flows in the Camac (at Killeen Rd). During the auto-sampler’s monitoring period, 21% of the annual flow passed Killeen Rd on the Camac. Thus, the auto-sampler load for the 4 months is taken as 21% of the annual load and factored as such.
Table 11 – Flow Factoring for Robinhood AS
Flow Periods Flow (m3) at Killeen Road Rainfall (mm)
August 2000 – July 2001 16196544 947
Robinhood AS Aug/Sept 2000 1229471 182
Robinhood AS Mar/Apr 2001 2272320 123
Flow for total AS period 3114720 305
Percentage of 12 month flow 21% 32%
Factor 0.21 -
The yearly loads produced for the catchments monitored by the auto-samplers are shown in Table 12.The Clondalkin and M50 auto-sampler sites were the only sites that had only one sector affecting their sub-catchments and therefore the coefficients for the residential and infrastructural sectors were established from the Clondalkin and M50 auto-sampler data. Coefficients for the rural sector have been averaged from flow and nutrient data from the Saggart sub-catchment. The coefficients for the industrial sector were obtained from the Robinhood catchment (after the residential and rural contributions were deducted from the total load for this sub-catchment). A similar exercise was carried out to obtain loads from the developing site. The sectoral areas for each of these auto-sampler sub-catchments are shown in Table 13 and the sectoral coefficients are shown in Table 14.
Table 12 – Yearly Loads for AS Catchments and Area Unit Loads for AS catchments
Auto-samplers (Area)
TP (kg)
TP(kg/yr/ha)
MRP (kg)
MRP (kg/yr/ha)
TON (kg)
TON (kg/yr/ha)
Robinhood (580 ha) 753 1.30 305.0 0.53 9758 16.8
Clondalkin (62 ha) 44.4 0.72 17.4 0.28 212 3.4
M50 (9.35 ha) 87 9.30 8.4 0.90 72 7.7
Developing (240 ha) 136 0.57 27.9 0.12 1107 4.6
For
insp
ectio
n pur
pose
s only
.
Conse
nt of
copy
right
owne
r req
uired
for a
ny ot
her u
se.
EPA Export 26-07-2013:01:29:45
Three Rivers Project Final Report
MCOS/192/001/002/Rp0036 19 Rev F01
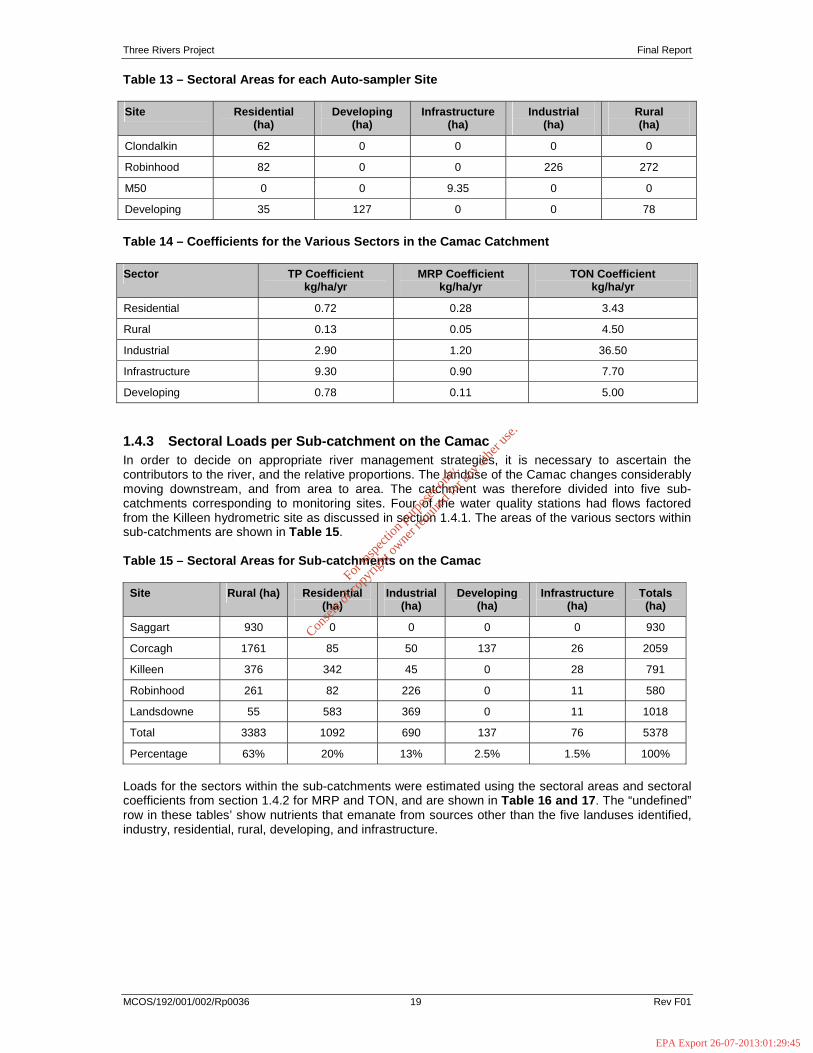
Table 13 – Sectoral Areas for each Auto-sampler Site
Site Residential (ha)
Developing (ha)
Infrastructure(ha)
Industrial(ha)
Rural (ha)
Clondalkin 62 0 0 0 0
Robinhood 82 0 0 226 272
M50 0 0 9.35 0 0
Developing 35 127 0 0 78
Table 14 – Coefficients for the Various Sectors in the Camac Catchment
Sector TP Coefficient kg/ha/yr
MRP Coefficient kg/ha/yr
TON Coefficient kg/ha/yr
Residential 0.72 0.28 3.43
Rural 0.13 0.05 4.50
Industrial 2.90 1.20 36.50
Infrastructure 9.30 0.90 7.70
Developing 0.78 0.11 5.00
1.4.3 Sectoral Loads per Sub-catchment on the Camac In order to decide on appropriate river management strategies, it is necessary to ascertain the contributors to the river, and the relative proportions. The landuse of the Camac changes considerably moving downstream, and from area to area. The catchment was therefore divided into five sub-catchments corresponding to monitoring sites. Four of the water quality stations had flows factored from the Killeen hydrometric site as discussed in section 1.4.1. The areas of the various sectors within sub-catchments are shown in Table 15.
Table 15 – Sectoral Areas for Sub-catchments on the Camac
Site Rural (ha) Residential (ha)
Industrial (ha)
Developing (ha)
Infrastructure (ha)
Totals(ha)
Saggart 930 0 0 0 0 930
Corcagh 1761 85 50 137 26 2059
Killeen 376 342 45 0 28 791
Robinhood 261 82 226 0 11 580
Landsdowne 55 583 369 0 11 1018
Total 3383 1092 690 137 76 5378
Percentage 63% 20% 13% 2.5% 1.5% 100%
Loads for the sectors within the sub-catchments were estimated using the sectoral areas and sectoral coefficients from section 1.4.2 for MRP and TON, and are shown in Table 16 and 17. The “undefined” row in these tables’ show nutrients that emanate from sources other than the five landuses identified, industry, residential, rural, developing, and infrastructure.
For
insp
ectio
n pur
pose
s only
.
Conse
nt of
copy
right
owne
r req
uired
for a
ny ot
her u
se.
EPA Export 26-07-2013:01:29:45
Three Rivers Project Final Report
MCOS/192/001/002/Rp0036 20 Rev F01
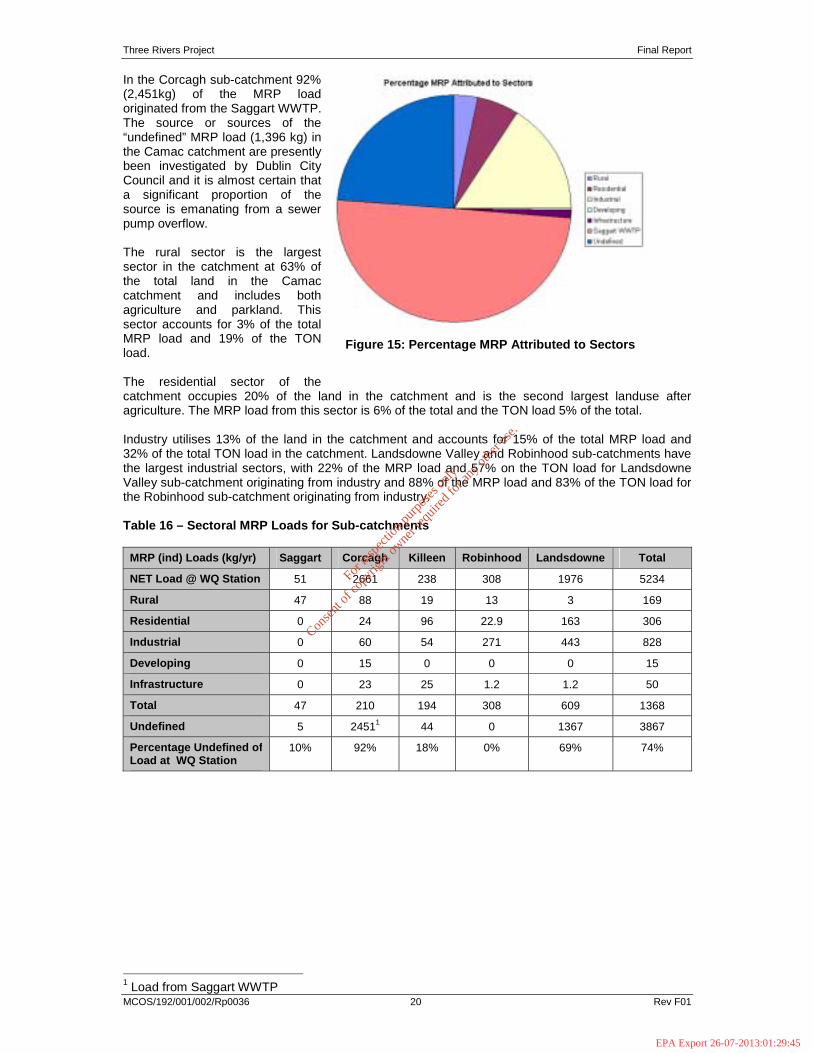
In the Corcagh sub-catchment 92% (2,451kg) of the MRP load originated from the Saggart WWTP. The source or sources of the “undefined” MRP load (1,396 kg) in the Camac catchment are presently been investigated by Dublin City Council and it is almost certain that a significant proportion of the source is emanating from a sewer pump overflow.
The rural sector is the largest sector in the catchment at 63% of the total land in the Camac catchment and includes both agriculture and parkland. This sector accounts for 3% of the total MRP load and 19% of the TON load.
The residential sector of the catchment occupies 20% of the land in the catchment and is the second largest landuse after agriculture. The MRP load from this sector is 6% of the total and the TON load 5% of the total.
Industry utilises 13% of the land in the catchment and accounts for 15% of the total MRP load and 32% of the total TON load in the catchment. Landsdowne Valley and Robinhood sub-catchments have the largest industrial sectors, with 22% of the MRP load and 57% on the TON load for Landsdowne Valley sub-catchment originating from industry and 88% of the MRP load and 83% of the TON load for the Robinhood sub-catchment originating from industry.
Table 16 – Sectoral MRP Loads for Sub-catchments
MRP (ind) Loads (kg/yr) Saggart Corcagh Killeen Robinhood Landsdowne Total
NET Load @ WQ Station 51 2661 238 308 1976 5234
Rural 47 88 19 13 3 169
Residential 0 24 96 22.9 163 306
Industrial 0 60 54 271 443 828
Developing 0 15 0 0 0 15
Infrastructure 0 23 25 1.2 1.2 50
Total 47 210 194 308 609 1368
Undefined 5 24511 44 0 1367 3867
Percentage Undefined of Load at WQ Station
10% 92% 18% 0% 69% 74%
1 Load from Saggart WWTP
Figure 15: Percentage MRP Attributed to Sectors
For
insp
ectio
n pur
pose
s only
.
Conse
nt of
copy
right
owne
r req
uired
for a
ny ot
her u
se.
EPA Export 26-07-2013:01:29:45
Three Rivers Project Final Report
MCOS/192/001/002/Rp0036 21 Rev F01
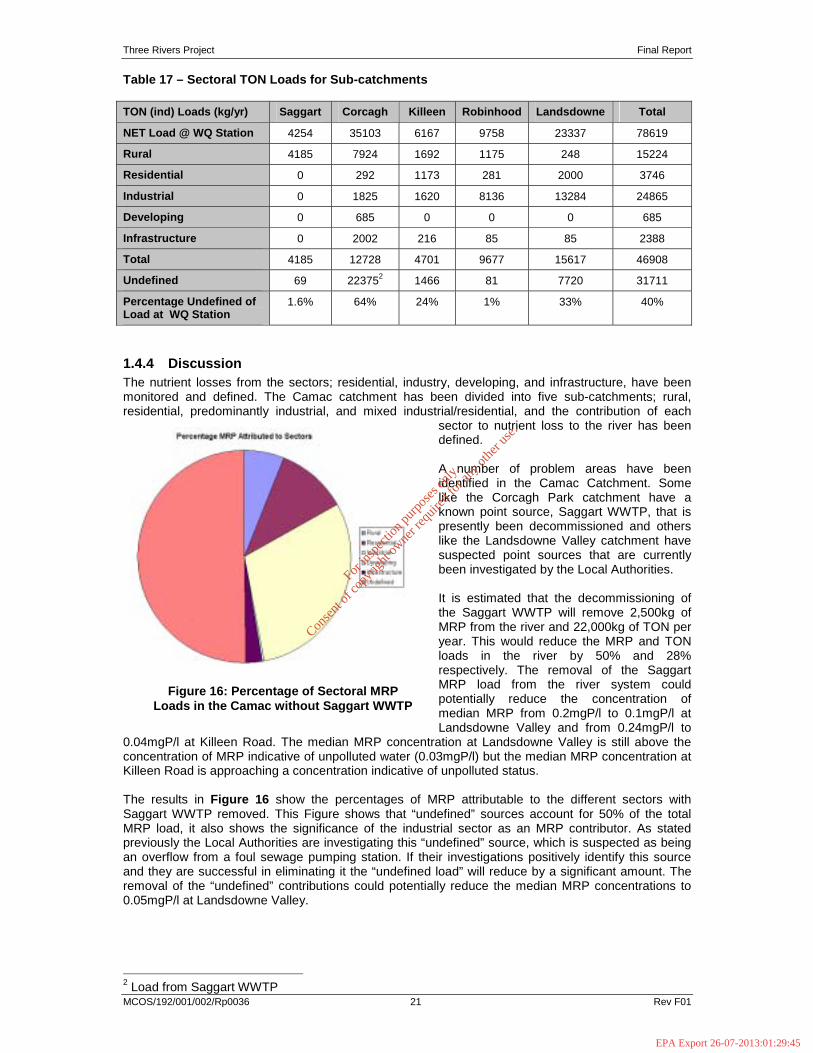
Table 17 – Sectoral TON Loads for Sub-catchments
TON (ind) Loads (kg/yr) Saggart Corcagh Killeen Robinhood Landsdowne Total
NET Load @ WQ Station 4254 35103 6167 9758 23337 78619
Rural 4185 7924 1692 1175 248 15224
Residential 0 292 1173 281 2000 3746
Industrial 0 1825 1620 8136 13284 24865
Developing 0 685 0 0 0 685
Infrastructure 0 2002 216 85 85 2388
Total 4185 12728 4701 9677 15617 46908
Undefined 69 223752 1466 81 7720 31711
Percentage Undefined of Load at WQ Station
1.6% 64% 24% 1% 33% 40%
1.4.4 Discussion The nutrient losses from the sectors; residential, industry, developing, and infrastructure, have been monitored and defined. The Camac catchment has been divided into five sub-catchments; rural, residential, predominantly industrial, and mixed industrial/residential, and the contribution of each
sector to nutrient loss to the river has been defined.
A number of problem areas have been identified in the Camac Catchment. Some like the Corcagh Park catchment have a known point source, Saggart WWTP, that is presently been decommissioned and others like the Landsdowne Valley catchment have suspected point sources that are currently been investigated by the Local Authorities.
It is estimated that the decommissioning of the Saggart WWTP will remove 2,500kg of MRP from the river and 22,000kg of TON per year. This would reduce the MRP and TON loads in the river by 50% and 28% respectively. The removal of the Saggart MRP load from the river system could potentially reduce the concentration of median MRP from 0.2mgP/l to 0.1mgP/l at Landsdowne Valley and from 0.24mgP/l to
0.04mgP/l at Killeen Road. The median MRP concentration at Landsdowne Valley is still above the concentration of MRP indicative of unpolluted water (0.03mgP/l) but the median MRP concentration at Killeen Road is approaching a concentration indicative of unpolluted status.
The results in Figure 16 show the percentages of MRP attributable to the different sectors with Saggart WWTP removed. This Figure shows that “undefined” sources account for 50% of the total MRP load, it also shows the significance of the industrial sector as an MRP contributor. As stated previously the Local Authorities are investigating this “undefined” source, which is suspected as being an overflow from a foul sewage pumping station. If their investigations positively identify this source and they are successful in eliminating it the “undefined load” will reduce by a significant amount. The removal of the “undefined” contributions could potentially reduce the median MRP concentrations to 0.05mgP/l at Landsdowne Valley.
2 Load from Saggart WWTP
Figure 16: Percentage of Sectoral MRP Loads in the Camac without Saggart WWTP
For
insp
ectio
n pur
pose
s only
.
Conse
nt of
copy
right
owne
r req
uired
for a
ny ot
her u
se.
EPA Export 26-07-2013:01:29:45
Three Rivers Project Final Report
MCOS/192/001/002/Rp0036 22 Rev F01
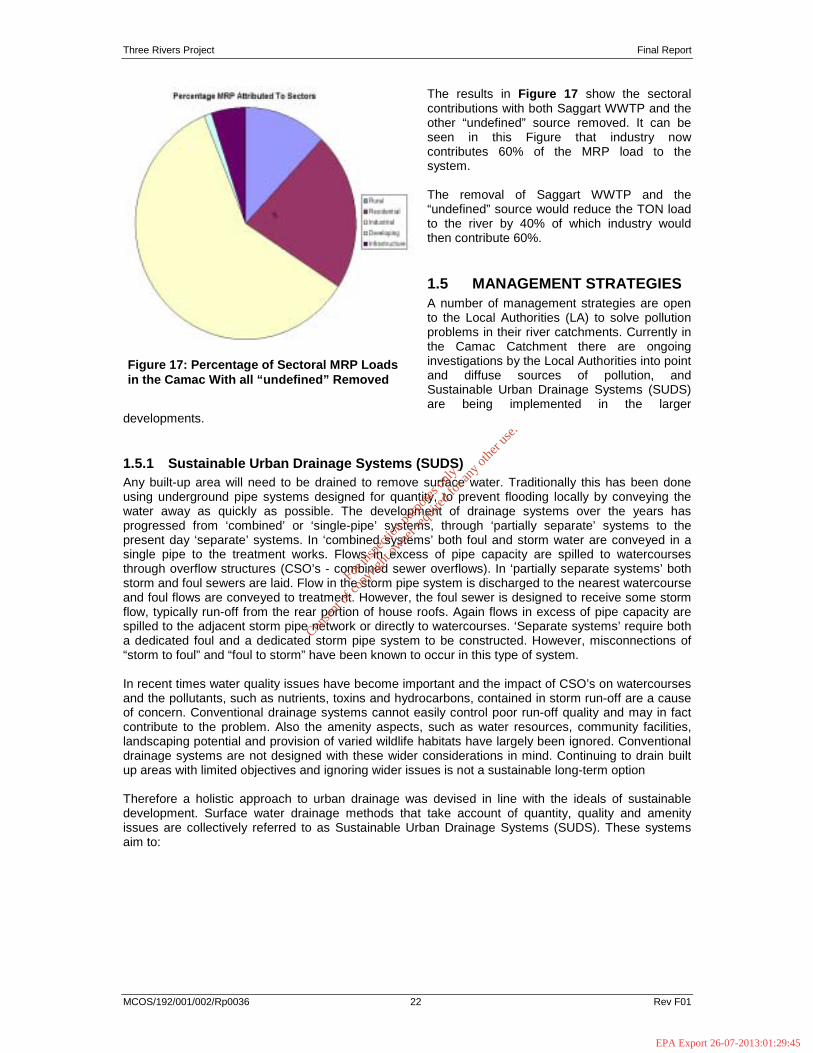
The results in Figure 17 show the sectoral contributions with both Saggart WWTP and the other “undefined” source removed. It can be seen in this Figure that industry now contributes 60% of the MRP load to the system.
The removal of Saggart WWTP and the “undefined” source would reduce the TON load to the river by 40% of which industry would then contribute 60%.
1.5 MANAGEMENT STRATEGIES A number of management strategies are open to the Local Authorities (LA) to solve pollution problems in their river catchments. Currently in the Camac Catchment there are ongoing investigations by the Local Authorities into point and diffuse sources of pollution, and Sustainable Urban Drainage Systems (SUDS) are being implemented in the larger
developments.
1.5.1 Sustainable Urban Drainage Systems (SUDS) Any built-up area will need to be drained to remove surface water. Traditionally this has been done using underground pipe systems designed for quantity, to prevent flooding locally by conveying the water away as quickly as possible. The development of drainage systems over the years has progressed from ‘combined’ or ‘single-pipe’ systems, through ‘partially separate’ systems to the present day ‘separate’ systems. In ‘combined systems’ both foul and storm water are conveyed in a single pipe to the treatment works. Flows in excess of pipe capacity are spilled to watercourses through overflow structures (CSO’s - combined sewer overflows). In ‘partially separate systems’ both storm and foul sewers are laid. Flow in the storm pipe system is discharged to the nearest watercourse and foul flows are conveyed to treatment. However, the foul sewer is designed to receive some storm flow, typically run-off from the rear portion of house roofs. Again flows in excess of pipe capacity are spilled to the adjacent storm pipe network or directly to watercourses. ‘Separate systems’ require both a dedicated foul and a dedicated storm pipe system to be constructed. However, misconnections of “storm to foul” and “foul to storm” have been known to occur in this type of system.
In recent times water quality issues have become important and the impact of CSO’s on watercourses and the pollutants, such as nutrients, toxins and hydrocarbons, contained in storm run-off are a cause of concern. Conventional drainage systems cannot easily control poor run-off quality and may in fact contribute to the problem. Also the amenity aspects, such as water resources, community facilities, landscaping potential and provision of varied wildlife habitats have largely been ignored. Conventional drainage systems are not designed with these wider considerations in mind. Continuing to drain built up areas with limited objectives and ignoring wider issues is not a sustainable long-term option
Therefore a holistic approach to urban drainage was devised in line with the ideals of sustainable development. Surface water drainage methods that take account of quantity, quality and amenity issues are collectively referred to as Sustainable Urban Drainage Systems (SUDS). These systems aim to:
Figure 17: Percentage of Sectoral MRP Loads in the Camac With all “undefined” Removed
For
insp
ectio
n pur
pose
s only
.
Conse
nt of
copy
right
owne
r req
uired
for a
ny ot
her u
se.
EPA Export 26-07-2013:01:29:45
Three Rivers Project Final Report
MCOS/192/001/002/Rp0036 23 Rev F01
– to manage run-off flow rates, reducing the impact of urbanization on flooding, – to protect or enhance water quality, – are sympathetic to the environmental setting and the needs of the local community – to provide habitat for wildlife in urban watercourses, and – to encourage groundwater recharge (where appropriate)
They do this by:
– Dealing with run-off close to where the rain falls – Managing potential pollution at its source, now and in the future – Protecting water resources from point pollution (such as accidental spills) and diffuse sources.
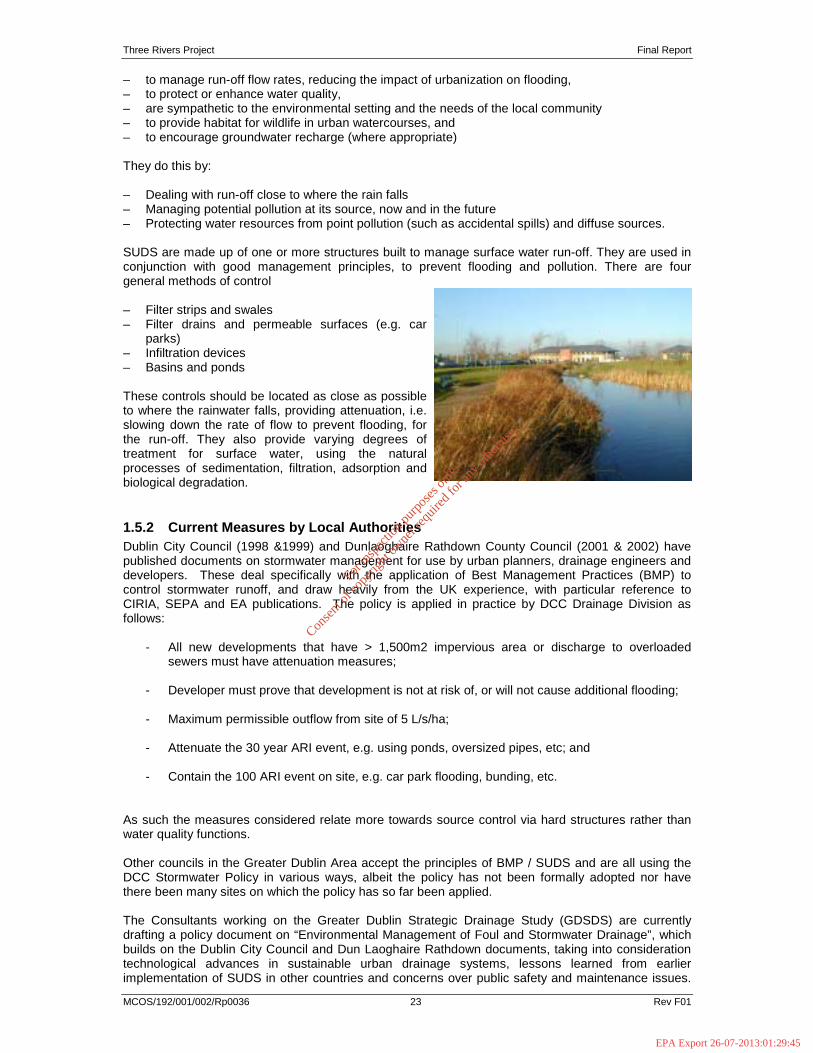
SUDS are made up of one or more structures built to manage surface water run-off. They are used in conjunction with good management principles, to prevent flooding and pollution. There are four general methods of control
– Filter strips and swales – Filter drains and permeable surfaces (e.g. car
parks) – Infiltration devices – Basins and ponds
These controls should be located as close as possible to where the rainwater falls, providing attenuation, i.e. slowing down the rate of flow to prevent flooding, for the run-off. They also provide varying degrees of treatment for surface water, using the natural processes of sedimentation, filtration, adsorption and biological degradation.
1.5.2 Current Measures by Local Authorities Dublin City Council (1998 &1999) and Dunlaoghaire Rathdown County Council (2001 & 2002) have published documents on stormwater management for use by urban planners, drainage engineers and developers. These deal specifically with the application of Best Management Practices (BMP) to control stormwater runoff, and draw heavily from the UK experience, with particular reference to CIRIA, SEPA and EA publications. The policy is applied in practice by DCC Drainage Division as follows:
- All new developments that have > 1,500m2 impervious area or discharge to overloaded sewers must have attenuation measures;
- Developer must prove that development is not at risk of, or will not cause additional flooding;
- Maximum permissible outflow from site of 5 L/s/ha;
- Attenuate the 30 year ARI event, e.g. using ponds, oversized pipes, etc; and
- Contain the 100 ARI event on site, e.g. car park flooding, bunding, etc.
As such the measures considered relate more towards source control via hard structures rather than water quality functions.
Other councils in the Greater Dublin Area accept the principles of BMP / SUDS and are all using the DCC Stormwater Policy in various ways, albeit the policy has not been formally adopted nor have there been many sites on which the policy has so far been applied.
The Consultants working on the Greater Dublin Strategic Drainage Study (GDSDS) are currently drafting a policy document on “Environmental Management of Foul and Stormwater Drainage”, which builds on the Dublin City Council and Dun Laoghaire Rathdown documents, taking into consideration technological advances in sustainable urban drainage systems, lessons learned from earlier implementation of SUDS in other countries and concerns over public safety and maintenance issues.
For
insp
ectio
n pur
pose
s only
.
Conse
nt of
copy
right
owne
r req
uired
for a
ny ot
her u
se.
EPA Export 26-07-2013:01:29:45
Three Rivers Project Final Report
MCOS/192/001/002/Rp0036 24 Rev F01
It is hoped that the policies contained in this document will be implemented on a regional basis in the Greater Dublin Area.
In other areas Local Authorities are currently upgrading many of the municipal wastewater treatment works (MMWTP) either with EU Cohesion Funding or as part of the National Development Plan. In the Camac catchment, Saggart MWWTP has been decommissioned this year, with the effluent now pumped to the Clondalkin drainage network and ultimately to Ringsend for treatment. Newcastle MWWTP should also be decommissioned later this year.` As these major point sources are cleaned up attention will begin to focus on the drainage network and the numerous overflows, many operating after very small rainfall events, which contribute unknown loads to the river systems. It is essential that all sewage overflows be properly identified and an understanding of their operational regime be developed so that limited resources can be efficiently and effectively targeted. Dublin City Council is presently investigating a source affecting the Camac between Killeen Road and Landsdowne Valley and appropriate measures will be introduced to alleviate the problem once investigations are complete.
Both Dublin City Council and South Dublin County Council are investigating mis-connections from households but have yet to target houses in the Camac Catchment. Surveys in other areas by Dublin City Council and South Dublin County Council (SDCC) have revealed that 6 - 20% of the houses investigated have mis-connections. Both Local Authorities have had significant success in persuading households to reconnect dishwashers, washing machines, etc. to the appropriate foul system.
1.5.3 The Future The future scenario revolves around the successful implementation on a regional basis of an integrated multi – disciplinary approach towards urban run-off management spearheaded by the development and use of sustainable urban drainage systems. In tandem with SUDS an adequately resourced programme dealing with the shortcomings of the existing drainage networks should be established. Such a programme to consider:
- Investigation and rectification of all misconnections to both the foul and storm drainage networks;
- Identification of all sewage overflows, understanding of their operation to be developed and a plan for their remediation to be put in place;
- Review of all licensed discharges to watercourses (Section 4 and IPC)
- Identification of any unlicensed discharge to storm sewer systems and watercourses and appropriate remediation measures put in place.
and to identify short, medium and long term goals.
The Camac forms part of the Eastern River Basin District (RBD), which has been established by the Department of the Environment and Local Government as part of the implementation of the Water Framework Directive (WFD). The WFD provides the option of supplementing the strategic RBD Management Plans with sub-basin plans. Sub-basin planning deals with particular aspects of water management either at a smaller geographical scale or in respect of a particular issue, and could play a key role in securing participation at a local level. The water quality monitoring system developed for the Camac under the Three Rivers Project and ongoing work in the Camac Catchment as part of the Greater Dublin Strategic Drainage Study could form a foundation for a future catchment management plan, which in turn can inform the Eastern RBD project.
1.5.4 Recommendations These recommendations have been classified into three time frames, short, medium, and long term. The short-term recommendations could conceivably be achieved in 0 to 2 years, the medium term from 2 to 5 years and the long term from 5 to 10 years. The LAs have already implemented some of these methodologies for the alleviation of flooding and pollution control but due to financial and resource constraints presently experienced by the LAs these time frames may be difficult to achieve.
For
insp
ectio
n pur
pose
s only
.
Conse
nt of
copy
right
owne
r req
uired
for a
ny ot
her u
se.
EPA Export 26-07-2013:01:29:45
Three Rivers Project Final Report
MCOS/192/001/002/Rp0036 25 Rev F01
Therefore the first recommendation by the Project would be to increase budgetary allowances to ensure the implementation of these recommendations within these time frames.
Short Term
�� Investigation and rectification of all mis-connections. This recommendation should be an on going procedure and therefore would be included in all time frames, short, medium and long.
�� Introduction of SUDS methodologies that alleviate flooding and elevated nutrient concentrations into all present and future developments.
�� Audit monitoring of licensed premises (Section 4 and 16 licences) to ensure that the licensing requirements are being adhered to.
Medium Term
�� Investigation and rectification of all foul sewer mis-connections.
Long Term
�� Investigation and rectification of all foul sewer mis-connections�� Where possible retro installation of SUDS methodologies into developed areas. This would
primarily occur through new development of established areas. It is not currently considered necessary or economically feasible to convert existing drainage to SUDS systems in developed areas of the catchment. However, this may need to be reviewed in the long-term.
Again, it must be emphasised that the implementation of SUDS must move away from ‘flooding only’ solutions such as oversized pipes and towards flooding and nutrient abatement solutions such as attenuation ponds, swale drains and permeable hard standing. Hydrocarbon separators are also a key component of SUDS and are vital to protect both surface and ground waters.
For
insp
ectio
n pur
pose
s only
.
Conse
nt of
copy
right
owne
r req
uired
for a
ny ot
her u
se.
EPA Export 26-07-2013:01:29:45