
3 q14 results presentation vfinal (2)
16
Third Quarter 2014 Results NOVEMBER 5, 2014
-
Upload
approachresources -
Category
Investor Relations
-
view
5.659 -
download
2
Transcript of 3 q14 results presentation vfinal (2)
Third Quarter 2014 Results NOVEMBER 5, 2014
Forward-looking statements
2
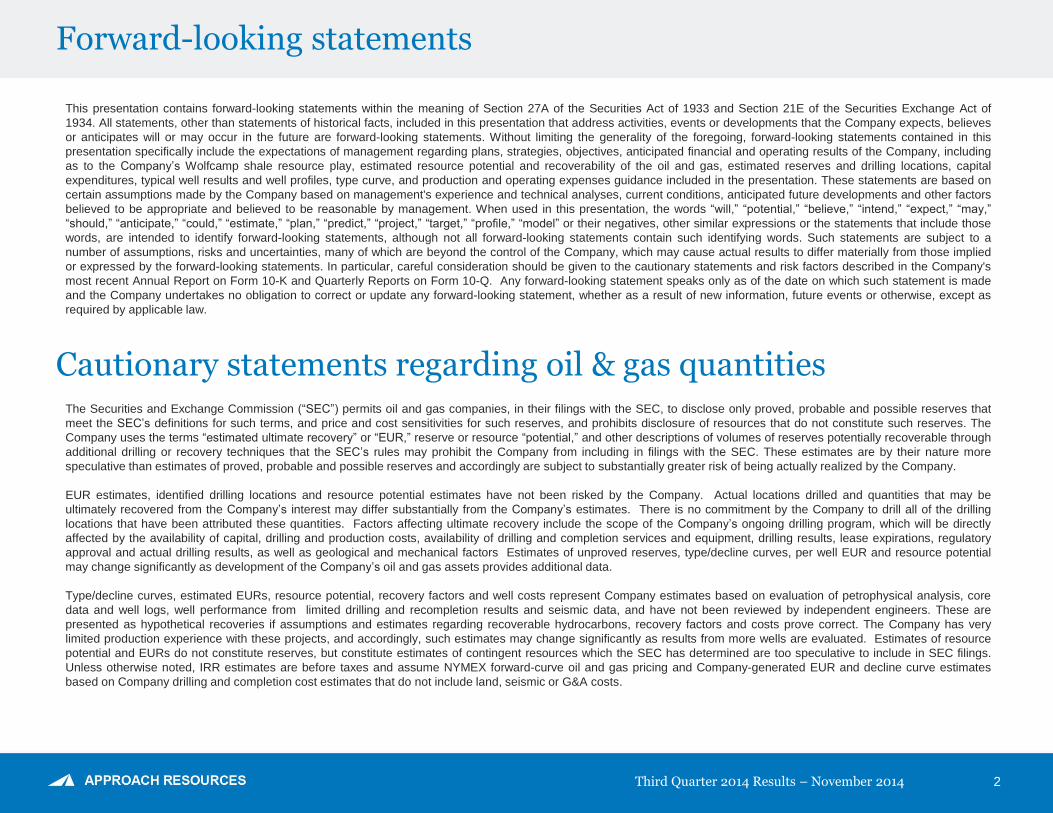
This presentation contains forward-looking statements within the meaning of Section 27A of the Securities Act of 1933 and Section 21E of the Securities Exchange Act of
1934. All statements, other than statements of historical facts, included in this presentation that address activities, events or developments that the Company expects, believes
or anticipates will or may occur in the future are forward-looking statements. Without limiting the generality of the foregoing, forward-looking statements contained in this
presentation specifically include the expectations of management regarding plans, strategies, objectives, anticipated financial and operating results of the Company, including
as to the Company’s Wolfcamp shale resource play, estimated resource potential and recoverability of the oil and gas, estimated reserves and drilling locations, capital
expenditures, typical well results and well profiles, type curve, and production and operating expenses guidance included in the presentation. These statements are based on
certain assumptions made by the Company based on management's experience and technical analyses, current conditions, anticipated future developments and other factors
believed to be appropriate and believed to be reasonable by management. When used in this presentation, the words “will,” “potential,” “believe,” “intend,” “expect,” “may,”
“should,” “anticipate,” “could,” “estimate,” “plan,” “predict,” “project,” “target,” “profile,” “model” or their negatives, other similar expressions or the statements that include those
words, are intended to identify forward-looking statements, although not all forward-looking statements contain such identifying words. Such statements are subject to a
number of assumptions, risks and uncertainties, many of which are beyond the control of the Company, which may cause actual results to differ materially from those implied
or expressed by the forward-looking statements. In particular, careful consideration should be given to the cautionary statements and risk factors described in the Company's
most recent Annual Report on Form 10-K and Quarterly Reports on Form 10-Q. Any forward-looking statement speaks only as of the date on which such statement is made
and the Company undertakes no obligation to correct or update any forward-looking statement, whether as a result of new information, future events or otherwise, except as
required by applicable law.
The Securities and Exchange Commission (“SEC”) permits oil and gas companies, in their filings with the SEC, to disclose only proved, probable and possible reserves that
meet the SEC’s definitions for such terms, and price and cost sensitivities for such reserves, and prohibits disclosure of resources that do not constitute such reserves. The
Company uses the terms “estimated ultimate recovery” or “EUR,” reserve or resource “potential,” and other descriptions of volumes of reserves potentially recoverable through
additional drilling or recovery techniques that the SEC’s rules may prohibit the Company from including in filings with the SEC. These estimates are by their nature more
speculative than estimates of proved, probable and possible reserves and accordingly are subject to substantially greater risk of being actually realized by the Company.
EUR estimates, identified drilling locations and resource potential estimates have not been risked by the Company. Actual locations drilled and quantities that may be
ultimately recovered from the Company’s interest may differ substantially from the Company’s estimates. There is no commitment by the Company to drill all of the drilling
locations that have been attributed these quantities. Factors affecting ultimate recovery include the scope of the Company’s ongoing drilling program, which will be directly
affected by the availability of capital, drilling and production costs, availability of drilling and completion services and equipment, drilling results, lease expirations, regulatory
approval and actual drilling results, as well as geological and mechanical factors Estimates of unproved reserves, type/decline curves, per well EUR and resource potential
may change significantly as development of the Company’s oil and gas assets provides additional data.
Type/decline curves, estimated EURs, resource potential, recovery factors and well costs represent Company estimates based on evaluation of petrophysical analysis, core
data and well logs, well performance from limited drilling and recompletion results and seismic data, and have not been reviewed by independent engineers. These are
presented as hypothetical recoveries if assumptions and estimates regarding recoverable hydrocarbons, recovery factors and costs prove correct. The Company has very
limited production experience with these projects, and accordingly, such estimates may change significantly as results from more wells are evaluated. Estimates of resource
potential and EURs do not constitute reserves, but constitute estimates of contingent resources which the SEC has determined are too speculative to include in SEC filings.
Unless otherwise noted, IRR estimates are before taxes and assume NYMEX forward-curve oil and gas pricing and Company-generated EUR and decline curve estimates
based on Company drilling and completion cost estimates that do not include land, seismic or G&A costs.
Cautionary statements regarding oil & gas quantities
Third Quarter 2014 Results – November 2014

Company overview
AREX OVERVIEW ASSET OVERVIEW
Enterprise value $710 MM
High-quality reserve base 115 MMBoe proved reserves
$1.1 BN proved PV-10
99% Permian Basin
Permian core operating area 155,000 gross (136,500 net) acres
~1+ BnBoe gross, unrisked resource potential
~2,000+ Identified HZ drilling locations targeting
Wolfcamp A/B/C
2014 Capital program of $400 MM Running 3 HZ rigs in the Wolfcamp shale play to drill
70 wells during 2014
Notes: Proved reserves and acreage as of 12/31/2013 and 9/30/2014, respectively. All Boe and Mcfe calculations are based on a 6 to 1 conversion ratio. Enterprise value is equal to market
capitalization using the closing share price of $9.44 per share on 11/3/2014, plus net debt as of 9/30/2014. See “PV-10 (unaudited)” slide.
3 Third Quarter 2014 Results – November 2014

3Q14 Key highlights
4
3Q14 HIGHLIGHTS
• Drilled 18 and completed 16 HZ wells
• Maintained best-in-class HZ well costs
• New Elliott well expands Wolfcamp
development eastward
• Increased 3Q14 production 61% YoY to
14.2 MBoe/d
• Delivered seventh consecutive record
quarterly EBITDAX
• Solid financial position further
strengthened by borrowing base increase
3Q14 SUMMARY RESULTS
Production (MBoe/d) 14.2
% Oil 39%
% Total liquids 69%
Average realized price ($/Boe)
Average realized price, excluding commodity derivatives impact $ 52.17
Average realized price, including commodity derivatives impact 51.59
Costs and expenses ($/Boe)
LOE $ 5.87
Production and ad valorem taxes 2.55
Exploration 0.68
General and administrative 5.88
G&A – cash component 4.37
G&A – noncash component 1.51
DD&A 19.88
Third Quarter 2014 Results – November 2014
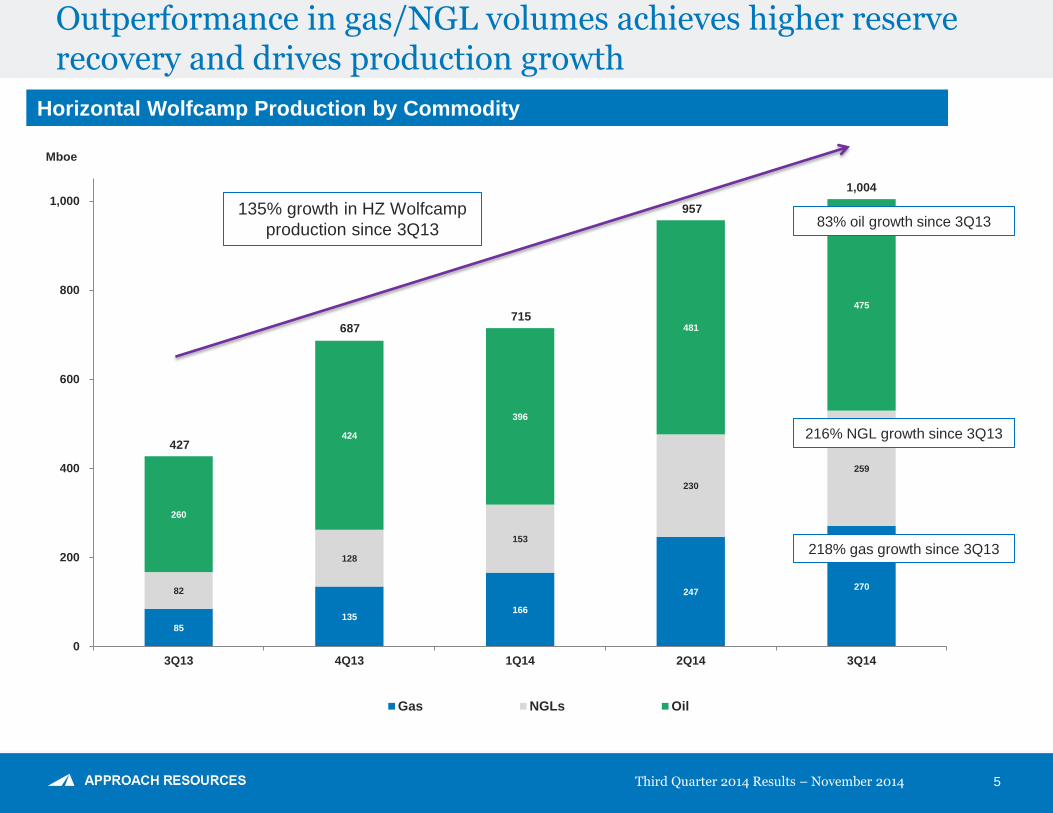
Outperformance in gas/NGL volumes achieves higher reserve recovery and drives production growth
5
85
135 166
247 270 82
128
153
230
259
260
424
396
481
475
0
200
400
600
800
1,000
3Q13 4Q13 1Q14 2Q14 3Q14
Gas NGLs Oil
Horizontal Wolfcamp Production by Commodity
Mboe
83% oil growth since 3Q13 135% growth in HZ Wolfcamp
production since 3Q13
Third Quarter 2014 Results – November 2014
216% NGL growth since 3Q13
218% gas growth since 3Q13
427
687 715
957
1,004

0
100
200
300
400
500
600
700
800
0 90 180 270 360 450 540 630 720 810 900 990 1080 1170
Da
ily P
rod
uc
tio
n (
BO
E in
clu
din
g N
GL
s)
Time (Days)
AREX HZ Wolfcamp Well Performance
6
AREX HZ WOLFCAMP (BOE/D)
Note: Daily production normalized for operational downtime.
Third Quarter 2014 Results – November 2014
Production Data from
AREX A Bench Wells (11)
450 MBoe Type Curve
Wolfcamp Shale Oil
Production Data from
AREX B Bench Wells (74)
Production Data from
AREX C Bench Wells (13)
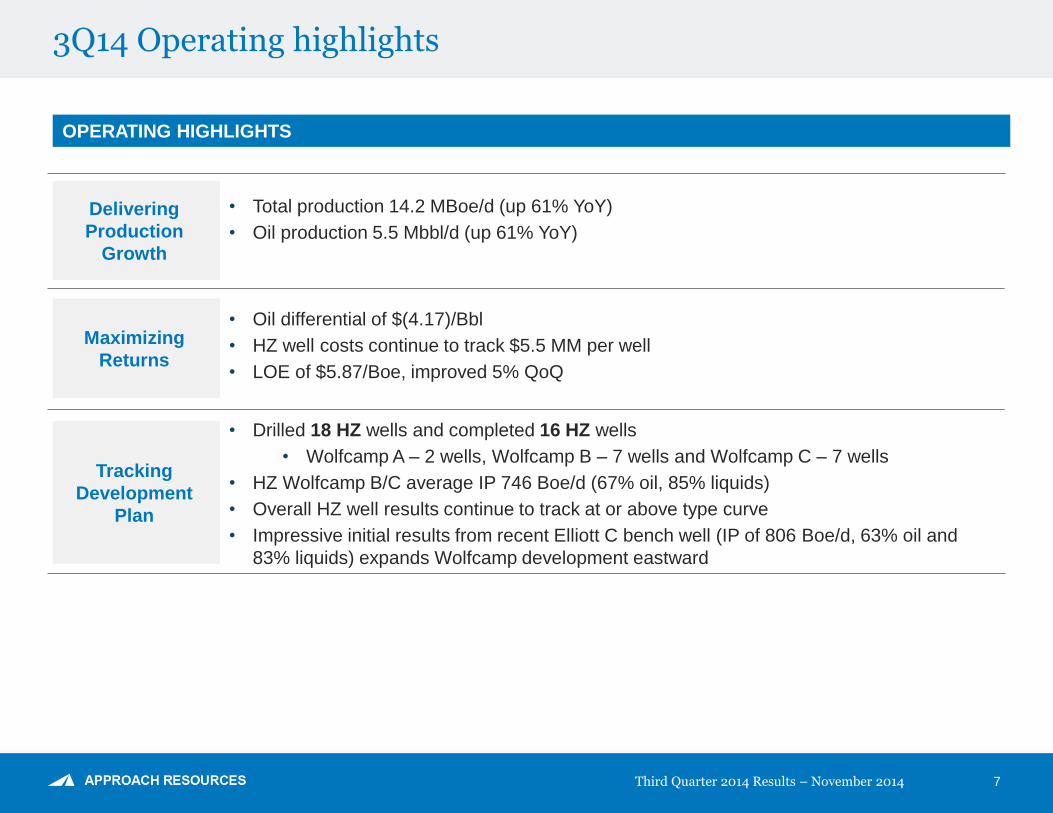
3Q14 Operating highlights
OPERATING HIGHLIGHTS
Maximizing
Returns
• Oil differential of $(4.17)/Bbl
• HZ well costs continue to track $5.5 MM per well
• LOE of $5.87/Boe, improved 5% QoQ
Tracking
Development
Plan
• Drilled 18 HZ wells and completed 16 HZ wells
• Wolfcamp A – 2 wells, Wolfcamp B – 7 wells and Wolfcamp C – 7 wells
• HZ Wolfcamp B/C average IP 746 Boe/d (67% oil, 85% liquids)
• Overall HZ well results continue to track at or above type curve
• Impressive initial results from recent Elliott C bench well (IP of 806 Boe/d, 63% oil and
83% liquids) expands Wolfcamp development eastward
Delivering
Production
Growth
• Total production 14.2 MBoe/d (up 61% YoY)
• Oil production 5.5 Mbbl/d (up 61% YoY)
7 Third Quarter 2014 Results – November 2014
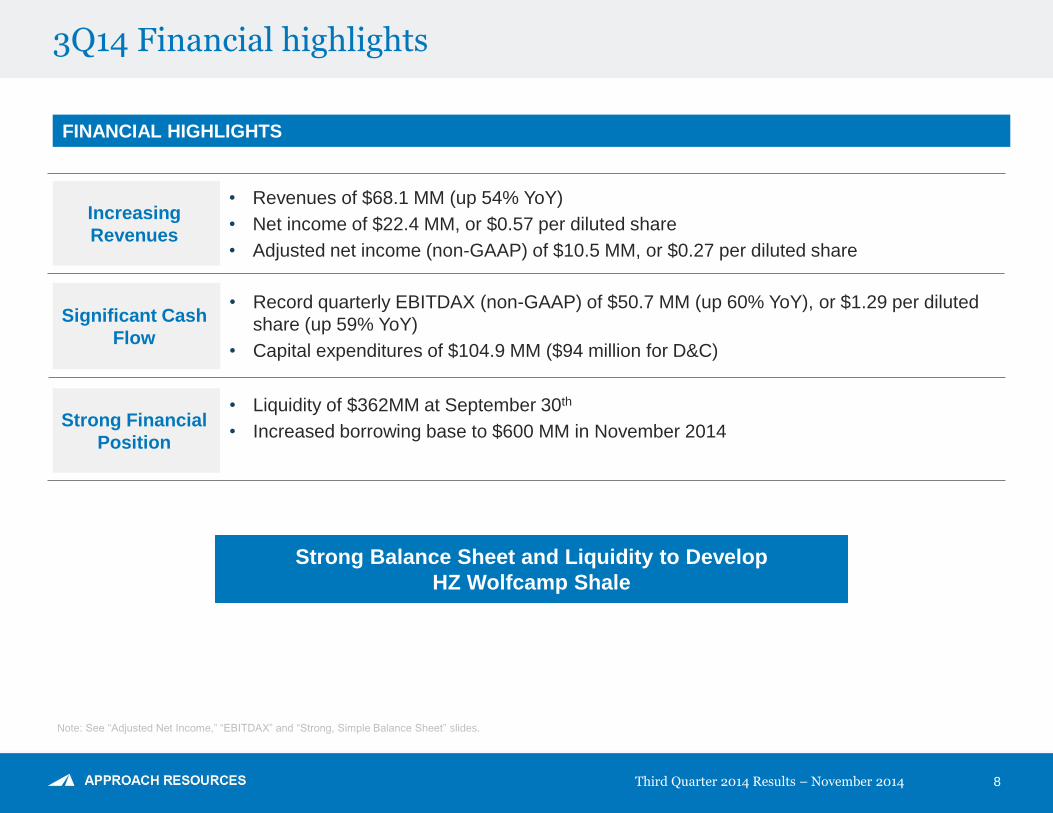
3Q14 Financial highlights
FINANCIAL HIGHLIGHTS
Significant Cash
Flow
• Record quarterly EBITDAX (non-GAAP) of $50.7 MM (up 60% YoY), or $1.29 per diluted
share (up 59% YoY)
• Capital expenditures of $104.9 MM ($94 million for D&C)
Strong Financial
Position
• Liquidity of $362MM at September 30th
• Increased borrowing base to $600 MM in November 2014
Increasing
Revenues
• Revenues of $68.1 MM (up 54% YoY)
• Net income of $22.4 MM, or $0.57 per diluted share
• Adjusted net income (non-GAAP) of $10.5 MM, or $0.27 per diluted share
Strong Balance Sheet and Liquidity to Develop
HZ Wolfcamp Shale
Note: See “Adjusted Net Income,” “EBITDAX” and “Strong, Simple Balance Sheet” slides.
8 Third Quarter 2014 Results – November 2014
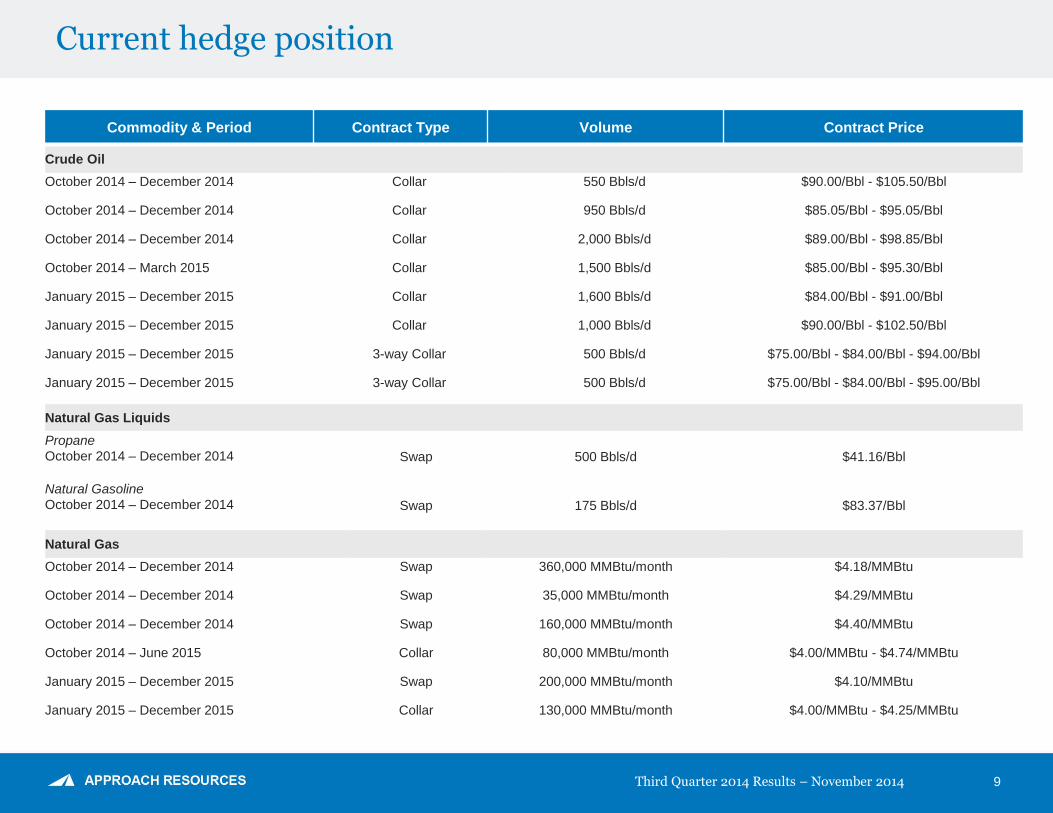
Current hedge position
9
Commodity & Period Contract Type Volume Contract Price
Crude Oil
October 2014 – December 2014 Collar 550 Bbls/d $90.00/Bbl - $105.50/Bbl
October 2014 – December 2014 Collar 950 Bbls/d $85.05/Bbl - $95.05/Bbl
October 2014 – December 2014 Collar 2,000 Bbls/d $89.00/Bbl - $98.85/Bbl
October 2014 – March 2015 Collar 1,500 Bbls/d $85.00/Bbl - $95.30/Bbl
January 2015 – December 2015 Collar 1,600 Bbls/d $84.00/Bbl - $91.00/Bbl
January 2015 – December 2015 Collar 1,000 Bbls/d $90.00/Bbl - $102.50/Bbl
January 2015 – December 2015 3-way Collar 500 Bbls/d $75.00/Bbl - $84.00/Bbl - $94.00/Bbl
January 2015 – December 2015 3-way Collar 500 Bbls/d $75.00/Bbl - $84.00/Bbl - $95.00/Bbl
Natural Gas Liquids
Propane
October 2014 – December 2014 Swap 500 Bbls/d $41.16/Bbl
Natural Gasoline
October 2014 – December 2014 Swap 175 Bbls/d $83.37/Bbl
Natural Gas
October 2014 – December 2014 Swap 360,000 MMBtu/month $4.18/MMBtu
October 2014 – December 2014 Swap 35,000 MMBtu/month $4.29/MMBtu
October 2014 – December 2014 Swap 160,000 MMBtu/month $4.40/MMBtu
October 2014 – June 2015 Collar 80,000 MMBtu/month $4.00/MMBtu - $4.74/MMBtu
January 2015 – December 2015 Swap 200,000 MMBtu/month $4.10/MMBtu
January 2015 – December 2015 Collar 130,000 MMBtu/month $4.00/MMBtu - $4.25/MMBtu
Third Quarter 2014 Results – November 2014
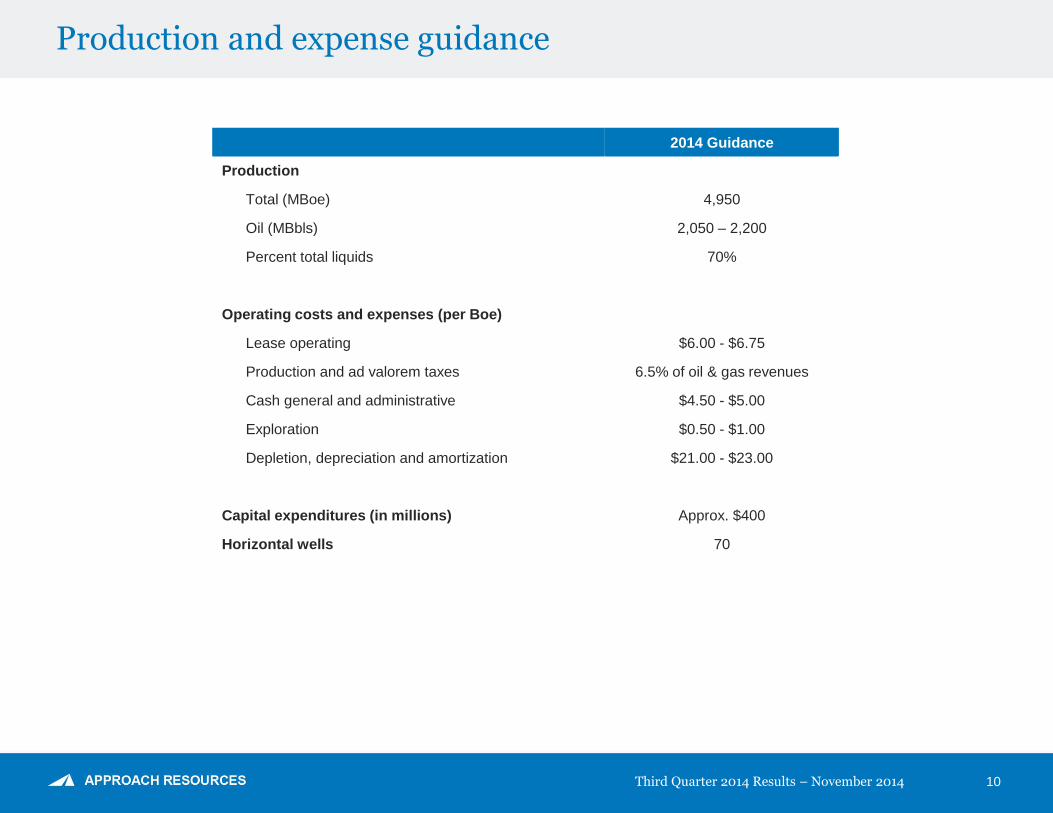
Production and expense guidance
10
2014 Guidance
Production
Total (MBoe) 4,950
Oil (MBbls) 2,050 – 2,200
Percent total liquids 70%
Operating costs and expenses (per Boe)
Lease operating $6.00 - $6.75
Production and ad valorem taxes 6.5% of oil & gas revenues
Cash general and administrative $4.50 - $5.00
Exploration $0.50 - $1.00
Depletion, depreciation and amortization $21.00 - $23.00
Capital expenditures (in millions) Approx. $400
Horizontal wells 70
Third Quarter 2014 Results – November 2014
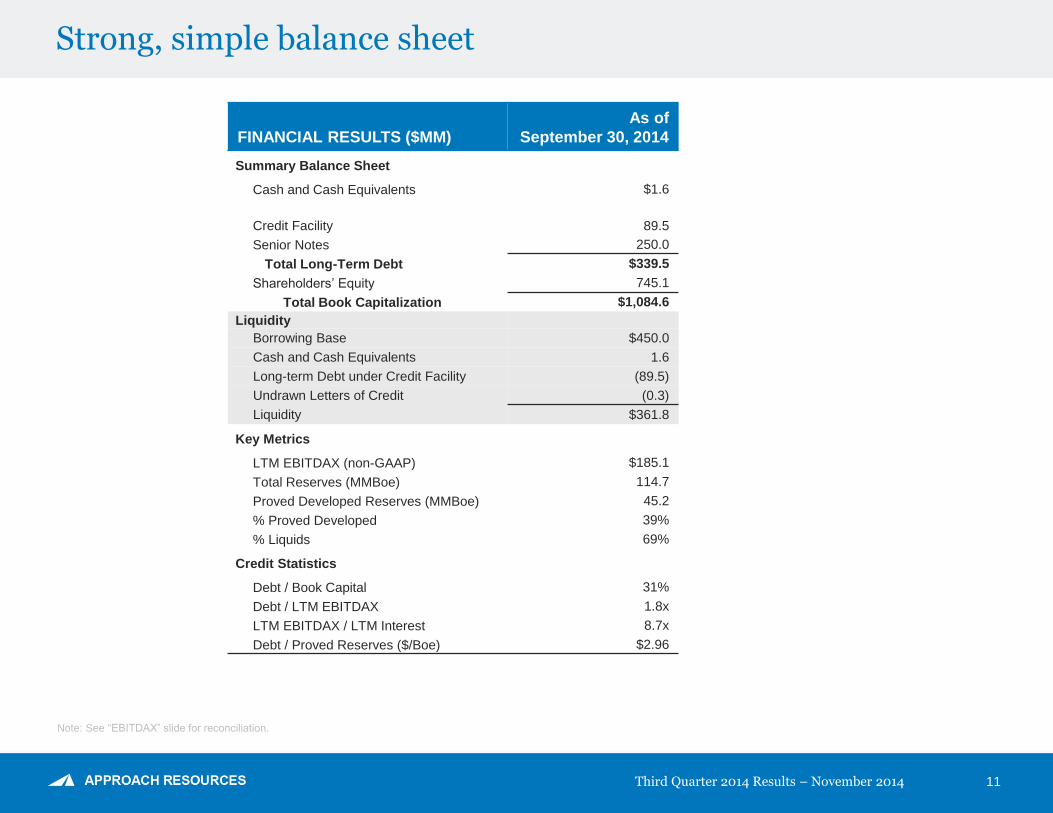
Strong, simple balance sheet
11
FINANCIAL RESULTS ($MM)
As of
September 30, 2014
Summary Balance Sheet
Cash and Cash Equivalents $1.6
Credit Facility 89.5
Senior Notes 250.0
Total Long-Term Debt $339.5
Shareholders’ Equity 745.1
Total Book Capitalization $1,084.6
Liquidity
Borrowing Base $450.0
Cash and Cash Equivalents 1.6
Long-term Debt under Credit Facility (89.5)
Undrawn Letters of Credit (0.3)
Liquidity $361.8
Key Metrics
LTM EBITDAX (non-GAAP) $185.1
Total Reserves (MMBoe) 114.7
Proved Developed Reserves (MMBoe) 45.2
% Proved Developed 39%
% Liquids 69%
Credit Statistics
Debt / Book Capital 31%
Debt / LTM EBITDAX 1.8x
LTM EBITDAX / LTM Interest 8.7x
Debt / Proved Reserves ($/Boe) $2.96
Third Quarter 2014 Results – November 2014
Note: See “EBITDAX” slide for reconciliation.

Appendix
Adjusted net income (unaudited)
13
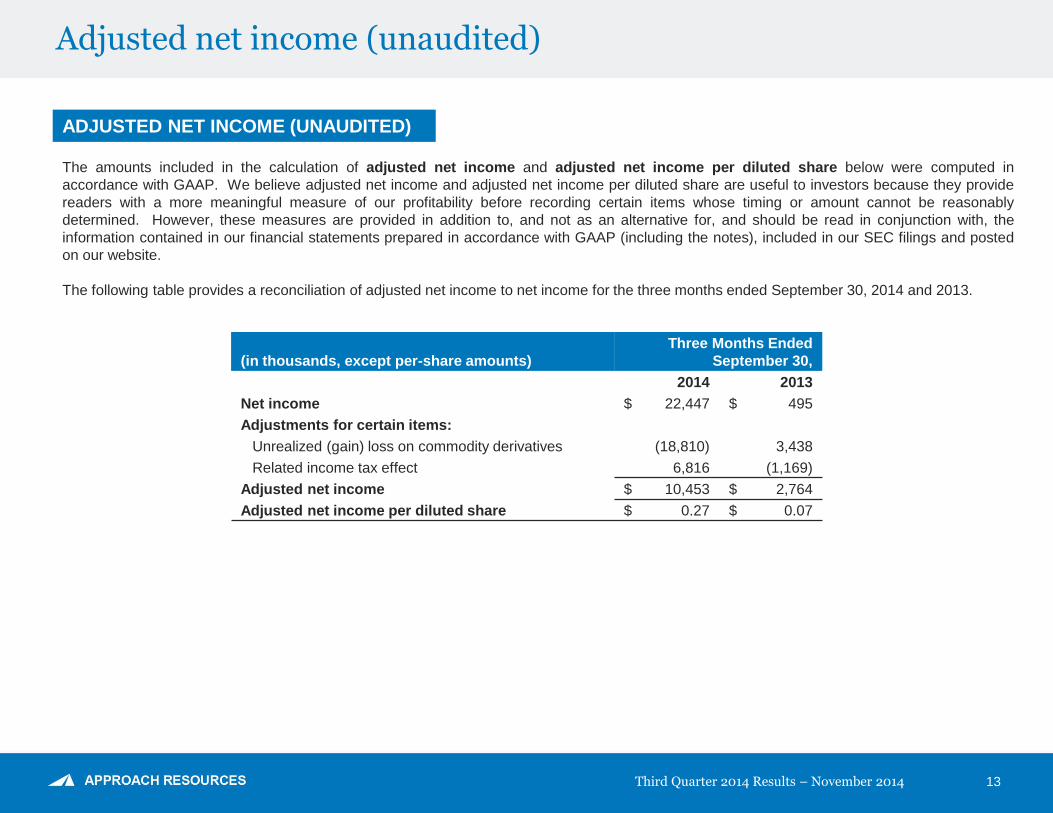
(in thousands, except per-share amounts)
Three Months Ended
September 30,
2014 2013
Net income $ 22,447 $ 495
Adjustments for certain items:
Unrealized (gain) loss on commodity derivatives (18,810) 3,438
Related income tax effect 6,816 (1,169)
Adjusted net income $ 10,453 $ 2,764
Adjusted net income per diluted share $ 0.27 $ 0.07
The amounts included in the calculation of adjusted net income and adjusted net income per diluted share below were computed in
accordance with GAAP. We believe adjusted net income and adjusted net income per diluted share are useful to investors because they provide
readers with a more meaningful measure of our profitability before recording certain items whose timing or amount cannot be reasonably
determined. However, these measures are provided in addition to, and not as an alternative for, and should be read in conjunction with, the
information contained in our financial statements prepared in accordance with GAAP (including the notes), included in our SEC filings and posted
on our website.
The following table provides a reconciliation of adjusted net income to net income for the three months ended September 30, 2014 and 2013.
ADJUSTED NET INCOME (UNAUDITED)
Third Quarter 2014 Results – November 2014

EBITDAX (unaudited)
14
EBITDAX (UNAUDITED)
The amounts included in the calculation of EBITDAX were computed in accordance with GAAP. EBITDAX is not a measure of net income or cash
flow as determined by GAAP. EBITDAX is presented herein and reconciled to the GAAP measure of net income because of its wide acceptance by
the investment community as a financial indicator of a company's ability to internally fund development and exploration activities. This measure is
provided in addition to, and not as an alternative for, and should be read in conjunction with, the information contained in our financial statements
prepared in accordance with GAAP (including the notes), included in our SEC filings and posted on our website.
The following table provides a reconciliation of EBITDAX to net income for the three months ended September 30, 2014 and 2013.
(in thousands, except per-share amounts)
Three Months Ended
September 30,
2014 2013
Net income $ 22,447 $ 495
Exploration 891 1,193
Depletion, depreciation and amortization 25,959 19,413
Share-based compensation 1,965 1,599
Unrealized (gain) loss on commodity derivatives (18,810) 3,438
Interest expense, net 5,442 5,179
Income tax provision 12,756 270
EBITDAX $ 50,650 $ 31,587
EBITDAX per diluted share $ 1.29 $ 0.81
Third Quarter 2014 Results – November 2014
PV-10 (unaudited)
15
PV-10 (UNAUDITED)
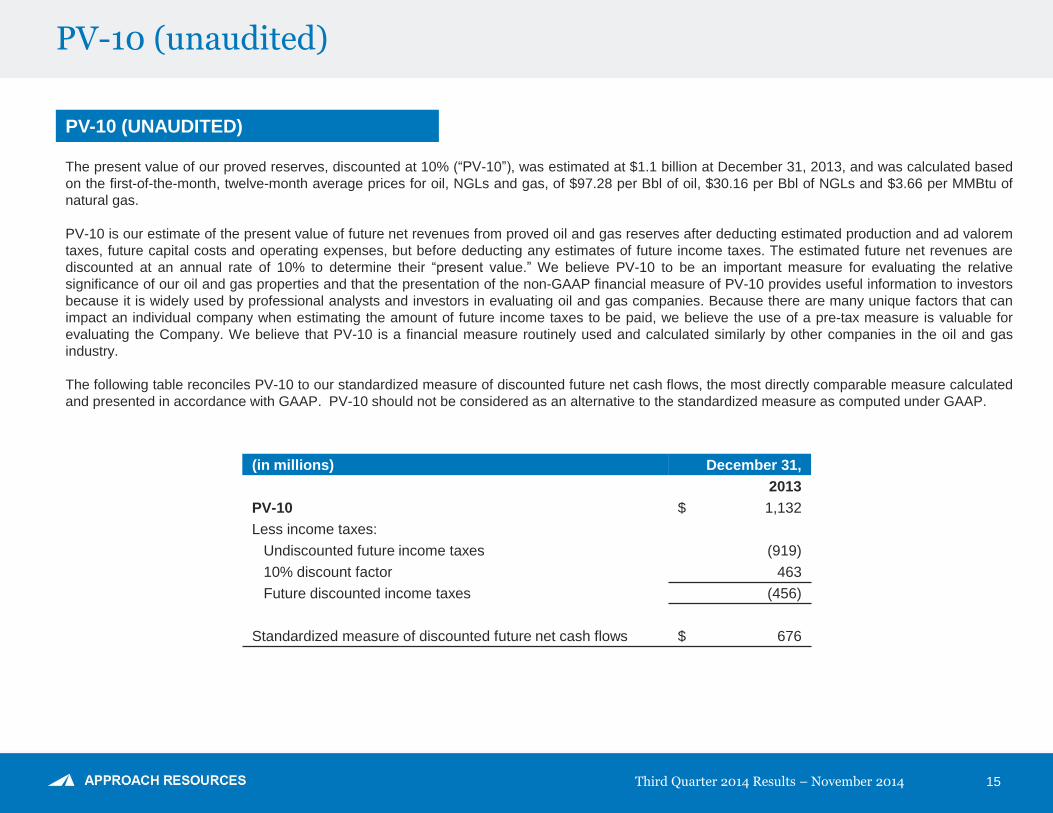
(in millions) December 31,
2013
PV-10 $ 1,132
Less income taxes:
Undiscounted future income taxes (919)
10% discount factor 463
Future discounted income taxes (456)
Standardized measure of discounted future net cash flows $ 676
The present value of our proved reserves, discounted at 10% (“PV-10”), was estimated at $1.1 billion at December 31, 2013, and was calculated based
on the first-of-the-month, twelve-month average prices for oil, NGLs and gas, of $97.28 per Bbl of oil, $30.16 per Bbl of NGLs and $3.66 per MMBtu of
natural gas.
PV-10 is our estimate of the present value of future net revenues from proved oil and gas reserves after deducting estimated production and ad valorem
taxes, future capital costs and operating expenses, but before deducting any estimates of future income taxes. The estimated future net revenues are
discounted at an annual rate of 10% to determine their “present value.” We believe PV-10 to be an important measure for evaluating the relative
significance of our oil and gas properties and that the presentation of the non-GAAP financial measure of PV-10 provides useful information to investors
because it is widely used by professional analysts and investors in evaluating oil and gas companies. Because there are many unique factors that can
impact an individual company when estimating the amount of future income taxes to be paid, we believe the use of a pre-tax measure is valuable for
evaluating the Company. We believe that PV-10 is a financial measure routinely used and calculated similarly by other companies in the oil and gas
industry.
The following table reconciles PV-10 to our standardized measure of discounted future net cash flows, the most directly comparable measure calculated
and presented in accordance with GAAP. PV-10 should not be considered as an alternative to the standardized measure as computed under GAAP.
Third Quarter 2014 Results – November 2014

Contact information
SERGEI KRYLOV
Executive Vice President & Chief Financial Officer
817.989.9000
www.approachresources.com