
3-Phase Inverter Motor Drive Analysis
16
3-Phase Inverter Motor Drive Analysis 5 Series/6 Series B MSO Option 5-IMDA/6-IMDA Application Datasheet
Transcript of 3-Phase Inverter Motor Drive Analysis

3-Phase Inverter Motor Drive Analysis5 Series/6 Series B MSO Option 5-IMDA/6-IMDA Application Datasheet
Measurements and analysis on three-phase power systems areinherently more complex than on single-phase systems. Althoughoscilloscopes can capture voltage and current waveforms with highsample rates, further calculations are required to produce key powermeasurements from the data. The oscilloscope based three-phasesolution allows to capture three-phase voltage and current waveformswith higher sample rates, longer record lengths using the HiResacquisition mode that goes up to 16-bits and with the supportof automated measurements produce key power test results. ThePower converters based on Pulse Width Modulation (PWM), such asvariable-frequency motor drives can complicate measurements sinceit is very important to extract precise zero crossings for the PWMsignals, thus making an oscilloscope a recommended test tool forvalidation and troubleshooting for motor designers. Special software,designed to automate power analysis on inverters, motors, and drives,greatly simplifies important three-phase power measurements on PWMsystems and can help engineers get faster insights into their designs.The Inverter Motor Drive Analysis (IMDA) solution from Tektronix helpsengineers design better and more efficient three-phase motor drivesystems, taking full advantage of the advanced user interface, six oreight analog input channels, and ‘High Res’ mode (16 bits) on the 5Series/6 Series B MSO. The IMDA solution provides fast, accurate, andrepeatable results for electrical measurements on industrial motors anddrive systems for AC induction motors, permanent magnet synchronousmotors (PMSM), and brushless DC (BLDC) motors. It can be configuredto measure DC to three-phase AC converters, such as those used inthe electric vehicles.
Key features and specifications• Accurately analyze three-phase PWM signals used to drive AC
induction, BLDC, and PMSM motors.• Unique oscilloscope based phasor diagrams indicate VRMS, IRMS,
VMAG, IMAG, and phase relationships at a glance for the configuredwiring pairs.
• Debug motor drive designs by viewing the drive input/output voltageand current signals in the time domain simultaneously with thephasor diagram.
• Three-phase Autoset feature configures the oscilloscope for optimalhorizontal, vertical, trigger, and acquisition parameters for acquiringthree-phase signals.
• Measures three-phase harmonics per the IEC-61000-3-2,IEEE-519, or custom limits.
• Measures the system efficiency based on the selected wiringconfigurations.
• Quickly add and configure measurements through the intuitive dragand drop interface on the 5 Series / 6 Series B MSO.
• Analyze Inverter and Automotive three-phase designs for DC inputand AC output wiring configuration.
• Displays the PWM filtered edge qualifier waveform during analysis.• Displays the test results per Record, or per Cycle mode during
analysis for specific measurements.
• Supports Time trend and Acquisition trend plots for specificmeasurements.
• Supports mathematical conversion of Line-Line to Line-Neutral forspecific wiring.
• Supports DQ0 measurements with the phasor plot.• Supports mechanical measurements using Hall sensor signals.
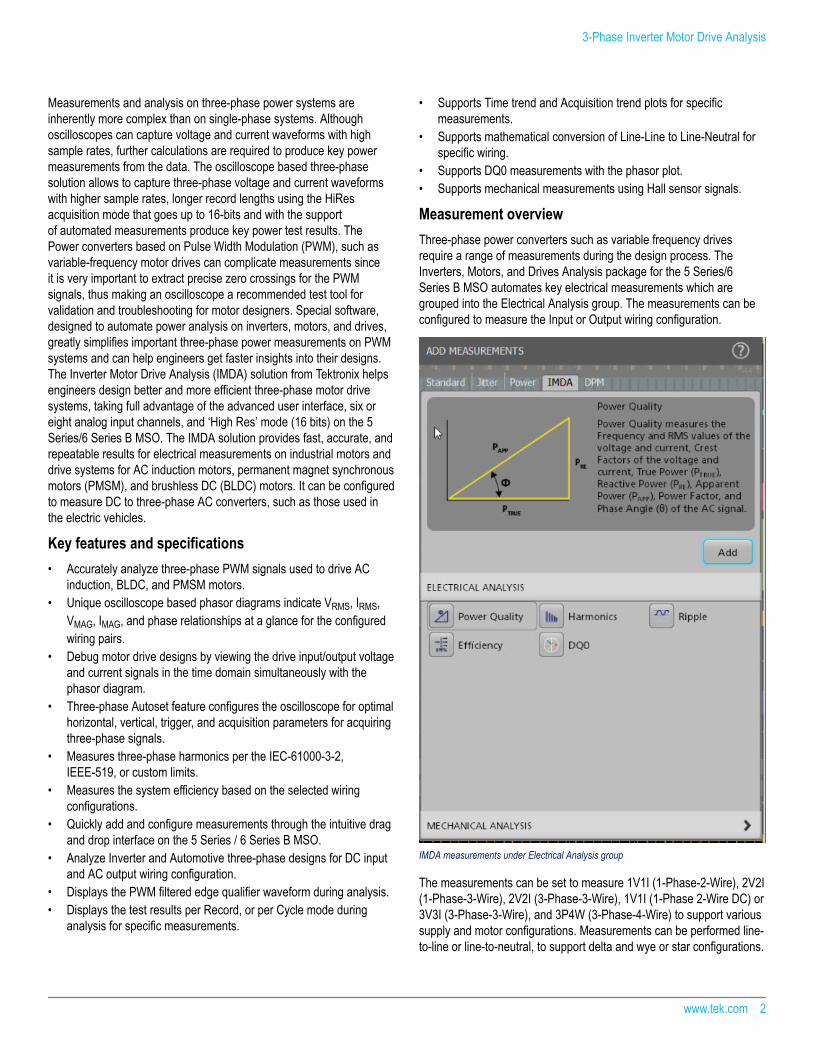
Measurement overviewThree-phase power converters such as variable frequency drivesrequire a range of measurements during the design process. TheInverters, Motors, and Drives Analysis package for the 5 Series/6Series B MSO automates key electrical measurements which aregrouped into the Electrical Analysis group. The measurements can beconfigured to measure the Input or Output wiring configuration.
IMDA measurements under Electrical Analysis group
The measurements can be set to measure 1V1I (1-Phase-2-Wire), 2V2I(1-Phase-3-Wire), 2V2I (3-Phase-3-Wire), 1V1I (1-Phase 2-Wire DC) or3V3I (3-Phase-3-Wire), and 3P4W (3-Phase-4-Wire) to support varioussupply and motor configurations. Measurements can be performed line-to-line or line-to-neutral, to support delta and wye or star configurations.
3-Phase Inverter Motor Drive Analysis
www.tek.com 2

Configuring the measurement for Input wiring configuration
HarmonicsPower waveforms are rarely textbook sinusoids. Harmonicsmeasurements break down non-sinusoidal voltage or currentwaveforms into their sinusoidal components, indicating the frequencyand amplitude for each component.
Harmonics analysis can be performed up to 200th harmonic order.The maximum harmonic order can be set to suit your needs byspecifying the range in the measurement configuration. THD-F, THD-Rand fundamental values are measured for each phase. Measurementscan be evaluated against the IEEE-519 or IEC 61000-3-2 standard,or custom limits. Test results can be recorded in a detailed reportindicating pass/fail status.
Compare harmonics measurements against industry standards or custom limits
A sample harmonics plot indicates passing harmonics test results. Each set of barscontains results for Phase A, B, and C for easy correlation.
The Harmonics plot shows the test results for all three phases groupedtogether so user can correlate the test results between the phases.The plot also shows the test results visually. The harmonics bars arehighlighted in green color during a pass condition, and highlight to redcolor when it exceeds the test limits. This gives a quick insight whendebugging for harmonics design.
3-Phase Inverter Motor Drive Analysis
www.tek.com 3

Power qualityThis measurement provides critical three-phase power sub-measurements including: frequency and RMS magnitudes of voltageand current, crest factors of voltage and current, PWM frequency, andphase angle for each phase. It also displays the sum of true power, sumof reactive power, sum of apparent power components.
Additionally, in the Line-Neutral configuration, this measurementdisplays True Power, Reactive Power, and Apparent Powercomponents of all the three-phases.
Voltage and current vectors can be displayed on a phasor diagramso you can quickly judge phase shift for each phase and the balanceamong phases. Each vector is represented by an RMS value andphase is computed using the Discrete Fourier Transform (DFT) method.
Easily configure the settings to get insight into the power quality
Method to compute power quality
The Power quality measurement can be configured to provide criticalthree-phase power measurements on the output side, including:frequency and RMS magnitudes of voltage and current, crest factorsof voltage and current, PWM frequency, true power, reactive power,apparent power, power factor, and phase angle for each phase.
3-Phase Inverter Motor Drive Analysis
www.tek.com 4

Easily configure the voltage and current inputs on the Power Quality measurement todisplay phasor diagrams
Unique oscilloscope based phasor diagram feature provides the relation between thevoltage and current vectors
3-Phase Inverter Motor Drive Analysis
www.tek.com 5

EfficiencyEfficiency measures the ratio of the output power to input power.The IMDA solution supports efficiency of three-phase AC and Inverterconfigurations. By using the 2V2I method, three-phase efficiency canbe measured using eight oscilloscope channels (2 voltage and 2 currentsources on the input side and 2 voltage and 2 current sources on theoutput side). The solution calculates efficiency at each phase (for 3V3Iconfiguration) and the total (average) efficiency of the system based onthe different input and output wiring combinations.
Configure wiring and filters to perform efficiency measurements for an Industrial motor
Configure wiring and filters to perform efficiency measurements for a DC-AC topologymost suitable for inverter testing
Get complete insight into the overall system efficiency
3-Phase Inverter Motor Drive Analysis
www.tek.com 6

Ripple analysis
Ripple is defined as the residual or unwanted AC voltage on aconstant DC component. It is typically measured on the DC bus. Thismeasurement helps to understand how efficiently the signal is gettingconverted from AC-DC on the input side, and the impact of unwantedcomponents on the PWM signal on the output side.
Ripple analysis configuration can be set to look into line and switching ripple
Ripple measurement being carried out on the DC-input signals when testing an Inverter
Direct Quadrature Zero (DQ0) analysisThe behavior of three-phase AC machines can be described by rotatingvoltage and current equations as below.
Where,
A, B, and C are three phase AC signals.
'Vg' is the corresponding gain.
'w(t)' is the 2pi×f×t.
The voltages (V) and currents (I) at the AC interface are usuallyseparated, typically 120 degrees out of phase. These V and Icomponents are time-varying, which means there is no representationof a steady-state operation point.
Generally, AC signals are real-world signals, but converting them to DChelps get an abstract representation of the direct quadrature transform.The DQ0 assists in emulating the controller. This information helps tounderstand more about what the controller is doing and allows to tunethe controller design.
The DQ0 transformations typically rotate the reference frames of ACwaveforms to convert them to DC signals. This allows simplifiedcalculations on the DC signals before performing the inverse transformto recover the actual three-phase AC results.
To measure and monitor the control system’s output, the designersdepend on FPGA’s and ASIC-based hardware to handle sensor data toget the DQ0 information and then check the control information throughmultiple iterations. This solution involves a complex and time takingprocess.
It is practically challenging to measure or probe the D-Q-0 signals.A typical solution provides an external stimulus to the controller toreplicate the controller input signals and the Analog-Digital Controller(ADC) outputs as the DQ0 signals.
To address this challenge, users depend on the software applicationDQ0 solution to understand the complex dynamic phenomena in powercontrol systems.
The IMDA solution features DQ0 transformation, which rotates thereference frames of the three phase waveforms, so they become DCsignals. Calculations can be simplified on these DC quantities beforeinverting them and getting to the actual three-phase AC results. A basiccontrol scheme is shown in the following figure.
3-Phase Inverter Motor Drive Analysis
www.tek.com 7

Typical connection setup and probing points for doing DQ0 measurements
Tektronix offers a patented on-scope measurement called DQ0 underthe electrical analysis measurement category as an added option usingClarke’s and Park’s transformation matrix. The DQ0 feature is availableas an option 5-IMDA-DQ0/6-IMDA-DQ0 on the 5 series and 6 seriesMSO.
The DQ0 method calculates the angle (θ) as 2*pi*f*t and extrapolatesthe reference frame based on where we expect time-varying signals tobe. The DQ0 frame (phasor diagram) rotates with the right speed andfrequency and not necessarily in phase with the rotor, which helps tounderstand the instantaneous state of the motor.
This measurement is supported in the 3V3I configuration, takes thethree-phase voltage or current signals from the motor as inputs, andconverts them into D-Q-0 coefficients acting as a powerful debuggingtool for the motor designers to tune their PWM controller circuit designs.
The measurement computes real-time DQ0 transformation byconverting the 3-phase drive output voltage or current waveforms.The transform matrix converts time-varying AC signals into time-invariant DC components. This helps to reproduce the control system'sunderstanding of instantaneous motor torque and speed. The useof the DQ0 transformation allows motor designers to correlate theperformance of the 3Phase power section to control system of thehardware algorithms and design. The overlapped DQ0 and 3-phaseABC vectors act as a good debug feature for designers to observesimultaneously both vector axis on the same plot.
There are different outputs of this measurement such as scalar valueswith the magnitude of D and Q, RMS values with statistics, derivedmath waveforms, and a phasor diagram. Math waveform provides theDC transformed waveform. This provides the different views of thecontrol system outputs in a single view.
By observing the DQ0 results, some important inferences can bedrawn, such as variations indicating to RMS ripple, peak to peakvalues, and higher-order harmonics. These parameters directly relateto understanding the operation of the algorithms in the control
systems. Without this information, it would be difficult to understandthe performance of the motor control systems.
DQ0 measurements running on the 5 Series MSO. They are represented on the phasordiagram as VQ (green), VD(orange), and VZ (white) vectors and their scalar values areavailable in the results badge on the right. The DQ0 waveforms are shown as Math M12-filtered waveform (Green), M13 - Direct (Orange), M14 – Quadrature (Purple) and M15 –Zero (Red).
Dynamic measurements using trend analysisA common requirement in motor drive analysis is an ability to look atthe motor response over longer test times, records, and an extendednumber of acquisitions to monitor the DUT behavior over varyingload conditions. This dynamic measurement helps to understandoptimal designs and interdependency between different parameters likevoltage, current, power, frequency, and their variance based on theload conditions. You can manually zoom and get the specific region ofinterest to look at test results at the particular region of the waveform.
IMDA solution offers two unique trend plots on the power qualitymeasurement to support such requirements:
• Time trend plot• Acq trend plot
Each plot has its advantages and can be used to plot the supportedsub-measurements under power quality measurement. The time trendplot shows the measured value per cycle, or for an acquired waveform(a record), while the acq trend plot shows a mean of the measuredvalue per record, over each of the acquisitions. The acquisition countcan be set during the test configuration. This allows you to capture longrecords of data to perform deep record analysis and understand thedynamic behaviors of the motor response. The plots can be saved as aCSV file for post-processing.
3-Phase Inverter Motor Drive Analysis
www.tek.com 8

Time trends enable you to graphically analyze power measurements within oneacquisition record. Acquisition trends can plot power measurements over manyacquisitions for longer-term testing.
This example shows acquisition trend plots of mean power measurements for 100acquisitions, including - Vrms, Irms, phase difference, sum of true power, apparent power,and reactive power.
Add and configure the Time Trend plot on different sub-measurements of Power Qualitymeasurement. The image shows two time-tend plots monitoring Vrms and Frequencyparameters.
Mechanical analysis
IMDA mechanical analysis group (Option IMDA-MECH) supports hallsensor output signals to calculate speed, acceleration, and directioninformation. The acceleration results are reported as part of the speedmeasurement. The measurement requires the number of pole pairs
and corresponding gear ratio to measure key motor parameters. Thedirection measurement expects a sequence of hall sensor rising edgesto be configured before operation and validates them during theoperation.
TPP1000 passive probes or high voltage differential THDP0200/100probes can be used to capture the sensor outputs depending onthe motor output power and noise levels. Digital channels with TLPlogic probes are recommended for use instead of analog because oflesser noise and can help to conserve analog channels for other testsoperations and use single flex channel for the measurement.
IMDA mechanical analysis supports speed (with acceleration) and directionmeasurements
3-Phase Inverter Motor Drive Analysis
www.tek.com 9

Speed measurement
Hall sensor signal transition as shown in the following figure.
Speed measurement computation using three hall sensor transitions
Speed is defined by the following equation,
Where,
Difference between TSP and TST is defined by the number of pole pairs.
TST is the start if the electrical pulse
TSP is the stop if the electrical pulse
60 is the RPM (revolitions per minute)
G is the gear ratio.
Acceleration
Acceleration is rate of change of speed per unit time. It is defined as
Speed and direction support following plots:
• Histogram• Time Trend• ACQ Trend
Importance of speed ACQ trend plots
The ACQ trend along with the histogram plot shows jitter on motorspeed, which otherwise requires dedicated instrument like a flutter
meter to measure. This jitter information (variations in edge timing)measures the motor-speed consistency.
ACQ trend plot displaying Jitter on the motor speed (left) along with a histogram plot(right) that indicates the speed distribution
Motor start-up profile
Motor designers are interested to investigate the motor startup profileduring the design stage. The time trend gives the instantaneous speedinformation of a motor which otherwise is hard to measure.
In the following Time trend plot showing startup sequence of a motorimage, where the start-up time taken by the motor is 2.3s from OFF to aON state. Similarly, one can perform ON to OFF state and gain insightsinto the de-acceleration process as shown in the figure Time trend plotshowing deceleration of a motor into a stop state image.
Time trend plot displaying startup sequence of a motor
3-Phase Inverter Motor Drive Analysis
www.tek.com 10

Time trend plot displaying deceleration of a motor into a stop state
Direction
Some applications like drills, washing machines, and electric pumpsrequire motor to operate and change directions rapidly. The directionmeasurement helps with this analysis. The order of rising edges orfalling edges of hall sensor output determines the direction of rotation.The direction measurement needs all three hall signals. They areavailable as configurable parameters for the direction measurementand are validated during the motor operation. Generally, a A-B-Csequence is interpreted as clockwise (CW) and a A-C-B sequence isinterpreted as counter-clockwise (CCW).
For example, if the first rising edge is from HALL A and a rising edgeof HALL B exists at 120 degrees, then the rotor rotation sequenceis A-B-C. Else, if the second rising edge of HALL C occurs at 120degrees, then the sequence is A-C-B.
Direction information interpreted from the Hall sensor outputs
Direction information captured on the scope shows a HALL A,B,C rising edge sequence(clockwise rotation)
Here is the formula used to compute the direction information.
Order (Clockwise) = (A-B-C)
Order (Counter-clockwise) = (A-C-B)
Where Order function checks for the sequence of rising edges on allthree hall sensor signals.
Direction can be displayed as an ACQ trend plot to give a visualindication on an exact timestamp when the motor reversed the directionhelping during the debug. This is shown as a sample plot in thefollowing figure.
The ACQ trend plot shows +1 and -1 based on CW and CCW motor rotation.
3-Phase Inverter Motor Drive Analysis
www.tek.com 11

Report generationThe IMDA software simplifies data collection, archiving, documentationof your design, and development process. It supports the reportgeneration in MHT or PDF formats with pass/fail results for easyanalysis.
A sample IMDA test report file with summary, details, and corresponding images
3-Phase Inverter Motor Drive Analysis
www.tek.com 12

SpecificationsWiring configuration 1V1I (1-Phase-2Wire), 2V2I (1 Phase-3-Wire), 2V2I (3-Phase-3-Wire), 2V2I (DC In-AC Out), 3V3I (DC In-AC Out) or 3V3I
(3-Phase-3Wire), and 3P4W (3-Phase-4Wire)
L-L to L-N conversion Applicable for 3 Phase-3 Wire (3V3I)1
Electrical analysis Power quality, Harmonics2, Ripple, DQ03, Efficiency4
Mechanical analysis Speed, Acceleration, and Direction
Three-phase autoset For all measurements
Plots Time Trend plot, ACQ trend plot, Phasor diagram, harmonics bar graph 5, DQ0 plot, and Histogram plot (speed distribution)
Report MHT and PDF format, Data export to CSV format
Degauss/Deskew (static) Automatic detection of probes, Auto Zero. User can deskew voltage and current probes, degauss the current probe from themenus for each channel
Source support Live analog signals, reference waveforms, and math waveforms
1 For 3 Phase-4 Wire (3V3I) the connection is always Line to Neutral and for 3 Phase-3 Wire (2V2I), it is Line to Line.2 Supports custom limits.3 Applicable for 3V3I wiring only.4 For 2V2I wiring only.5 Range filter as part of measurement configuration.
3-Phase Inverter Motor Drive Analysis
www.tek.com 13

Ordering informationModelsProduct Options Supported instruments Bandwidth availableNew instrument order option 5-IMDA 5 Series MSO (MSO56, MSO58) • 350 MHz
• 500 MHz• 1 GHz• 2 GHz
Product upgrade option SUP5-IMDAFloating license SUP5-IMDA-FL
Product Options6 Supported instruments Bandwidth available
New instrument order option 5-IMDA-DQ0 5 Series MSO (MSO56, MSO58) • 350 MHz• 500 MHz• 1 GHz• 2 GHz
Product upgrade option SUP5-IMDA-DQ0Floating license SUP5-IMDA-DQ0-FL
Product Options6 Supported instruments Bandwidth available
New instrument order option 5-IMDA-MECH 5 Series MSO (MSO56, MSO58) • 350 MHz• 500 MHz• 1 GHz• 2 GHz
Product upgrade option SUP5-IMDA-MECHFloating license SUP5-IMDA-MECH-FL
Product Options Supported instruments Bandwidth availableNew instrument order option 6-IMDA 6 Series B MSO (MSO66B,
MSO68B)• 1 GHz• 2.5 GHz• 4 GHz• 6 GHz• 8 GHz• 10 GHz
Product upgrade option SUP6B-IMDAFloating license SUP6B-IMDA-FL
Product Options6 Supported instruments Bandwidth available
New instrument order option 6-IMDA-DQ0 6 Series B MSO (MSO66B,MSO68B)
• 1 GHz• 2.5 GHz• 4 GHz• 6 GHz• 8 GHz• 10 GHz
Product upgrade option SUP6B-IMDA-DQ0Floating license SUP6B-IMDA-DQ0-FL
6 Options IMDA-DQ0 and IMDA-MECH requires Option IMDA as a pre-requisite
3-Phase Inverter Motor Drive Analysis
www.tek.com 14

Product Options6 Supported instruments Bandwidth available
New instrument order option 6-IMDA-MECH 6 Series B MSO (MSO66B,MSO68B)
• 1 GHz• 2.5 GHz• 4 GHz• 6 GHz• 8 GHz• 10 GHz
Product upgrade option SUP6B-IMDA-MECHFloating license SUP6B-IMDA-MECH-FL
Software bundles
Supported instruments Bundle options Description5 Series MSO 5-PRO-POWER-1Y 1 Year License Pro Power Bundle for 5 Series MSO
5-ULTIMATE-1Y Perpetual License Pro Power Bundle for 5 Series MSO5-ULTIMATE-1Y 1 Year License Ultimate Bundle for 5 Series MSO5-ULTIMATE-PER Perpetual License Ultimate Bundle for 5 Series MSO
6 Series MSO 6-PRO-POWER-1Y 1 Year License Pro Power Bundle for 6 Series MSO6-PRO-POWER-PER Perpetual License Pro Power Bundle for 6 Series MSO6-ULTIMATE-1Y 1 Year License Ultimate Bundle for 6 Series MSO6-ULTIMATE-PER Perpetual License Ultimate Bundle for 6 Series MSO
Recommended probesProbe model Description QuantityTCP0030A Current Probes 3 for 3V3I wiring7
THDP0200 or TMDP0200 High Voltage Differential Probes 3 for 3V3I wiring 7
Tektronix is registered to ISO 9001 and ISO 14001 by SRI Quality System Registrar.
Product(s) complies with IEEE Standard 488.1-1987, RS-232-C, and with Tektronix Standard Codes andFormats.
Product Area Assessed: The planning, design/development and manufacture of electronic Test andMeasurement instruments.
7 For performing efficiency measurement, four quantities are required.
3-Phase Inverter Motor Drive Analysis
www.tek.com 15

3-Phase Inverter Motor Drive Analysis
ASEAN / Australasia (65) 6356 3900 Austria 00800 2255 4835* Balkans, Israel, South Africa and other ISE Countries +41 52 675 3777Belgium 00800 2255 4835* Brazil +55 (11) 3759 7627 Canada 1 800 833 9200Central East Europe and the Baltics +41 52 675 3777 Central Europe & Greece +41 52 675 3777 Denmark +45 80 88 1401Finland +41 52 675 3777 France 00800 2255 4835* Germany 00800 2255 4835*Hong Kong 400 820 5835 India 000 800 650 1835 Italy 00800 2255 4835*Japan 81 (120) 441 046 Luxembourg +41 52 675 3777 Mexico, Central/South America & Caribbean 52 (55) 56 04 50 90Middle East, Asia, and North Africa +41 52 675 3777 The Netherlands 00800 2255 4835* Norway 800 16098People's Republic of China 400 820 5835 Poland +41 52 675 3777 Portugal 80 08 12370Republic of Korea +822 6917 5084, 822 6917 5080 Russia & CIS +7 (495) 6647564 South Africa +41 52 675 3777Spain 00800 2255 4835* Sweden 00800 2255 4835* Switzerland 00800 2255 4835*Taiwan 886 (2) 2656 6688 United Kingdom & Ireland 00800 2255 4835* USA 1 800 833 9200
* European toll-free number. If not accessible, call: +41 52 675 3777
For Further Information. Tektronix maintains a comprehensive, constantly expanding collection of application notes, technical briefs and other resources to help engineers working on the cutting edge of technology. Please visit www.tek.com.Copyright © Tektronix, Inc. All rights reserved. Tektronix products are covered by U.S. and foreign patents, issued and pending. Information in this publication supersedes that in all previously published material. Specification and price changeprivileges reserved. TEKTRONIX and TEK are registered trademarks of Tektronix, Inc. All other trade names referenced are the service marks, trademarks, or registered trademarks of their respective companies.
2 Aug 2021 48W-61649-3www.tek.com


