3 (Methodogy)
9
CHAPTER 3 METHODOLOGY 3.0 Introduction Further explanations will be discuss in this chapter especially about the procedure and the method use during research process. Researcher will use survey technique in order to obtain all information about customer’s satisfaction for facilities provided at foodservices/cafeteria and the data to be collected such as demographic and satisfaction level of facilities in foodservices/cafeteria in UiTM Shah Alam. In this chapter,
-
Upload
nur-yasmin -
Category
Documents
-
view
2 -
download
0
description
ok
Transcript of 3 (Methodogy)

CHAPTER 3
METHODOLOGY
3.0 Introduction
Further explanations will be discuss in this chapter especially about the procedure
and the method use during research process. Researcher will use survey technique in
order to obtain all information about customer’s satisfaction for facilities provided at
foodservices/cafeteria and the data to be collected such as demographic and satisfaction
level of facilities in foodservices/cafeteria in UiTM Shah Alam. In this chapter, suitable
research design, sampling method, how data will be collected and analyzed are determine
and discuss. This chapter includes:
1. Study area
2. Sources of data
3. Sampling technique
4. Population

5. Sampling method
6. Sample size
7. Questionnaire design
8. Data analysis
3.1 Study Area
Three (3) foodservices/cafeterias for each hostel such as Kolej Anggerik, Kolej
Perindu and Kolej Seroja located in UiTM Shah Alam has selected as study area for this
research. Suitable study area contributes in progress of collecting data from respondents.
According to UiTM Shah Alam management, the place is covered about 34 acre of land.
It contains of 1,500 animals from 200 species. They served 2 main activities for visitors
which are Taiping Zoo and Night Safari. It is located in area of Taiping Lake Garden. For
this research, the data will be gained from visitors of both activities. Below is the overall
map of Taiping Zoo.
Figure 3.1: Map of UiTM Shah Alam
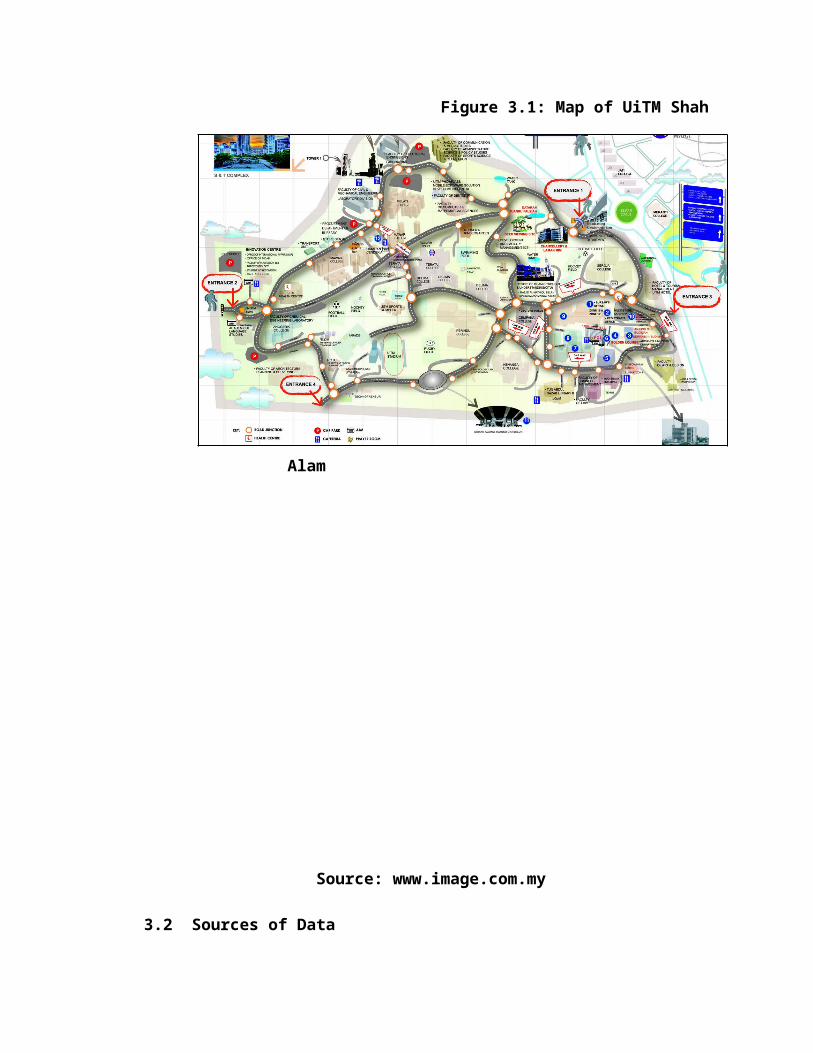
Source: www.image.com.my
3.2 Sources of Data
Sources of data for this research includes primary and secondary data. Primary
data is obtained through questionnaire.
3.3 Data Collection
The data collection took about one week and the actual survey was done on
October 28th 2015. Respondent took about 5 – 10 minutes to answers the questionnaire.
3.3.1 Primary Data
Primary data is information gain through questionnaire which is all data is reliable
as a source of information. By using questionnaire method, all respondents had
been asked to fill the question sheet given with appropriate answer to evaluate the
satisfaction level of facilities provided in foodservices/cafeteria at UiTM Shah
Alam. The question were contain of their demographic and satisfaction level of
facilities there.
3.3.2 Secondary Data
Another source of data is secondary data. It is additional data such as journal and
books.
3.4 Population
Population of three hostels which is Kolej Anggerik, Kolej Perindu and Kolej
Seroja are known through the UiTM management data for the capacity students who live
in hostel. Number of capacity for each hostel and foodservices/cafeteria as below:

Figure 3.4: Number of capacity for three (3) hostel and foodservices/cafeteria
NO.
HOSTELCAPACITY IN CAFETERIA
(SEAT)CAPACITY OF
HOSTEL (STUDENT)
1 ANGGERIKTABLE
(Shape: Square, 1 table=4 seats)50
800 TOTAL SEAT 200
2 PERINDU
TABLE(Shape: Square, 1 table=4 seats)
(Shape: Rectangular, 1 table=6 seats)(Shape: Circle, 1 table=8 seats)
25242
1,900
TOTAL SEAT 260
3 SEROJA
TABLE(Shape: Square, 1 table=4 seats)
(Shape: Rectangular, 1 table=7 seats)451 1,320
TOTAL SEAT 187
Source: Author’s research (2015)
3.5 Sampling Method
Simple random technique is being used for this research by choose randomly the
respondents which live in hostel in order to reduce the amount of data that need to be
collected. Furthermore, there is limitation for researcher such as time constraints to study
an entire population of students live in each hostel, researcher decided to relying on
sample to acquire the data. The data through sample represent the satisfaction level of
facilities provided in their hostel’s foodservices/cafeteria.
3.5.1 Sample Size
Sample size is an important part in order to ensure that it is large enough
to provide researcher with necessary confidence in on the data. The researcher
was used a simple formula to calculate the sample size which is 20% from
capacity students who live in each hostel to determine the actual size required.

Below is the calculation of sample size which will be use in this research. The
sample size for this research is 804 respondents.
CALCULATION WORK OF SAMPLE SIZE
Sample Size:
S = Sample size that determine
N = Number of population
*According to the formula, researcher calculated their sample size. The step
of calculation shown at below:
NO. HOSTEL CAPACITY OF HOSTEL (STUDENT)
CALCULATION SAMPLE FOR
STUDENT FOR EACH
HOSTEL
1 ANGGERIK 800 20% x 800 160
2 PERINDU 1,900 20% x 1,900 380
3 SEROJA 1,320 20% x 1,320 264
TOTAL SAMPLE SIZE 804
*Sample size: 804 respondents
3.6 Questionnaire Design
S = 20% x N

In order to gathering the data on satisfaction of facilities provided in
foodservices/cafeteria among students, a survey was used. The questions in a
questionnaire were constructed based on the topic which mentions the main objective
such to identify the criteria of customers satisfaction of facilities provided at
foodservices/cafeteria in the university and to investigate the level of customers
satisfaction of facilities provided at foodservices/cafeteria in UiTM Shah Alam. In this
research, researcher used likert scale method in designing the questionnaire. The
questionnaire is divided into two parts which is part A and part B.
I. Part A
In Part A, the question is more on the general demographic questions such as
gender and age of the respondents.
II. Part B
In Part B, the question is to evaluate the level of satisfaction among customers
which is students in term of the facilities in their hostel’s foodservices/hostel.
Researcher had selected likert scale question in this part.
3.7 Pilot Testing
After designing questionnaire, researcher need to do pilot testing which is
important whether the questionnaire valid or not in term of understandable and reliable.
Sum sets of questionnaire have been distribute to respondent as small-scale trial prior
before main survey need to be done and amendments can be made. Researcher pilot the
questionnaires personally so that the respondent can be observed and questioned if
necessary. Beside that, it is can be detect if any question appear to difficult to be answers
by respondent and the result is the new version of questionnaire can be made.
3.8 Data Analysis

By using Statistical Package for the social science (SPSS), all information and
data result can be analyze clearly by interpreting in the form of pie chart, matrix, graphs,
frequency to determine the overall result from data collected to this studies. In order to
measure the satisfaction level of facilities provided at foodservices/cafeteria by
customers, researcher using likert scale which is number 1 represent extremely
dissatisfied and 5 represent extremely satisfied.