3. HEALTH EFFECTS - CDC
121
27 PERCHLORATES 3. HEALTH EFFECTS 3.1 INTRODUCTION The primary purpose of this chapter is to provide public health officials, physicians, toxicologists, and other interested individuals and groups with an overall perspective on the toxicology of perchlorates. It contains descriptions and evaluations of toxicological studies and epidemiological investigations and provides conclusions, where possible, on the relevance of toxicity and toxicokinetic data to public health. A glossary and list of acronyms, abbreviations, and symbols can be found at the end of this profile. The perchlorate anion forms salts with a wide variety of cations. There are five perchlorate salts that are manufactured in substantial amounts: magnesium, potassium, ammonium, sodium, and lithium perchlorate (see Section 4.1). The potassium, sodium, and ammonium salts are the ones most commonly encountered in the toxicology literature. Therefore, data on potassium, sodium, ammonium, and other perchlorate salts were considered pertinent to the assessment of the perchlorate anion. Perchloric acid was not included because it is a strong acid and its toxicity is dominated by the irritating effects of the hydrogen cation. In the absence of water, the five commercial perchlorates listed above will exist as a solid. In water, perchlorate salts (perchlorates) will rapidly dissolve and completely dissociate into the perchlorate anion, also referred to as perchlorate, and the corresponding metal cation. Potassium, ammonium, and sodium cations are ubiquitous in the environment and are considered spectator ions. Therefore, the species of concern in this document is the perchlorate anion. 3.2 DISCUSSION OF HEALTH EFFECTS BY ROUTE OF EXPOSURE To help public health professionals and others address the needs of persons potentially exposed to perchlorate, the information in this section is organized first by route of exposure (inhalation, oral, and dermal) and then by health effect (death, systemic, immunological, neurological, reproductive, developmental, genotoxic, and carcinogenic effects). These data are discussed in terms of three exposure periods: acute (14 days or less), intermediate (15–364 days), and chronic (365 days or more). Levels of significant exposure for each route and duration are presented in tables and illustrated in figures. The points in the figures showing no-observed-adverse-effect levels (NOAELs) or lowest- observed-adverse-effect levels (LOAELs) reflect the actual doses (levels of exposure) used in the studies. LOAELs have been classified into "less serious" or "serious" effects. "Serious" effects are those that
Transcript of 3. HEALTH EFFECTS - CDC
27 PERCHLORATES
3. HEALTH EFFECTS
3.1 INTRODUCTION
The primary purpose of this chapter is to provide public health officials, physicians, toxicologists, and
other interested individuals and groups with an overall perspective on the toxicology of perchlorates. It
contains descriptions and evaluations of toxicological studies and epidemiological investigations and
provides conclusions, where possible, on the relevance of toxicity and toxicokinetic data to public health.
A glossary and list of acronyms, abbreviations, and symbols can be found at the end of this profile.
The perchlorate anion forms salts with a wide variety of cations. There are five perchlorate salts that are
manufactured in substantial amounts: magnesium, potassium, ammonium, sodium, and lithium
perchlorate (see Section 4.1). The potassium, sodium, and ammonium salts are the ones most commonly
encountered in the toxicology literature. Therefore, data on potassium, sodium, ammonium, and other
perchlorate salts were considered pertinent to the assessment of the perchlorate anion. Perchloric acid
was not included because it is a strong acid and its toxicity is dominated by the irritating effects of the
hydrogen cation. In the absence of water, the five commercial perchlorates listed above will exist as a
solid. In water, perchlorate salts (perchlorates) will rapidly dissolve and completely dissociate into the
perchlorate anion, also referred to as perchlorate, and the corresponding metal cation. Potassium,
ammonium, and sodium cations are ubiquitous in the environment and are considered spectator ions.
Therefore, the species of concern in this document is the perchlorate anion.
3.2 DISCUSSION OF HEALTH EFFECTS BY ROUTE OF EXPOSURE
To help public health professionals and others address the needs of persons potentially exposed to
perchlorate, the information in this section is organized first by route of exposure (inhalation, oral, and
dermal) and then by health effect (death, systemic, immunological, neurological, reproductive,
developmental, genotoxic, and carcinogenic effects). These data are discussed in terms of three exposure
periods: acute (14 days or less), intermediate (15–364 days), and chronic (365 days or more).
Levels of significant exposure for each route and duration are presented in tables and illustrated in
figures. The points in the figures showing no-observed-adverse-effect levels (NOAELs) or lowest-
observed-adverse-effect levels (LOAELs) reflect the actual doses (levels of exposure) used in the studies.
LOAELs have been classified into "less serious" or "serious" effects. "Serious" effects are those that
28 PERCHLORATES
3. HEALTH EFFECTS
evoke failure in a biological system and can lead to morbidity or mortality (e.g., acute respiratory distress
or death). "Less serious" effects are those that are not expected to cause significant dysfunction or death,
or those whose significance to the organism is not entirely clear. ATSDR acknowledges that a
considerable amount of judgment may be required in establishing whether an end point should be
classified as a NOAEL, "less serious" LOAEL, or "serious" LOAEL, and that in some cases, there will be
insufficient data to decide whether the effect is indicative of significant dysfunction. However, the
Agency has established guidelines and policies that are used to classify these end points. ATSDR
believes that there is sufficient merit in this approach to warrant an attempt at distinguishing between
"less serious" and "serious" effects. The distinction between "less serious" effects and "serious" effects is
considered to be important because it helps the users of the profiles to identify levels of exposure at which
major health effects start to appear. LOAELs or NOAELs should also help in determining whether or not
the effects vary with dose and/or duration, and place into perspective the possible significance of these
effects to human health.
The significance of the exposure levels shown in the Levels of Significant Exposure (LSE) tables and
figures may differ depending on the user's perspective. Public health officials and others concerned with
appropriate actions to take at hazardous waste sites may want information on levels of exposure
associated with more subtle effects in humans or animals (LOAELs) or exposure levels below which no
adverse effects (NOAELs) have been observed. Estimates of levels posing minimal risk to humans
(Minimal Risk Levels or MRLs) may be of interest to health professionals and citizens alike.
A User's Guide has been provided at the end of this profile (see Appendix B). This guide should aid in
the interpretation of the tables and figures for Levels of Significant Exposure and the MRLs.
3.2.1 Inhalation Exposure 3.2.1.1 Death
No studies were located regarding lethality in humans or animals after inhalation exposure to perchlorate.
3.2.1.2 Systemic Effects
No studies were located regarding respiratory, cardiovascular, gastrointestinal, musculoskeletal, dermal,
or ocular effects in humans or animals after inhalation exposure to perchlorate.
29 PERCHLORATES
3. HEALTH EFFECTS
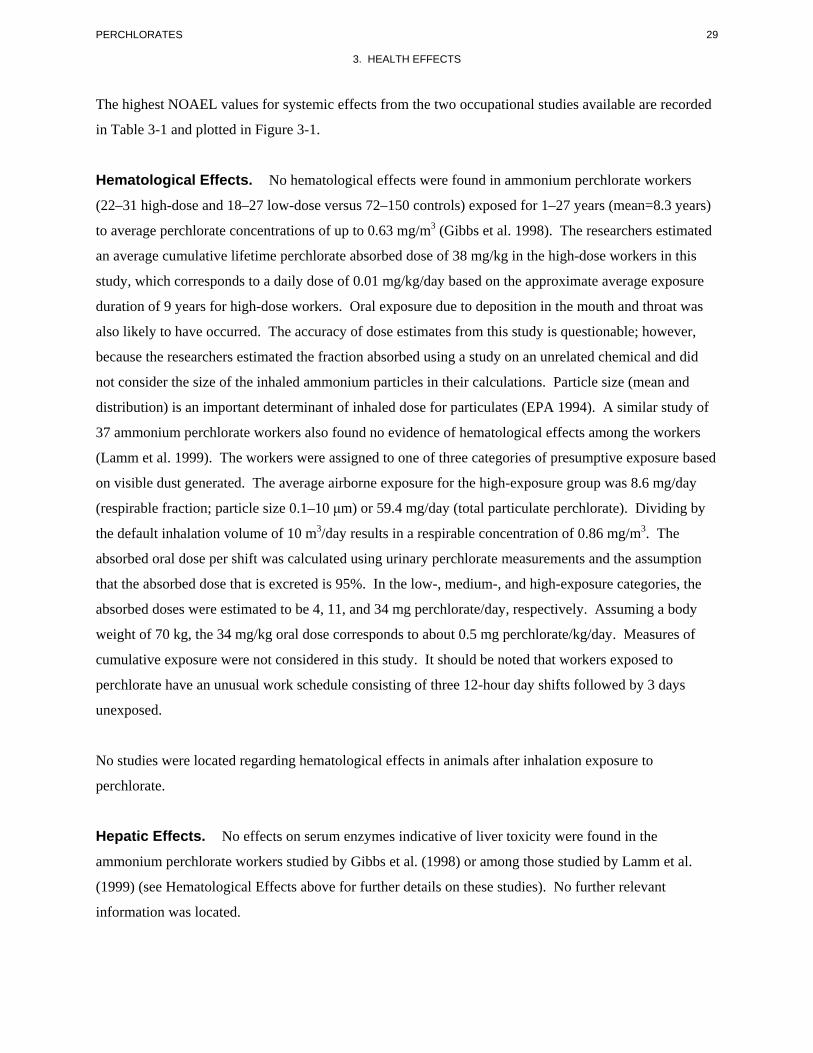
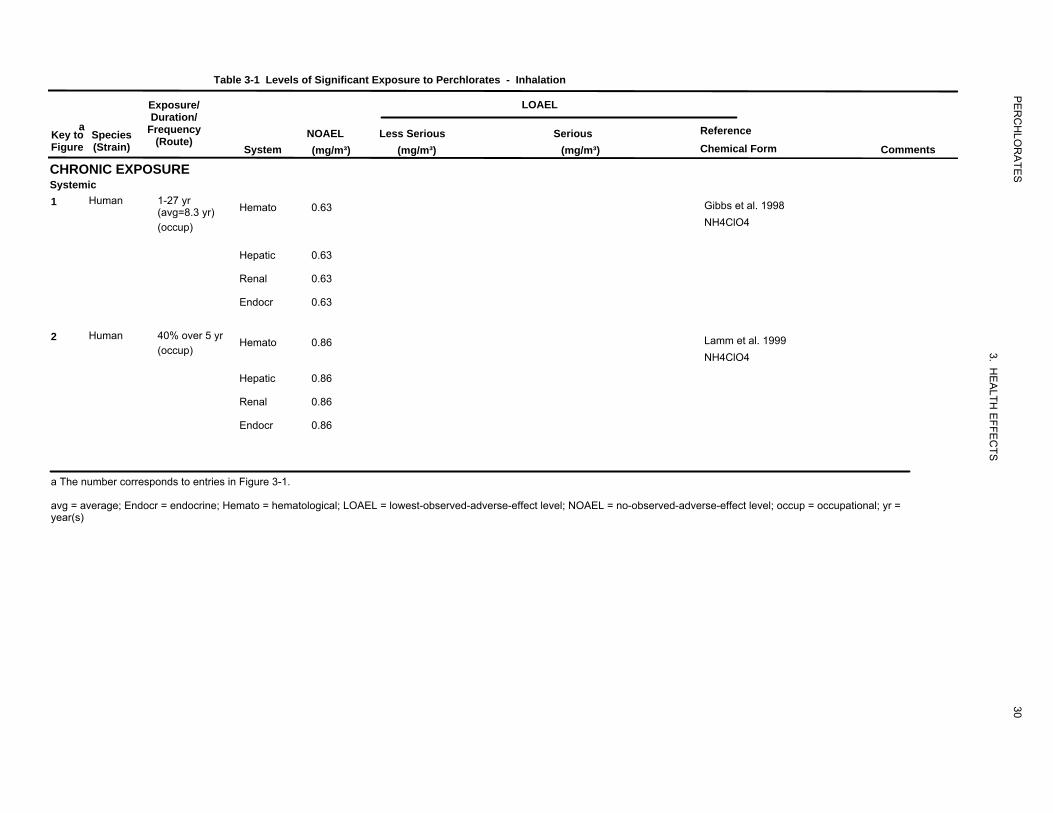
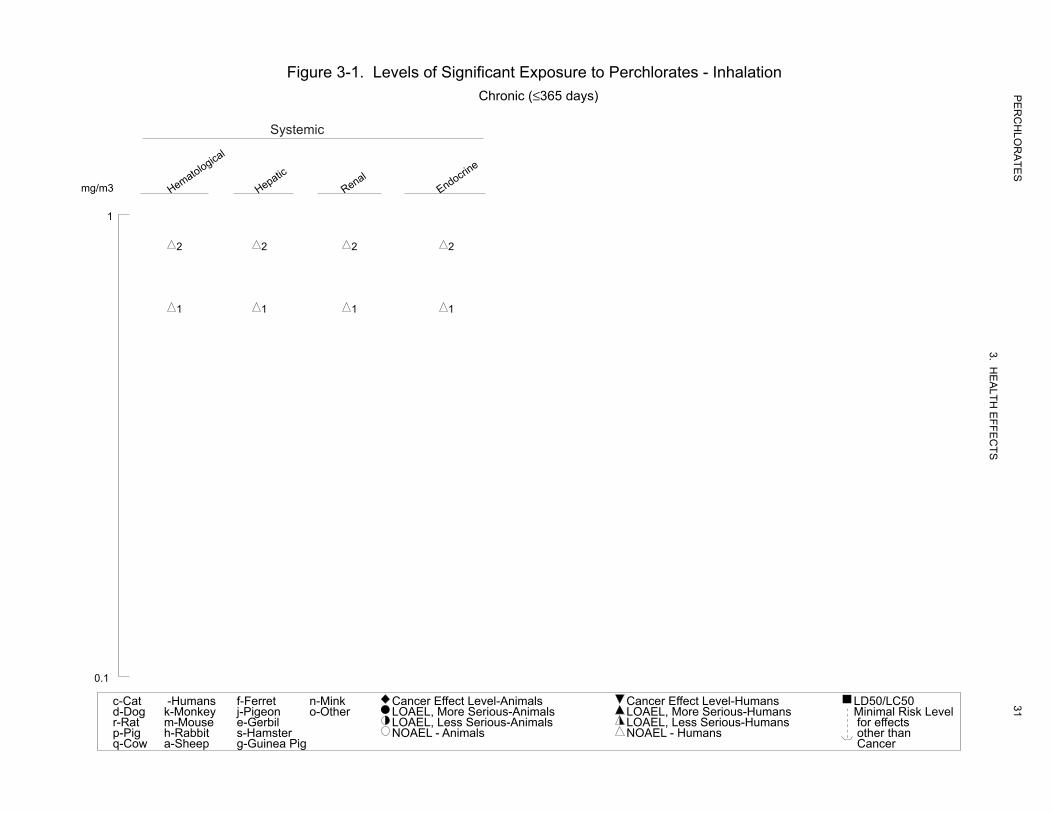
The highest NOAEL values for systemic effects from the two occupational studies available are recorded
in Table 3-1 and plotted in Figure 3-1.
Hematological Effects. No hematological effects were found in ammonium perchlorate workers
(22–31 high-dose and 18–27 low-dose versus 72–150 controls) exposed for 1–27 years (mean=8.3 years)
to average perchlorate concentrations of up to 0.63 mg/m3 (Gibbs et al. 1998). The researchers estimated
an average cumulative lifetime perchlorate absorbed dose of 38 mg/kg in the high-dose workers in this
study, which corresponds to a daily dose of 0.01 mg/kg/day based on the approximate average exposure
duration of 9 years for high-dose workers. Oral exposure due to deposition in the mouth and throat was
also likely to have occurred. The accuracy of dose estimates from this study is questionable; however,
because the researchers estimated the fraction absorbed using a study on an unrelated chemical and did
not consider the size of the inhaled ammonium particles in their calculations. Particle size (mean and
distribution) is an important determinant of inhaled dose for particulates (EPA 1994). A similar study of
37 ammonium perchlorate workers also found no evidence of hematological effects among the workers
(Lamm et al. 1999). The workers were assigned to one of three categories of presumptive exposure based
on visible dust generated. The average airborne exposure for the high-exposure group was 8.6 mg/day
(respirable fraction; particle size 0.1–10 μm) or 59.4 mg/day (total particulate perchlorate). Dividing by
the default inhalation volume of 10 m3/day results in a respirable concentration of 0.86 mg/m3. The
absorbed oral dose per shift was calculated using urinary perchlorate measurements and the assumption
that the absorbed dose that is excreted is 95%. In the low-, medium-, and high-exposure categories, the
absorbed doses were estimated to be 4, 11, and 34 mg perchlorate/day, respectively. Assuming a body
weight of 70 kg, the 34 mg/kg oral dose corresponds to about 0.5 mg perchlorate/kg/day. Measures of
cumulative exposure were not considered in this study. It should be noted that workers exposed to
perchlorate have an unusual work schedule consisting of three 12-hour day shifts followed by 3 days
unexposed.
No studies were located regarding hematological effects in animals after inhalation exposure to
perchlorate.
Hepatic Effects. No effects on serum enzymes indicative of liver toxicity were found in the
ammonium perchlorate workers studied by Gibbs et al. (1998) or among those studied by Lamm et al.
(1999) (see Hematological Effects above for further details on these studies). No further relevant
information was located.
126
0.63
0.63
0.63
0.63
211
0.86
0.86
0.86
0.86
Table 3-1 Levels of Significant Exposure to Perchlorates - Inhalation
Exposure/ LOAEL Duration/
Key toa
Species Frequency NOAEL Less Serious Serious Reference Figure (Strain) (Route)
System (mg/m³) (mg/m³) (mg/m³) Chemical Form Comments
CHRONIC EXPOSURE Systemic 1 Human 1-27 yr Hemato 0.63 Gibbs et al. 1998(avg=8.3 yr)
(occup) NH4ClO4
Hepatic 0.63
Renal 0.63
Endocr 0.63
2 Human 40% over 5 yr Hemato 0.86 Lamm et al. 1999 (occup) NH4ClO4
Hepatic 0.86
Renal 0.86
Endocr 0.86
a The number corresponds to entries in Figure 3-1.
avg = average; Endocr = endocrine; Hemato = hematological; LOAEL = lowest-observed-adverse-effect level; NOAEL = no-observed-adverse-effect level; occup = occupational; yr = year(s)
PE
RC
HLO
RA
TES
3. HE
ALTH
EFFE
CTS
30
lacigolotameH citapeH
laneR
enircodnE
Figure 3-1. Levels of Significant Exposure to Perchlorates - InhalationChronic (≤365 days)
Systemic
mg/m3
1
2 2 2 2
1 1 1 1
0.1
PE
RC
HLO
RA
TES
3. HE
ALTH
EFFE
CTS
31taC-cgoD-dtaR-rgiP-pwoC-q
snamuH-yeknoM-kesuoM-mtibbaR-hpeehS-a
terreF-fnoegiP-jlibreG-e
retsmaH-sgiPaeniuG-g
kniM-nrehtO-o
slaminA-leveLtceffErecnaCslaminA-suoireSeroM,LEAOLslaminA-suoireSsseL,LEAOL
slaminA-LEAON
snamuH-leveLtceffErecnaCsnamuH-suoireSeroM,LEAOLsnamuH-suoireSsseL,LEAOL
snamuH-LEAON
05CL/05DLleveLksiRlaminiM
stcefferofnahtrehto
recnaC
32 PERCHLORATES
3. HEALTH EFFECTS
No studies were located regarding hepatic effects in animals after inhalation exposure to perchlorate.
Renal Effects. No effects on serum enzymes indicative of kidney toxicity or in serum creatinine and
blood urea nitrogen (BUN) were found in the ammonium perchlorate workers evaluated by Gibbs et al.
(1998) or Lamm et al. (1999) (see Hematological Effects above for further details on these studies).
No studies were located regarding renal effects in animals after inhalation exposure to perchlorate.
Endocrine Effects. No significant effects on serum levels of TSH, total serum thyroxine (TT4), T3,
or free thyroxine index (FTI) were found among the ammonium perchlorate workers studied by Gibbs et
al. (1998). The mean airborne concentration of perchlorate to which the workers were exposed ranged
from 0.02 to 0.63 mg/m3. The researchers estimated that exposure to airborne perchlorate provided an
average cumulative lifetime absorbed dose of up to 0.01 mg perchlorate/kg/day for high-exposure
workers. Comparison of pre- and post-shift serum thyroid hormone measurements for individual workers
failed to find any evidence of a transient effect associated with daily exposure. In the occupational-
exposure study conducted by Lamm et al. (1999), there were also no significant alterations in serum TSH,
T3, T4, FTI, thyroid hormone binding ratio, or thyroid peroxidase antibody concentrations among the
workers. In this study, it was estimated that the high-exposure workers, who were exposed to an average
of 0.86 mg of respirable airborne perchlorate particles/m3, absorbed doses of approximately 0.5 mg
perchlorate/kg/day (see above under Hematological Effects for further details on these studies). A study
conducted in the same manufacturing facility studied by Lamm et al. (1999) found that intermittent, high
exposure to perchlorate for many years did not induce goiter or any evidence of hypothyroidism among
the workers as judged by no significant alterations in serum TSH or thyroglobulin even though iodine
uptakes were decreased during the work shift (Braverman et al. 2005). The median estimated absorbed
dose was 0.167 mg/kg/day, equivalent to drinking approximately 2 L of water containing 5 mg
perchlorate/L. It should be mentioned that perchlorate workers are exposed during an unusual schedule of
three 12-hour shifts followed by 3 days without exposure (long-time, intermittent exposure). Given the
relatively short elimination half-life of chlorine in workers of approximately 8 hours (Lamm et al. 1999),
perchlorate would not be expected to accumulate to levels that would cause thyroid problems.
No studies were located regarding endocrine effects in animals after inhalation exposure to perchlorate.
33 PERCHLORATES
3. HEALTH EFFECTS
No studies were located regarding the following effects in humans or animals after inhalation exposure to
perchlorate:
3.2.1.3 Immunological and Lymphoreticular Effects 3.2.1.4 Neurological Effects 3.2.1.5 Reproductive Effects 3.2.1.6 Developmental Effects 3.2.1.7 Cancer
3.2.2 Oral Exposure
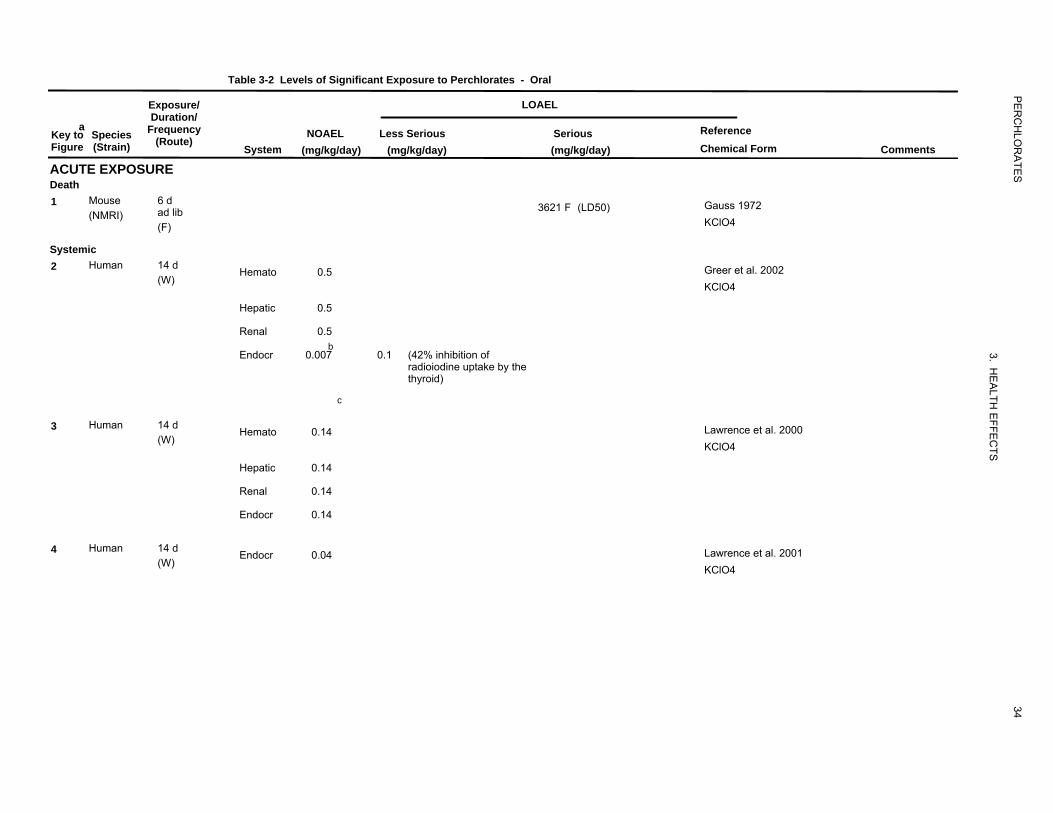
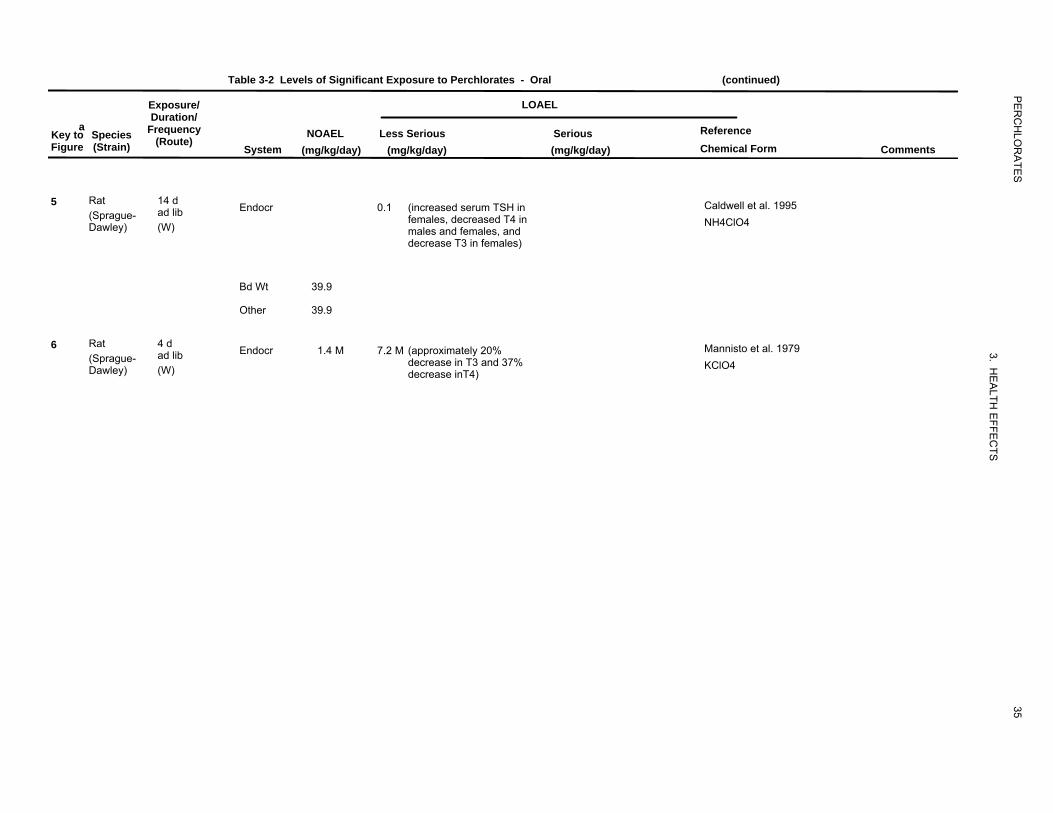
NOAEL and LOAEL values in Table 3-2 and Figure 3-2 represent amounts of the perchlorate anion, not
of the perchlorate salt.
3.2.2.1 Death
Several cases of human deaths were reported among hyperthyroid patients treated with potassium
perchlorate (Barzilai and Sheinfeld 1966; Fawcett and Clarke 1961; Gjemdal 1963; Hobson 1961;
Johnson and Moore 1961; Krevans et al. 1962). Deaths were due to aplastic anemia or severe
agranulocytosis and were considered to be causally related to potassium perchlorate. The lethal doses in
these patients were in the low-to-moderate range of doses employed in thyrotoxicosis therapy: 600–
1,000 mg potassium perchlorate/day, or roughly 5–12 mg perchlorate/kg/day. The patients had received
treatment for anywhere between 2 and 8 months. All of the deaths were females (Graves’ disease, the
most common cause of hyperthyroidism, is far more common in women than in men) and their ages
ranged from 24 to 82 years.
Gauss (1972) reported an LD50 dietary concentration of 3.55% (approximately 3,621 mg
perchlorate/kg/day) for potassium perchlorate in mice exposed for up to 30 days. The first deaths
occurred within 4 days of the start of treatment. The LD50 value for mice is recorded in Table 3-2 and
plotted in Figure 3-2.
3.2.2.2 Systemic Effects
The highest NOAEL values and all LOAEL values from each reliable study for systemic effects in each
species and duration category are recorded in Table 3-2 and plotted in Figure 3-2.
36
3621
227
0.5
0.5
0.5
0.007
0.1
213
0.14
0.14
0.14
0.14
214
0.04
Table 3-2 Levels of Significant Exposure to Perchlorates - Oral
Exposure/ Duration/
Key toa
Species Frequency Figure (Strain) (Route)
ACUTE EXPOSURE Death 1 Mouse 6 d
(NMRI) ad lib (F)
Systemic 2 Human 14 d
(W)
3 Human 14 d (W)
4 Human 14 d (W)
System
Hemato
Hepatic
Renal
Endocr
Hemato
Hepatic
Renal
Endocr
Endocr
LOAEL
NOAEL Less Serious Serious Reference
(mg/kg/day) (mg/kg/day) (mg/kg/day) Chemical Form Comments
3621 F (LD50) Gauss 1972 KClO4
0.5 Greer et al. 2002
KClO4
0.5
0.5 b
c
0.007 0.1 (42% inhibition ofradioiodine uptake by thethyroid)
0.14 Lawrence et al. 2000
KClO4
0.14
0.14
0.14
0.04 Lawrence et al. 2001
KClO4
PE
RC
HLO
RA
TES
3. HE
ALTH
EFFE
CTS
34
2260.1
39.9
39.9
9
1.4
7.2
Table 3-2 Levels of Significant Exposure to Perchlorates - Oral (continued)
a Key to Species Figure (Strain)
5 Rat (Sprague-Dawley)
6 Rat (Sprague-Dawley)
Exposure/ LOAEL Duration/
Frequency NOAEL Less Serious Serious Reference (Route)
System (mg/kg/day) (mg/kg/day) (mg/kg/day) Chemical Form Comments
14 d ad lib Endocr 0.1 (increased serum TSH in Caldwell et al. 1995
females, decreased T4 in NH4ClO4(W) males and females, anddecrease T3 in females)
Bd Wt 39.9
Other 39.9
4 d ad lib Endocr 1.4 M 7.2 M (approximately 20% Mannisto et al. 1979
decrease in T3 and 37% KClO4(W) decrease inT4)
PE
RC
HLO
RA
TES
3. HE
ALTH
EFFE
CTS
35
200
8.5
8.5
8.5
8.5
8.5
8.5
8.5
0.009
8.5
8.5
8.5
8.5
2290.09
224
0.05
0.2
Table 3-2 Levels of Significant Exposure to Perchlorates - Oral (continued)
Exposure/ LOAELDuration/
a Frequency ReferenceKey to Species (Route) NOAEL Less Serious Serious
Figure (Strain) System (mg/kg/day) (mg/kg/day) (mg/kg/day) Chemical Form Comments
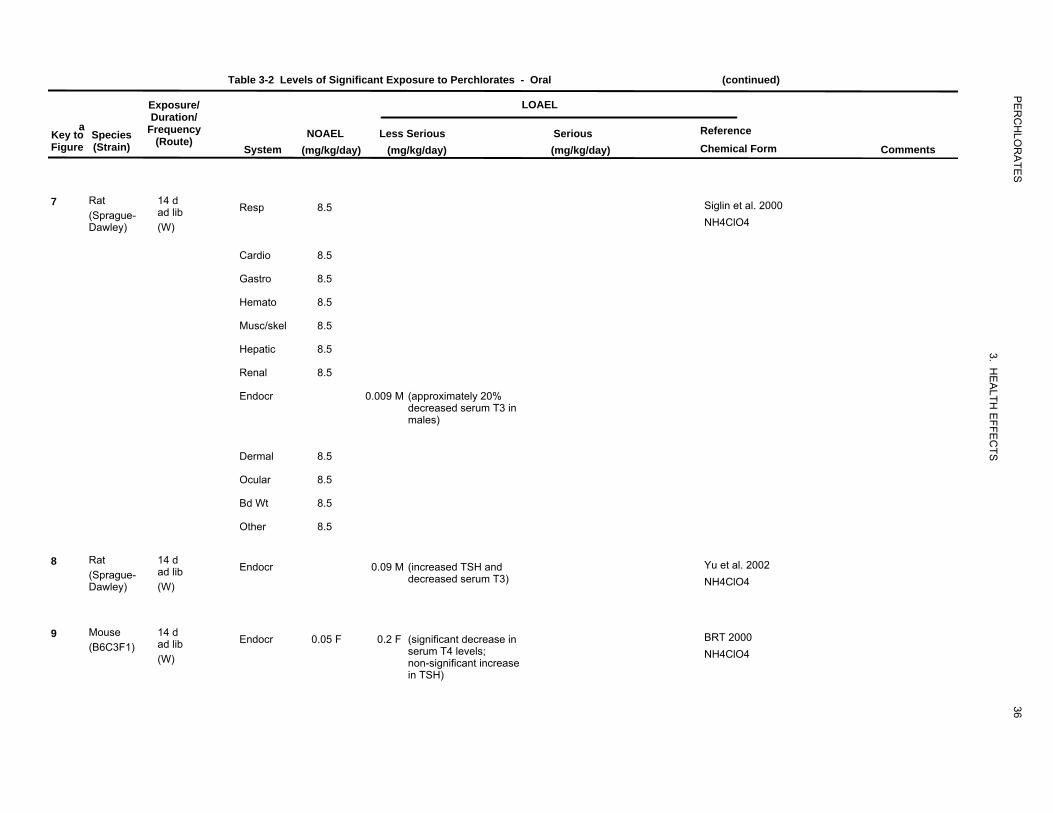
7 Rat 14 d ad lib Resp 8.5 Siglin et al. 2000
(Sprague-Dawley) (W) NH4ClO4
Cardio 8.5
Gastro 8.5
Hemato 8.5
Musc/skel 8.5
Hepatic 8.5
Renal 8.5
Endocr 0.009 M (approximately 20%decreased serum T3 in males)
Dermal 8.5
Ocular 8.5
Bd Wt 8.5
Other 8.5
8 Rat 14 d Endocr 0.09 M (increased TSH and Yu et al. 2002 (Sprague- ad lib decreased serum T3) NH4ClO4Dawley) (W)
9 Mouse 14 d Endocr 0.05 F 0.2 F (significant decrease in BRT 2000 (B6C3F1) ad lib serum T4 levels; NH4ClO4(W) non-significant increase
in TSH)
PE
RC
HLO
RA
TES
3. HE
ALTH
EFFE
CTS
36
218
25.5
25.5
25.5
2.6
25.5
25.5
2220.05
219
25.5
202
8.5
21
532
Table 3-2 Levels of Significant Exposure to Perchlorates - Oral (continued)
Exposure/ LOAELDuration/
Key toa
Species Frequency NOAEL Less Serious Serious Reference Figure (Strain) (Route)
System (mg/kg/day) (mg/kg/day) (mg/kg/day) Chemical Form Comments
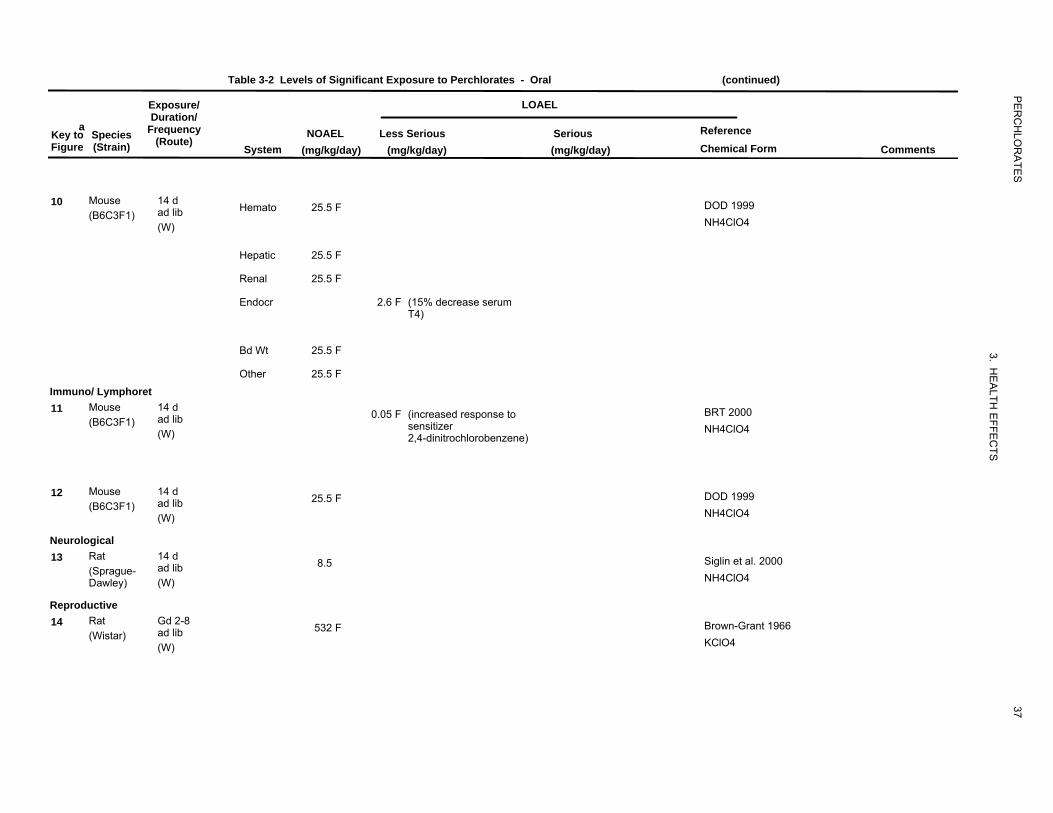
10 Mouse 14 d (B6C3F1) ad lib Hemato 25.5 F DOD 1999
(W) NH4ClO4
Hepatic 25.5 F
Renal 25.5 F
Endocr 2.6 F (15% decrease serumT4)
Bd Wt 25.5 F
Other 25.5 F
Immuno/ Lymphoret Mouse 14 d11 (B6C3F1) ad lib 0.05 F (increased response to BRT 2000
sensitizer NH4ClO4(W) 2,4-dinitrochlorobenzene)
12 Mouse 14 d 25.5 F DOD 1999 (B6C3F1) ad lib
(W) NH4ClO4
Neurological 13 Rat 14 d 8.5 Siglin et al. 2000
(Sprague- ad lib NH4ClO4Dawley) (W)
Reproductive 14 Rat Gd 2-8 532 F Brown-Grant 1966ad lib(Wistar)
(W) KClO4
PE
RC
HLO
RA
TES
3. HE
ALTH
EFFE
CTS
37

20
1752
203
8.5
1249
314
0.04
34
64
64
64
Table 3-2 Levels of Significant Exposure to Perchlorates - Oral (continued)
Exposure/ LOAEL Duration/
Key toa
Species Frequency NOAEL Less Serious Serious Reference Figure (Strain) (Route)
System (mg/kg/day) (mg/kg/day) (mg/kg/day) Chemical Form Comments
15 Rat Gd 1-13 (Wistar) ad lib 1752 F
(W)
16 Rat 14 d (Sprague- ad lib 8.5
Dawley) (W)
INTERMEDIATE EXPOSURE Systemic 17 Human 4 wk Endocr 9 M (decreased thyroid I and
(IN) serum TSH)
18 Human 6 mo 1 x/d Endocr 0.04
(C)
19 Rat 19 wk (Wistar) ad lib Hepatic 64 M
(F)
Endocr 64 M (thyroid weight doubled; 24% decrease in serum T4; 100% increase in TSH)
Bd Wt 64 M
Brown-Grant and Sherwood 1971 KClO4
Siglin et al. 2000 NH4ClO4
Brabant et al. 1992 KClO4
Braverman et al. 2006 The NOAEL is for thyroid function.KClO4
Hiasa et al. 1987 KClO4
PE
RC
HLO
RA
TES
3. HE
ALTH
EFFE
CTS
38
50
2327
2327
2327
2327
15175
175
175
307359
Table 3-2 Levels of Significant Exposure to Perchlorates - Oral (continued)
a Key to Species Figure (Strain)
20 Rat (Wistar)
21 Rat (Wistar)
22 Rat (Wistar)
Exposure/ Duration/
Frequency (Route)
6 wk ad lib (W)
25 d ad lib (W)
45 d 1 x/d (G)
LOAEL
NOAEL Less Serious Serious Reference
System (mg/kg/day) (mg/kg/day) (mg/kg/day) Chemical Form Comments
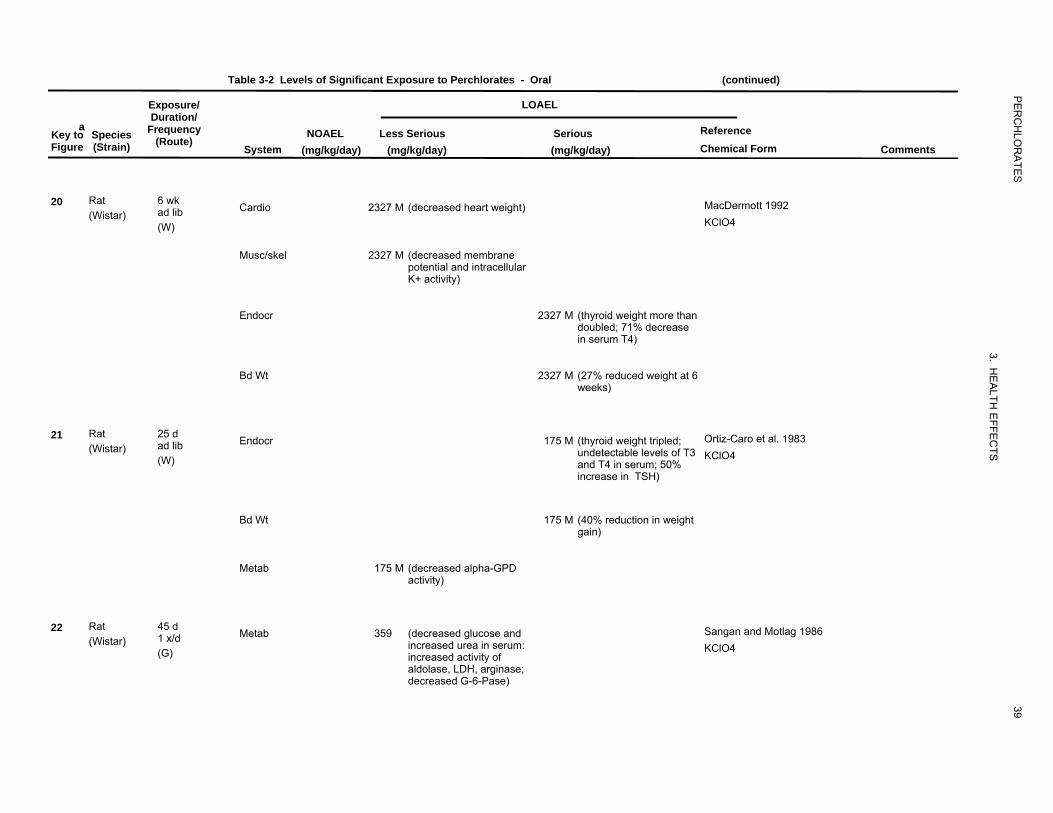
Cardio 2327 M (decreased heart weight) MacDermott 1992 KClO4
Musc/skel 2327 M (decreased membrane potential and intracellular K+ activity)
Endocr 2327 M (thyroid weight more than doubled; 71% decrease in serum T4)
Bd Wt 2327 M (27% reduced weight at 6 weeks)
Endocr 175 M (thyroid weight tripled; Ortiz-Caro et al. 1983 undetectable levels of T3 KClO4 and T4 in serum; 50% increase in TSH)
Bd Wt 175 M (40% reduction in weight gain)
Metab 175 M (decreased alpha-GPD activity)
Metab 359 (decreased glucose and Sangan and Motlag 1986 increased urea in serum: KClO4 increased activity of aldolase, LDH, arginase; decreased G-6-Pase)
PE
RC
HLO
RA
TES
3. HE
ALTH
EFFE
CTS
39
531059
204
8.5
8.5
8.5
8.5
8.5
8.5
8.5
0.009
8.5
8.5
8.5
8.5
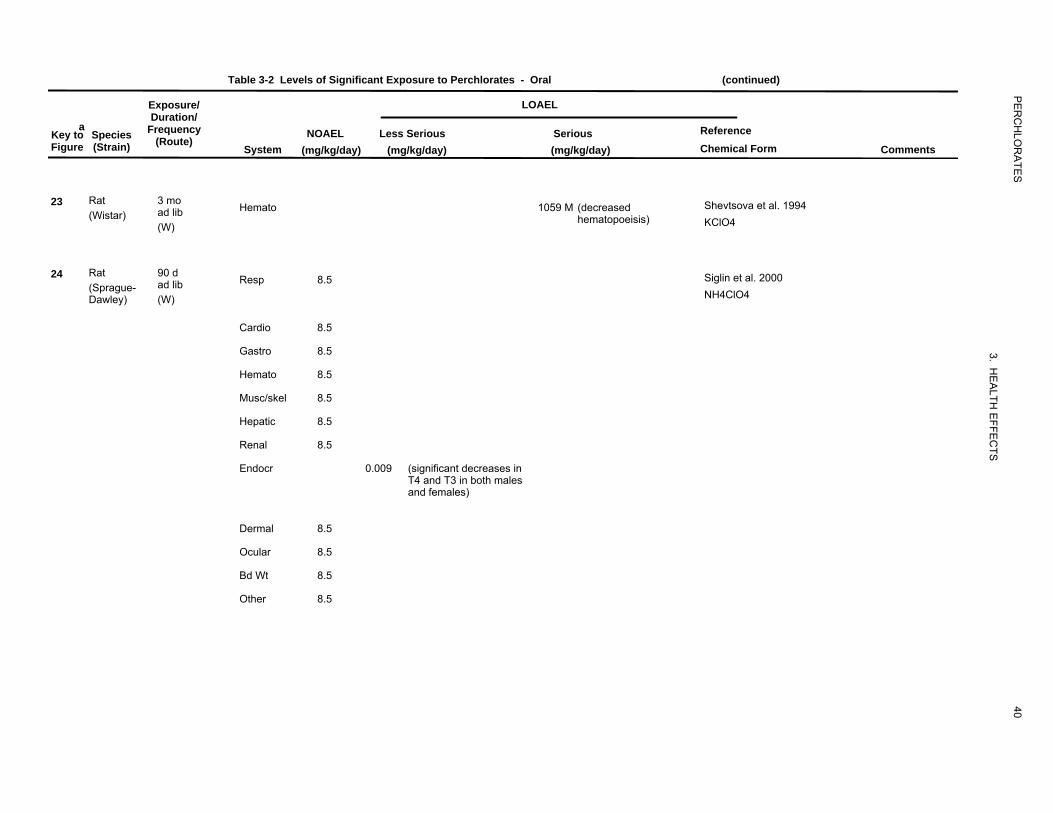
Table 3-2 Levels of Significant Exposure to Perchlorates - Oral (continued)
Exposure/ LOAEL Duration/
Key toa
Species Frequency NOAEL Less Serious Serious Reference Figure (Strain) (Route)
System (mg/kg/day) (mg/kg/day) (mg/kg/day) Chemical Form Comments
23 Rat 3 mo Shevtsova et al. 1994ad lib Hemato 1059 M (decreased(Wistar)
(W) hematopoeisis) KClO4
24 Rat 90 d ad lib Resp 8.5 Siglin et al. 2000
(Sprague-Dawley) (W) NH4ClO4
Cardio 8.5
Gastro 8.5
Hemato 8.5
Musc/skel 8.5
Hepatic 8.5
Renal 8.5
Endocr 0.009 (significant decreases inT4 and T3 in both males and females)
Dermal 8.5
Ocular 8.5
Bd Wt 8.5
Other 8.5
PE
RC
HLO
RA
TES
3. HE
ALTH
EFFE
CTS
40

45406
228
0.26
2.6
25.5
25.5
238
0.26
2.6
25.5
0.26
Table 3-2 Levels of Significant Exposure to Perchlorates - Oral (continued)
a Key to Species Figure (Strain)
25 Rat (Wistar)
26 Rat (Sprague-Dawley)
27 Rat (Sprague-Dawley)
Exposure/ LOAEL Duration/
Frequency NOAEL Less Serious Serious Reference (Route)
System (mg/kg/day) (mg/kg/day) (mg/kg/day) Chemical Form Comments
45 d 1 x/d Metab 406 M (decreased activity of Vijayalakshmi and Motlag
lipase, phospholipase A; 1989a(G) decreased free fatty NaClO4
acids; increasedcholesterol, triglycerides,phospholipids)
>19 wk ad lib Endocr 0.26 2.6 (increased absolute and York et al. 2001a
relative thyroid weight in NH4ClO4(W) both sexes; hypertrophyand hyperplasia in males;increased TSH)
Bd Wt 25.5
Other 25.5
16 wk ad lib Endocr 0.26 2.6 (hypertrophy/hyperplasia York et al. 2001a
of the thyroid) NH4ClO4(W)
Bd Wt 25.5
Other 0.26 M (decreased waterconsumption)
PE
RC
HLO
RA
TES
3. HE
ALTH
EFFE
CTS
41
320
0.009
0.09
25.5
25.5
3110.009
25.5
225
0.02
0.05
220
25.5
25.5
25.5
0.09
0.85
25.5
25.5
25.5
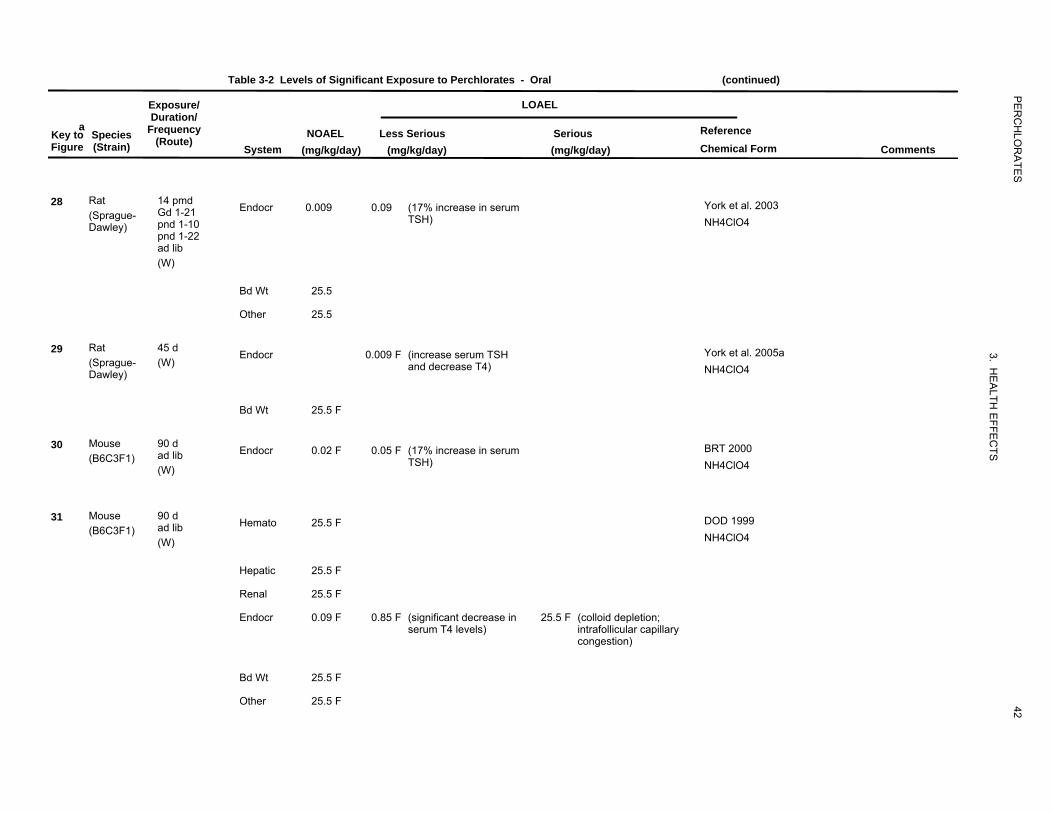
Table 3-2 Levels of Significant Exposure to Perchlorates - Oral (continued)
a Key to Species Figure (Strain)
28 Rat (Sprague-Dawley)
29 Rat (Sprague-Dawley)
30 Mouse (B6C3F1)
31 Mouse (B6C3F1)
Exposure/ Duration/
Frequency (Route)
14 pmd Gd 1-21 pnd 1-10 pnd 1-22 ad lib (W)
45 d (W)
90 d ad lib (W)
90 d ad lib (W)
System
Endocr
Bd Wt
Other
Endocr
Bd Wt
Endocr
Hemato
Hepatic
Renal
Endocr
Bd Wt
Other
LOAEL
NOAEL Less Serious Serious Reference
(mg/kg/day) (mg/kg/day) (mg/kg/day) Chemical Form Comments
0.009 0.09 (17% increase in serum York et al. 2003TSH) NH4ClO4
25.5
25.5
0.009 F (increase serum TSH York et al. 2005aand decrease T4) NH4ClO4
25.5 F
0.02 F 0.05 F (17% increase in serum BRT 2000TSH) NH4ClO4
25.5 F DOD 1999
NH4ClO4
25.5 F
25.5 F
0.09 F 0.85 F (significant decrease in 25.5 F (colloid depletion; serum T4 levels) intrafollicular capillary
congestion)
25.5 F
25.5 F
PE
RC
HLO
RA
TES
3. HE
ALTH
EFFE
CTS
42
521750
23531
19
3811
3811
3811
205
8.5
223
0.02
0.05
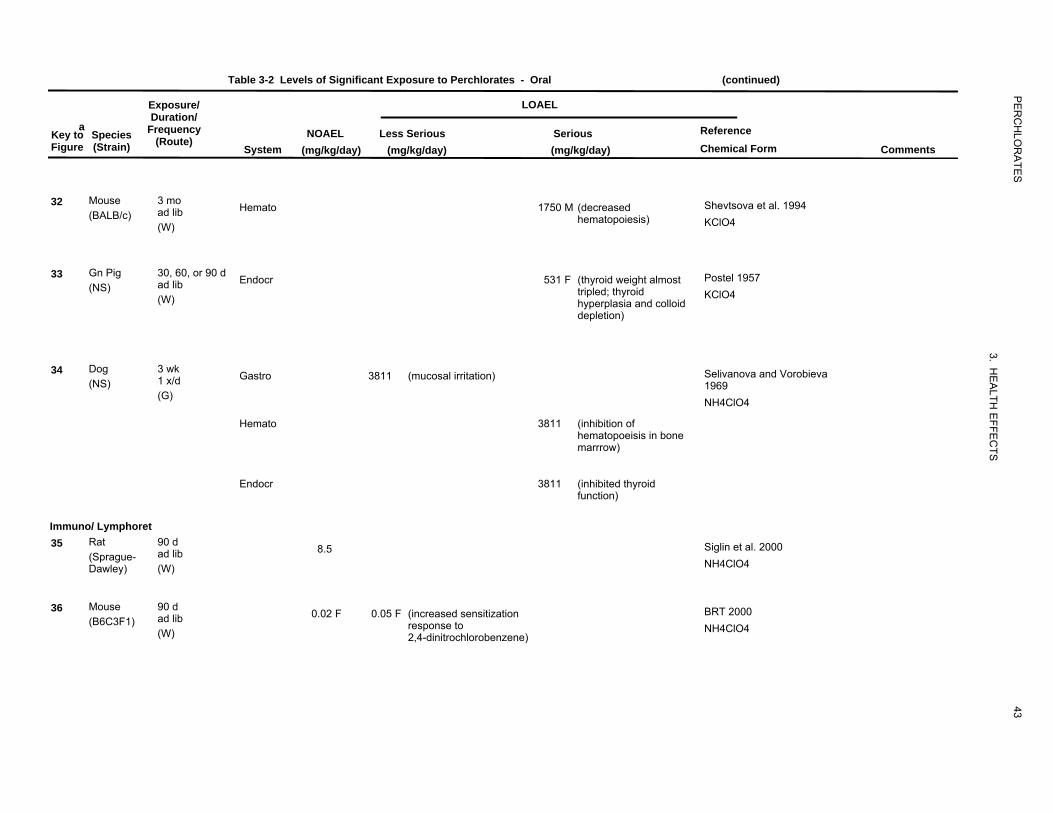
Table 3-2 Levels of Significant Exposure to Perchlorates - Oral (continued)
Exposure/ LOAELDuration/
Key toa
Species Frequency NOAEL Less Serious Serious Reference Figure (Strain) (Route)
System (mg/kg/day) (mg/kg/day) (mg/kg/day) Chemical Form Comments
32 Mouse 3 mo Shevtsova et al. 1994 (BALB/c) ad lib Hemato 1750 M (decreased
hematopoiesis) KClO4(W)
33 Gn Pig 30, 60, or 90 d Endocr 531 F (thyroid weight almost Postel 1957 (NS) ad lib tripled; thyroid
(W) hyperplasia and colloid KClO4
depletion)
34 Dog 3 wk Gastro 3811 (mucosal irritation) Selivanova and Vorobieva (NS) 1 x/d 1969
(G) NH4ClO4
Hemato 3811 (inhibition of hematopoeisis in bone marrrow)
Endocr 3811 (inhibited thyroid function)
Immuno/ Lymphoret 35 Rat 90 d Siglin et al. 2000
(Sprague- ad lib 8.5
Dawley) (W) NH4ClO4
Mouse 90 d36 (B6C3F1) ad lib 0.02 F 0.05 F (increased sensitization BRT 2000
response to NH4ClO4(W) 2,4-dinitrochlorobenzene)
PE
RC
HLO
RA
TES
3. HE
ALTH
EFFE
CTS
43

221
25.5
206
8.5
207
8.5
209
25.5
310
25.5
215
8.5
Table 3-2 Levels of Significant Exposure to Perchlorates - Oral (continued)
a Key to Species Figure (Strain)
37 Mouse (B6C3F1)
Neurological 38 Rat
(Sprague-Dawley)
Reproductive 39 Rat
(Sprague-Dawley)
40 Rat (Sprague-Dawley)
41 Rat (Sprague-Dawley)
Developmental 42 Rat
(Sprague-Dawley)
Exposure/ LOAEL Duration/
Frequency NOAEL Less Serious Serious Reference (Route)
System (mg/kg/day) (mg/kg/day) (mg/kg/day) Chemical Form Comments
90 d DOD 1999ad lib 25.5 F
(W) NH4ClO4
90 d 8.5 Siglin et al. 2000ad lib (W) NH4ClO4
90 d 8.5 Siglin et al. 2000ad lib (W) NH4ClO4
16 wk 25.5 York et al. 2001aad lib (W) NH4ClO4
45 d 25.5 F York et al. 2005a The NOAEL is for (W) standard reproductiveNH4ClO4 end points assessed at
parturition.
2 wk pmd Bekkedal et al. 2000Gd 1-21 8.5
pnd 1-10 NH4ClO4ad lib
(W)
PE
RC
HLO
RA
TES
3. HE
ALTH
EFFE
CTS
44

2411
210
0.26
2.6
216
0.85
25.5
3190.009
Table 3-2 Levels of Significant Exposure to Perchlorates - Oral (continued)
a Key to Species Figure (Strain)
43 Rat (Sprague-Dawley)
44 Rat (Sprague-Dawley)
45 Rat (Sprague-Dawley)
46 Rat (Sprague-Dawley)
Exposure/ LOAEL Duration/
Frequency NOAEL Less Serious Serious Reference (Route)
System (mg/kg/day) (mg/kg/day) (mg/kg/day) Chemical Form Comments
31 d Gd 2-21 1 (increased TSH and Mahle et al. 2003
pnd 1-10 decreased T4 in pups NH4ClO4ad lib exposed via maternal
milk)(W)
16 wk York et al. 2001aad lib 0.26 2.6 (thyroid hypertrophy andhyperplasia in F1 NH4ClO4(W) females and in F2 malesand females)
15 pmd 0.85 25.5 (delayed sternal and York et al. 2003Gd 1-21 ad lib phalanges ossification) NH4ClO4 (W)
14 pmd 0.009 (decreased T3 in fetuses; York et al. 2003Gd 1-21 pnd 1-10 increased absolute NH4ClO4pnd 1-22 thyroid weight in
ad lib 10-day-old pups;increased TSH and
(W) decreased T4 in22-day-old pups;increased cerebellumthickness in 22-day-oldpups)
PE
RC
HLO
RA
TES
3. HE
ALTH
EFFE
CTS
45

212
2.6
8.5
3120.009
313
25.5
22531
5472
Table 3-2 Levels of Significant Exposure to Perchlorates - Oral (continued)
Exposure/ LOAELDuration/
Key toa
Species Frequency NOAEL Less Serious Serious Reference Figure (Strain) (Route)
System (mg/kg/day) (mg/kg/day) (mg/kg/day) Chemical Form Comments
47 Rat 31 d 2.6 8.5 (hypertrophy/hyperplasia York et al. 2004
Dawley) Ld 1-10 NH4ClO4(Sprague- Gd 1-21 of follicular epithelium
ad lib and decrease in folliclesize in pups on pnd 5)
(W)
48 Rat 45 d 0.009 (increased TSH and York et al. 2005a (Sprague- (W) decreased T4 in pups; NH4ClO4Dawley) decreased T3 in fetuses)
49 Rat 31-45 d 25.5 York et al. 2005b NOAEL is for brain (Sprague- (W) morphometry. A Dawley) NH4ClO4 NOAEL of 8.5
mg/kg/day was defined for motor activity (25.5 mg/kg/day not tested).
50 Gn Pig Gd 21-48 Postel 1957ad lib 531 (increased weight of fetal(NS) thyroid and hyperplasia KClO4(W) in fetal thyroid)
51 Rabbit Gd 1-28 ad lib 72 (significantly enlarged Lampe et al. 1967
(NS) (F)
fetal thyroid and KClO4histological changes infetal thyroid )
PE
RC
HLO
RA
TES
3. HE
ALTH
EFFE
CTS
46
208
85
31928
64
1020
252573
315
0.0014
24
956
956
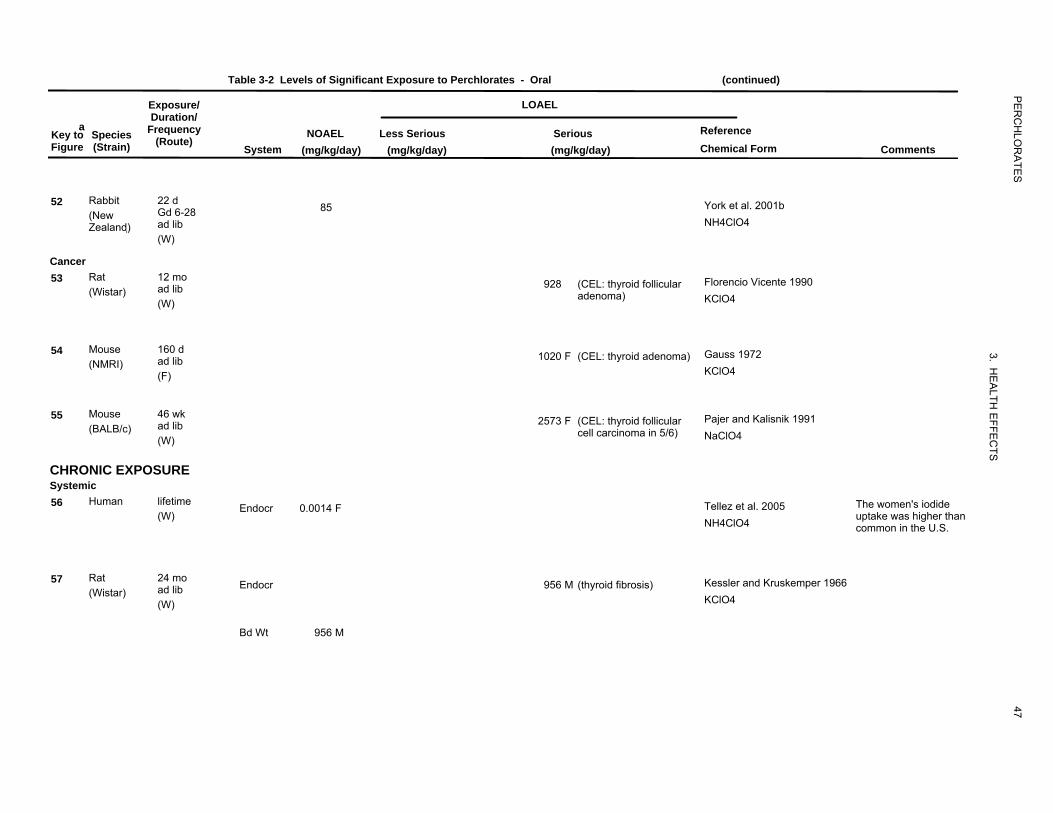
Table 3-2 Levels of Significant Exposure to Perchlorates - Oral (continued)
Exposure/ LOAELDuration/
a FrequencyKey to Species (Route)NOAEL Less Serious Serious Reference
Figure (Strain) System (mg/kg/day) (mg/kg/day) (mg/kg/day) Chemical Form Comments
52 Rabbit 22 d 85 York et al. 2001b (New Gd 6-28
Zealand)� ad lib NH4ClO4
(W)
Cancer 53 Rat 12 mo
ad lib 928 (CEL: thyroid follicular Florencio Vicente 1990(Wistar)
(W) adenoma) KClO4
54 Mouse 160 d Gauss 1972 (NMRI) ad lib 1020 F (CEL: thyroid adenoma)
(F) KClO4
Mouse 46 wk55 (BALB/c) ad lib 2573 F (CEL: thyroid follicular Pajer and Kalisnik 1991
cell carcinoma in 5/6) NaClO4(W)
CHRONIC EXPOSURE Systemic 56 Human lifetime Endocr 0.0014 F Tellez et al. 2005 The women's iodide
(W) uptake was higher thanNH4ClO4 common in the U.S.
57 Rat 24 mo ad lib Endocr 956 M (thyroid fibrosis) Kessler and Kruskemper 1966
(Wistar) (W) KClO4
Bd Wt 956 M
PE
RC
HLO
RA
TES
3. HE
ALTH
EFFE
CTS
47

28928
928
316
0.0014
63956
928
Table 3-2 Levels of Significant Exposure to Perchlorates - Oral (continued)
Exposure/ LOAELDuration/
a Frequency ReferenceKey to Species (Route)NOAEL Less Serious Serious
Figure (Strain) System (mg/kg/day) (mg/kg/day) (mg/kg/day) Chemical Form Comments
58 Rat 15 mo Toro Guillen 1991ad lib Endocr 928 (thyroid hypertrophy and(Wistar)
(W) hyperplasia) KClO4
Bd Wt 928 (unspecified decreasedweight gain)
Developmental 59 Human gestational 0.0014 Tellez et al. 2005
(W) NH4ClO4 Cancer 60 Rat 24 mo Kessler and Kruskemper 1966
(Wistar) ad lib 956 M (CEL: increased papillaryand/or follicular KClO4(W) adenomas in thyroid)
61
Rat 15 mo (Wistar) ad lib 928 (CEL: follicular and Toro Guillen 1991
papillary carcinoma of KClO4(W) thyroid)
29
a The number corresponds to entries in Figure 3-2.
b ATSDR has adopted the NAS chronic RfD of 0.0007 mg/kg/day for the chronic oral MRL. The RfD was calculated by dividing the NOEL of 0.007 mg/kg/day by an uncertainty factor of 10 (for the protection of sensitive populations).
c Although inhibition of iodide uptake is not considered adverse, this dose is shown to illustrate the dose at which the effect became statistically significant.
ad lib = ad libitum; Bd Wt = body weight; (C) = capsule; Cardio = cardiovascular; CEL = cancer effect level; d = day(s); Endocr = endocrine; (F) = food; F = female; (G) = gavage; Gastro = gastrointestinal; Gd = gestation day; GPD = glycerophosphate dehydrogenase; (GW) = gavage in water; (IN) = ingestion; Hemato = hematological; Ld = lactation day; LD50 = lethal dose, 50% kill; LDH = lactate dehydrogenase; LOAEL = lowest-observable-adverse-effect level; M = male; Metab = metabolic; mo = month; Musc/skel = musculoskeletal; NOAEL = no-observed-adverse-effect level; pmd = pre-mating day; pnd = post-natal day; Resp = respiratory; TSH = thyroid-stimulating hormone; (W) = drinking water; wk = week(s); x = times; yr = year(s)
PE
RC
HLO
RA
TES
3. HE
ALTH
EFFE
CTS
48

Death Respiratory
Cardiovascular
Gastrointestin
al
Hematological
Musculoske
letal
Hepatic
Renal Endocrin
e
Dermal
Ocular
Body Weight
Other Immuno/Lym
phor
Neurological
Reproductive
Figure 3-2 Levels of Significant Exposure to Perchlorates - OralAcute (≤14 days)
Systemic
mg/kg/day
PE
RC
HLO
RA
TES
3. HE
ALTH
EFFE
CTS
49
10000
1m
1000
100
10m 10m 10m
10 7r 7r 7r 7r 7r 7r 7r 7r 6r
10m
6r 1
2 2 2
9m 3 3 3 3
0.1 2 5r 8r 9m 4
0.01 7r 2
0.001
15r
14r
5r 5r10m 10m 12m
7r 7r 7r 13r 16r
11m
c-Catd-Dogr-Ratp-Pigq-Cow
-Humansk-Monkeym-Mouseh-Rabbita-Sheep
f-Ferretj-Pigeone-Gerbils-Hamsterg-Guinea Pig
n-Minko-Other
Cancer Effect Level-AnimalsLOAEL, More Serious-AnimalsLOAEL, Less Serious-AnimalsNOAEL - Animals
Cancer Effect Level-HumansLOAEL, More Serious-HumansLOAEL, Less Serious-HumansNOAEL - Humans
LD50/LC50Minimal Risk Levelfor effectsother thanCancer
Respiratory
Cardiovascular
Gastrointestin
al
Hematological
Musculoske
letal
Hepatic
Renal Endocrin
e
Dermal
Ocular
Body Weight
Metabolic
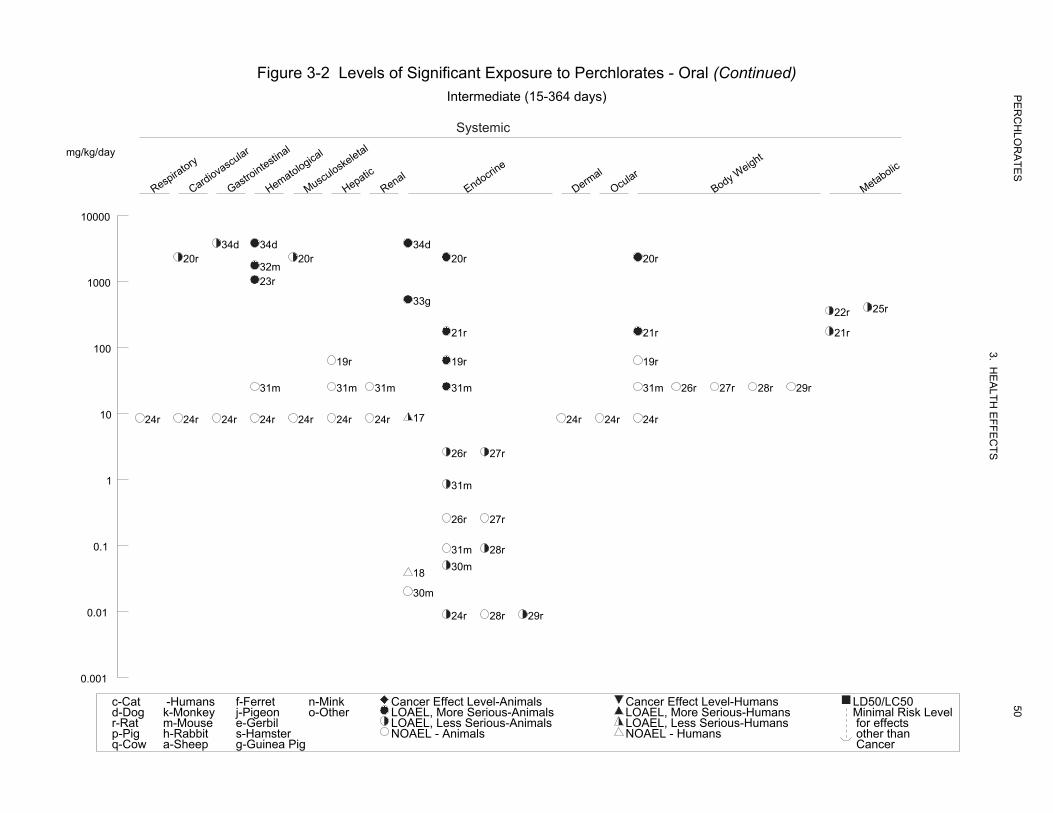
Figure 3-2 Levels of Significant Exposure to Perchlorates - Oral (Continued) Intermediate (15-364 days)
Systemic
mg/kg/day
10000
34d 34d 34d
c-Catd-Dogr-Ratp-Pig
-Humansk-Monkeym-Mouseh-Rabbit
f-Ferretj-Pigeone-Gerbils-Hamster
n-Minko-Other
LOAEL, Less Serious-AnimalsNOAEL - Animals
LOAEL, Less Serious-Humans for effects
Cancer Effect Level-AnimalsLOAEL, More Serious-Animals LOAEL, More Serious-Humans Minimal Risk Level
Cancer Effect Level-Humans
NOAEL - Humans
LD50/LC50
other thanCancer
20r 20r 20r 20r32m
1000 23r
33g25r22r
21r 21r 21r100
19r 19r 19r
31m 31m 31m 31m 31m 26r 27r 28r 29r
10 1724r 24r 24r 24r 24r 24r 24r 24r 24r 24r
26r 27r
1 31m
26r 27r
0.1 31m 28r 30m 18
30m
0.01 24r 28r 29r
0.001
q-Cow a-Sheep g-Guinea Pig
PE
RC
HLO
RA
TES
3. HE
ALTH
EFFE
CTS
50
Other Immuno/Lym
phor
Neurological
Reproductive
Developmental
Cancer *
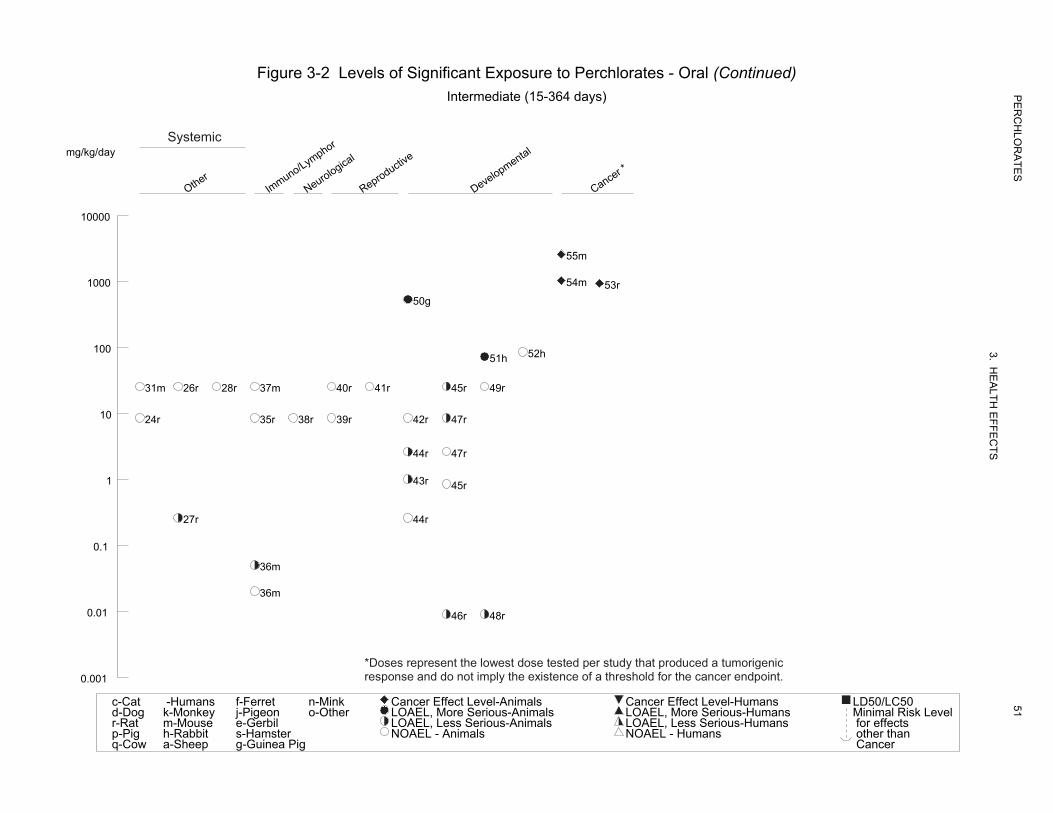
Figure 3-2 Levels of Significant Exposure to Perchlorates - Oral (Continued)Intermediate (15-364 days) P
ER
CH
LOR
ATE
S
3. HE
ALTH
EFFE
CTS
51
Systemic mg/kg/day
10000
55m
1000
c-Catd-Dogr-Ratp-Pig
-Humansk-Monkeym-Mouseh-Rabbit
f-Ferretj-Pigeone-Gerbils-Hamster
n-Minko-Other
LOAEL, Less Serious-AnimalsNOAEL - Animals
LOAEL, Less Serious-Humans for effects
Cancer Effect Level-AnimalsLOAEL, More Serious-Animals LOAEL, More Serious-Humans Minimal Risk Level
Cancer Effect Level-Humans
NOAEL - Humans
LD50/LC50
other thanCancer
54m 53r 50g
100 52h 51h
31m 26r 28r 37m 40r 41r 45r 49r
10 24r 35r 38r 39r 42r 47r
44r 47r
1 43r 45r
27r 44r
0.1
36m
36m
0.01 46r 48r
*Doses represent the lowest dose tested per study that produced a tumorigenicresponse and do not imply the existence of a threshold for the cancer endpoint. 0.001
q-Cow a-Sheep g-Guinea Pig
Endocrine
Body Weight
Developmental
Cancer *
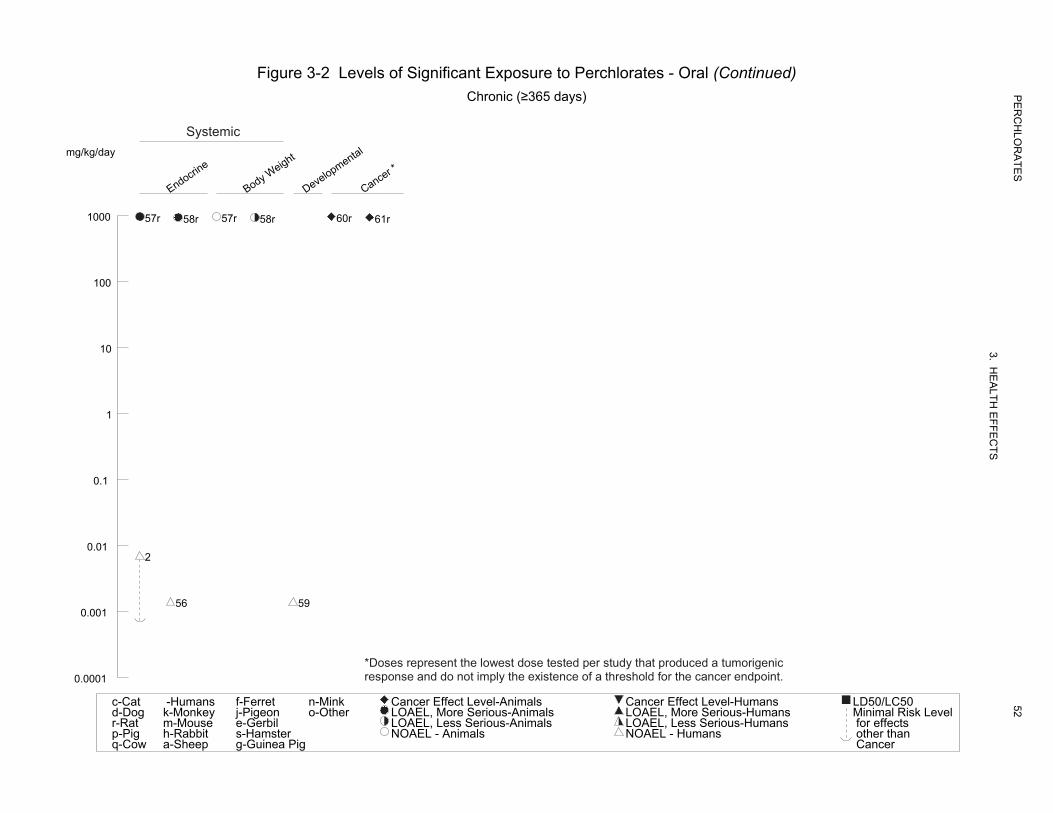
Figure 3-2 Levels of Significant Exposure to Perchlorates - Oral (Continued) Chronic (≥365 days)
Systemic mg/kg/day
1000 57r 58r 57r 60r58r 61r
100
10
1
0.1
0.01 2
56 59 0.001
*Doses represent the lowest dose tested per study that produced a tumorigenicresponse and do not imply the existence of a threshold for the cancer endpoint. 0.0001
c-Catd-Dogr-Ratp-Pigq-Cow
-Humansk-Monkeym-Mouseh-Rabbita-Sheep
f-Ferretj-Pigeone-Gerbils-Hamsterg-Guinea Pig
n-Minko-Other
Cancer Effect Level-AnimalsLOAEL, More Serious-AnimalsLOAEL, Less Serious-AnimalsNOAEL - Animals
Cancer Effect Level-HumansLOAEL, More Serious-HumansLOAEL, Less Serious-HumansNOAEL - Humans
LD50/LC50
for effectsother thanCancer
Minimal Risk Level
PE
RC
HLO
RA
TES
3. HE
ALTH
EFFE
CTS
52
53 PERCHLORATES
3. HEALTH EFFECTS
Respiratory Effects. No studies were located regarding respiratory effects in humans after oral
exposure to perchlorate. The only relevant information in animals is that from a study by Siglin et al.
(2000) in which no significant effects on lung weight and no gross or microscopic alterations were found
in the lungs from rats administered up to 8.5 mg perchlorate/kg/day (as ammonium perchlorate) in the
drinking water for up to 90 days.
Cardiovascular Effects. No studies were located regarding cardiovascular effects in humans after
oral exposure to perchlorate.
Absolute and relative heart weights were significantly decreased in rats treated with 2% potassium
perchlorate (approximately 2,327 mg perchlorate/kg/day) in the drinking water for 6 weeks (MacDermott
1992). No gross or microscopical alterations were observed in the heart of rats administered ammonium
perchlorate in the drinking water at doses of up to 8.5 mg perchlorate/kg/day for up to 90 days (Siglin et
al. 2000); the weight of the heart was also not affected by exposure to perchlorate.
Gastrointestinal Effects. No information was located regarding gastrointestinal effects of
perchlorate in healthy humans. Symptoms of gastrointestinal distress, including nausea and vomiting,
have been reported in a small percentage of cases of hyperthyroid patients treated with potassium
perchlorate (Crooks and Wayne 1960; Godley and Stanbury 1954). In a review of 250 cases, the
incidence of nausea was 1.5% (3/200) among patients given 600 or 1,000 mg potassium perchlorate/day
(approximately 6 or 10 mg perchlorate/kg/day) and 4% (2/50) among patients given 1,500 or 2,000 mg
potassium perchlorate/day (approximately 15 or 20 mg perchlorate/kg/day) (Crooks and Wayne 1960).
Although gastrointestinal distress was limited to nausea in most cases, there was one case of a 22-year-old
anorectic female Graves’ disease patient who experienced burning epigastric discomfort and frequent
vomiting within days of starting perchlorate treatment (600 mg potassium perchlorate/day or 6 mg
perchlorate/kg/day), and developed a ruptured duodenal ulcer a week later (Godley and Stanbury 1954).
Irritation of the gastric mucosa was reported in dogs given 3,811 mg perchlorate/kg/day as ammonium
perchlorate by gavage for 3 weeks (Selivanova and Vorobieva 1969). In rats administered up to 8.5 mg
perchlorate/kg/day as ammonium perchlorate in the drinking water for up to 90 days, there was no
evidence of gross or histological alterations of any section of the gastrointestinal tract (Siglin et al. 2000).
Hematological Effects. Two recent controlled acute exposure studies in euthyroid volunteers
provide information of hematological effects of perchlorate in humans. No alterations in hematological
54 PERCHLORATES
3. HEALTH EFFECTS
parameters (complete blood count and routine chemistries) were observed in a group of nine male
subjects who consumed once a day for 14 consecutive days a solution of potassium perchlorate that
provided 10 mg of perchlorate/day (Lawrence et al. 2000). Blood tests were repeated on days 7 and 14 of
dosing and 14 days after perchlorate was discontinued. Assuming a body weight of 70 kg, the perchlorate
intake was approximately 0.14 mg/kg/day. Similar lack of hematological alterations was reported among
a group of 37 volunteers who ingested up to 0.5 mg of perchlorate/kg/day for 14 days (Greer et al. 2002).
Hematological parameters were evaluated in an epidemiological study of school-age children from three
cities with different concentrations of perchlorate in drinking water in northern Chile (Crump et al. 2000).
The city with the highest perchlorate concentration was Taltal, 100–120 μg perchlorate/L (ppb); water
from the city of Chañaral had 5–7 μg/L. Perchlorate was not detected in water from the city of
Antofagasta. Assuming a default consumption of 1–2 L of water/day and a measured body weight of
approximately 25 kg, the children in Taltal may have consumed up to 0.004–0.008 mg perchlorate/kg/day
via the drinking water only, but the Chilean population also has large dietary sources of perchlorate. The
study comprised 162 children 6–8 years of age of which 127 had resided continuously in their respective
city since conception. There was nearly an equal number of boys and girls. Analysis of complete blood
counts showed no significant differences between the three groups of children whether the analysis
included all of the children or only the lifelong residents.
Severe hematological effects were found in several cases of hyperthyroid patients treated with potassium
perchlorate. Some patients developed aplastic anemia, characterized by drastic reductions in circulating
granulocytes, erythrocytes, and thrombocytes, and a lack of erythropoietic and granulopoietic cells in the
bone marrow (Barzilai and Sheinfeld 1966; Fawcett and Clarke 1961; Gjemdal 1963; Hobson 1961;
Johnson and Moore 1961; Krevans et al. 1962). Aplastic anemia was the cause of death in most of the
documented fatalities associated with potassium perchlorate treatment of thyrotoxicosis. In other patients,
the decrease in formed blood elements was limited to the granulocytes (agranulocytosis) and/or
thrombocytes (thrombocytopenia). Agranulocytosis was fatal in at least one case (Barzilai and Sheinfeld
1966), although other patients survived this condition (Barzilai and Sheinfeld 1966; Crooks and Wayne
1960; Southwell and Randall 1960; Sunar 1963). The doses in patients who developed agranulocytosis
and aplastic anemia were mostly in the low-to-moderate range of doses employed in thyrotoxicosis
therapy: 600–1,000 mg potassium perchlorate/day, or roughly 5–12 mg perchlorate/kg/day. Cases of
agranulocytosis were found within 14 days to 3 months of the start of potassium perchlorate treatment.
Although aplastic anemia was found after 2 months of treatment in one case, in most cases, it was only
found after 4–8 months. All of the documented cases of aplastic anemia and agranulocytosis were
55 PERCHLORATES
3. HEALTH EFFECTS
females (Graves’ disease, the most common cause of hyperthyroidism, is far more common in women
than in men), with ages ranging from 24 to 82 years.
Inhibition of hematopoiesis in the bone marrow has also been reported in dogs given 3,811 mg
perchlorate/kg/day as ammonium perchlorate by gavage for 3 weeks (Selivanova and Vorobieva 1969),
and in rats and mice exposed to 1% potassium perchlorate in the drinking water for 3 months
(approximate doses of 1,059 and 1,750 mg perchlorate/kg/day, respectively) (Shevtsova et al. 1994). No
significant alterations in hematological parameters were reported following administration of ammonium
perchlorate in a drinking water study in mice at doses up to 25.5 mg perchlorate/kg/day for 14 or 90 days
(DOD 1999). Similarly, a recent study in rats found no evidence of hematotoxicity after administration of
up to 8.5 mg perchlorate/kg/day in the drinking water for 90 days (Siglin et al. 2000). The investigators
evaluated routine hematology and clinical chemistry parameters.
Musculoskeletal Effects. No studies were located regarding musculoskeletal effects in humans after
oral exposure to perchlorate.
MacDermott (1992) observed a decrease in membrane potential and in intracellular potassium ion activity
in skeletal muscle from rats treated with 2% potassium perchlorate (approximately 2,327 mg
perchlorate/kg/day) in the drinking water for 6 weeks. The observed changes are consistent with a
decrease in the number of sodium-potassium pump units in the muscle. No alterations in gross or
microscopic appearance of skeletal muscle were reported in rats exposed to doses up to 8.5 mg
perchlorate/kg/day as ammonium perchlorate in the drinking water for 90 days (Siglin et al. 2000).
Hepatic Effects. No evidence of liver toxicity, as judged by blood chemistry tests, was observed in a
group of nine volunteers who ingested approximately 0.14 mg of perchlorate/kg/day as potassium
perchlorate for 14 consecutive days (Lawrence et al. 2000). Similar results were reported by Greer et al.
(2002) in a study of 37 volunteers who consumed up to 0.5 mg of perchlorate/kg/day also for 14 days. In
the study by Crump et al. (2000) of 162 school-age children from three cities in northern Chile with
different perchlorate concentration in the drinking water (up to 100–120 μg/L), there were no indications
of altered liver function among the children as measured by serum aspartate aminotransferase (AST),
alkaline phosphatase (AP), and lactate dehydrogenase (LDH) activities.
Godley and Stanbury (1954) reported no evidence of liver toxicity in a series of 24 hyperthyroid patients
treated with potassium perchlorate (600 mg, or approximately 6 mg perchlorate/kg/day) for up to
56 PERCHLORATES
3. HEALTH EFFECTS
52 weeks. However, it is not clear what tests were conducted to monitor effects on the liver or how
frequently such tests may have been conducted.
A 0.1% concentration of potassium perchlorate in the diet (about 64 mg perchlorate/day) for 19 weeks
had no effect on liver weight in rats (Hiasa et al. 1987). A more recent study in rats found that
administration of ammonium perchlorate in the drinking water at doses up to 8.5 mg perchlorate/kg/day
for up to 90 days caused no significant alterations in liver weight, in the gross or microscopic appearance
of the liver, or in serum transaminase activities (Siglin et al. 2000). No effects on liver weight were
reported in 14- and 90-day studies in mice administered up to 25.5 mg perchlorate/kg/day in the drinking
water as the ammonium salt (DOD 1999).
Renal Effects. Limited information exists regarding renal effects of perchlorate in humans. Two
studies in euthyroid volunteers who ingested up to 0.5 mg of perchlorate/kg/day as the potassium salt for
14 days found no evidence of renal effects as judged by standard clinical chemistry tests (Greer et al.
2002; Lawrence et al. 2000). Also, no alterations in BUN or in serum creatinine levels were observed in a
group of 60 school-age children from northern Chile exposed to perchlorate in their drinking water at
concentrations up to 100–120 μg/L (Crump et al. 2000).
In a case report, a patient with severe hyperthyroidism who was treated with an average of 1,068 mg
sodium perchlorate/day (approximately 12 mg perchlorate/kg/day) for 3.5 months developed nephrotic
syndrome, as diagnosed by albuminuria, decreased serum albumin, and increased serum cholesterol. The
effects subsided after treatment was stopped, and were considered by the researchers to probably have
been treatment-related (Weber and Wolf 1969).
There is also limited information on the renal effects of perchlorate in animals. In 14- and 90-day
drinking water studies in rats, doses of up to 8.5 mg/kg/day produced no significant alterations in kidney
weight or in gross or microscopical appearance of the kidneys (Siglin et al. 2000). In addition, kidney
function, monitored by measurements of BUN and serum creatinine, was not affected by exposure to
perchlorate (Siglin et al. 2000). A similar study in mice also found no effects of ammonium perchlorate
on kidney weight following 14 or 90 days of exposure to up to 25.5 mg perchlorate/kg/day, but kidney
function tests were not performed (DOD 1999).
Endocrine Effects. The findings of groundwater contamination with perchlorate in western areas of
the United States has triggered considerable research on the effects of this anion on the thyroid gland, its
57 PERCHLORATES
3. HEALTH EFFECTS
main target organ, in efforts to describe dose-response relationships at low doses and to define no-effect
level of exposure. For example, Lawrence et al. (2000) evaluated serum TSH, FTI, total serum
triiodothyronine (TT3), and RAIU; serum and 24-hour urine perchlorate; and 24-hour urinary iodide
excretion in volunteers who ingested approximately 0.14 mg perchlorate/kg/day in drinking water for
14 days. Tests were conducted pre-dosing, on day 7 and 14, and 14 days after perchlorate ingestion was
discontinued. The only significant finding was a significant decrease in 4-, 8-, and 24-hour RAIU values
by a mean of about 38% relative to baseline on day 14 of dosing. Fourteen days later, RAIU had
recovered to a mean of 25% above baseline values. Greer et al. (2002) conducted a similar study in
volunteers administered 0.007, 0.02, 0.1, or 0.5 mg perchlorate/kg/day in drinking water for 14 days.
RAIU was measured on exposure days 2 and 14, and 15 days after dosing ceased. To estimate daily
iodine intake, 24-hour urine samples were collected. As a percentage of baseline RAIU, inhibition in the
0.007, 0.02, 0.1, and 0.5 mg/kg/day dose groups was 1.8, 16.4, 44.7, and 67.1%, respectively. There were
no significant differences between the RAIU values measured on day 2 and 14. Fifteen days after
perchlorate treatment was discontinued, RAIU values were slightly higher than baseline values. Greer et
al. (2002) also found no significant effects of perchlorate treatment on serum TSH, free T4, TT4, and
TT3, and on serum antithyroid peroxidase levels; serum antiglobulin levels were below detection levels in
all samples tested. The National Academy of Sciences (NAS 2005) recommended a chronic RfD of
0.0007 mg/kg/day for perchlorate based of the findings of Greer et al. (2002). ATSDR has adopted the
RfD recommended by NAS for the chronic oral MRL.
A study similar to Greer et al. (2002) was conducted by Braverman et al. (2006) who administered
capsules containing potassium perchlorate to 13 volunteers (4 males, 9 females) once a day for 6 months.
The estimated doses were 0 (placebo), 0.5, and 3.0 mg perchlorate/day (approximately 0.04 and 0.007 mg
perchlorate/kg/day). The outcomes measured were serum thyroid function tests, 24-hour RAIU, serum
thyroglobulin (Tg), urinary iodine and perchlorate, and serum perchlorate. RAIU, measured at baseline,
3 and 6 months, and 1 month after termination, was not significantly affected by administration of
perchlorate, and there were no significant changes in serum total T3, FTI, TSH, or Tg levels during or
after perchlorate exposure compared to baseline values. The small number of subjects per group (4–5),
the dosing by capsule rather than intermittent exposure in drinking water, and the lack of information on
RAIU during the first 3 months of the study weaken the conclusions of this study.
Other earlier studies in healthy human subjects also showed that perchlorate administered in doses
between 7 and 10 mg/kg/day reduced thyroid iodide uptake, increased serum iodide levels, and increased
urinary iodide excretion (Brabant et al. 1992; Bürgi et al. 1974; DeGroot and Buhler 1971; Faure and
58 PERCHLORATES
3. HEALTH EFFECTS
Dussault 1975). Higher doses of perchlorate were used in the past to treat subjects with hyperactive
thyroids. For example, Stanbury and Wyngaarden (1952) found that a single oral dose of 100 mg of
potassium perchlorate (approximately 1 mg perchlorate/kg) dramatically reduced uptake of iodide by the
thyroid gland in Graves’ disease patients. Subsequent to this finding, potassium perchlorate became an
accepted treatment for hyperthyroidism, and was widely used for this purpose for several years (Connell
1981; Crooks and Wayne 1960; Godley and Stanbury 1954; Morgans and Trotter 1960). The use of
perchlorate for the treatment of hyperthyroidism came to a virtual stop due to the appearance of cases of
aplastic anemia (see Hematological Effects).
Epidemiological studies evaluating adults, children, and newborns have also been conducted (studies of
children and newborns are summarized in Section 3.2.2.6, Developmental Effects). However, caution
should be exercised in the interpretation of the results from the ecological studies due to the ubiquitous
nature of perchlorate exposure and because the effects of perchlorate are dependent upon iodine uptake,
so that differences in iodine levels will be important.
In a study of the general population, Li et al. (2001) examined the prevalence of thyroid diseases in
Nevada Counties with respect to perchlorate in drinking water. The cohort consisted of all users of the
Nevada Medicaid program during the period of January 1, 1997 to December 31, 1998. Disease
prevalence in residents from Clark County (Las Vegas), whose drinking water had 4–24 μg/L of
perchlorate (0.0001–0.0007 mg perchlorate/kg/day), were compared with those from another urban area
of similar size (Reno, Washoe County), but with no perchlorate in the water, and also with those from all
other counties, also with no perchlorate exposure. Patients were defined as those having one or more of
the following diagnoses of thyroid disease: simple and unspecified goiter, nontoxic nodular goiter,
thyrotoxicosis with or without goiter, congenital hypothyroidism, acquired hypothyroidism, thyroiditis,
other disorders of the thyroid, or malignant neoplasm of the thyroid gland. Analysis of the data showed
no statistically significant period-prevalence rate difference between Clark County and Washoe County.
For acquired hypothyroidism, the prevalence was lower in Clark County than in other counties (opposite
to what would be expected). Li et al. (2001) acknowledged that their analysis was a crude analysis since
age- and sex-adjusted prevalence could not be calculated because of lack of information on age and sex
distributions of the Medicaid-eligible population in each county.
A study of 184 pregnant women from three cities (Antofagasta, Chañaral, and Taltal) in northern Chile
found no significant association between levels of perchlorate in the drinking water and serum levels of
TSH, T4, or thyroglobulin measured early (16.1 weeks) or late (32.4 weeks) during pregnancy (Téllez et

59 PERCHLORATES
3. HEALTH EFFECTS
al. 2005). The mean concentrations of perchlorate in the drinking water from Chañaral and Taltal were
5.8 and 113.9 μg/L, respectively; drinking water from Antofagasta had 0.46 μg/L of perchlorate. The
doses of perchlorate estimated by the investigators for subjects in Antofagasta, Chañaral, and Taltal were
0.42, 6.1, and 93.5 μg perchlorate/day, respectively. Using a mean measured body weight of 66.8 kg, the
women from Taltal took doses of approximately 0.0014 mg perchlorate/kg/day. Because of the high
iodide intake and high background perchlorate in the Chilean diet, the studied women may not be
representative of the U.S. population. Furthermore, such high iodide intake may effectively compete with
perchlorate binding sites on the NIS.
A recent study of 2,299 male and female participants in NHANES (2001–2002) found that, for women
(n=1,111) but not men, urinary perchlorate was a significant predictor of both serum TT4 and TSH
concentrations (Blount et al. 2006). Blood and spot urine samples were collected from the subjects.
Separate analysis of women with urinary iodine <100 µg/L showed that urinary perchlorate was a
significant negative predictor of TT4 (p<0.0001) and a positive predictor of TSH (p<0.001). For women
with urinary iodine ≥100 µg/L, urinary perchlorate was a significant positive predictor of TSH (p=0.025),
but not of TT4 (p=0.550). These associations of perchlorate exposure with TT4 and TSH are coherent in
direction and independent of other variables known to affect thyroid function, but are present at
perchlorate exposure levels found in the general population (median estimated dose 0.059 µg/kg bw/day).
Covariates included in the analyses were: age, race/ethnicity, body mass index, estrogen use, menopausal
status, pregnancy status, premenarche status, serum C-reactive protein, serum albumin, serum cotinine,
hours of fasting, urinary thiocyanate, urinary nitrate, and selected medication groups. Of these, several
were also predictors of thyroid hormones with various degrees of significance. For example, for women
with urinary iodine <100 µg/L, estrogen use, menopause, pregnancy, premenarche, C-reactive protein,
and total kilocalorie intake were also predictors of TT4 levels. In the low-iodine group of females,
urinary perchlorate accounted for 24% of the variance in serum TT4. Limitations acknowledged by the
investigators include those common to cross-sectional analyses, the assumption that urinary perchlorate
correlate with levels in the thyroid stroma and tissue, and the measurement of total T4 rather than free T4.
In addition, not all variables that may impact thyroid function, such as some dietary factors, were
accounted for. Also, the study does not address a logical temporal association or biologic plausibility.
The investigators also stated that further research is needed to affirm these findings.
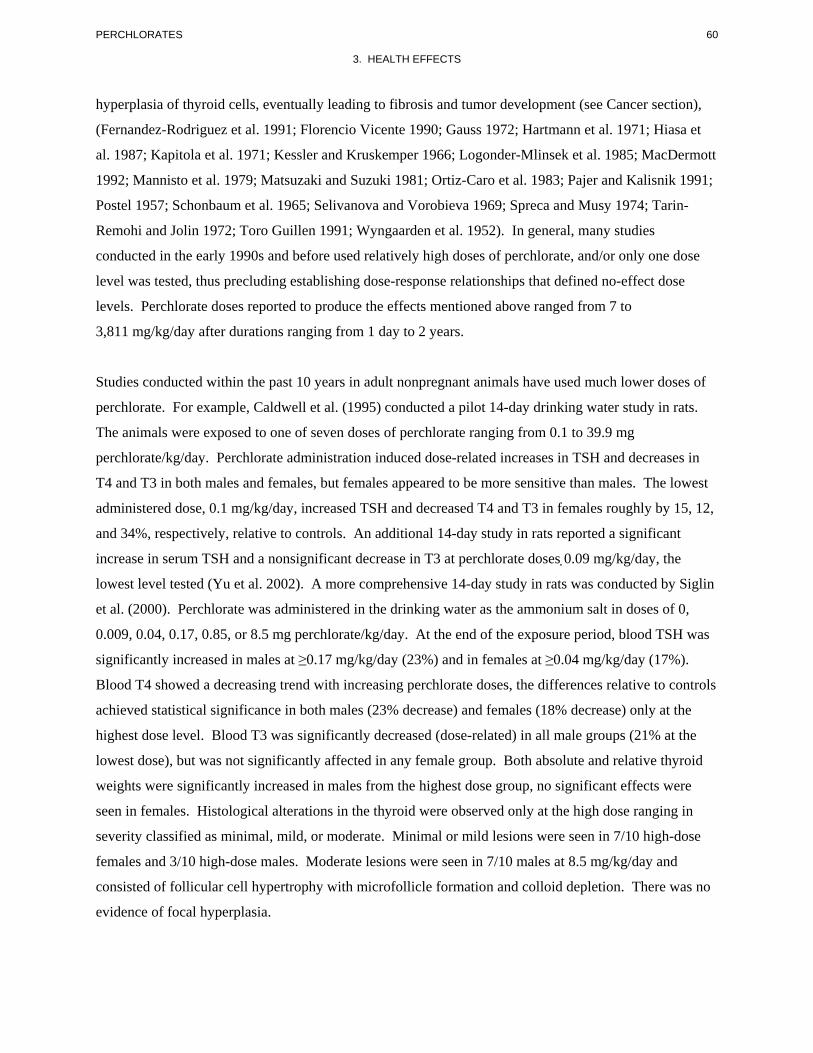
Studies in laboratory animals have described the thyroid effects of perchlorate in great detail. Reported
findings have included reduced thyroid iodide uptake, increased levels of iodide in serum, decreased
serum T4 and T3, increased serum TSH, increased thyroid size and weight, and hypertrophy and
60 PERCHLORATES
3. HEALTH EFFECTS
hyperplasia of thyroid cells, eventually leading to fibrosis and tumor development (see Cancer section),
(Fernandez-Rodriguez et al. 1991; Florencio Vicente 1990; Gauss 1972; Hartmann et al. 1971; Hiasa et
al. 1987; Kapitola et al. 1971; Kessler and Kruskemper 1966; Logonder-Mlinsek et al. 1985; MacDermott
1992; Mannisto et al. 1979; Matsuzaki and Suzuki 1981; Ortiz-Caro et al. 1983; Pajer and Kalisnik 1991;
Postel 1957; Schonbaum et al. 1965; Selivanova and Vorobieva 1969; Spreca and Musy 1974; Tarin-
Remohi and Jolin 1972; Toro Guillen 1991; Wyngaarden et al. 1952). In general, many studies
conducted in the early 1990s and before used relatively high doses of perchlorate, and/or only one dose
level was tested, thus precluding establishing dose-response relationships that defined no-effect dose
levels. Perchlorate doses reported to produce the effects mentioned above ranged from 7 to
3,811 mg/kg/day after durations ranging from 1 day to 2 years.
Studies conducted within the past 10 years in adult nonpregnant animals have used much lower doses of
perchlorate. For example, Caldwell et al. (1995) conducted a pilot 14-day drinking water study in rats.
The animals were exposed to one of seven doses of perchlorate ranging from 0.1 to 39.9 mg
perchlorate/kg/day. Perchlorate administration induced dose-related increases in TSH and decreases in
T4 and T3 in both males and females, but females appeared to be more sensitive than males. The lowest
administered dose, 0.1 mg/kg/day, increased TSH and decreased T4 and T3 in females roughly by 15, 12,
and 34%, respectively, relative to controls. An additional 14-day study in rats reported a significant
increase in serum TSH and a nonsignificant decrease in T3 at perchlorate doses 0.09 mg/kg/day, the
lowest level tested (Yu et al. 2002). A more comprehensive 14-day study in rats was conducted by Siglin
et al. (2000). Perchlorate was administered in the drinking water as the ammonium salt in doses of 0,
0.009, 0.04, 0.17, 0.85, or 8.5 mg perchlorate/kg/day. At the end of the exposure period, blood TSH was
significantly increased in males at ≥0.17 mg/kg/day (23%) and in females at ≥0.04 mg/kg/day (17%).
Blood T4 showed a decreasing trend with increasing perchlorate doses, the differences relative to controls
achieved statistical significance in both males (23% decrease) and females (18% decrease) only at the
highest dose level. Blood T3 was significantly decreased (dose-related) in all male groups (21% at the
lowest dose), but was not significantly affected in any female group. Both absolute and relative thyroid
weights were significantly increased in males from the highest dose group, no significant effects were
seen in females. Histological alterations in the thyroid were observed only at the high dose ranging in
severity classified as minimal, mild, or moderate. Minimal or mild lesions were seen in 7/10 high-dose
females and 3/10 high-dose males. Moderate lesions were seen in 7/10 males at 8.5 mg/kg/day and
consisted of follicular cell hypertrophy with microfollicle formation and colloid depletion. There was no
evidence of focal hyperplasia.
61 PERCHLORATES
3. HEALTH EFFECTS
In a 14-day study in mice exposed to 0, 0.09, 0.85, 2.6, or 25.5 mg perchlorate/kg/day, serum T4 was
significantly decreased at 2.6 and 25.5 mg/kg/day (14 and 22%, respectively) (DOD 1999). T3 was lower
than controls, although not significantly, in all treated groups except the 0.85 mg/kg/day group. There
was no clear pattern of change in TSH levels. Morphological evaluation of the thyroid showed colloid
depletion, intrafollicular capillary congestion, and mildly hypertrophied follicular epithelium in mice
from the highest dose group. An additional 14-day study in mice reported a significant decrease in serum
T4 levels at ≥0.2 mg perchlorate/kg/day and a significant increase in TSH at ≥1.7 mg/kg/day; serum
T3 was not measured (BRT 2000). Microscopical examination of the thyroid revealed colloid depletion
and hypertrophy in 5 out of 5 mice dosed with 42.5 mg/kg/day, but no significant alterations at the next
lower dose level, 1.7 mg/kg/day.
A 90-day study was conducted in rats exposed to 0, 0.009, 0.04, 0.17, 0.85, or 8.5 mg perchlorate/kg/day
in the drinking water (Siglin et al. 2000). Following the exposure period, the rats were provided
uncontaminated drinking water for an additional 30-day period. After the 90 days of exposure to
perchlorate, relative to controls TSH was significantly increased in males at ≥0.17 mg/kg/day (17%
increase) and in females at 8.5 mg/kg/day (21% increase). Blood T4 was significantly decreased in both
males and females from all treated groups (dose-related) (decreases ranged from 14 to 43% in males).
The effect of perchlorate on blood T3 was similar to that on T4 (12–35% decrease in males). At
120 days, hormone levels approached control levels except for T4 in males and TSH in females. Both
absolute and relative thyroid weights were significantly increased in males and females at 8.5 mg/kg/day
at 90 days but returned to near control values at 120 days. Histological alterations in the thyroid ranged in
severity from minimal to mild and were seen only at the 8.5 mg/kg/day dose level in both male and
female rats. The lesions consisted of follicular cell hypertrophy with microfollicle formation and colloid
depletion. There was no evidence of focal hyperplasia. No abnormal pathology was seen in the thyroid
after 120 days.
In a 2-generation reproductive study in rats, the F1 generation was exposed directly to perchlorate (0.26,
2.6, or 25.5 mg/kg/day) from weaning to 19 weeks of age, at which time, the animals were killed (York et
al. 2001a). In these adult rats, a significant increase in absolute and relative thyroid weight was seen in
males at 2.6 and 25.5 mg/kg/day and in all female groups (dose-related). Hypertrophy and hyperplasia of
the thyroid also occurred at 2.6 and 25.5 mg/kg/day in males and in high-dose females. TSH increased
only in high-dose males and females and T4 decreased in high-dose males (26% decrease); T3 levels were
not significantly affected. Hypertrophy and hyperplasia of the thyroid was reported at ≥2.6 mg
perchlorate/kg/day in the paternal generation of rats in the 2-generation study mentioned above in which
62 PERCHLORATES
3. HEALTH EFFECTS
the rats were exposed for a period that included premating, pregnancy, and lactation (York et al. 2001a);
the NOAEL was 0.26 mg/kg/day. The highest dose tested, 25.5 mg/kg/day, induced a significant increase
in TSH and a decrease in T4 in males.
In developmental studies in rats in which dosing with ammonium perchlorate at doses of 0, 0.009, 0.09,
0.85, and 25.5 mg perchlorate/kg/day began 14 days premating and continued to gestation day 10 or 21,
TSH and T4 were significantly increased and decreased, respectively, in a dose-related manner in all
dosed groups of dams (York et al. 2003, 2005a). In an additional developmental study in rats in which
exposure started 14 days before mating and continued until postnatal day (PND) 10, treatment with up to
8.5 mg perchlorate/kg/day caused no maternal toxicity as judged by clinical observations, body and
thyroid weights, and thyroid histology (York et al. 2004).
BRT (2000) evaluated serum TSH and T4 levels and thyroid histology in mice in a 90-day study. The
exposure levels were 0, 0.02, 0.05, 0.2, 1.7, or 42.5 mg perchlorate/kg/day. Treatment with ammonium
perchlorate decreased serum T4 levels, and the magnitude of the difference relative to controls achieved
statistical significance at the 1.7 mg/kg/day dose level (18% decrease). The decrease in T4 was dose-
related at ≥0.2 mg/kg/day and higher. Serum TSH was significantly elevated at ≥0.05 mg/kg/day relative
to controls (17% increase at the 0.05 mg/kg/day dose level). Microscopical examination of the thyroid
revealed hypertrophy in 3 out of 15 mice at 1.7 mg/kg/day, and in 4 out of 5 high-dose mice. Colloid
depletion was present in 5 out of 5 mice dosed with 42.5 mg/kg/day. No significant treatment-related
differences were observed between the other groups and controls.
In a developmental study in New Zealand rabbits, exposure to up to 85 mg perchlorate/kg/day on
gestation days 6–28 did not significantly alter absolute or relative thyroid weight (York et al. 2001b).
However, hypertrophy of the follicular epithelium was seen in the does at ≥8.5 mg/kg/day, and the
incidence was dose-related. Neither serum TSH nor T3 levels were significantly affected by treatment
with perchlorate. Serum T4 was significantly reduced at 25.5 and 85 mg/kg/day; T4 was also reduced at
0.85 and 8.5 mg/kg/day, but not significantly.
Other endocrine effects reported in perchlorate-treated animals included pituitary hypertrophy and
hyperplasia (Pajer and Kalisnik 1991), reduced serum growth hormone levels (Ortiz-Caro et al. 1983),
and reduced serum insulin (Tarin-Remohi and Jolin 1972). All of these effects were accompanied by
thyroid effects in the same studies. Direct correlation of these diverse animal studies to human endocrine

63 PERCHLORATES
3. HEALTH EFFECTS
systems is not provided, reflecting the NAS (2005) recommendation that such animal studies were not
indicative or representative of humans.
Dermal Effects. No reports were found of adverse dermal effects of perchlorate in healthy humans.
Skin rash was the most frequent side effect of potassium perchlorate therapy in thyrotoxicosis patients,
occurring primarily in patients receiving doses at the high end of the therapeutic range. Rash was
observed in 10% (5/50) of patients treated with 1,500 or 2,000 mg (approximately 15 or 20 mg
perchlorate/kg/day) by Crooks and Wayne (1960), and in 15% (10/67) of patients treated with 1,200 or
1,600 mg (approximately 12 or 16 mg perchlorate/kg/day) by Morgans and Trotter (1960). However,
rash was seen in only 0.5% (1/200) patients treated with 600 or 1,000 mg (approximately 6 or 10 mg
perchlorate/kg/day) by Crooks and Wayne (1960), and in none of the 24 patients treated with 600 mg
(approximately 6 mg perchlorate/kg/day) by Godley and Stanbury (1954). The observed rash was
characterized as maculopapular by Crooks and Wayne (1960), and was attributed by these authors to a
hypersensitivity reaction. Hemorrhagic skin lesions were frequently noted in cases with severe
hematological effects (Barzilai and Sheinfeld 1966; Fawcett and Clarke 1961; Gjemdal 1963; Hobson
1961; Johnson and Moore 1961; Krevans et al. 1962; Southwell and Randall 1960). The lesions, which
were described as punctate erythema, hemorrhagic pustulae, purpuric rash, skin hemorrhage, bleeding
into the skin, and petecchiae, apparently occurred secondary to the hematological effects.
In rats administered up to 8.5 mg perchlorate/kg/day as ammonium perchlorate in the drinking water for
90 days, no significant gross or microscopical alterations in the skin were found throughout the study
(Siglin et al. 2000).
Ocular Effects. No studies were located regarding ocular effects in humans after oral exposure to
perchlorate. Opthalmological examinations on rats dosed with up to 8.5 mg of perchlorate/kg/day for up
to 90 days revealed no treatment-related effects (Siglin et al. 2000).
Body Weight Effects. No studies were located regarding body weight effects in humans after oral
exposure to perchlorate.
In acute-duration rat studies, reduced growth was reported at an estimated dose of 1,830 mg
perchlorate/kg/day (Arieli and Chinet 1985), but not at doses of 1,500 mg perchlorate/kg/day or below
(Caldwell et al. 1995; Kapitola et al. 1971; Matsuzaki and Suzuki 1981; Schonbaum et al. 1965; Siglin et
al. 2000). In longer-term studies, there are reports of reduced body weight gain in rats at doses of 175 mg
64 PERCHLORATES
3. HEALTH EFFECTS
perchlorate/kg/day for 25 days (Ortiz-Caro et al. 1983), 1,362 mg/kg/day for 18 days (Tarin-Remohi and
Jolin 1972), 928 mg/kg/day for 12 months (Florencio Vicente 1990), 2,327 mg/kg/day for 6 weeks
(MacDermott 1992), and 928 mg/kg/day for 15 months (Toro Guillen 1991). Treatment of rats for
90 days with up to 8.5 mg of perchlorate/kg/day in the drinking water did not result in significant effects
on growth (Siglin et al. 2000), nor did treatment with 64 mg/kg/day for 19 weeks (Hiasa et al. 1987).
Also, in a 2-generation reproduction study in rats, no significant effects on body weight were seen in
F1 animals treated directly with up to 25.5 mg perchlorate/kg/day from weaning to 19 weeks of age in
addition to being exposed perinatally (York et al. 2001a); no significant effects on body weight were seen
in the paternal generation also in that study. A study in mice also found no alterations in body weight or
weight gain following 14 or 90 days of exposure to ammonium perchlorate in the drinking water in doses
up to 25.5 mg perchlorate/kg/day (DOD 1999). Where present, reduced growth is considered secondary
to hypothyroidism produced by perchlorate.
Metabolic Effects. No studies were located regarding metabolic effects in humans after oral exposure
to perchlorate.
Researchers in India conducted a number of studies investigating the metabolic effects of perchlorate in
rats given 500 mg/kg/day of potassium, sodium, or ammonium perchlorate by daily gavage for 45 days
(Sangan and Motlag 1986, 1987; Vijayalakshmi and Motlag 1989a, 1989b, 1990, 1992). They found that
perchlorate increased protein metabolism (increased liver arginase activity and serum urea levels), altered
carbohydrate metabolism (decreased serum glucose and increased liver and kidney glycogen levels,
reflecting increased activity of aldolase, lactate dehydrogenase, and glycogen synthase, and decreased
activity of glucose-6-phosphatase and glycogen phosphorylase), and modified lipid metabolism
(increased cholesterol, triglyceride, and phospholipid, and decreased free fatty acid levels, reflecting
decreased activity of lipase and phospholipase). They also found that perchlorate reduced the activities of
mitochondrial enzymes involved in cellular respiration, apparently due to changes in lipid composition of
mitochondrial membranes (increased cholesterol and decreased phospholipid) reducing membrane
fluidity.
Other studies reported only a small (11%), nonsignificant decrease in serum glucose levels in rats exposed
to potassium perchlorate (1,362 mg perchlorate/kg/day) in the drinking water for 18 days (Tarin-Remohi
and Jolin 1972), and no effect on serum glucose in rats exposed to 0.1% potassium perchlorate
(approximately 175 mg perchlorate/kg/day) in the drinking water for 25 days (Ortiz-Caro et al. 1983). No
65 PERCHLORATES
3. HEALTH EFFECTS
effects were observed on serum glucose levels in rats exposed to up to 8.5 mg of perchlorate/kg/day as
ammonium perchlorate in the drinking water for up to 90 days (Siglin et al. 2000).
Ortiz-Caro et al. (1983) observed a significant decrease in the activity of α-glycerophosphate
dehydrogenase (α-GPD) in hepatic mitochondria in their study that was considered secondary to
hypothyroidism produced by perchlorate. However, Arieli and Chinet (1985) found no effect on
cytoplasmic α-GPD in brown fat in rats that received 2% potassium perchlorate (1,830 mg
perchlorate/kg/day) in the drinking water for 2 weeks.
Other Systemic Effects. No studies were located regarding other systemic effects in humans after
oral exposure to perchlorate.
Eskin et al. (1975) observed reduced iodide uptake, decreased weight, and dysplastic histopathological
lesions in the mammary gland of rats treated with 459 mg perchlorate/kg/day as sodium perchlorate in the
drinking water for 8 weeks. Mammary gland dysplasia was also seen in ovariectomized rats given
estrogen replacement and then dosed with 494 mg perchlorate/kg/day for 8 weeks (Eskin et al. 1976).
Water consumption was not significantly altered in rats administered up to 40 mg of perchlorate/kg/day
for 14 days in the drinking water (Caldwell et al. 1995). Neither food or water consumption were affected
in rats exposed to perchlorate via drinking water in doses up to 8.5 mg/kg/day for up to 90 days (Siglin et
al. 2000). In a 2-generation reproduction study in rats, paternal males exposed for 16 weeks showed a
reduction in absolute and relative water consumption at 0.26 and 25.5 mg perchlorate/kg/day, but not at
2.6 mg/kg/day (York et al. 2001a). In that same study, no significant effects were seen on water
consumption in the F1 generation exposed directly to up to 25.5 mg perchlorate/kg/day in the drinking
water from weaning to 19 weeks of age. No significant effects on water consumption were also reported
in 14- and 90-day studies in mice given ammonium perchlorate in the drinking water in doses of up to
25.5 mg perchlorate/kg/day (DOD 1999).
3.2.2.3 Immunological and Lymphoreticular Effects
No reports were found of perchlorate-induced alterations in immune system parameters in healthy
humans. Two cases of lymphadenopathy (not further described) were reported among a series of
247 hyperthyroid patients treated with potassium perchlorate (Morgans and Trotter 1960). Both cases
66 PERCHLORATES
3. HEALTH EFFECTS
occurred in patients treated with 1,200 or 1,600 mg potassium perchlorate/day (roughly 12 or 16 mg
perchlorate/kg/day). Lymphoreticular effects were not reported in other case studies.
Spreca and Musy (1974) found increases in the proportion of degranulated mast cells in the thyroid, skin,
liver, and lungs of rats treated with potassium perchlorate (approximately 323 mg perchlorate/kg/day) for
1 day. The effect was greatest in the thyroid (27% decrease) and skin (21% decrease). Degranulation of
mast cells is typically associated with exposure to an allergen; degranulation releases pharmacological
mediators of immediate hypersensitivity responses (histamine, heparin, etc.), leading to allergy
symptoms. Clinical signs of hypersensitivity response were not monitored in this study. There was also
an increase in the number of mast cells in the thyroid and small decreases in mast cell numbers in the
skin, liver, and lung. The researchers suggested that the increase in the thyroid was associated with
hyperplasia in this tissue, and that the decrease in the other tissues may reflect loss of cells by
degranulation. An increase in mast cell numbers in the thyroid of mice treated with sodium perchlorate
(1.2% in drinking water, or roughly 2,622 mg perchlorate/kg/day) for 64 days was also reported by
Logonder-Mlinsek et al. (1985). The extent of mast cell degranulation was not reported in this study.
More recent studies in animals have tested much lower doses of perchlorate and conducted a more
complete evaluation of the immune system. For example, 14- and 90-day studies in rats administered
ammonium perchlorate in the drinking water in doses up to 8.5 mg perchlorate/kg/day reported no
significant effects on spleen weight and no gross or microscopic alterations in lymph nodes, spleen, and
thymus; no tests of immunocompetence were conducted in these studies (Siglin et al. 2000). DOD (1999)
evaluated a series of immunological end points in 14- and 90-day studies in mice exposed to ammonium
perchlorate in the drinking water in doses of 0, 0.09, 0.9, 2.6, and 25.5 mg perchlorate/kg/day. End points
evaluated included thymus and spleen weight and cellularity, CD4/CD8 splenocyte and thymocyte
subpopulations, stem cell progenitors (90-day), melanoma tumor incidence (90-day), natural killer (NK)
cell activity, delayed-type hypersensitivity (DTH), cytotoxic T cell activity, response to challenge with
Listeria monocytogenes (90-day), peritoneal macrophage phagocytosis and nitrite production, and specific
IgM and IgG response to cell dependent sheep red blood cell (SRBC) challenge. Significant findings in
the 14-day study included an increase in the percent of CD4-/CD8+ thymic lymphocytes at 0.09 and
0.9 mg/kg/day, decreased macrophage phagocytosis at 0.9 and 25.5 mg/kg/day, and increased DTH
response at 25.5 mg/kg/day. In the 90-day study, NK cell activity was increased in the highest-dose
group, macrophage phagocytosis was decreased in all treated groups, the DTH response was also
increased at 25.5 mg/kg/day, and increased resistance to the challenge with Listeria in the high-dose
group when challenged only with high immunization levels. Overall, because only a few immunological
67 PERCHLORATES
3. HEALTH EFFECTS
parameters were affected and resistance to the challenge with Listeria was not decreased, the results of
this study do not suggest an immunosuppressive function for perchlorate at the doses tested.
Additional 14- and 90-day drinking water studies exposed mice to 0, 0.02, 0.05, 0.2, 1.7, or 42.5 mg
perchlorate/kg/day examined the plaque forming cell (PFC) response following sheep red blood cells
(SRBC) immunization and the ability of mice to generate a hypersensitivity response (local lymph node
assay [LLNA]) to 2,4-dinitrochlorobenzene (DNCB), a known sensitizing chemical (BRT 2000). No
significant effects were seen on the PFC response after 14 days of treatment, but an increased response
was seen after 90 days in the 1.7 and 42.5 mg/kg/day dose groups when the results were expressed as
number of response per spleen and only at 42.5 mg/kg/day when the responses were expressed per
number of spleen cells. In the LLNA assay, perchlorate increased the sensitizing potential of DNCB at all
doses except 1.7 mg/kg/day in the 14-day experiment, whereas in the 90-day experiment, perchlorate
increased the sensitizing potential of DNCB at 0.05 and 0.2 mg/kg/day, had no effect at 0.02 or
1.7 mg/kg/day, and decreased it at 42.5 mg/kg/day. It should be mentioned, however, that
cyclophosphamide, the positive control, did not abolish the sensitizing effect of DNCB alone, calling into
question the reliability of the experiment. The physiological relevancy of the enhancement of the LLNA
is unclear. Further research in this area is needed to determine whether perchlorate is a contact sensitizer.
NOAEL and LOAEL values for immune system effects from the rodent studies are shown in
Table 3-2 and Figure 3-2.
3.2.2.4 Neurological Effects
No studies were located regarding neurological effects in humans after oral exposure to perchlorate and
limited information is available in animals. No gross or microscopic alterations were observed in the
brain from rats treated with ammonium perchlorate in drinking water in doses up to 8.5 mg
perchlorate/kg/day for 14 or 90 days (Siglin et al. 2000). Brain weight was also not significantly altered
by exposure to perchlorate.
Neurodevelopmental effects resulting from perinatal exposure to perchlorate are discussed in
Section 3.2.2.6, Developmental Effects.
3.2.2.5 Reproductive Effects
No studies were located regarding reproductive effects in humans after oral exposure to perchlorate.
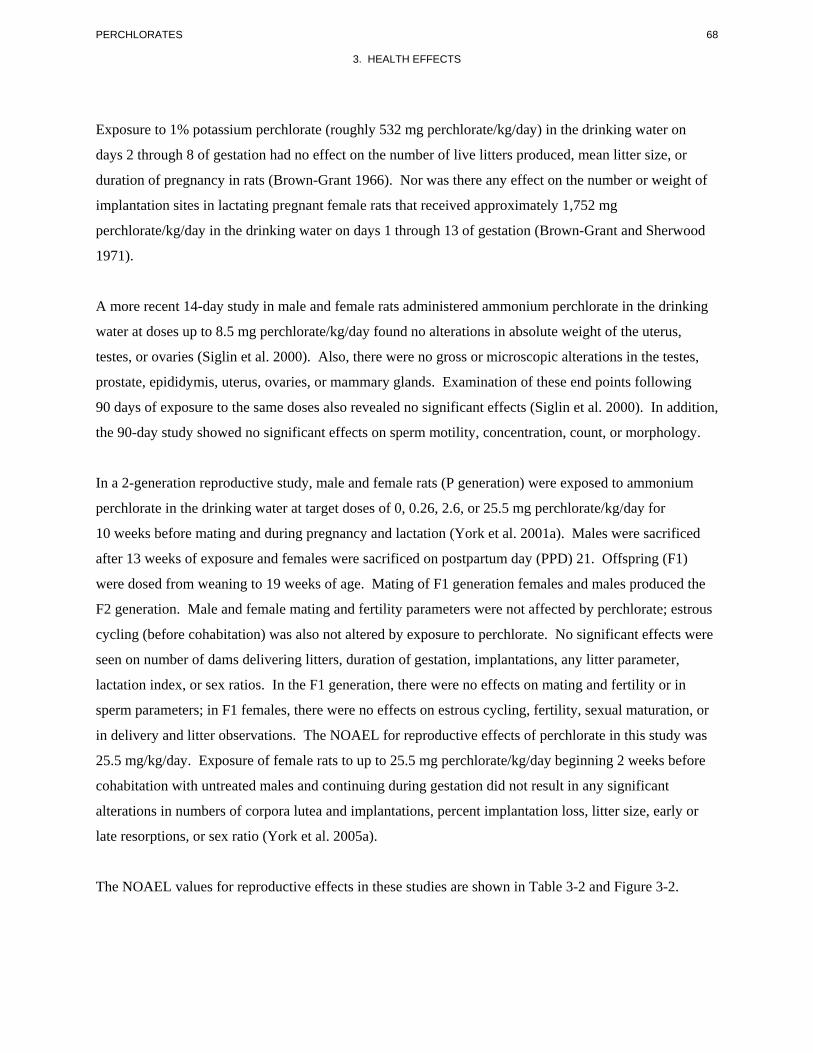
68 PERCHLORATES
3. HEALTH EFFECTS
Exposure to 1% potassium perchlorate (roughly 532 mg perchlorate/kg/day) in the drinking water on
days 2 through 8 of gestation had no effect on the number of live litters produced, mean litter size, or
duration of pregnancy in rats (Brown-Grant 1966). Nor was there any effect on the number or weight of
implantation sites in lactating pregnant female rats that received approximately 1,752 mg
perchlorate/kg/day in the drinking water on days 1 through 13 of gestation (Brown-Grant and Sherwood
1971).
A more recent 14-day study in male and female rats administered ammonium perchlorate in the drinking
water at doses up to 8.5 mg perchlorate/kg/day found no alterations in absolute weight of the uterus,
testes, or ovaries (Siglin et al. 2000). Also, there were no gross or microscopic alterations in the testes,
prostate, epididymis, uterus, ovaries, or mammary glands. Examination of these end points following
90 days of exposure to the same doses also revealed no significant effects (Siglin et al. 2000). In addition,
the 90-day study showed no significant effects on sperm motility, concentration, count, or morphology.
In a 2-generation reproductive study, male and female rats (P generation) were exposed to ammonium
perchlorate in the drinking water at target doses of 0, 0.26, 2.6, or 25.5 mg perchlorate/kg/day for
10 weeks before mating and during pregnancy and lactation (York et al. 2001a). Males were sacrificed
after 13 weeks of exposure and females were sacrificed on postpartum day (PPD) 21. Offspring (F1)
were dosed from weaning to 19 weeks of age. Mating of F1 generation females and males produced the
F2 generation. Male and female mating and fertility parameters were not affected by perchlorate; estrous
cycling (before cohabitation) was also not altered by exposure to perchlorate. No significant effects were
seen on number of dams delivering litters, duration of gestation, implantations, any litter parameter,
lactation index, or sex ratios. In the F1 generation, there were no effects on mating and fertility or in
sperm parameters; in F1 females, there were no effects on estrous cycling, fertility, sexual maturation, or
in delivery and litter observations. The NOAEL for reproductive effects of perchlorate in this study was
25.5 mg/kg/day. Exposure of female rats to up to 25.5 mg perchlorate/kg/day beginning 2 weeks before
cohabitation with untreated males and continuing during gestation did not result in any significant
alterations in numbers of corpora lutea and implantations, percent implantation loss, litter size, early or
late resorptions, or sex ratio (York et al. 2005a).
The NOAEL values for reproductive effects in these studies are shown in Table 3-2 and Figure 3-2.

69 PERCHLORATES
3. HEALTH EFFECTS
3.2.2.6 Developmental Effects
Several developmental studies of perchlorate in humans have focused on the evaluation of neonatal
thyroid parameters. Lamm and Doemland (1999) examined rates of congenital hypothyroidism in seven
counties of Nevada and California with perchlorate contamination in the drinking water (4–16 μg/L
[ppb]) (0.0001–0.0005 mg/kg/day). The investigators analyzed data from the neonatal screening
programs of the two states for any increased incidence of congenital hypothyroidism in those counties.
The rates for the California births were adjusted for Hispanic ethnicity, which was known to be a risk
factor for congenital hypothyroidism. During 1996 and 1997, nearly 700,000 newborns were screened.
The risk ratio in the seven counties was 1.0 (95% confidence interval [CI] 0.9–1.2) (249 cases
observed/243 expected). The risk ratios for the individual counties relative to statewide expected rates
ranged from 0.6 to 1.1. While the results showed no increase in rates of congenital hypothyroidism, it is
known that congenital hypothyroidism is caused by developmental events that are not suspected of being
affected by perchlorate exposure.
Kelsh et al. (2003) also found no relationship between congenital hypothyroidism and exposure to
perchlorate through the drinking water in a study of newborns (n=15,348) whose mothers resided in the
community of Redlands, California, during the period 1983 through 1997 and who were screened by the
California Newborn Screening Program. Perchlorate was detected in the water system serving the
community at a concentration of up to 9 μg/L (mean, <1 μg/L). Two adjacent communities with no
detectable perchlorate in their water systems, San Bernardino and Riverside (n=695,967), served as
comparison groups. The majority of the newborns had blood collected for TSH assay 18 hours or more
after birth. Cases were defined as infants diagnosed with congenital hypothyroidism or whose TSH
screening concentrations were >25 μU/mL or sometimes >16 μU/mL. Covariates included in the model
were age at specimen collection, sex, race, ethnicity, birth weight, multiple birth status, and calendar year
of birth. Analysis of the results showed an adjusted prevalence ratio for congenital hypothyroidism
of 0.45 (95% CI, 0.06–1.64) and an odds ratio for elevated TSH of 1.24 (95% CI, 0.89–1.68) among all
newborns screened and 0.69 (95% CI, 0.27–1.45) for newborns whose age at screening was ≥18 hours.
Limitations of the study include the fact that data from a single year were used to characterize exposures
over the entire 15 years of the study.
Li et al. (2000b) compared mean monthly neonatal T4 levels for days 1–4 of life for newborns from the
city of Las Vegas and Reno, both in Nevada. Las Vegas has perchlorate in its drinking water, whereas
Reno does not. The cohorts consisted of 17,308 newborns in Las Vegas and 5,882 newborns in Reno
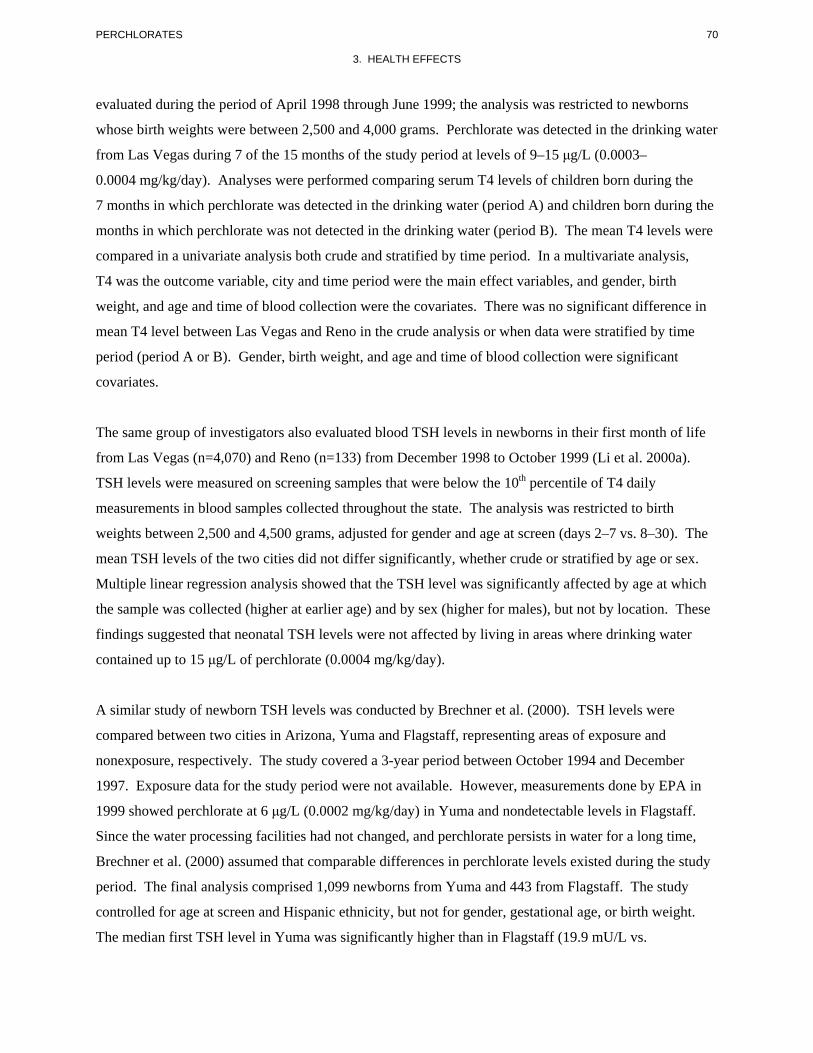
70 PERCHLORATES
3. HEALTH EFFECTS
evaluated during the period of April 1998 through June 1999; the analysis was restricted to newborns
whose birth weights were between 2,500 and 4,000 grams. Perchlorate was detected in the drinking water
from Las Vegas during 7 of the 15 months of the study period at levels of 9–15 μg/L (0.0003–
0.0004 mg/kg/day). Analyses were performed comparing serum T4 levels of children born during the
7 months in which perchlorate was detected in the drinking water (period A) and children born during the
months in which perchlorate was not detected in the drinking water (period B). The mean T4 levels were
compared in a univariate analysis both crude and stratified by time period. In a multivariate analysis,
T4 was the outcome variable, city and time period were the main effect variables, and gender, birth
weight, and age and time of blood collection were the covariates. There was no significant difference in
mean T4 level between Las Vegas and Reno in the crude analysis or when data were stratified by time
period (period A or B). Gender, birth weight, and age and time of blood collection were significant
covariates.
The same group of investigators also evaluated blood TSH levels in newborns in their first month of life
from Las Vegas (n=4,070) and Reno (n=133) from December 1998 to October 1999 (Li et al. 2000a).
TSH levels were measured on screening samples that were below the 10th percentile of T4 daily
measurements in blood samples collected throughout the state. The analysis was restricted to birth
weights between 2,500 and 4,500 grams, adjusted for gender and age at screen (days 2–7 vs. 8–30). The
mean TSH levels of the two cities did not differ significantly, whether crude or stratified by age or sex.
Multiple linear regression analysis showed that the TSH level was significantly affected by age at which
the sample was collected (higher at earlier age) and by sex (higher for males), but not by location. These
findings suggested that neonatal TSH levels were not affected by living in areas where drinking water
contained up to 15 μg/L of perchlorate (0.0004 mg/kg/day).
A similar study of newborn TSH levels was conducted by Brechner et al. (2000). TSH levels were
compared between two cities in Arizona, Yuma and Flagstaff, representing areas of exposure and
nonexposure, respectively. The study covered a 3-year period between October 1994 and December
1997. Exposure data for the study period were not available. However, measurements done by EPA in
1999 showed perchlorate at 6 μg/L (0.0002 mg/kg/day) in Yuma and nondetectable levels in Flagstaff.
Since the water processing facilities had not changed, and perchlorate persists in water for a long time,
Brechner et al. (2000) assumed that comparable differences in perchlorate levels existed during the study
period. The final analysis comprised 1,099 newborns from Yuma and 443 from Flagstaff. The study
controlled for age at screen and Hispanic ethnicity, but not for gender, gestational age, or birth weight.
The median first TSH level in Yuma was significantly higher than in Flagstaff (19.9 mU/L vs.
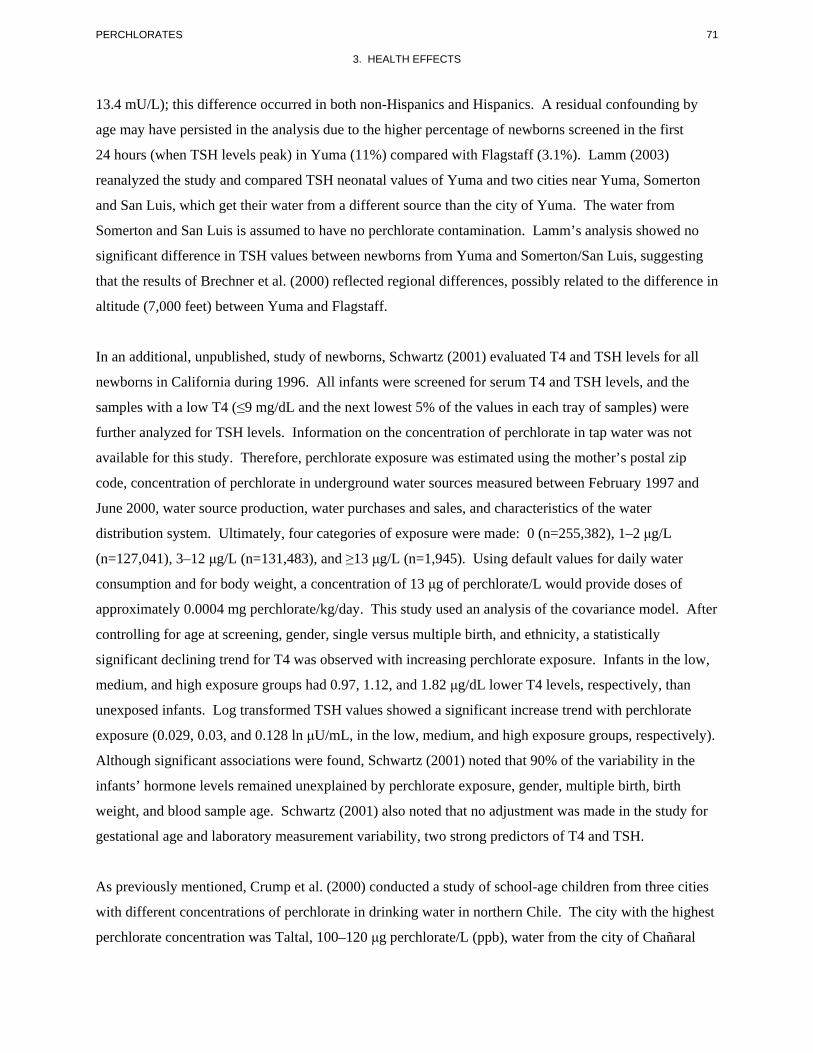
71 PERCHLORATES
3. HEALTH EFFECTS
13.4 mU/L); this difference occurred in both non-Hispanics and Hispanics. A residual confounding by
age may have persisted in the analysis due to the higher percentage of newborns screened in the first
24 hours (when TSH levels peak) in Yuma (11%) compared with Flagstaff (3.1%). Lamm (2003)
reanalyzed the study and compared TSH neonatal values of Yuma and two cities near Yuma, Somerton
and San Luis, which get their water from a different source than the city of Yuma. The water from
Somerton and San Luis is assumed to have no perchlorate contamination. Lamm’s analysis showed no
significant difference in TSH values between newborns from Yuma and Somerton/San Luis, suggesting
that the results of Brechner et al. (2000) reflected regional differences, possibly related to the difference in
altitude (7,000 feet) between Yuma and Flagstaff.
In an additional, unpublished, study of newborns, Schwartz (2001) evaluated T4 and TSH levels for all
newborns in California during 1996. All infants were screened for serum T4 and TSH levels, and the
samples with a low T4 (≤9 mg/dL and the next lowest 5% of the values in each tray of samples) were
further analyzed for TSH levels. Information on the concentration of perchlorate in tap water was not
available for this study. Therefore, perchlorate exposure was estimated using the mother’s postal zip
code, concentration of perchlorate in underground water sources measured between February 1997 and
June 2000, water source production, water purchases and sales, and characteristics of the water
distribution system. Ultimately, four categories of exposure were made: 0 (n=255,382), 1–2 μg/L
(n=127,041), 3–12 μg/L (n=131,483), and ≥13 μg/L (n=1,945). Using default values for daily water
consumption and for body weight, a concentration of 13 μg of perchlorate/L would provide doses of
approximately 0.0004 mg perchlorate/kg/day. This study used an analysis of the covariance model. After
controlling for age at screening, gender, single versus multiple birth, and ethnicity, a statistically
significant declining trend for T4 was observed with increasing perchlorate exposure. Infants in the low,
medium, and high exposure groups had 0.97, 1.12, and 1.82 μg/dL lower T4 levels, respectively, than
unexposed infants. Log transformed TSH values showed a significant increase trend with perchlorate
exposure (0.029, 0.03, and 0.128 ln μU/mL, in the low, medium, and high exposure groups, respectively).
Although significant associations were found, Schwartz (2001) noted that 90% of the variability in the
infants’ hormone levels remained unexplained by perchlorate exposure, gender, multiple birth, birth
weight, and blood sample age. Schwartz (2001) also noted that no adjustment was made in the study for
gestational age and laboratory measurement variability, two strong predictors of T4 and TSH.
As previously mentioned, Crump et al. (2000) conducted a study of school-age children from three cities
with different concentrations of perchlorate in drinking water in northern Chile. The city with the highest
perchlorate concentration was Taltal, 100–120 μg perchlorate/L (ppb), water from the city of Chañaral
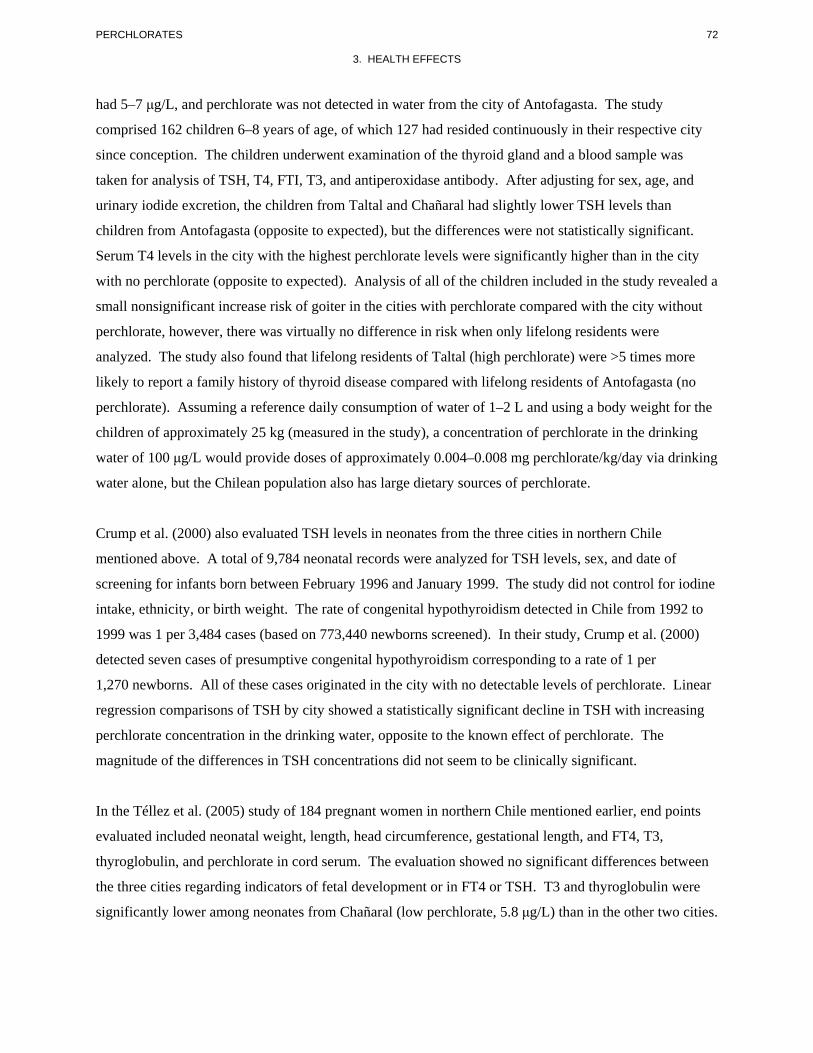
72 PERCHLORATES
3. HEALTH EFFECTS
had 5–7 μg/L, and perchlorate was not detected in water from the city of Antofagasta. The study
comprised 162 children 6–8 years of age, of which 127 had resided continuously in their respective city
since conception. The children underwent examination of the thyroid gland and a blood sample was
taken for analysis of TSH, T4, FTI, T3, and antiperoxidase antibody. After adjusting for sex, age, and
urinary iodide excretion, the children from Taltal and Chañaral had slightly lower TSH levels than
children from Antofagasta (opposite to expected), but the differences were not statistically significant.
Serum T4 levels in the city with the highest perchlorate levels were significantly higher than in the city
with no perchlorate (opposite to expected). Analysis of all of the children included in the study revealed a
small nonsignificant increase risk of goiter in the cities with perchlorate compared with the city without
perchlorate, however, there was virtually no difference in risk when only lifelong residents were
analyzed. The study also found that lifelong residents of Taltal (high perchlorate) were >5 times more
likely to report a family history of thyroid disease compared with lifelong residents of Antofagasta (no
perchlorate). Assuming a reference daily consumption of water of 1–2 L and using a body weight for the
children of approximately 25 kg (measured in the study), a concentration of perchlorate in the drinking
water of 100 μg/L would provide doses of approximately 0.004–0.008 mg perchlorate/kg/day via drinking
water alone, but the Chilean population also has large dietary sources of perchlorate.
Crump et al. (2000) also evaluated TSH levels in neonates from the three cities in northern Chile
mentioned above. A total of 9,784 neonatal records were analyzed for TSH levels, sex, and date of
screening for infants born between February 1996 and January 1999. The study did not control for iodine
intake, ethnicity, or birth weight. The rate of congenital hypothyroidism detected in Chile from 1992 to
1999 was 1 per 3,484 cases (based on 773,440 newborns screened). In their study, Crump et al. (2000)
detected seven cases of presumptive congenital hypothyroidism corresponding to a rate of 1 per
1,270 newborns. All of these cases originated in the city with no detectable levels of perchlorate. Linear
regression comparisons of TSH by city showed a statistically significant decline in TSH with increasing
perchlorate concentration in the drinking water, opposite to the known effect of perchlorate. The
magnitude of the differences in TSH concentrations did not seem to be clinically significant.
In the Téllez et al. (2005) study of 184 pregnant women in northern Chile mentioned earlier, end points
evaluated included neonatal weight, length, head circumference, gestational length, and FT4, T3,
thyroglobulin, and perchlorate in cord serum. The evaluation showed no significant differences between
the three cities regarding indicators of fetal development or in FT4 or TSH. T3 and thyroglobulin were
significantly lower among neonates from Chañaral (low perchlorate, 5.8 μg/L) than in the other two cities.
73 PERCHLORATES
3. HEALTH EFFECTS
T3 and thyroglobulin were not significantly different between newborns from Antofagasta (no
perchlorate) and Taltal (high perchlorate, 114 μg/L).
A study conducted in Israel evaluated T4 levels (not specified whether TT4 or FT4) in newborns from
mothers living in areas with very high (≤340 μg/L, n=97), high (42–94 μg/L, n=216), and low (<3 μg/L,
n=843) levels of perchlorate (Amitai et al. 2007). Levels of perchlorate in blood from donors living in the
three areas were used as proxy indicators of exposure. Respective blood perchlorate levels in the very
high, high, and low exposure proxy groups were 5.99, 1.19, and 0.44 μg/L; these donors had similar blood
levels of thiocyanate and nitrate. Blood samples from the newborns collected at the age of 36–48 hours
did not reveal significant differences in T4 levels among the three groups. Mean T4 values in the very
high, high, and low exposure groups were 13.9, 13.9, and 14.0 μg/L, respectively. In addition, neither
birth weight nor gestational age was significantly different among the three groups. Although individual
iodine measures were not conducted, the investigators stated that the study was conducted in iodine-
sufficient areas.
Chang et al. (2003) evaluated the potential association between exposure to perchlorate via the drinking
water and the incidence of attention-deficit-hyperactivity disorder (ADHD) and autism among children
less than 18 years of age who were recipients of Medicaid in Nevada. The study included subjects from
Clark County, which includes Las Vegas and in which the concentration of perchlorate in the public water
supply ranged from undetected to 23.8 μg/L (mean, 10.9 μg/L), as measured in 1997–2001; subjects from
Washoe County, which includes Reno, with no detectable perchlorate in the water supply served as an
unexposed comparison group, and the remainder of Nevada served as a rural control. No perchlorate was
detected in public water supplies from the rural areas. Analysis of the data from the Nevada Medicaid
program showed that the rates for ADHD and for autism in the area with perchlorate in the drinking water
did not exceed the rates in the areas without perchlorate in the drinking water. Furthermore, there was no
difference between the three groups regarding overall fourth-grade school performance. No control was
made in the analysis for age, sex, race, or ethnicity.
Studies in laboratory animals have shown that maternal exposure to relatively high doses of perchlorate
during pregnancy and/or lactation leads to reduced thyroid function. Pups of rats exposed to 1% sodium
perchlorate in the drinking water (about 1,300 mg perchlorate/kg/day) throughout gestation and lactation
had reduced growth, increased thyroid weight, drastically decreased serum T4 and T3 levels, and
markedly increased serum TSH levels compared with controls (Golstein et al. 1988). These effects are
the typical indicators of hypothyroidism in juvenile and adult rats treated with perchlorate directly. In a
74 PERCHLORATES
3. HEALTH EFFECTS
study in guinea pigs, near-term fetuses from dams treated with 1% potassium perchlorate (about 531 mg
perchlorate/kg/day) in the drinking water during the latter half of gestation had thyroid hyperplasia and a
dramatic 15-fold increase in relative thyroid weight compared with controls, while maternal thyroids were
unaffected (Postel 1957). This suggests that perchlorate may have entered the fetal circulation and
directly affected the fetal thyroid gland. Similar fetal effects were seen in rabbits dosed with 72 mg
perchlorate/kg/day in the diet throughout gestation, but in this study, effects on the maternal thyroid,
although considerably less intense than in the fetuses, were observed (Lampe et al. 1967). Rat pups
exposed to perchlorate only for 10 days during lactation had body weights similar to controls, but
significantly increased relative thyroid weights (Brown-Grant and Sherwood 1971). The dams in this
study, which were pregnant with a new litter while nursing these pups, had received an approximate dose
of 1,752 mg perchlorate/kg/day, and showed an increase in relative thyroid weight of similar magnitude
to the pups.
Several developmental studies in animals have focused on the effects of perchlorate on the thyroid and
also on neurodevelopmental effects following perinatal exposure to relatively low doses of perchlorate.
Information on developmental effects of perchlorate is available in the 2-generation reproduction study in
rats by York et al. (2001a) previously described in Section 3.2.2.5, Reproductive Effects. Perchlorate
doses were 0, 0.26, 2.6, and 25.5 mg perchlorate/kg/day, and exposure started 10 weeks before mating
and continued during pregnancy and lactation. The F1 generation was dosed from weaning (21 days old)
to 19 weeks of age, but some pups were sacrificed on PND 21. The second generation (F2) was
sacrificed at 3 weeks of age. F1 and F2 generations were exposed in utero, via maternal milk, and
through maternal water. Exposure to perchlorate had no significant effect on pup weight. High-dose
F1 pups killed on PND 21 showed a significant increase in thyroid weight (males and females) and in
spleen weight (females). Significant hypertrophy and hyperplasia of the thyroid was seen in high-dose
males and females and in mid-dose females. Also, there was a significant reduction in serum T3 in high-
dose females, TSH was reduced in low- and mid-dose males, and serum T4 was increased in low-dose
females. Thyroid weight from high-dose F2 female pups was significantly increased, and both male and
female from the mid- and high-dose group exhibited hyperplasia and hypertrophy of the thyroid. TSH,
T3, and T4 levels were not significantly altered in F2 pups, although T3 was somewhat lower in high-
dose females. On the basis of morphological alterations in the thyroid observed in mid- and high-dose
pups, the 0.26 mg/kg/day dose level is considered a developmental NOAEL. Parental (F0) effects were
restricted to the thyroid and consisted mainly in hypertrophy and hyperplasia of the thyroid in the mid-
and high-dose groups and significantly increased serum TSH levels in high-dose males.
75 PERCHLORATES
3. HEALTH EFFECTS
A subsequent study in rats by York et al. (2003) examined the developmental effects of ammonium
perchlorate in doses of 0, 0.009, 0.09, 0.85, and 25.5 mg perchlorate/kg/day. Dosing began 14 days
premating and continued to gestation day (GD) 21, at which time, all rats were sacrificed. Satellite
groups of rats were treated similarly and were used for collection of blood and thyroid tissues. The rats
were observed for clinical signs, abortions, premature deliveries, and deaths. Body weights and food and
water consumption were also monitored. At sacrifice, gravid uterine weights were recorded, and the
uterus was examined for pregnancy, number and distribution of implantations, live and dead fetuses, and
early and late resorptions. In addition, the number of corpora lutea in each ovary was recorded; the
placenta was also examined. The fetuses were weighed and examined for gross alterations; one-half was
examined for soft tissues alterations and the other half was examined for skeletal alterations and cartilage
development. There were no maternal deaths and all clinical observations were considered unrelated to
the test material. There were no significant effects on body weights, weight gains, and gravid uterine
weights. There were no treatment-related effects on absolute or relative food or water consumption
values. Cesarean sectioning and litter parameters were not affected by exposure to perchlorate.
Evaluation of the fetuses showed that the average number of ossification sites per litter for sternal centers
and for forelimb phalanges was significantly reduced in the 25.5 mg/kg/day exposure group.
Examination of the satellite group of pups showed a statistically significant and dose-related decrease in
T3 in all dosed groups. No developmental NOAEL is identified in this study and the 0.009 mg/kg/day
dose level is a developmental LOAEL. T3 levels also were reduced in pooled serum samples from
fetuses exposed through gestation and examined on GD 21 (York et al. 2005a). The lowest dose tested,
0.009 mg/kg/day, induced a 17% decrease in T3 relative to controls, whereas at the highest dose tested,
25.5 mg/kg/day, T3 was decreased by 33%. In this study, perchlorate also induced a dose-related increase
in TSH (15% at 0.009 mg/kg/day) and decrease in T4 (16% at 0.009 mg/kg/day) in male pups sacrificed
on PND 22.
An additional study was conducted in rats given ammonium perchlorate via the drinking water that
provided doses of 0, 0.09, 0.9, 2.6, and 8.5 mg perchlorate/kg/day (York et al. 2004). Exposure began on
GD 1 and continued for additional 10 days postpartum. Dams were sacrificed on PND 10 or 22 (12-day
recovery period). Four subsets of pups were formed: subset 1 was sacrificed on PND 12 for
neurohistological examination; subset 2 was used for neurobehavioral testing (avoidance testing on
PND 23–32, water maze on PND 59–70) and sacrificed on PND 90–92, at which time blood was
collected for TSH, T4, and T3 determinations; subset 3 was tested for motor activity on PND 14, 18, 22,
and 59, and for auditory startle habituation on PND 23 and 60 and sacrificed on PND 67–69; and subset
4 was sacrificed on PND 80–86 and used for thyroid pathology and neurohistological examination and
76 PERCHLORATES
3. HEALTH EFFECTS
morphology. In addition, on PND 5, litters were culled to eight pups, blood was collected for hormone
analysis, and the thyroid was processed for histopathology.
Treatment with perchlorate caused no maternal toxicity as judged by clinical observations, body and
thyroid weights, and thyroid histology. Perchlorate did not significantly affect gestation length, litter size,
number of stillborn, gestation index, pup viability index, or pup’s weight. In the pups, there were no
significant changes in body weight, absolute and relative food consumption, or exposure to perchlorate
did not affect the day of vaginal latency or the day of preputial separation. Microscopic examination of
the thyroid from pups culled on PND 5 revealed changes restricted mainly to high-dose males consisting
of hypertrophy/hyperplasia of the follicular epithelium and decrease in follicle size. TSH was elevated
only in pups born to dams treated with 8.5 mg/kg/day, but T3 levels were significantly reduced at
0.9 mg/kg/day and higher doses. T4 was significantly reduced at 2.6 mg/kg/day and higher doses. In
pups sacrificed on PND 12 (subset 1), a significant increase in thickness of the corpus callosum was seen
in high-dose females; this also was observed in high-dose males but the difference with controls was not
statistically significant. Evaluation of the next lower dose group (2.6 mg/kg/day) revealed a significant
decrease in the hippocampal gyrus size in males, increase in the anterior to posterior cerebellum size and
decrease in the caudate putamen in females, but no significant difference in the corpus callosum.
Evaluations of subsets 2 and 3 revealed no behavioral effects in the offspring of dams exposed up to
8.5 mg perchlorate/kg/day (passive avoidance, swimming water maze, motor activity, and auditory
startle). Also in subsets 2 and 3, there were no necropsy observations that seemed perchlorate-related,
and terminal body weights and absolute and relative thyroid weights were comparable among the groups.
In subset 4, there were no necropsy observations related to treatment, no significant effect on final body
weight or thyroid weight, and no treatment-related neuropathological changes in the brain. However,
morphometry evaluation of eight specific brain areas revealed a significant increase in mean thickness of
the frontal cortex, caudate putamen, and corpus callosum from high-dose males. Based on the thyroid
effects on pups culled on PND 5, the dose of 0.09 mg/kg/day can be considered a developmental NOAEL.
The highest dose tested, 8.5 mg/kg/day is a maternal NOAEL. It should be mentioned that questions and
concerns have been raised regarding the brain morphology findings. A more recent refinement of the
study from the same group of investigators in which rats were exposed to perchlorate during gestation (0,
0.009, 0.09, 0.9, or 25.5 mg perchlorate/kg/day) and via maternal milk through lactation day 10 showed
no treatment-related neuropathological alterations at sacrifice on PND 10 or 22 (York et al. 2005b). The
most significant finding was an increased thickness of the corpus callosum in male pups in the 0.09 and
0.9 mg/kg/day dose groups, but not in the 25.5 mg/kg/day dose group. Differences in other brain
structures were not statistically significant and/or were present in only one dose group (i.e., thickness of
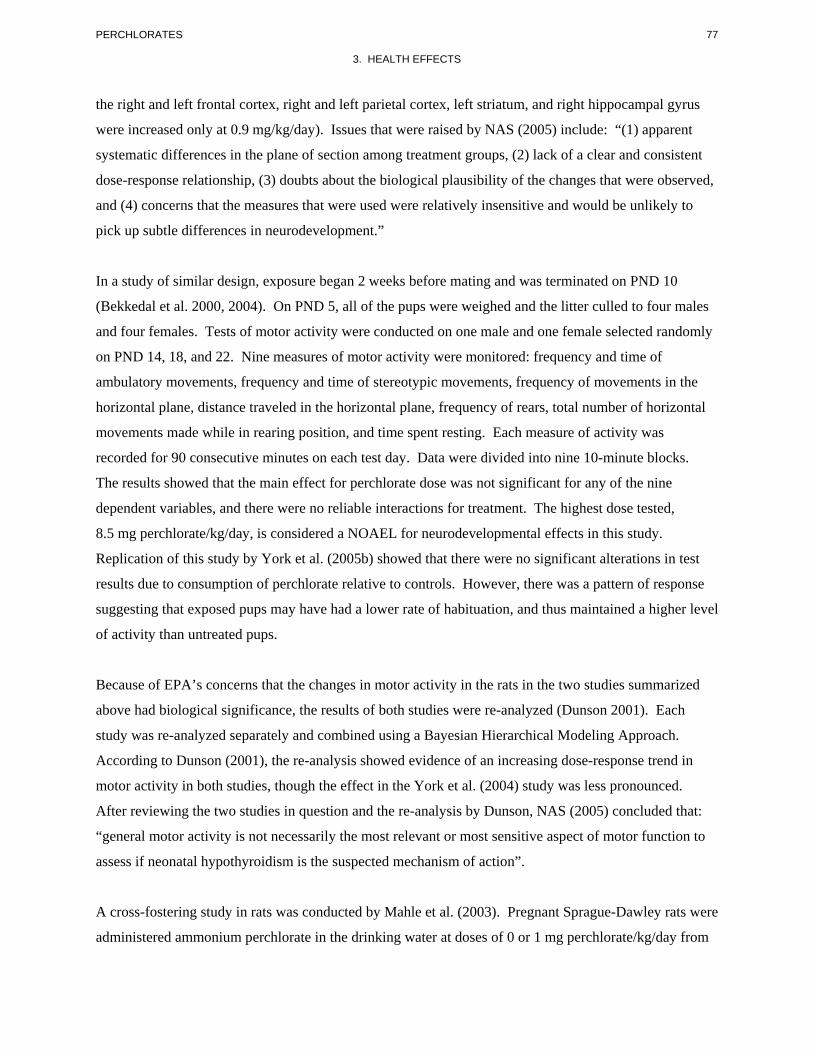
77 PERCHLORATES
3. HEALTH EFFECTS
the right and left frontal cortex, right and left parietal cortex, left striatum, and right hippocampal gyrus
were increased only at 0.9 mg/kg/day). Issues that were raised by NAS (2005) include: “(1) apparent
systematic differences in the plane of section among treatment groups, (2) lack of a clear and consistent
dose-response relationship, (3) doubts about the biological plausibility of the changes that were observed,
and (4) concerns that the measures that were used were relatively insensitive and would be unlikely to
pick up subtle differences in neurodevelopment.”
In a study of similar design, exposure began 2 weeks before mating and was terminated on PND 10
(Bekkedal et al. 2000, 2004). On PND 5, all of the pups were weighed and the litter culled to four males
and four females. Tests of motor activity were conducted on one male and one female selected randomly
on PND 14, 18, and 22. Nine measures of motor activity were monitored: frequency and time of
ambulatory movements, frequency and time of stereotypic movements, frequency of movements in the
horizontal plane, distance traveled in the horizontal plane, frequency of rears, total number of horizontal
movements made while in rearing position, and time spent resting. Each measure of activity was
recorded for 90 consecutive minutes on each test day. Data were divided into nine 10-minute blocks.
The results showed that the main effect for perchlorate dose was not significant for any of the nine
dependent variables, and there were no reliable interactions for treatment. The highest dose tested,
8.5 mg perchlorate/kg/day, is considered a NOAEL for neurodevelopmental effects in this study.
Replication of this study by York et al. (2005b) showed that there were no significant alterations in test
results due to consumption of perchlorate relative to controls. However, there was a pattern of response
suggesting that exposed pups may have had a lower rate of habituation, and thus maintained a higher level
of activity than untreated pups.
Because of EPA’s concerns that the changes in motor activity in the rats in the two studies summarized
above had biological significance, the results of both studies were re-analyzed (Dunson 2001). Each
study was re-analyzed separately and combined using a Bayesian Hierarchical Modeling Approach.
According to Dunson (2001), the re-analysis showed evidence of an increasing dose-response trend in
motor activity in both studies, though the effect in the York et al. (2004) study was less pronounced.
After reviewing the two studies in question and the re-analysis by Dunson, NAS (2005) concluded that:
“general motor activity is not necessarily the most relevant or most sensitive aspect of motor function to
assess if neonatal hypothyroidism is the suspected mechanism of action”.
A cross-fostering study in rats was conducted by Mahle et al. (2003). Pregnant Sprague-Dawley rats were
administered ammonium perchlorate in the drinking water at doses of 0 or 1 mg perchlorate/kg/day from
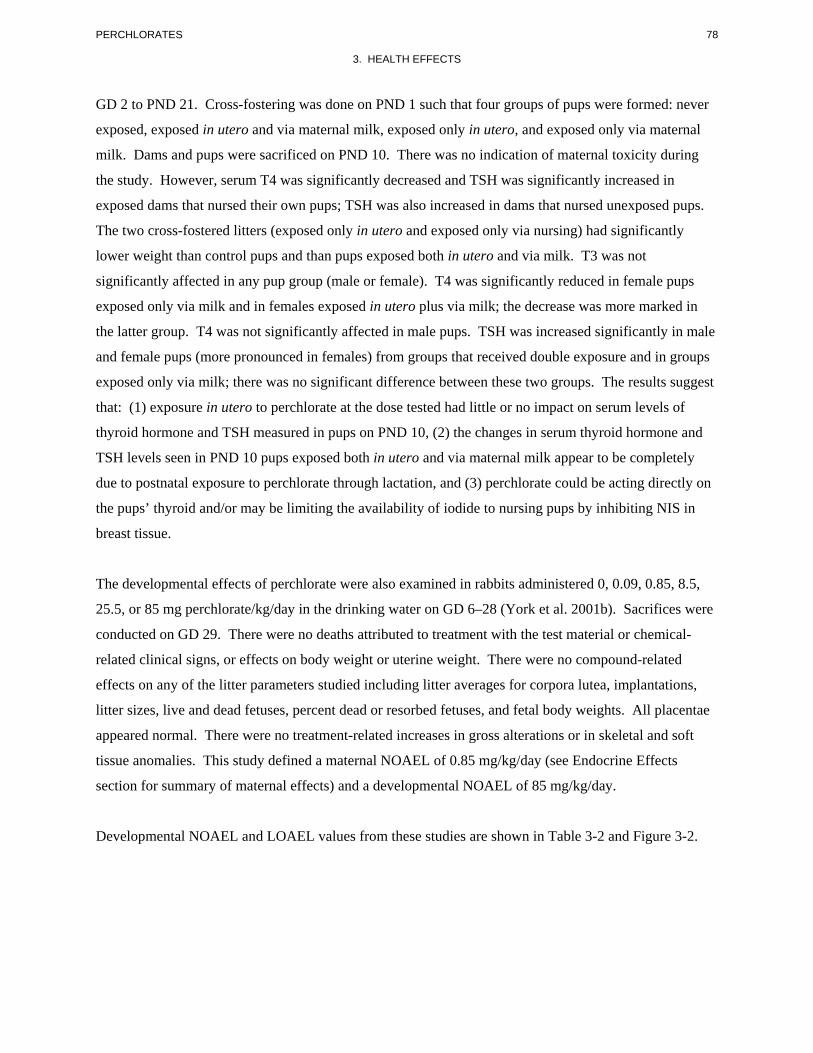
78 PERCHLORATES
3. HEALTH EFFECTS
GD 2 to PND 21. Cross-fostering was done on PND 1 such that four groups of pups were formed: never
exposed, exposed in utero and via maternal milk, exposed only in utero, and exposed only via maternal
milk. Dams and pups were sacrificed on PND 10. There was no indication of maternal toxicity during
the study. However, serum T4 was significantly decreased and TSH was significantly increased in
exposed dams that nursed their own pups; TSH was also increased in dams that nursed unexposed pups.
The two cross-fostered litters (exposed only in utero and exposed only via nursing) had significantly
lower weight than control pups and than pups exposed both in utero and via milk. T3 was not
significantly affected in any pup group (male or female). T4 was significantly reduced in female pups
exposed only via milk and in females exposed in utero plus via milk; the decrease was more marked in
the latter group. T4 was not significantly affected in male pups. TSH was increased significantly in male
and female pups (more pronounced in females) from groups that received double exposure and in groups
exposed only via milk; there was no significant difference between these two groups. The results suggest
that: (1) exposure in utero to perchlorate at the dose tested had little or no impact on serum levels of
thyroid hormone and TSH measured in pups on PND 10, (2) the changes in serum thyroid hormone and
TSH levels seen in PND 10 pups exposed both in utero and via maternal milk appear to be completely
due to postnatal exposure to perchlorate through lactation, and (3) perchlorate could be acting directly on
the pups’ thyroid and/or may be limiting the availability of iodide to nursing pups by inhibiting NIS in
breast tissue.
The developmental effects of perchlorate were also examined in rabbits administered 0, 0.09, 0.85, 8.5,
25.5, or 85 mg perchlorate/kg/day in the drinking water on GD 6–28 (York et al. 2001b). Sacrifices were
conducted on GD 29. There were no deaths attributed to treatment with the test material or chemical-
related clinical signs, or effects on body weight or uterine weight. There were no compound-related
effects on any of the litter parameters studied including litter averages for corpora lutea, implantations,
litter sizes, live and dead fetuses, percent dead or resorbed fetuses, and fetal body weights. All placentae
appeared normal. There were no treatment-related increases in gross alterations or in skeletal and soft
tissue anomalies. This study defined a maternal NOAEL of 0.85 mg/kg/day (see Endocrine Effects
section for summary of maternal effects) and a developmental NOAEL of 85 mg/kg/day.
Developmental NOAEL and LOAEL values from these studies are shown in Table 3-2 and Figure 3-2.
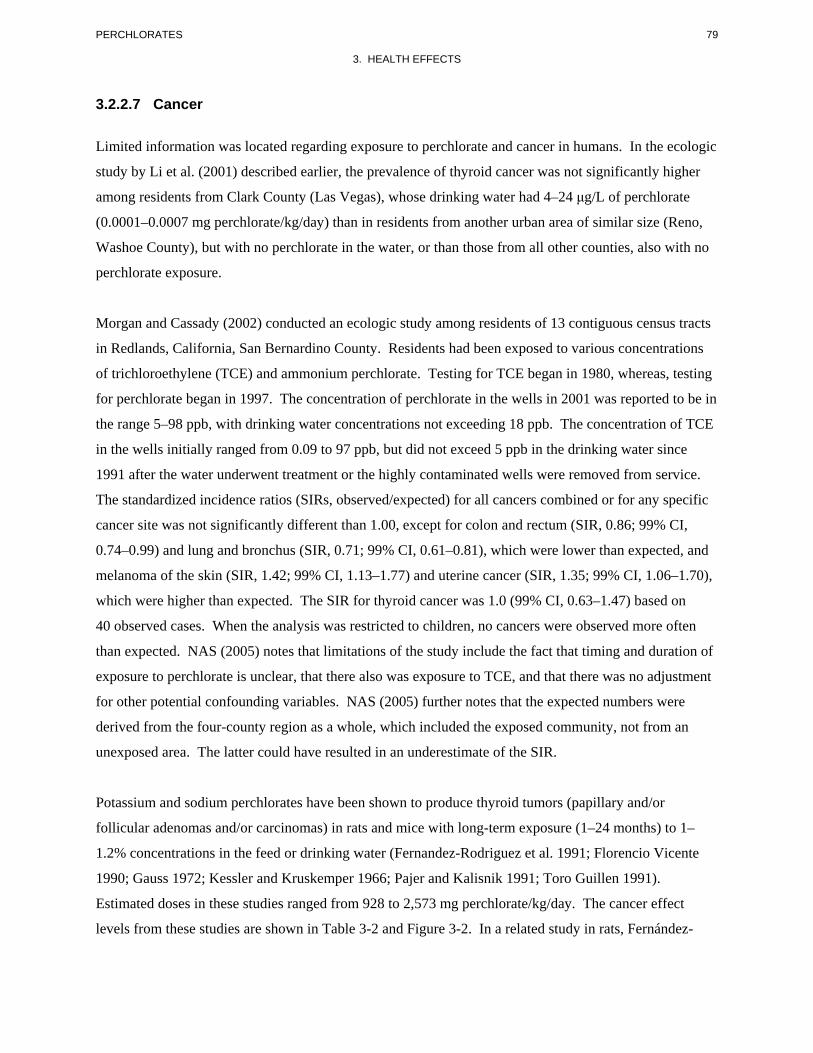
79 PERCHLORATES
3. HEALTH EFFECTS
3.2.2.7 Cancer
Limited information was located regarding exposure to perchlorate and cancer in humans. In the ecologic
study by Li et al. (2001) described earlier, the prevalence of thyroid cancer was not significantly higher
among residents from Clark County (Las Vegas), whose drinking water had 4–24 μg/L of perchlorate
(0.0001–0.0007 mg perchlorate/kg/day) than in residents from another urban area of similar size (Reno,
Washoe County), but with no perchlorate in the water, or than those from all other counties, also with no
perchlorate exposure.
Morgan and Cassady (2002) conducted an ecologic study among residents of 13 contiguous census tracts
in Redlands, California, San Bernardino County. Residents had been exposed to various concentrations
of trichloroethylene (TCE) and ammonium perchlorate. Testing for TCE began in 1980, whereas, testing
for perchlorate began in 1997. The concentration of perchlorate in the wells in 2001 was reported to be in
the range 5–98 ppb, with drinking water concentrations not exceeding 18 ppb. The concentration of TCE
in the wells initially ranged from 0.09 to 97 ppb, but did not exceed 5 ppb in the drinking water since
1991 after the water underwent treatment or the highly contaminated wells were removed from service.
The standardized incidence ratios (SIRs, observed/expected) for all cancers combined or for any specific
cancer site was not significantly different than 1.00, except for colon and rectum (SIR, 0.86; 99% CI,
0.74–0.99) and lung and bronchus (SIR, 0.71; 99% CI, 0.61–0.81), which were lower than expected, and
melanoma of the skin (SIR, 1.42; 99% CI, 1.13–1.77) and uterine cancer (SIR, 1.35; 99% CI, 1.06–1.70),
which were higher than expected. The SIR for thyroid cancer was 1.0 (99% CI, 0.63–1.47) based on
40 observed cases. When the analysis was restricted to children, no cancers were observed more often
than expected. NAS (2005) notes that limitations of the study include the fact that timing and duration of
exposure to perchlorate is unclear, that there also was exposure to TCE, and that there was no adjustment
for other potential confounding variables. NAS (2005) further notes that the expected numbers were
derived from the four-county region as a whole, which included the exposed community, not from an
unexposed area. The latter could have resulted in an underestimate of the SIR.
Potassium and sodium perchlorates have been shown to produce thyroid tumors (papillary and/or
follicular adenomas and/or carcinomas) in rats and mice with long-term exposure (1–24 months) to 1–
1.2% concentrations in the feed or drinking water (Fernandez-Rodriguez et al. 1991; Florencio Vicente
1990; Gauss 1972; Kessler and Kruskemper 1966; Pajer and Kalisnik 1991; Toro Guillen 1991).
Estimated doses in these studies ranged from 928 to 2,573 mg perchlorate/kg/day. The cancer effect
levels from these studies are shown in Table 3-2 and Figure 3-2. In a related study in rats, Fernández

80 PERCHLORATES
3. HEALTH EFFECTS
Santos et al. (2004) determined the incidence of Ki-ras oncogene mutations in follicular cell carcinomas
of the thyroid induced by administration of radioactive iodine and potassium perchlorate (1% in drinking
water) for up to 18 months. Direct sequencing showed no mutations in the amplified gene segment of any
of the induced thyroid tumors. The results suggested that Ki-ras activation via mutations at codons 12
and 13 is neither a constant event nor an early event in the development of rat thyroid follicular cell
carcinoma. An additional study found that low level exposure to potassium perchlorate (0.1% in the feed,
corresponding to a dose of 64 mg perchlorate/kg/day) for 19 weeks promoted the development of thyroid
tumors initiated by N-bis(2-hydroxypropyl)nitrosamine (Hiasa et al. 1987).
NAS (2005) noted that: “on the basis of the understanding of the biology of human and rodent thyroid
tumors, it is unlikely that perchlorate poses a risk of thyroid cancer in humans”. The EPA has concluded
that perchlorate is not likely to pose a risk of thyroid cancer in humans, at least at doses below those
necessary to alter thyroid hormone homeostasis, based on the hormonally-mediated mode of action in
rodent studies and species differences in thyroid function (IRIS 2007).
3.2.3 Dermal Exposure
No studies were located regarding the following effects in humans or animals after dermal exposure to
perchlorate:
3.2.3.1 Death 3.2.3.2 Systemic Effects 3.2.3.3 Immunological and Lymphoreticular Effects 3.2.3.4 Neurological Effects 3.2.3.5 Reproductive Effects 3.2.3.6 Developmental Effects 3.2.3.7 Cancer
3.3 GENOTOXICITY
No studies were located regarding genotoxic effects in humans after inhalation, oral, or dermal exposure
to perchlorates. Limited information is available from studies in animals. Siglin et al. (2000) found no
evidence of bone marrow erythrocyte micronucleus formation in male and female rats as a result of
exposure to 8.5 mg perchlorate/kg/day as ammonium perchlorate in the drinking water for 90 days.
Zeiger et al. (1998b) also reported no increase in micronucleus formation in bone marrow from mice
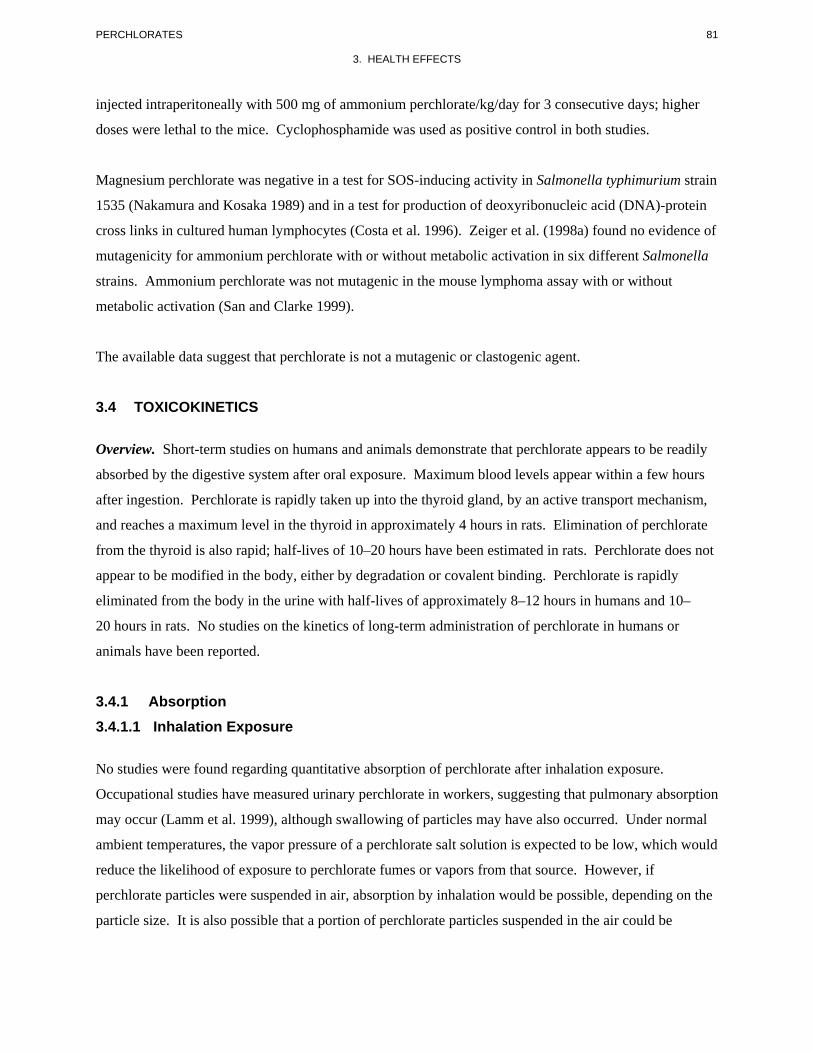
81 PERCHLORATES
3. HEALTH EFFECTS
injected intraperitoneally with 500 mg of ammonium perchlorate/kg/day for 3 consecutive days; higher
doses were lethal to the mice. Cyclophosphamide was used as positive control in both studies.
Magnesium perchlorate was negative in a test for SOS-inducing activity in Salmonella typhimurium strain
1535 (Nakamura and Kosaka 1989) and in a test for production of deoxyribonucleic acid (DNA)-protein
cross links in cultured human lymphocytes (Costa et al. 1996). Zeiger et al. (1998a) found no evidence of
mutagenicity for ammonium perchlorate with or without metabolic activation in six different Salmonella
strains. Ammonium perchlorate was not mutagenic in the mouse lymphoma assay with or without
metabolic activation (San and Clarke 1999).
The available data suggest that perchlorate is not a mutagenic or clastogenic agent.
3.4 TOXICOKINETICS
Overview. Short-term studies on humans and animals demonstrate that perchlorate appears to be readily
absorbed by the digestive system after oral exposure. Maximum blood levels appear within a few hours
after ingestion. Perchlorate is rapidly taken up into the thyroid gland, by an active transport mechanism,
and reaches a maximum level in the thyroid in approximately 4 hours in rats. Elimination of perchlorate
from the thyroid is also rapid; half-lives of 10–20 hours have been estimated in rats. Perchlorate does not
appear to be modified in the body, either by degradation or covalent binding. Perchlorate is rapidly
eliminated from the body in the urine with half-lives of approximately 8–12 hours in humans and 10–
20 hours in rats. No studies on the kinetics of long-term administration of perchlorate in humans or
animals have been reported.
3.4.1 Absorption 3.4.1.1 Inhalation Exposure
No studies were found regarding quantitative absorption of perchlorate after inhalation exposure.
Occupational studies have measured urinary perchlorate in workers, suggesting that pulmonary absorption
may occur (Lamm et al. 1999), although swallowing of particles may have also occurred. Under normal
ambient temperatures, the vapor pressure of a perchlorate salt solution is expected to be low, which would
reduce the likelihood of exposure to perchlorate fumes or vapors from that source. However, if
perchlorate particles were suspended in air, absorption by inhalation would be possible, depending on the
particle size. It is also possible that a portion of perchlorate particles suspended in the air could be

82 PERCHLORATES
3. HEALTH EFFECTS
swallowed and absorbed orally. Given the aqueous solubility of perchlorate salts, it is likely that small
particles reaching the alveoli would dissolve and readily enter the systemic circulation.
3.4.1.2 Oral Exposure
Perchlorate has been shown, in both human and animal studies, to be readily absorbed after oral exposure.
In human subjects who ingested 10 mg/day perchlorate as potassium perchlorate in drinking water for
14 days (0.14 mg/kg/day), urinary excretion rate of perchlorate was 77% of the dose/day, after 7 days of
exposure, indicating that at least 77% of the ingested dosage had been absorbed (Lawrence et al. 2000).
Evidence for rapid absorption in humans is provided by studies of elimination patterns. Anbar et al.
(1959) detected potassium perchlorate in urine samples collected from four subjects 3 hours after
ingestion of 200 mg perchlorate. Durand (1938) gave sodium perchlorate in a single oral dose (784 mg
perchlorate per person) to two individuals and found perchlorate in the urine as early as 10 minutes after
ingestion. Approximately 30% of the ingested dose had been eliminated in the urine within 3 hours after
the dose, and 95% was eliminated within 48 hours. In a study of 13 subjects given 0.5 or 3 mg
perchlorate/day for 6 months, serum perchlorate increased from undetected at baseline to an average of
24.5 µg/L in the low-dose group and 77.9 µg/L in the high-dose group over the 6 months (Braverman et
al. 2006). The investigators estimated that approximately 65–70% of the daily dose was excreted during a
24-hour period. These results suggest rapid and near complete absorption of perchlorate through the
digestive system.
Selivanova et al. (1986) examined the absorption of ammonium perchlorate in rats, rabbits, and calves
after a single oral dose (2, 20, 200, or 600 mg perchlorate/kg). In rats, a maximum concentration of
perchlorate in blood was noted between 30 and 60 minutes after administration (suggesting entrance into
the systemic circulation before 30 minutes); in cattle, the maximum blood concentration of perchlorate
occurred at 5 hours. In this study, only 8.5% of the administered dose was excreted in feces, and the rest
was excreted in the urine, suggesting that >90% of the administered oral dose was absorbed.
3.4.1.3 Dermal Exposure
No studies were found regarding absorption of perchlorate after dermal exposure. As a general rule,
electrolytes applied from aqueous solutions do not readily penetrate the skin (Scheuplein and Bronaugh
1983). On this basis, dermal absorption of perchlorate is expected to be low.
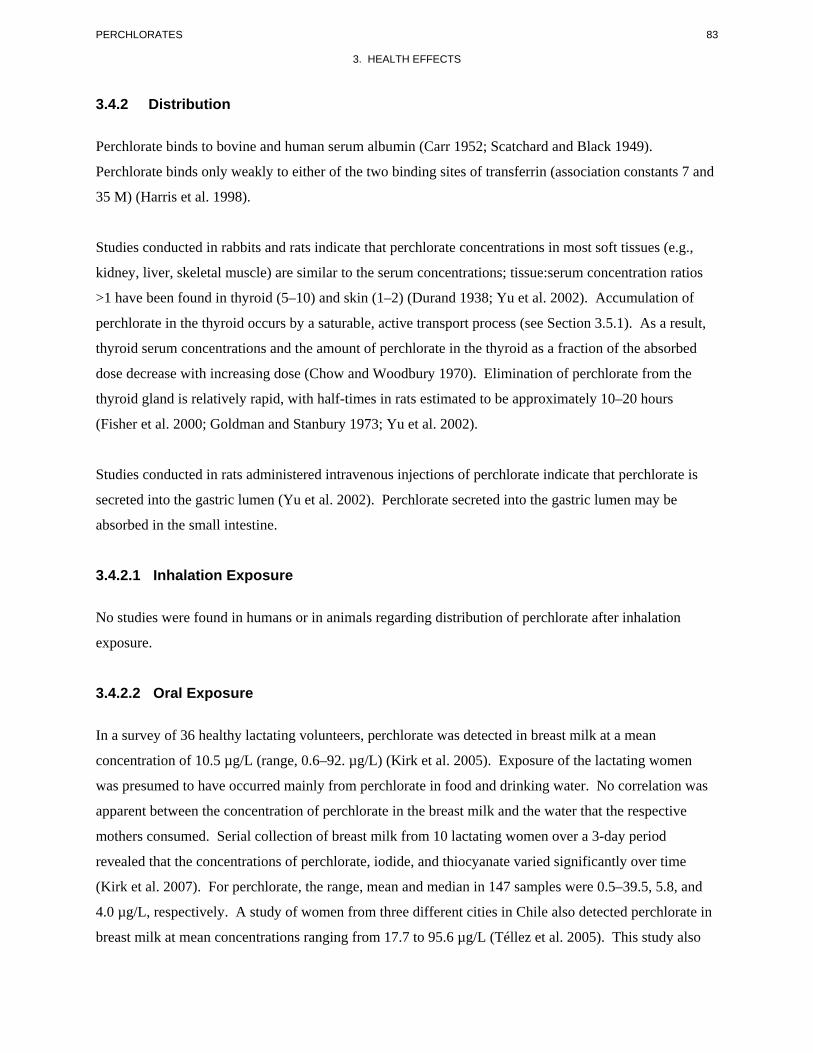
83 PERCHLORATES
3. HEALTH EFFECTS
3.4.2 Distribution
Perchlorate binds to bovine and human serum albumin (Carr 1952; Scatchard and Black 1949).
Perchlorate binds only weakly to either of the two binding sites of transferrin (association constants 7 and
35 M) (Harris et al. 1998).
Studies conducted in rabbits and rats indicate that perchlorate concentrations in most soft tissues (e.g.,
kidney, liver, skeletal muscle) are similar to the serum concentrations; tissue:serum concentration ratios
>1 have been found in thyroid (5–10) and skin (1–2) (Durand 1938; Yu et al. 2002). Accumulation of
perchlorate in the thyroid occurs by a saturable, active transport process (see Section 3.5.1). As a result,
thyroid serum concentrations and the amount of perchlorate in the thyroid as a fraction of the absorbed
dose decrease with increasing dose (Chow and Woodbury 1970). Elimination of perchlorate from the
thyroid gland is relatively rapid, with half-times in rats estimated to be approximately 10–20 hours
(Fisher et al. 2000; Goldman and Stanbury 1973; Yu et al. 2002).
Studies conducted in rats administered intravenous injections of perchlorate indicate that perchlorate is
secreted into the gastric lumen (Yu et al. 2002). Perchlorate secreted into the gastric lumen may be
absorbed in the small intestine.
3.4.2.1 Inhalation Exposure
No studies were found in humans or in animals regarding distribution of perchlorate after inhalation
exposure.
3.4.2.2 Oral Exposure
In a survey of 36 healthy lactating volunteers, perchlorate was detected in breast milk at a mean
concentration of 10.5 µg/L (range, 0.6–92. µg/L) (Kirk et al. 2005). Exposure of the lactating women
was presumed to have occurred mainly from perchlorate in food and drinking water. No correlation was
apparent between the concentration of perchlorate in the breast milk and the water that the respective
mothers consumed. Serial collection of breast milk from 10 lactating women over a 3-day period
revealed that the concentrations of perchlorate, iodide, and thiocyanate varied significantly over time
(Kirk et al. 2007). For perchlorate, the range, mean and median in 147 samples were 0.5–39.5, 5.8, and
4.0 µg/L, respectively. A study of women from three different cities in Chile also detected perchlorate in
breast milk at mean concentrations ranging from 17.7 to 95.6 µg/L (Téllez et al. 2005). This study also
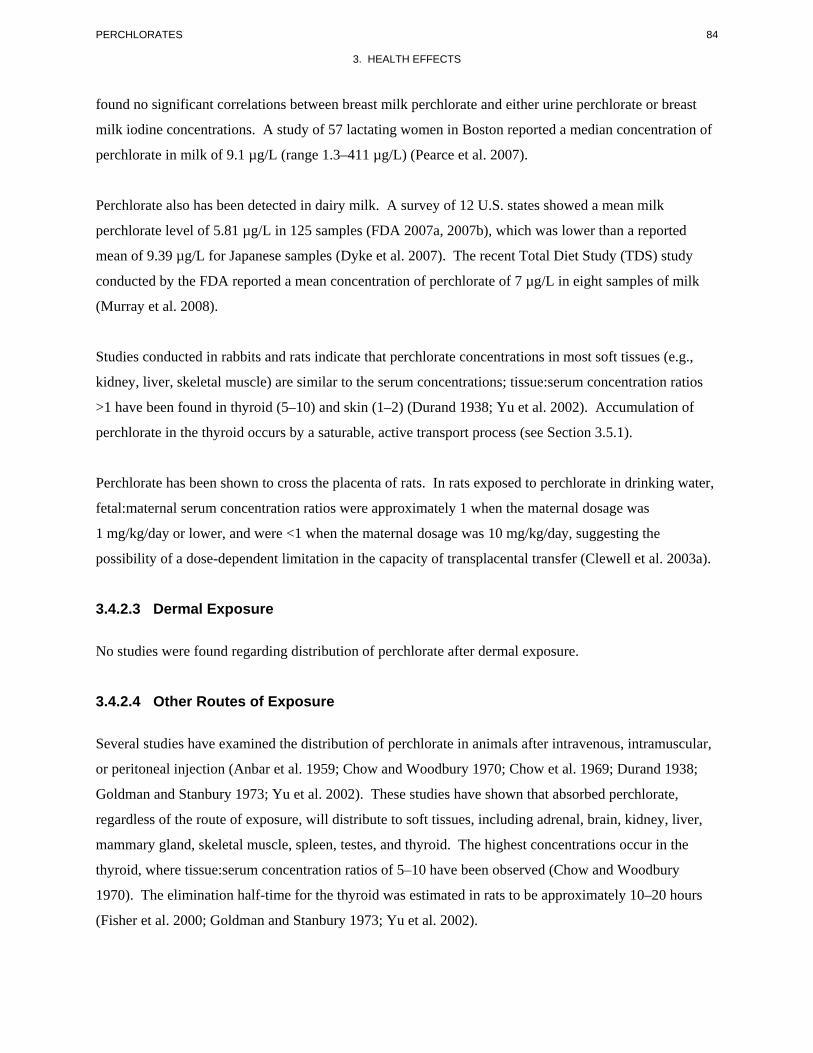
84 PERCHLORATES
3. HEALTH EFFECTS
found no significant correlations between breast milk perchlorate and either urine perchlorate or breast
milk iodine concentrations. A study of 57 lactating women in Boston reported a median concentration of
perchlorate in milk of 9.1 µg/L (range 1.3–411 µg/L) (Pearce et al. 2007).
Perchlorate also has been detected in dairy milk. A survey of 12 U.S. states showed a mean milk
perchlorate level of 5.81 µg/L in 125 samples (FDA 2007a, 2007b), which was lower than a reported
mean of 9.39 µg/L for Japanese samples (Dyke et al. 2007). The recent Total Diet Study (TDS) study
conducted by the FDA reported a mean concentration of perchlorate of 7 µg/L in eight samples of milk
(Murray et al. 2008).
Studies conducted in rabbits and rats indicate that perchlorate concentrations in most soft tissues (e.g.,
kidney, liver, skeletal muscle) are similar to the serum concentrations; tissue:serum concentration ratios
>1 have been found in thyroid (5–10) and skin (1–2) (Durand 1938; Yu et al. 2002). Accumulation of
perchlorate in the thyroid occurs by a saturable, active transport process (see Section 3.5.1).
Perchlorate has been shown to cross the placenta of rats. In rats exposed to perchlorate in drinking water,
fetal:maternal serum concentration ratios were approximately 1 when the maternal dosage was
1 mg/kg/day or lower, and were <1 when the maternal dosage was 10 mg/kg/day, suggesting the
possibility of a dose-dependent limitation in the capacity of transplacental transfer (Clewell et al. 2003a).
3.4.2.3 Dermal Exposure
No studies were found regarding distribution of perchlorate after dermal exposure.
3.4.2.4 Other Routes of Exposure
Several studies have examined the distribution of perchlorate in animals after intravenous, intramuscular,
or peritoneal injection (Anbar et al. 1959; Chow and Woodbury 1970; Chow et al. 1969; Durand 1938;
Goldman and Stanbury 1973; Yu et al. 2002). These studies have shown that absorbed perchlorate,
regardless of the route of exposure, will distribute to soft tissues, including adrenal, brain, kidney, liver,
mammary gland, skeletal muscle, spleen, testes, and thyroid. The highest concentrations occur in the
thyroid, where tissue:serum concentration ratios of 5–10 have been observed (Chow and Woodbury
1970). The elimination half-time for the thyroid was estimated in rats to be approximately 10–20 hours
(Fisher et al. 2000; Goldman and Stanbury 1973; Yu et al. 2002).
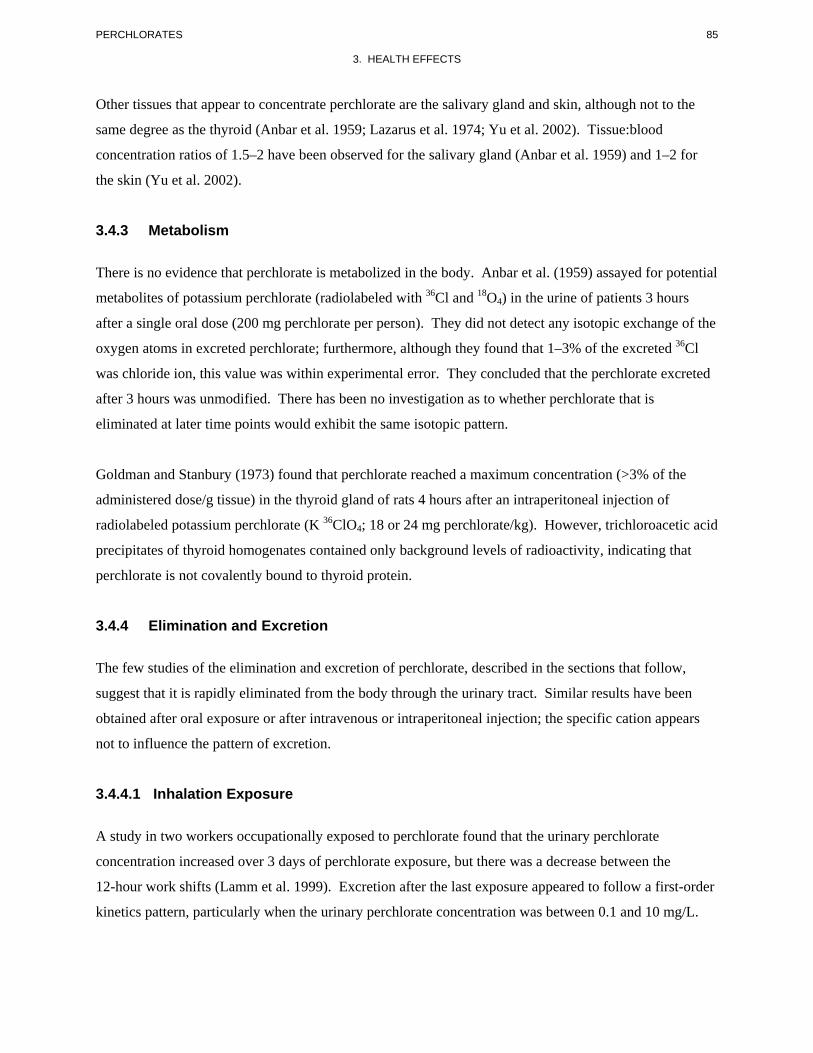
85 PERCHLORATES
3. HEALTH EFFECTS
Other tissues that appear to concentrate perchlorate are the salivary gland and skin, although not to the
same degree as the thyroid (Anbar et al. 1959; Lazarus et al. 1974; Yu et al. 2002). Tissue:blood
concentration ratios of 1.5–2 have been observed for the salivary gland (Anbar et al. 1959) and 1–2 for
the skin (Yu et al. 2002).
3.4.3 Metabolism
There is no evidence that perchlorate is metabolized in the body. Anbar et al. (1959) assayed for potential
metabolites of potassium perchlorate (radiolabeled with 36Cl and 18O4) in the urine of patients 3 hours
after a single oral dose (200 mg perchlorate per person). They did not detect any isotopic exchange of the
oxygen atoms in excreted perchlorate; furthermore, although they found that 1–3% of the excreted 36Cl
was chloride ion, this value was within experimental error. They concluded that the perchlorate excreted
after 3 hours was unmodified. There has been no investigation as to whether perchlorate that is
eliminated at later time points would exhibit the same isotopic pattern.
Goldman and Stanbury (1973) found that perchlorate reached a maximum concentration (>3% of the
administered dose/g tissue) in the thyroid gland of rats 4 hours after an intraperitoneal injection of
radiolabeled potassium perchlorate (K 36ClO4; 18 or 24 mg perchlorate/kg). However, trichloroacetic acid
precipitates of thyroid homogenates contained only background levels of radioactivity, indicating that
perchlorate is not covalently bound to thyroid protein.
3.4.4 Elimination and Excretion
The few studies of the elimination and excretion of perchlorate, described in the sections that follow,
suggest that it is rapidly eliminated from the body through the urinary tract. Similar results have been
obtained after oral exposure or after intravenous or intraperitoneal injection; the specific cation appears
not to influence the pattern of excretion.
3.4.4.1 Inhalation Exposure
A study in two workers occupationally exposed to perchlorate found that the urinary perchlorate
concentration increased over 3 days of perchlorate exposure, but there was a decrease between the
12-hour work shifts (Lamm et al. 1999). Excretion after the last exposure appeared to follow a first-order
kinetics pattern, particularly when the urinary perchlorate concentration was between 0.1 and 10 mg/L.

86 PERCHLORATES
3. HEALTH EFFECTS
The average elimination half-life for the two workers was approximately 8 hours. No information was
located regarding excretion of perchlorate in animals following inhalation exposure.
3.4.4.2 Oral Exposure
In adult human subjects who ingested potassium perchlorate in drinking water (0.14 mg/kg/day) for
14 days, urinary excretion rate of perchlorate was 77% of the dose/day after 7 days of exposure,
indicating that urine is the main excretory pathway for absorbed perchlorate (Lawrence et al. 2000). The
urinary excretion rate of perchlorate returned to control levels (<0.5 mg/day) within 14 days after
exposure to perchlorate was terminated (Lawrence et al. 2000). Perchlorate was detected in the urine of
two adults at 10 minutes after a single oral dose of sodium perchlorate (784 mg perchlorate per person);
urinary excretion as a percentage of the dose was 30% at 3 hours, 50% in at 5 hours, 85% at 24 hours, and
95% at 48 hours (Durand 1938). This suggests an excretion half-time of approximately 12 hours. The
latter estimate is consistent with the elimination kinetics of perchlorate from serum. The elimination half
time for perchlorate in serum was estimated to be approximately 8 hours in adult human subjects who
ingested potassium perchlorate in drinking water (0.5 mg/kg/day) for 14 days (Greer et al. 2002). In
another study in adult humans, it was estimated that approximately 65–70% of a daily dose of 0.5–3 mg
perchlorate/day was excreted over a 24-hour period (Braverman et al. 2006). Thus, in humans,
perchlorate is rapidly eliminated and would not be expected to accumulate in the body with prolonged
exposure. Based on an elimination half-time of approximately 8–12 hours, a steady state would be
achieved within 3–4 days of continuous exposure. The detection of perchlorate in breast milk from
lactating women (Kirk et al. 2005; Pearce et al. 2007; Téllez et al. 2005) also indicates breast milk as an
excretion route in humans.
Studies conducted in a variety of experimental animals, including rats, rabbits, and calves, have shown
that absorbed perchlorate is rapidly and nearly completely excreted in the urine (Fisher et al. 2000;
Selivanova et al. 1986; Yu et al. 2002).
Studies conducted in rats have shown that perchlorate is excreted in mammary milk (Clewell et al.
2003b). Perchlorate has also been detected in dairy milk (Howard et al. 1996; Kirk et al. 2005).
3.4.4.3 Dermal Exposure
No studies were found regarding elimination or excretion of perchlorates after dermal exposure.

87 PERCHLORATES
3. HEALTH EFFECTS
3.4.4.4 Other Routes of Exposure
Studies in which rats received intravenous or intraperitoneal injections of perchlorate provide additional
support for the rapid excretion of perchlorate in urine. Rats that received a single intravenous injection of
0.01, 0.1, 1.0, or 3.0 mg/kg perchlorate (as ammonium perchlorate) excreted 85, 86, 80, or 79% of the
administered dose, respectively, in urine (Fisher et al. 2000). The elimination half-time for intravenously
injected perchlorate (approximately 0.04 mg, 0.18–0.25 mg/kg, as potassium perchlorate) from serum,
and the urinary excretion half-time were estimated in rats to be approximately 20 hours (Goldman and
Stanbury 1973). Similarly, rats injected with sodium perchlorate (2, 8, or 49 mg perchlorate/kg) excreted
50% of the administered dose in urine during the first 6 hours and had excreted 93–97% of the dose by
60 hours (Eichler and Hackenthal 1962); in this study, higher doses of perchlorate were eliminated at a
faster rate than lower doses. Similar results were obtained in rats that received a single intravenous dose
of 3.3 mg/kg perchlorate as ammonium perchlorate; urinary excretion of perchlorate was essentially
complete within 12 hours (Yu et al. 2002). Possible contributors to the relatively longer elimination half-
life of perchlorate in rats than in humans include differences in serum protein binding or perhaps the NIS
protein in the gastrointestinal tract may sequester perchlorate temporarily to a greater degree in the rat
than human.
3.4.5 Physiologically Based Pharmacokinetic (PBPK)/Pharmacodynamic (PD) Models
Physiologically based pharmacokinetic (PBPK) models use mathematical descriptions of the uptake and
disposition of chemical substances to quantitatively describe the relationships among critical biological
processes (Krishnan et al. 1994). PBPK models are also called biologically based tissue dosimetry
models. PBPK models are increasingly used in risk assessments, primarily to predict the concentration of
potentially toxic moieties of a chemical that will be delivered to any given target tissue following various
combinations of route, dose level, and test species (Clewell and Andersen 1985). Physiologically based
pharmacodynamic (PBPD) models use mathematical descriptions of the dose-response function to
quantitatively describe the relationship between target tissue dose and toxic end points.
PBPK/PD models refine our understanding of complex quantitative dose behaviors by helping to
delineate and characterize the relationships between: (1) the external/exposure concentration and target
tissue dose of the toxic moiety, and (2) the target tissue dose and observed responses (Andersen and
Krishnan 1994; Andersen et al. 1987). These models are biologically and mechanistically based and can
be used to extrapolate the pharmacokinetic behavior of chemical substances from high to low dose, from
route to route, between species, and between subpopulations within a species. The biological basis of
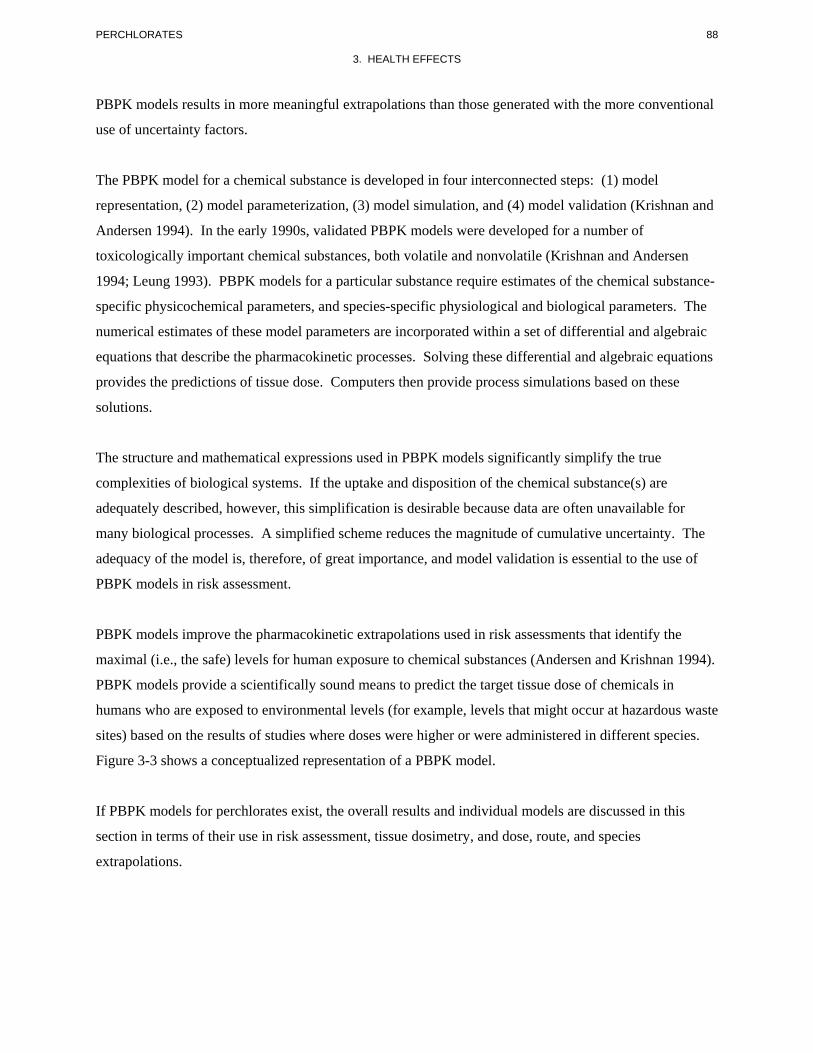
88 PERCHLORATES
3. HEALTH EFFECTS
PBPK models results in more meaningful extrapolations than those generated with the more conventional
use of uncertainty factors.
The PBPK model for a chemical substance is developed in four interconnected steps: (1) model
representation, (2) model parameterization, (3) model simulation, and (4) model validation (Krishnan and
Andersen 1994). In the early 1990s, validated PBPK models were developed for a number of
toxicologically important chemical substances, both volatile and nonvolatile (Krishnan and Andersen
1994; Leung 1993). PBPK models for a particular substance require estimates of the chemical substance-
specific physicochemical parameters, and species-specific physiological and biological parameters. The
numerical estimates of these model parameters are incorporated within a set of differential and algebraic
equations that describe the pharmacokinetic processes. Solving these differential and algebraic equations
provides the predictions of tissue dose. Computers then provide process simulations based on these
solutions.
The structure and mathematical expressions used in PBPK models significantly simplify the true
complexities of biological systems. If the uptake and disposition of the chemical substance(s) are
adequately described, however, this simplification is desirable because data are often unavailable for
many biological processes. A simplified scheme reduces the magnitude of cumulative uncertainty. The
adequacy of the model is, therefore, of great importance, and model validation is essential to the use of
PBPK models in risk assessment.
PBPK models improve the pharmacokinetic extrapolations used in risk assessments that identify the
maximal (i.e., the safe) levels for human exposure to chemical substances (Andersen and Krishnan 1994).
PBPK models provide a scientifically sound means to predict the target tissue dose of chemicals in
humans who are exposed to environmental levels (for example, levels that might occur at hazardous waste
sites) based on the results of studies where doses were higher or were administered in different species.
Figure 3-3 shows a conceptualized representation of a PBPK model.
If PBPK models for perchlorates exist, the overall results and individual models are discussed in this
section in terms of their use in risk assessment, tissue dosimetry, and dose, route, and species
extrapolations.
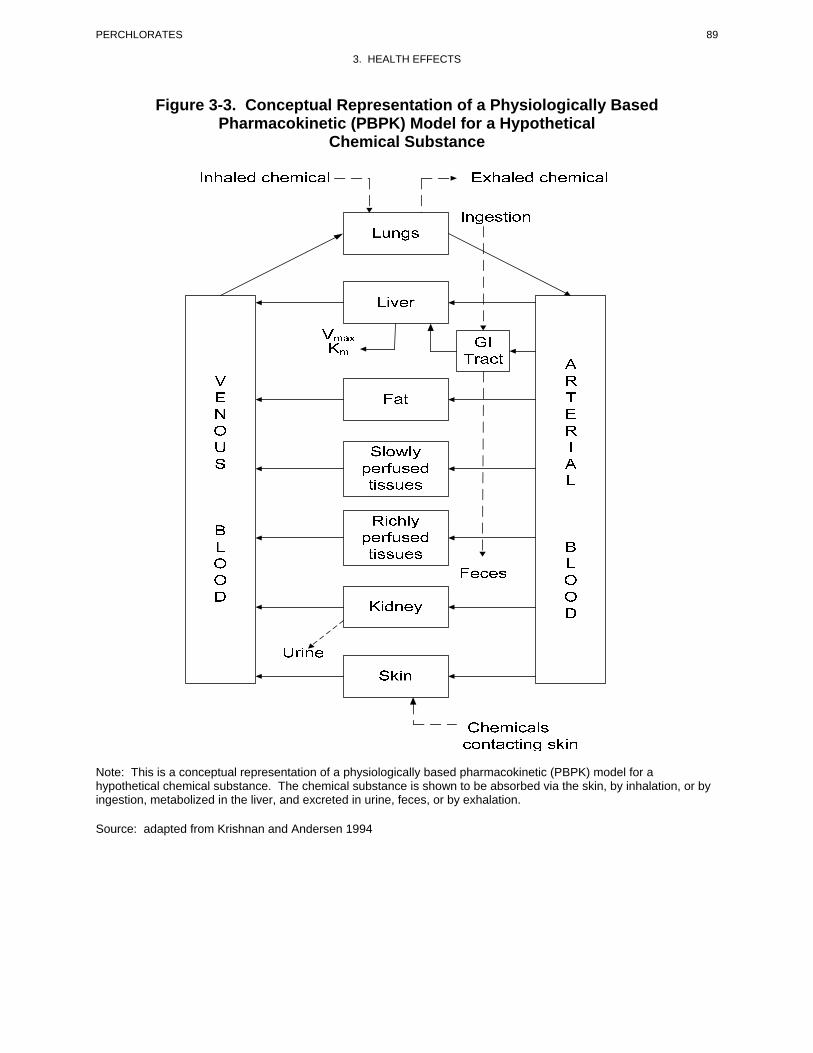
89 PERCHLORATES
3. HEALTH EFFECTS
Figure 3-3. Conceptual Representation of a Physiologically Based Pharmacokinetic (PBPK) Model for a Hypothetical
Chemical Substance
Note: This is a conceptual representation of a physiologically based pharmacokinetic (PBPK) model for a hypothetical chemical substance. The chemical substance is shown to be absorbed via the skin, by inhalation, or by ingestion, metabolized in the liver, and excreted in urine, feces, or by exhalation.
Source: adapted from Krishnan and Andersen 1994

90 PERCHLORATES
3. HEALTH EFFECTS
Perchlorate PBPK Models
Description of the models. PBPK models of the kinetics of ingested or injected perchlorate in rats
and humans have been developed (Fisher et al. 2000; Merrill et al. 2003, 2005). The models were
developed simultaneously with models of radioiodide biokinetics. When combined, the perchlorate and
radioiodide models simulate the competitive inhibition of radioiodide transport by perchlorate in thyroid
and other tissues that have NIS activity. The adult rat model was extended to include pregnancy and
maternal-fetal transfer of perchlorate, and lactation and maternal-pup perchlorate transfer through milk
(Clewell et al. 2003a, 2003b). Corresponding human models of pregnancy, maternal-fetal transfer, and
maternal-infant transfer of perchlorate were developed (Clewell et al. 2007).
The adult rat and human models have the same structure and differ only in values for physiological and
some of perchlorate parameters (Table 3-3, Figure 3-4). Both models simulate nine tissue compartments:
blood, kidney, liver, skin, stomach, thyroid, fat, other slowly perfused tissues, and other richly perfused
tissues. Uptakes from blood into the tissue vascular compartments are simulated as flow-limited
processes. Distributions within blood, skin, stomach, and thyroid are simulated as diffusion limited
processes with first-order clearance terms. Excretion is described with a first-order clearance term for
transfer of perchlorate from the kidney into urine. Uptake of perchlorate into tissues that have NIS
activity are simulated using a Michaelis-Menten approach with tissue- and species-specific maximum
velocities and affinity constants that are conserved across tissues and species. This includes uptake of
perchlorate into thyroid follicle cells. Secretion of perchlorate into the follicle lumen, thought to be
mediated by the pendrin anion transporter, is simulated using a Michaelis-Menten approach.
Upregulation of NIS (i.e., induction in response to TSH) is simulated by fitting increased maximum
velocities of perchlorate and radioiodide transport into the thyroid gland. The model does not explicitly
include TSH-dependence of NIS levels or other aspects of the metabolism of iodide within the thyroid
(e.g., hormone production and secretion), and does not simulate changes in TSH levels resulting from NIS
inhibition. Active transport of perchlorate into the stomach lumen and in skin is also simulated in the
models.
Extensions of the adult models to simulate perchlorate (and radioiodide) kinetics during pregnancy in rats
and humans include the addition of two additional compartments representing the mammary gland and
placenta (Clewell et al. 2003a, 2003b, 2007). The structure of the human pregnancy and lactation models
for perchlorate (which are identical to the corresponding rat models) are shown in Figure 3-5. Parameter
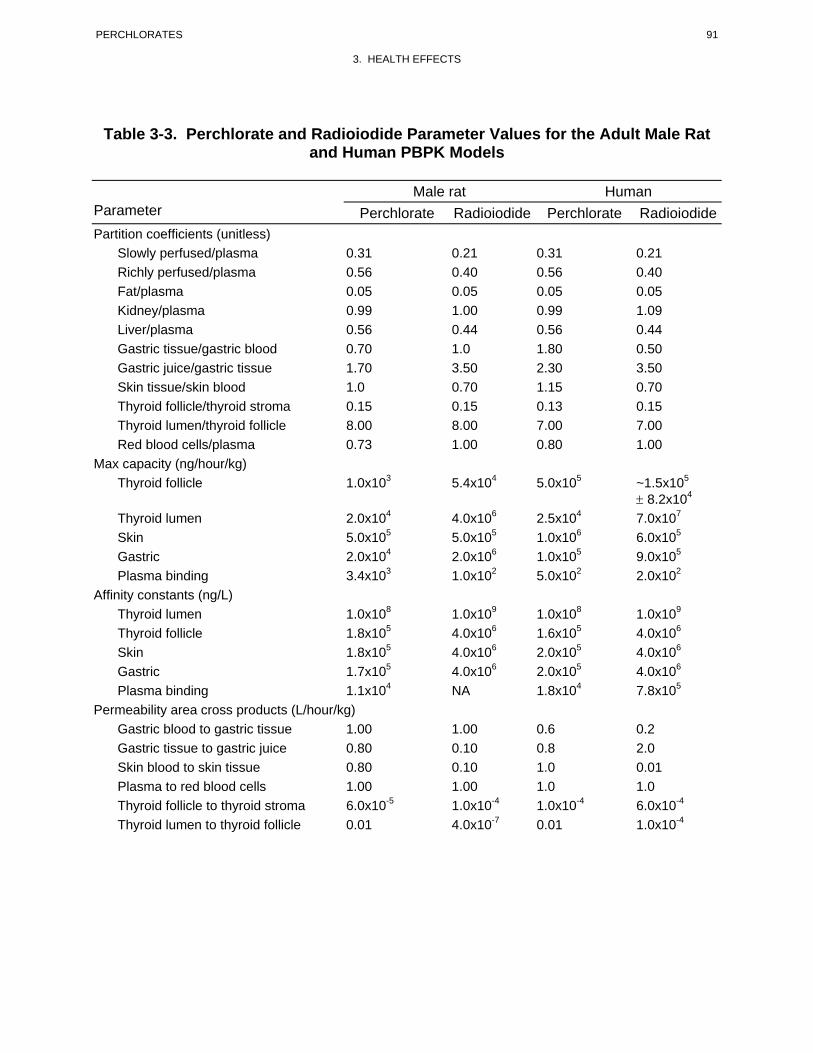
91 PERCHLORATES
3. HEALTH EFFECTS
Table 3-3. Perchlorate and Radioiodide Parameter Values for the Adult Male Rat and Human PBPK Models
Male rat Human Parameter Perchlorate Radioiodide Perchlorate Radioiodide Partition coefficients (unitless) Slowly perfused/plasma 0.31 0.21 0.31 0.21 Richly perfused/plasma 0.56 0.40 0.56 0.40 Fat/plasma 0.05 0.05 0.05 0.05 Kidney/plasma 0.99 1.00 0.99 1.09 Liver/plasma 0.56 0.44 0.56 0.44
Gastric tissue/gastric blood 0.70 1.0 1.80 0.50 Gastric juice/gastric tissue 1.70 3.50 2.30 3.50 Skin tissue/skin blood 1.0 0.70 1.15 0.70 Thyroid follicle/thyroid stroma 0.15 0.15 0.13 0.15 Thyroid lumen/thyroid follicle 8.00 8.00 7.00 7.00
Red blood cells/plasma 0.73 1.00 0.80 1.00 Max capacity (ng/hour/kg) Thyroid follicle 1.0x10³ 5.4x10⁴ 5.0x10⁵ ~1.5x10⁵
± 8.2x10⁴
Thyroid lumen 2.0x10⁴ 4.0x10⁶ 2.5x10⁴ 7.0x10⁷
Skin 5.0x10⁵ 5.0x10⁵ 1.0x10⁶ 6.0x10⁵
Gastric 2.0x10⁴ 2.0x10⁶ 1.0x10⁵ 9.0x10⁵
Plasma binding 3.4x10³ 1.0x10² 5.0x10² 2.0x10²
Affinity constants (ng/L) Thyroid lumen 1.0x10⁸ 1.0x10⁹ 1.0x10⁸ 1.0x10⁹
Thyroid follicle 1.8x10⁵ 4.0x10⁶ 1.6x10⁵ 4.0x10⁶
Skin 1.8x10⁵ 4.0x10⁶ 2.0x10⁵ 4.0x10⁶
Gastric 1.7x10⁵ 4.0x10⁶ 2.0x10⁵ 4.0x10⁶
Plasma binding 1.1x10⁴ NA 1.8x10⁴ 7.8x10⁵
Permeability area cross products (L/hour/kg) Gastric blood to gastric tissue 1.00 1.00 0.6 0.2 Gastric tissue to gastric juice 0.80 0.10 0.8 2.0 Skin blood to skin tissue 0.80 0.10 1.0 0.01 Plasma to red blood cells 1.00 1.00 1.0 1.0 Thyroid follicle to thyroid stroma 6.0x10⁻⁵ 1.0x10⁻⁴ 1.0x10⁻⁴ 6.0x10⁻⁴
Thyroid lumen to thyroid follicle 0.01 4.0x10⁻⁷ 0.01 1.0x10⁻⁴
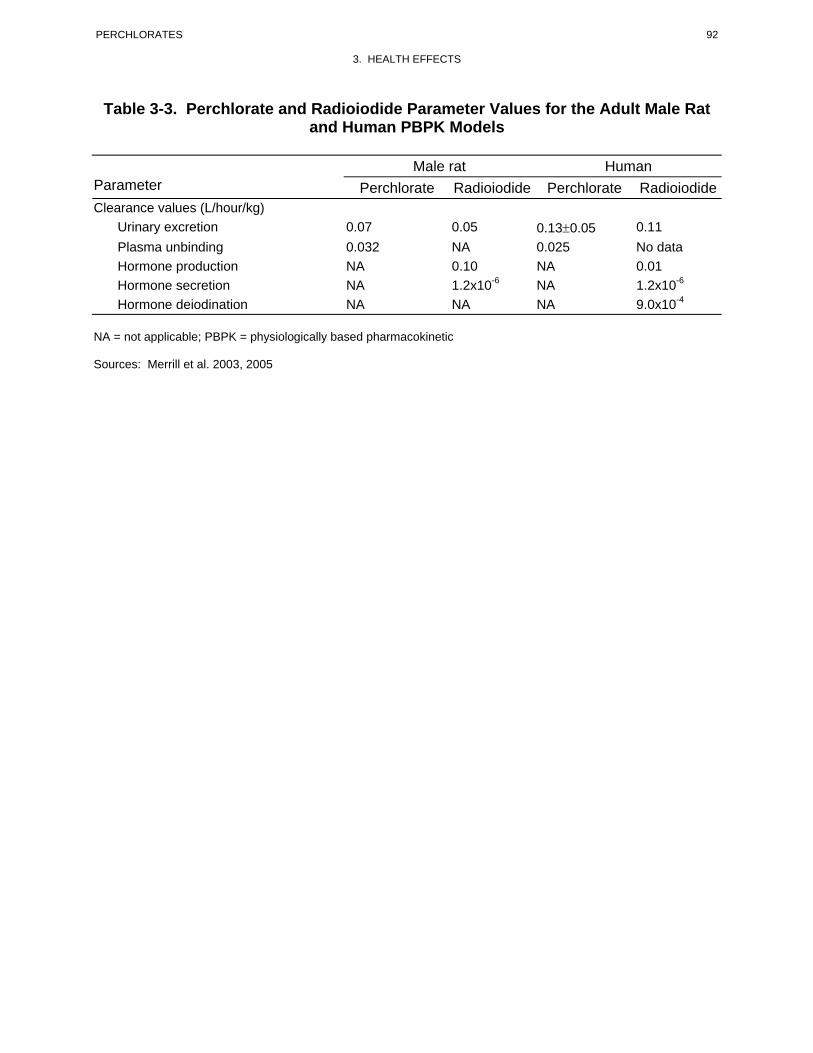
92 PERCHLORATES
3. HEALTH EFFECTS
Table 3-3. Perchlorate and Radioiodide Parameter Values for the Adult Male Rat and Human PBPK Models
Male rat Human Parameter Perchlorate Radioiodide Perchlorate Radioiodide Clearance values (L/hour/kg) Urinary excretion 0.07 0.05 0.13±0.05 0.11
Plasma unbinding 0.032 NA 0.025 No data Hormone production NA 0.10 NA 0.01 Hormone secretion NA 1.2x10⁻⁶ NA 1.2x10⁻⁶
Hormone deiodination NA NA NA 9.0x10⁻⁴
NA = not applicable; PBPK = physiologically based pharmacokinetic
Sources: Merrill et al. 2003, 2005

93 PERCHLORATES
3. HEALTH EFFECTS
Figure 3-4. Structure of PBPK Model of Perchlorate in Typical Adult Humans and Male Rats*
i.v.i.v Dose. Dose
Oral DoseOral Dose
boundbound freefreePlasmaPlasmaRBC’s QCRBC’s QC
StomacStoma hch ContenConte tsnts
StomacStoma hch TissueTissue
StomachStomach BlB oodlood
QGQGQGQG
QLQLLiverLiver
RichlyRichlyPeP rfusederfused
KidneyKidney
ColloidColloid
ThyroidThyroid FollicleFollicleStromaStroma
SkinSkin
Skin BloodSkin Blood
FatFat
SlowlSlow ylyPerfusedPerfused
QRQRUrineUrine
QKQK
QTQT
QSKQSK
QFQF
QSQS
*Bold arrows within tissue compartments indicate active transport (i.e., Michaelis-Menten), thin arrows represent first-order rate transfers, and double arrows represent passive diffusion. Q indicates blood flow.
PBPK = physiologically based pharmacokinetic
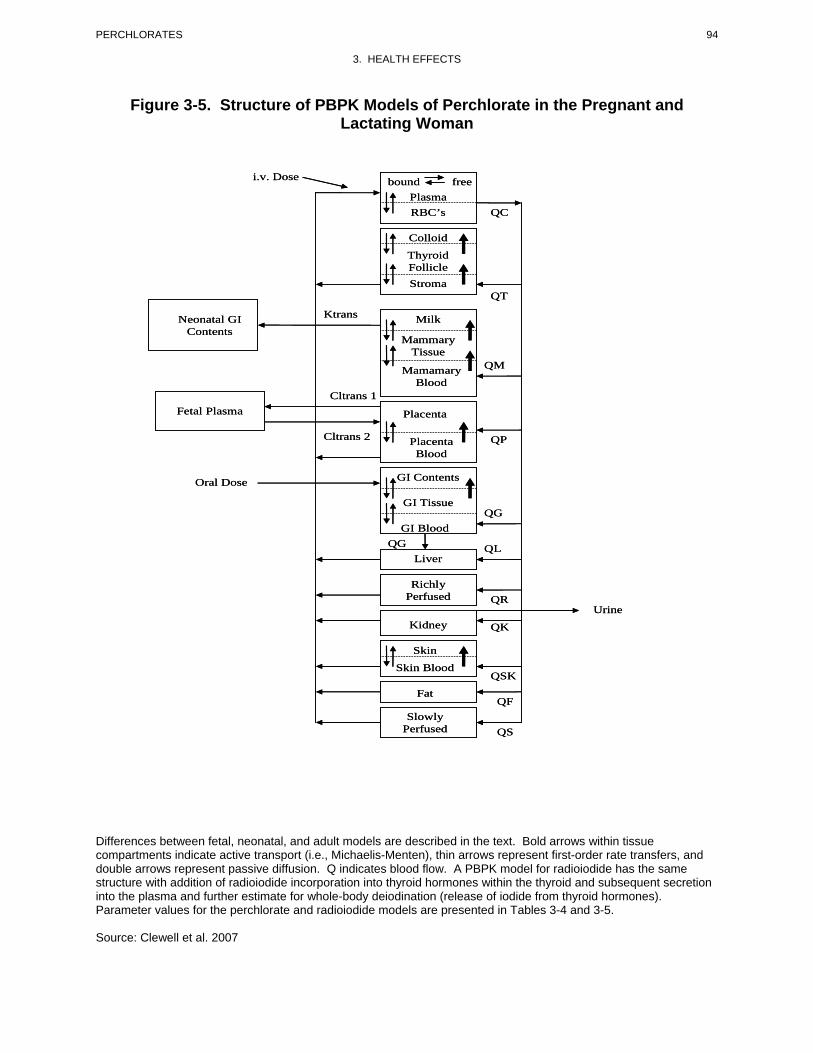
94 PERCHLORATES
3. HEALTH EFFECTS
Figure 3-5. Structure of PBPK Models of Perchlorate in the Pregnant and Lactating Woman
i.v. Dosei.v. Dose
Neonatal GINeonatal GIContentsContents
Fetal PlasmaFetal Plasma
Oral DoseOral Dose
bounbo dund freefreePlasmaPlasmaRBC’s QCRBC’s QC
ColloidColloid
ThyroidThyroid FollicleFollicleStromaStroma
QTQT
KtransKtrans MilkMilk
MammarMa ymmaryTissueTissue
QMQMMamamaryMamamaryBloodBlood
CltransCltr 1ans 1
PlacentaPlacenta
Cltrans 2ansCltr 2 Placenta QPPlacenta QPBloodBlood
QGQG
QGQG QLQL
QRQRRichly
Perfused Richly
PerfusedUrineUrine
QKQKKidneyKidney
SkinSkin
Skin BloodSkin BloodQSKQSK
QFQFFatFat
Slowly Perfused Slowly
Perfused QSQS
GI Contents
GI Tissue
GI Blood
Liver
GI Contents
GI Tissue
GI Blood
Liver
Differences between fetal, neonatal, and adult models are described in the text. Bold arrows within tissue compartments indicate active transport (i.e., Michaelis-Menten), thin arrows represent first-order rate transfers, and double arrows represent passive diffusion. Q indicates blood flow. A PBPK model for radioiodide has the same structure with addition of radioiodide incorporation into thyroid hormones within the thyroid and subsequent secretion into the plasma and further estimate for whole-body deiodination (release of iodide from thyroid hormones). Parameter values for the perchlorate and radioiodide models are presented in Tables 3-4 and 3-5.
Source: Clewell et al. 2007
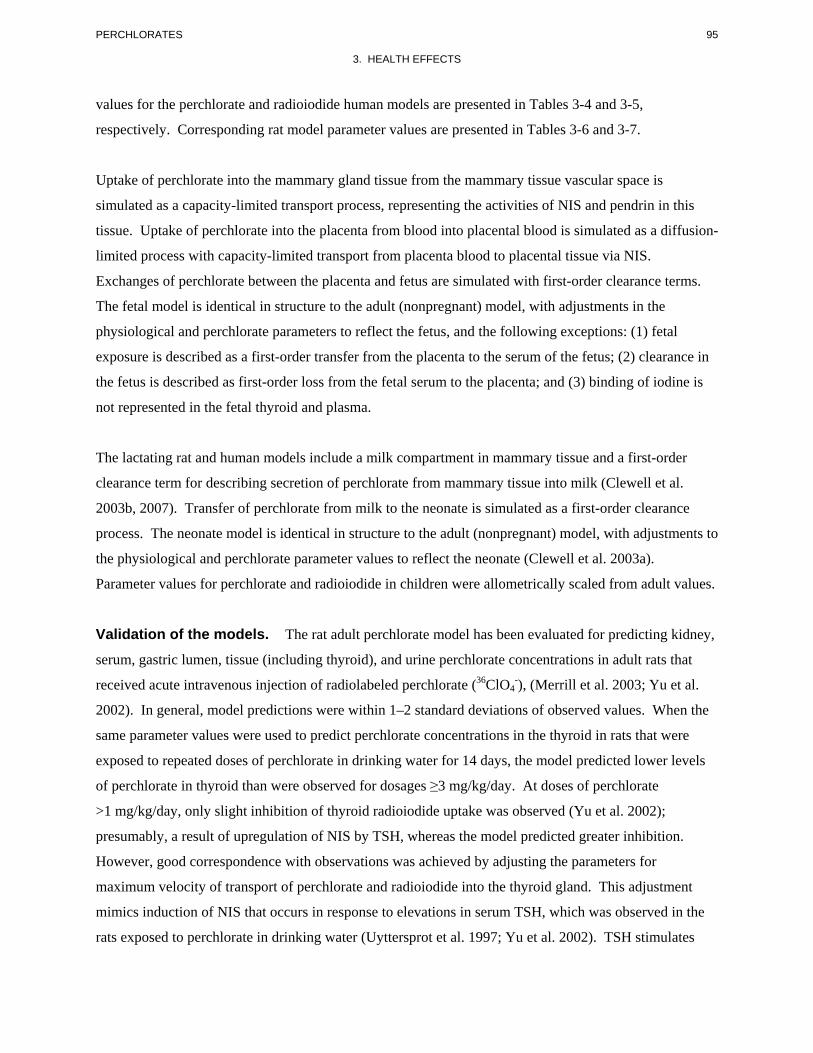
95 PERCHLORATES
3. HEALTH EFFECTS
values for the perchlorate and radioiodide human models are presented in Tables 3-4 and 3-5,
respectively. Corresponding rat model parameter values are presented in Tables 3-6 and 3-7.
Uptake of perchlorate into the mammary gland tissue from the mammary tissue vascular space is
simulated as a capacity-limited transport process, representing the activities of NIS and pendrin in this
tissue. Uptake of perchlorate into the placenta from blood into placental blood is simulated as a diffusion-
limited process with capacity-limited transport from placenta blood to placental tissue via NIS.
Exchanges of perchlorate between the placenta and fetus are simulated with first-order clearance terms.
The fetal model is identical in structure to the adult (nonpregnant) model, with adjustments in the
physiological and perchlorate parameters to reflect the fetus, and the following exceptions: (1) fetal
exposure is described as a first-order transfer from the placenta to the serum of the fetus; (2) clearance in
the fetus is described as first-order loss from the fetal serum to the placenta; and (3) binding of iodine is
not represented in the fetal thyroid and plasma.
The lactating rat and human models include a milk compartment in mammary tissue and a first-order
clearance term for describing secretion of perchlorate from mammary tissue into milk (Clewell et al.
2003b, 2007). Transfer of perchlorate from milk to the neonate is simulated as a first-order clearance
process. The neonate model is identical in structure to the adult (nonpregnant) model, with adjustments to
the physiological and perchlorate parameter values to reflect the neonate (Clewell et al. 2003a).
Parameter values for perchlorate and radioiodide in children were allometrically scaled from adult values.
Validation of the models. The rat adult perchlorate model has been evaluated for predicting kidney,
serum, gastric lumen, tissue (including thyroid), and urine perchlorate concentrations in adult rats that
received acute intravenous injection of radiolabeled perchlorate (36ClO4-), (Merrill et al. 2003; Yu et al.
2002). In general, model predictions were within 1–2 standard deviations of observed values. When the
same parameter values were used to predict perchlorate concentrations in the thyroid in rats that were
exposed to repeated doses of perchlorate in drinking water for 14 days, the model predicted lower levels
of perchlorate in thyroid than were observed for dosages ≥3 mg/kg/day. At doses of perchlorate
>1 mg/kg/day, only slight inhibition of thyroid radioiodide uptake was observed (Yu et al. 2002);
presumably, a result of upregulation of NIS by TSH, whereas the model predicted greater inhibition.
However, good correspondence with observations was achieved by adjusting the parameters for
maximum velocity of transport of perchlorate and radioiodide into the thyroid gland. This adjustment
mimics induction of NIS that occurs in response to elevations in serum TSH, which was observed in the
rats exposed to perchlorate in drinking water (Uyttersprot et al. 1997; Yu et al. 2002). TSH stimulates
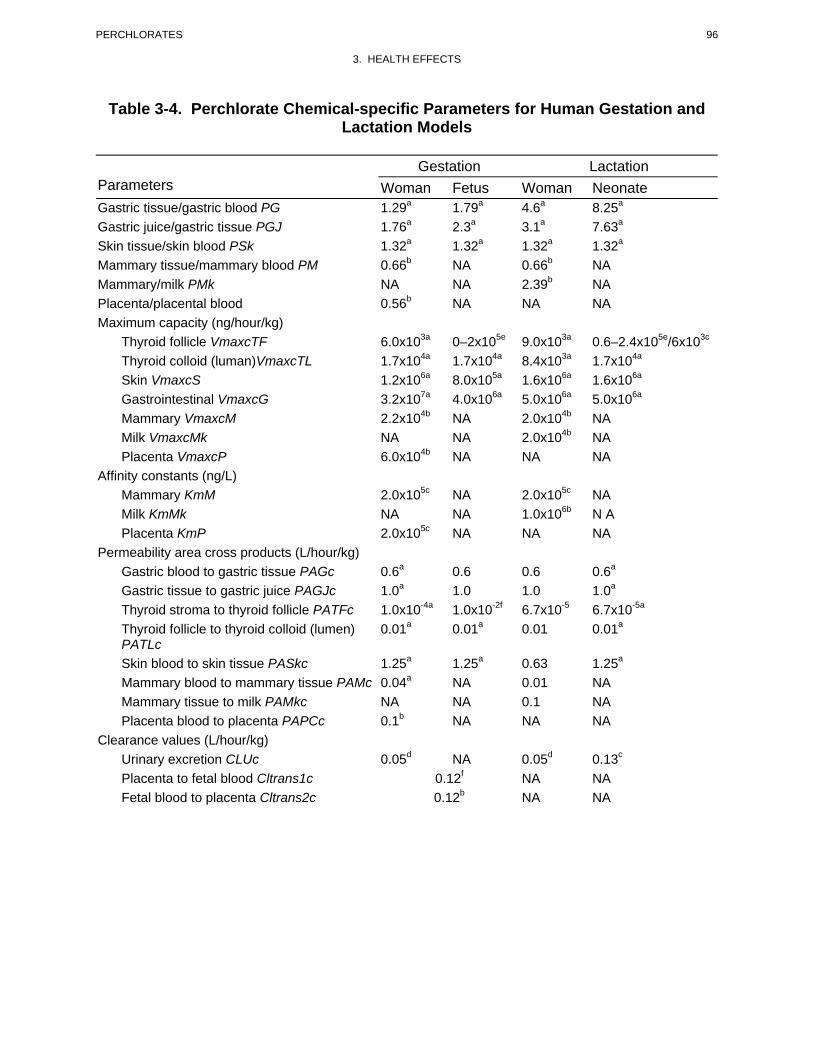
96 PERCHLORATES
3. HEALTH EFFECTS
Table 3-4. Perchlorate Chemical-specific Parameters for Human Gestation and Lactation Models
Gestation Lactation Parameters Woman Fetus Woman Neonate Gastric tissue/gastric blood PG 1.29a 1.79a 4.6a 8.25a
Gastric juice/gastric tissue PGJ 1.76a 2.3a 3.1a 7.63a
Skin tissue/skin blood PSk 1.32a 1.32a 1.32a 1.32a
Mammary tissue/mammary blood PM 0.66b NA 0.66b NA Mammary/milk PMk NA NA 2.39b NA Placenta/placental blood 0.56b NA NA NA Maximum capacity (ng/hour/kg) Thyroid follicle VmaxcTF 6.0x10³a 0–2x10⁵e 9.0x10³a 0.6–2.4x10⁵e/6x103c
Thyroid colloid (luman)VmaxcTL 1.7x10⁴a 1.7x10⁴a 8.4x10³a 1.7x10⁴a
Skin VmaxcS 1.2x10⁶a 8.0x10⁵a 1.6x10⁶a 1.6x10⁶a
Gastrointestinal VmaxcG 3.2x10⁷a 4.0x10⁶a 5.0x10⁶a 5.0x10⁶a
Mammary VmaxcM 2.2x10⁴b NA 2.0x10⁴b NA Milk VmaxcMk NA NA 2.0x10⁴b NA Placenta VmaxcP 6.0x10⁴b NA NA NA
Affinity constants (ng/L) Mammary KmM 2.0x10⁵c NA 2.0x10⁵c NA Milk KmMk NA NA 1.0x10⁶b N A Placenta KmP 2.0x10⁵c NA NA NA
Permeability area cross products (L/hour/kg) Gastric blood to gastric tissue PAGc 0.6a 0.6 0.6 0.6a
Gastric tissue to gastric juice PAGJc 1.0a 1.0 1.0 1.0a
Thyroid stroma to thyroid follicle PATFc 1.0x10⁻⁴a 1.0x10⁻²f 6.7x10⁻⁵ 6.7x10⁻⁵a
Thyroid follicle to thyroid colloid (lumen) 0.01a 0.01a 0.01 0.01a
PATLc
Skin blood to skin tissue PASkc 1.25a 1.25a 0.63 1.25a
Mammary blood to mammary tissue PAMc 0.04a NA 0.01 NA
Mammary tissue to milk PAMkc NA NA 0.1 NA
Placenta blood to placenta PAPCc 0.1b NA NA NA
Clearance values (L/hour/kg) Urinary excretion CLUc 0.05d NA 0.05d 0.13c
Placenta to fetal blood Cltrans1c 0.12f NA NA Fetal blood to placenta Cltrans2c 0.12b NA NA
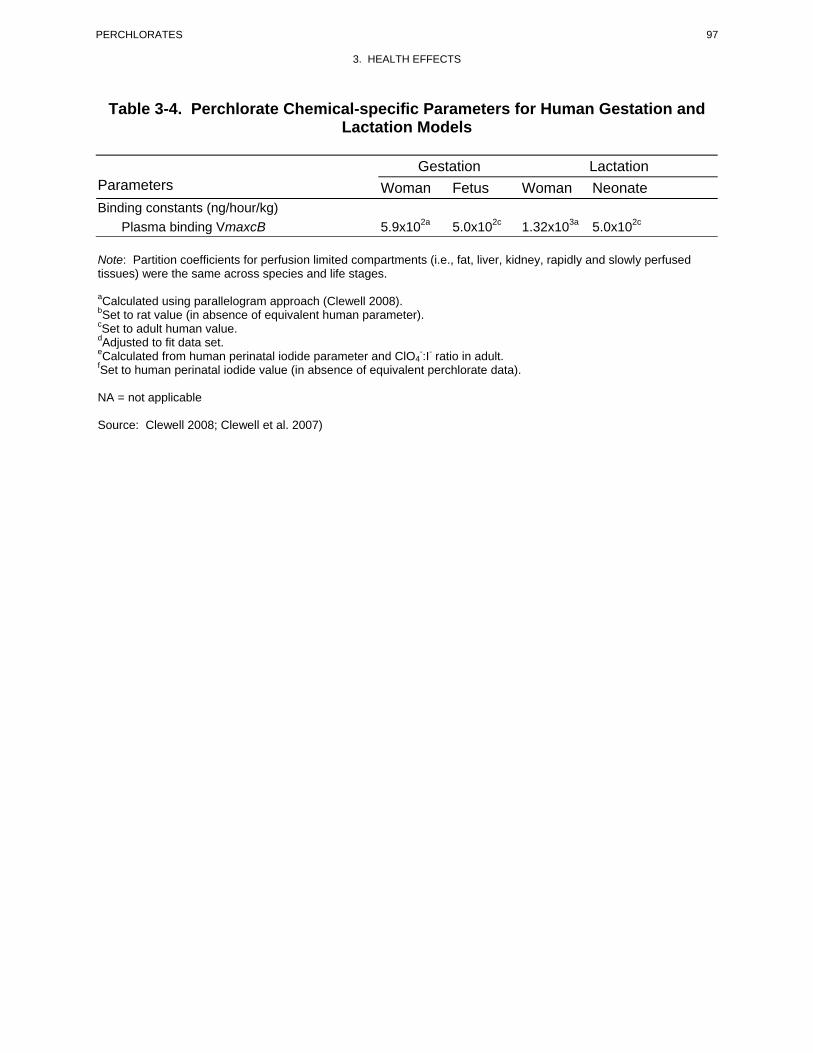
97 PERCHLORATES
3. HEALTH EFFECTS
Table 3-4. Perchlorate Chemical-specific Parameters for Human Gestation and Lactation Models
Gestation Lactation Parameters Woman Fetus Woman Neonate Binding constants (ng/hour/kg)
Plasma binding VmaxcB 5.9x10²a 5.0x10²c 1.32x10³a 5.0x10²c
Note: Partition coefficients for perfusion limited compartments (i.e., fat, liver, kidney, rapidly and slowly perfused tissues) were the same across species and life stages.
aCalculated using parallelogram approach (Clewell 2008). bSet to rat value (in absence of equivalent human parameter). cSet to adult human value. dAdjusted to fit data set. eCalculated from human perinatal iodide parameter and ClO4
-:I- ratio in adult. fSet to human perinatal iodide value (in absence of equivalent perchlorate data).
NA = not applicable
Source: Clewell 2008; Clewell et al. 2007)
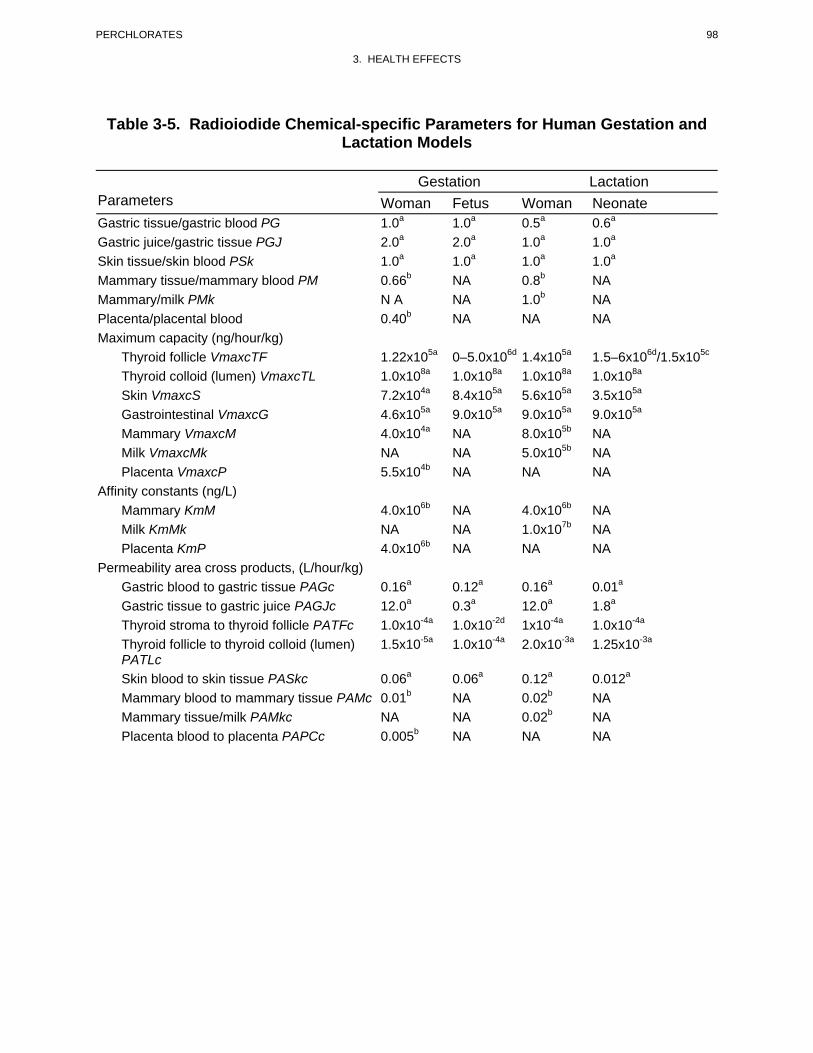
98 PERCHLORATES
3. HEALTH EFFECTS
Table 3-5. Radioiodide Chemical-specific Parameters for Human Gestation and Lactation Models
Gestation Lactation Parameters Woman Fetus Woman Neonate Gastric tissue/gastric blood PG 1.0a 1.0a 0.5a 0.6a
Gastric juice/gastric tissue PGJ 2.0a 2.0a 1.0a 1.0a
Skin tissue/skin blood PSk 1.0a 1.0a 1.0a 1.0a
Mammary tissue/mammary blood PM 0.66b NA 0.8b NA Mammary/milk PMk N A NA 1.0b NA Placenta/placental blood 0.40b NA NA NA Maximum capacity (ng/hour/kg) Thyroid follicle VmaxcTF 1.22x10⁵a 0–5.0x10⁶d 1.4x10⁵a 1.5–6x10⁶d/1.5x105c
Thyroid colloid (lumen) VmaxcTL 1.0x10⁸a 1.0x10⁸a 1.0x10⁸a 1.0x10⁸a
Skin VmaxcS 7.2x10⁴a 8.4x10⁵a 5.6x10⁵a 3.5x10⁵a
Gastrointestinal VmaxcG 4.6x10⁵a 9.0x10⁵a 9.0x10⁵a 9.0x10⁵a
Mammary VmaxcM 4.0x10⁴a NA 8.0x10⁵b NA Milk VmaxcMk NA NA 5.0x10⁵b NA Placenta VmaxcP 5.5x10⁴b NA NA NA
Affinity constants (ng/L) Mammary KmM 4.0x10⁶b NA 4.0x10⁶b NA Milk KmMk NA NA 1.0x10⁷b NA Placenta KmP 4.0x10⁶b NA NA NA
Permeability area cross products, (L/hour/kg) Gastric blood to gastric tissue PAGc 0.16a 0.12a 0.16a 0.01a
Gastric tissue to gastric juice PAGJc 12.0a 0.3a 12.0a 1.8a
Thyroid stroma to thyroid follicle PATFc 1.0x10⁻⁴a 1.0x10⁻²d 1x10⁻⁴a 1.0x10⁻⁴a
Thyroid follicle to thyroid colloid (lumen) 1.5x10⁻⁵a 1.0x10⁻⁴a 2.0x10⁻³a 1.25x10⁻³a
PATLc Skin blood to skin tissue PASkc 0.06a 0.06a 0.12a 0.012a
Mammary blood to mammary tissue PAMc 0.01b NA 0.02b NA Mammary tissue/milk PAMkc NA NA 0.02b NA
Placenta blood to placenta PAPCc 0.005b NA NA NA
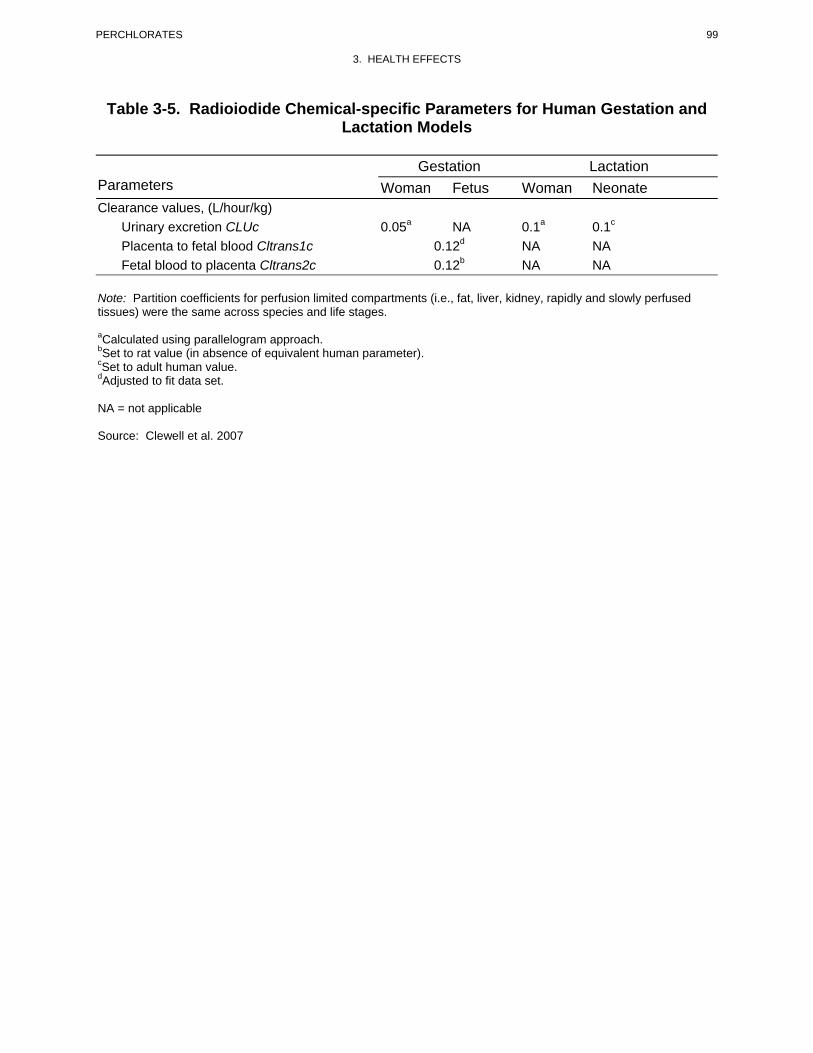
99 PERCHLORATES
3. HEALTH EFFECTS
Table 3-5. Radioiodide Chemical-specific Parameters for Human Gestation and Lactation Models
Gestation Lactation Parameters Woman Fetus Woman Neonate Clearance values, (L/hour/kg) Urinary excretion CLUc 0.05a NA 0.1a 0.1c
Placenta to fetal blood Cltrans1c 0.12d NA NA Fetal blood to placenta Cltrans2c 0.12b NA NA
Note: Partition coefficients for perfusion limited compartments (i.e., fat, liver, kidney, rapidly and slowly perfused tissues) were the same across species and life stages.
aCalculated using parallelogram approach. bSet to rat value (in absence of equivalent human parameter). cSet to adult human value. dAdjusted to fit data set.
NA = not applicable
Source: Clewell et al. 2007

100 PERCHLORATES
3. HEALTH EFFECTS
Table 3-6. Perchlorate Chemical-specific Parameters for Rat Gestation and Lactation Models
Gestation Lactation Parameters Dam Fetus Dam Pup Partition coefficients (unitless)
Slowly perfused/plasma PS 0.31 0.31 0.31 0.31 Rapidly perfused/plasma PR 0.56 0.56 0.5 0.5 Fat/plasma PF 0.05 NA 0.05 0.05 Kidney/plasma PK 0.99 0.99 0.99 0.99 Liver/plasma PL 0.56 0.56 0.56 0.56 Gastric tissue/gastric blood PGI 0.50 1.80 1.8 3.21 Gastric juice/gastric tissue PGIJ 1.30 2.30 2.3 5.64 Skin tissue/skin blood PSk 1.15 1.15 1.15 1.15 Thyroid tissue/thyroid blood PTF 0.15 0.15a 0.13 0.13 Thyroid lumen/thyroid tissue PTL 7.0 7.0 7.0 7.0 Red blood cells/plasma PRBC 0.73 0.73 0.73 0.73 Placenta/plasma PPl 0.56 NA NA NA Mammary/plasma PM 0.66 NA NA NA Mammary tissue/mammary blood PM NA NA 0.66 NA Mammary/plasma PMk NA NA 2.39 NA
Max capacity, Vmaxc (ng/hour/kg) Thyroid follicle VmaxcTF 2.6x10³ 0–2.25x10³ 1.5x10³ 1.5x10³
Thyroid colloid VmaxcTL 1.0x10⁴ 1.0x10⁴b 1.0x10⁴ 1.0x10⁴
Skin VmaxcSk 6.0x10⁵ 4.0x10⁵ 8.0x10⁵ 8.0x10⁵
Gut VmaxcGI 8.0x10⁵ 1.0x10⁵ 1.0x10⁶ 1.0x10⁶
Placenta VmaxcP 6.0x10⁴ NA NA NA Mammary VmaxcM 2.2x10⁴ NA 2.0x10⁴ NA Milk VmaxcMk NA NA 2.0x10⁴ NA
Affinity constants, Km (ng/L) Thyroid follicle KmTF 1.0x10⁵ 1.0x10⁵ 1.5x10⁵ 1.5x10⁵
Thyroid colloid KmTL 1.0x10⁸ 1.0x10⁸ 1.0x10⁸ 1.0x10⁸
Skin KmSk 1.0x10⁵ 1.0x10⁵ 1.5x10⁵ 1.5x10⁵
Gut KmGI 1.0x10⁵ 1.0x10⁵ 1.5x10⁵ NA Placenta KmP 1.0x10⁵ NA NA NA Mammary KmM 1.0x10⁵ NA 1.5x10⁵ NA Milk KmMk NA NA 1.0x10⁶ NA
Permeability area cross-products (L/hour/kg) Gastric blood to gastric tissue PAGIc 1.00 1.00 1.00 1.00 Gastric tissue to gastric juice PAGIJc 1.00 1.00 1.00 1.00 Thyroid stroma to follicle PATFc 6.0x10⁻⁵ 6.0x10⁻⁵ 4.0x10⁻⁵ 4.0x10⁻⁵
Thyroid follicle to colloid (lumen) PATLc 0.01 0.01b 0.01 0.01 Skin blood to skin tissue PASkc 1.00 1.00 0.50 1.00
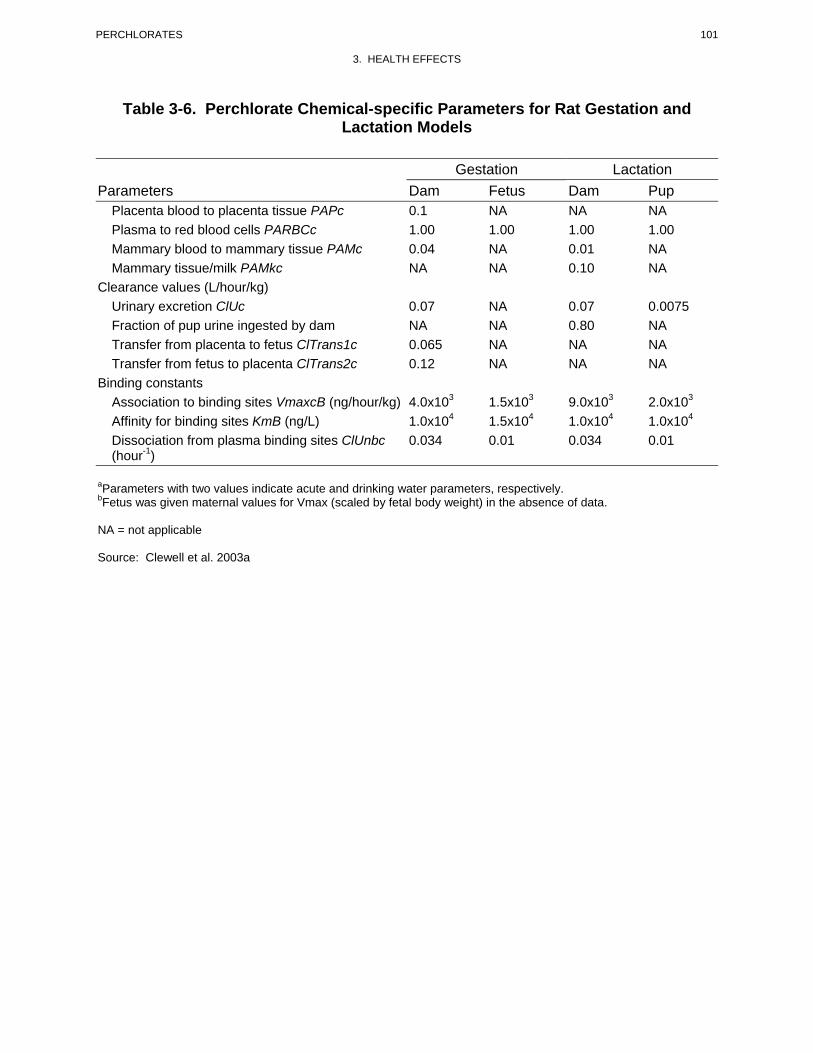
101 PERCHLORATES
3. HEALTH EFFECTS
Table 3-6. Perchlorate Chemical-specific Parameters for Rat Gestation and Lactation Models
Gestation Lactation Parameters Dam Fetus Dam Pup
Placenta blood to placenta tissue PAPc 0.1 NA NA NA
Plasma to red blood cells PARBCc 1.00 1.00 1.00 1.00
Mammary blood to mammary tissue PAMc 0.04 NA 0.01 NA
Mammary tissue/milk PAMkc NA NA 0.10 NA
Clearance values (L/hour/kg) Urinary excretion ClUc 0.07 NA 0.07 0.0075 Fraction of pup urine ingested by dam NA NA 0.80 NA Transfer from placenta to fetus ClTrans1c 0.065 NA NA NA Transfer from fetus to placenta ClTrans2c 0.12 NA NA NA
Binding constants Association to binding sites VmaxcB (ng/hour/kg) 4.0x10³ 1.5x10³ 9.0x10³ 2.0x10³
Affinity for binding sites KmB (ng/L) 1.0x10⁴ 1.5x10⁴ 1.0x10⁴ 1.0x10⁴
Dissociation from plasma binding sites ClUnbc 0.034 0.01 0.034 0.01 (hour-1)
aParameters with two values indicate acute and drinking water parameters, respectively. bFetus was given maternal values for Vmax (scaled by fetal body weight) in the absence of data.
NA = not applicable
Source: Clewell et al. 2003a
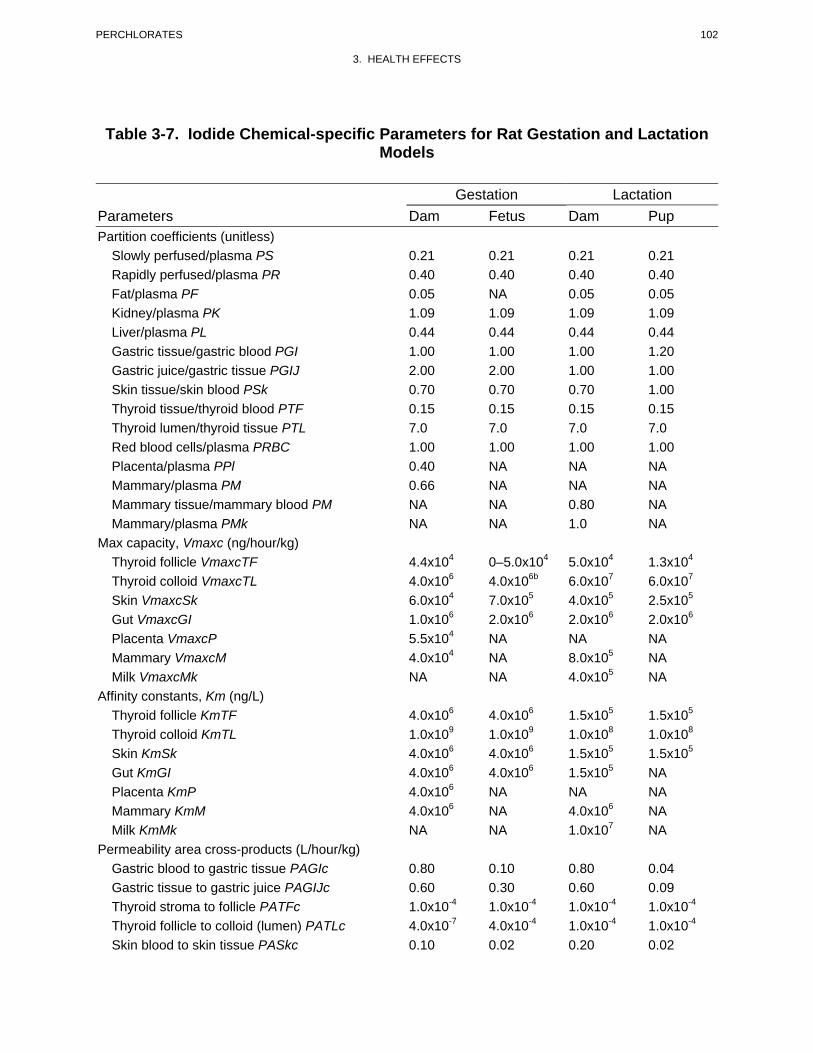
102 PERCHLORATES
3. HEALTH EFFECTS
Table 3-7. Iodide Chemical-specific Parameters for Rat Gestation and Lactation Models
Gestation Lactation Parameters Dam Fetus Dam Pup Partition coefficients (unitless)
Slowly perfused/plasma PS 0.21 0.21 0.21 0.21 Rapidly perfused/plasma PR 0.40 0.40 0.40 0.40 Fat/plasma PF 0.05 NA 0.05 0.05 Kidney/plasma PK 1.09 1.09 1.09 1.09 Liver/plasma PL 0.44 0.44 0.44 0.44 Gastric tissue/gastric blood PGI 1.00 1.00 1.00 1.20 Gastric juice/gastric tissue PGIJ 2.00 2.00 1.00 1.00 Skin tissue/skin blood PSk 0.70 0.70 0.70 1.00 Thyroid tissue/thyroid blood PTF 0.15 0.15 0.15 0.15 Thyroid lumen/thyroid tissue PTL 7.0 7.0 7.0 7.0 Red blood cells/plasma PRBC 1.00 1.00 1.00 1.00 Placenta/plasma PPl 0.40 NA NA NA Mammary/plasma PM 0.66 NA NA NA Mammary tissue/mammary blood PM NA NA 0.80 NA Mammary/plasma PMk NA NA 1.0 NA
Max capacity, Vmaxc (ng/hour/kg) Thyroid follicle VmaxcTF 4.4x10⁴ 0–5.0x10⁴ 5.0x10⁴ 1.3x10⁴
Thyroid colloid VmaxcTL 4.0x10⁶ 4.0x10⁶b 6.0x10⁷ 6.0x10⁷
Skin VmaxcSk 6.0x10⁴ 7.0x10⁵ 4.0x10⁵ 2.5x10⁵
Gut VmaxcGI 1.0x10⁶ 2.0x10⁶ 2.0x10⁶ 2.0x10⁶
Placenta VmaxcP 5.5x10⁴ NA NA NA Mammary VmaxcM 4.0x10⁴ NA 8.0x10⁵ NA Milk VmaxcMk NA NA 4.0x10⁵ NA
Affinity constants, Km (ng/L) Thyroid follicle KmTF 4.0x10⁶ 4.0x10⁶ 1.5x10⁵ 1.5x10⁵
Thyroid colloid KmTL 1.0x10⁹ 1.0x10⁹ 1.0x10⁸ 1.0x10⁸
Skin KmSk 4.0x10⁶ 4.0x10⁶ 1.5x10⁵ 1.5x10⁵
Gut KmGI 4.0x10⁶ 4.0x10⁶ 1.5x10⁵ NA Placenta KmP 4.0x10⁶ NA NA NA Mammary KmM 4.0x10⁶ NA 4.0x10⁶ NA Milk KmMk NA NA 1.0x10⁷ NA
Permeability area cross-products (L/hour/kg) Gastric blood to gastric tissue PAGIc 0.80 0.10 0.80 0.04 Gastric tissue to gastric juice PAGIJc 0.60 0.30 0.60 0.09 Thyroid stroma to follicle PATFc 1.0x10⁻⁴ 1.0x10⁻⁴ 1.0x10⁻⁴ 1.0x10⁻⁴
Thyroid follicle to colloid (lumen) PATLc 4.0x10⁻⁷ 4.0x10⁻⁴ 1.0x10⁻⁴ 1.0x10⁻⁴
Skin blood to skin tissue PASkc 0.10 0.02 0.20 0.02
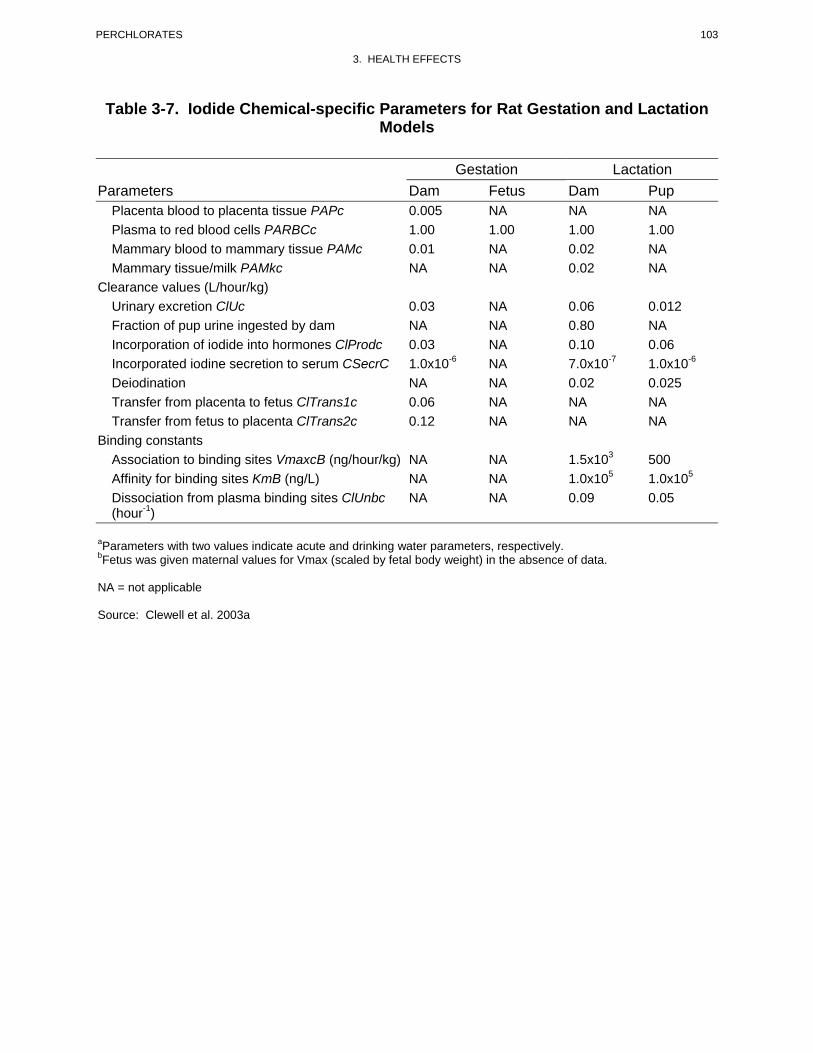
103 PERCHLORATES
3. HEALTH EFFECTS
Table 3-7. Iodide Chemical-specific Parameters for Rat Gestation and Lactation Models
Gestation Lactation Parameters Dam Fetus Dam Pup
Placenta blood to placenta tissue PAPc 0.005 NA NA NA Plasma to red blood cells PARBCc 1.00 1.00 1.00 1.00 Mammary blood to mammary tissue PAMc 0.01 NA 0.02 NA Mammary tissue/milk PAMkc NA NA 0.02 NA
Clearance values (L/hour/kg) Urinary excretion ClUc 0.03 NA 0.06 0.012 Fraction of pup urine ingested by dam NA NA 0.80 NA Incorporation of iodide into hormones ClProdc 0.03 NA 0.10 0.06 Incorporated iodine secretion to serum CSecrC 1.0x10⁻⁶ NA 7.0x10⁻⁷ 1.0x10⁻⁶
Deiodination NA NA 0.02 0.025 Transfer from placenta to fetus ClTrans1c 0.06 NA NA NA Transfer from fetus to placenta ClTrans2c 0.12 NA NA NA
Binding constants Association to binding sites VmaxcB (ng/hour/kg) NA NA 1.5x10³ 500 Affinity for binding sites KmB (ng/L) NA NA 1.0x10⁵ 1.0x10⁵
Dissociation from plasma binding sites ClUnbc (hour-1)
NA NA 0.09 0.05
aParameters with two values indicate acute and drinking water parameters, respectively. bFetus was given maternal values for Vmax (scaled by fetal body weight) in the absence of data.
NA = not applicable
Source: Clewell et al. 2003a
104 PERCHLORATES
3. HEALTH EFFECTS
other changes in radioiodide metabolism in the thyroid (e.g., hormone production and secretion) that are
not simulated by the model.
The adult human model (nonpregnant, non-lactating) also predicted reasonably well (i.e., within 1–
2 standard deviations of observations) perchlorate concentrations in plasma and urine in subjects who
received oral doses of perchlorate (Durand 1938; Eichler 1929; Greer et al. 2002; Kamm and Drescher
1973; Merrill et al. 2005). Model predictions of radioiodide in gastric juice, serum, thyroid, and urine
following an intravenous dose of radioiodide also corresponded with observations made in healthy adults
(Hays and Solomon 1965). Model predictions of thyroid radioiodine uptake in subjects who received oral
doses of perchlorate agreed with observations when the kinetic parameters for iodide in the thyroid (i.e.,
maximum transport into the thyroid follicle) were adjusted to achieve good correspondence to the
observations (Greer et al. 2002; Merrill et al. 2005). When the model was calibrated by adjusting the
maximum transport rate for iodide into the thyroid follicle, it accurately predicted the observed time
course for radioiodine uptake in a Graves’ disease patient who received a single tracer dose of radioiodine
(Stanbury and Wyngaarden 1952); however, the model substantially overpredicted iodide uptake after the
same patient received a dose of perchlorate. The error in predictions of the effect of perchlorate on iodide
uptake may reflect humoral regulation of iodide transport and organification mechanisms or a response to
perchlorate in Graves’ disease patients that is not simulated in the model.
The rat maternal/fetal model was evaluated by comparing predictions of perchlorate concentrations in
maternal and fetal serum and maternal thyroid in rats exposed to perchlorate in drinking water (Clewell et
al. 2001, 2003a). Model predictions agreed well (within 1–2 standard deviations of observations) with
observations. Predictions of maternal and fetal radioiodine uptakes in thyroid were also in reasonable
agreement with observations in rats that received single injections of iodine with or without single
injections or oral gavage doses of perchlorate, or at the conclusion of 18 days of exposures to perchlorate
in drinking water (Brown-Grant 1966; Clewell et al. 2001, 2003a; Sztanyik and Turai 1988).
Similar outcomes occurred in evaluations of the lactating dam/neonate model (Clewell et al. 2003b). The
model accurately predicted serum and thyroid iodide concentrations in the dam and neonate following
single intravenous injections of radioactive iodine, with or without concurrent injection of perchlorate,
and in maternal thyroid following an 18-day exposure to perchlorate in drinking water (Clewell et al.
2003b). Model predictions of radioiodide levels in mammary gland and milk, in rats that did or did not
receive single doses of perchlorate, corresponded with observations (Clewell et al. 2003b).
105 PERCHLORATES
3. HEALTH EFFECTS
The human pregnancy and lactation models were evaluated by comparing model predictions of
perchlorate concentrations in serum with observations made in pregnant women (15 and 33 weeks of
gestation) and their infants at birth (from cord blood), and in a group of children (mean age 7.4 years)
(Téllez et al. 2005). Exposures simulated in the model were the continuous perchlorate intake
corresponding to the mean ±1 standard deviation drinking water exposure concentrations (114±13 ppm)
for a cohort in the Téllez et al. (2005) study. Model predictions for maternal, fetal, and child serum
perchlorate concentrations agreed well (within ±1 standard deviation of observed means) with
observations. Téllez et al. (2005) also reported perchlorate concentrations in breast milk measured at 5–
6 weeks postpartum. Simulation of the continuous perchlorate intake corresponding to the group means
(± standard deviation) of drinking water exposure concentrations (5.8±0.6 ppm or 114±13 ppm) yielded
predictions of breast milk perchlorate concentrations that were within ±1 standard deviation of the
observed means.
Risk assessment. The rat (Clewell et al. 2003a, 2003b; Merrill et al. 2003) and human models
(Clewell et al. 2007; Merrill et al. 2005) can be used to estimate the human equivalent exposure level for
perchlorate that would give rise to a given percent inhibition of thyroidal radioiodide uptake. The models
do not include downstream effects on the thyroid axis, such as decreases in serum thyroid hormones. The
Clewell et al. and Merrill et al. model estimates have been used to extrapolate dose-response relationships
for perchlorate observed in rats to humans, and across various human lifestages (e.g., fetus, neonate,
child, adult, pregnancy, lactation). External dose–internal dose relationships for various human life-
stages predicted from the human models are presented in Tables 3-8 and 3-9 (Clewell et al. 2007). The
models predict a relatively high vulnerability of the fetus, pregnant woman, and lactating woman to
perchlorate-induced thyroid iodine uptake, compared to other lifestages (i.e., greater inhibition of thyroid
iodide uptake occurs in these lifestages in association with lower external doses), compared to neonates,
child or nonpregnant or nonlactating adult). The potential impact of external exposures to perchlorate on
inhibition on thyroidal radioiodide uptake is sensitive to assumptions about urinary clearance of
perchlorate, especially in neonates and young infants. The estimates based on external exposures from
consumption of drinking water are also dependent on assumptions regarding age-related changes in
contribution of drinking water to liquid consumption across lifestages (e.g., milk in children).
Target tissues. Tissues simulated in the perchlorate models are shown in Figures 3-4 and 3-5. The
models were designed to calculate perchlorate concentrations in serum and thyroid and inhibition of
radioiodide uptake into the thyroid resulting from exposures to perchlorate for various lifestages (e.g.,
fetus, neonate, child, adult, pregnancy, lactation).

106 PERCHLORATES
3. HEALTH EFFECTS
Table 3-8. Model-predicted Serum ClO4- Area Under the Curve (AUC) Across
Lifestages
External Pregnanta Lactatingc
dose Fetusa Neonateb Child Adult woman woman (mg/kg/day) (mg/L) (mg/L) (mg/L) (mg/L) (mg/L) (mg/L) 0.001 0.010 0.008 0.001 0.002 0.005 0.008 0.01 0.06 0.05 0.01 0.01 0.04 0.05 0.1 0.2 0.2 0.1 0.1 0.3 0.3 1.0 1.2 0.5 0.8 1.0 2.5 2.5
aFetus and pregnant woman shown in gestation week 38. bNeonate shown at postnatal month 1.5. cLactating woman shown at postnatal day 7.
Source: Clewell et al. 2007
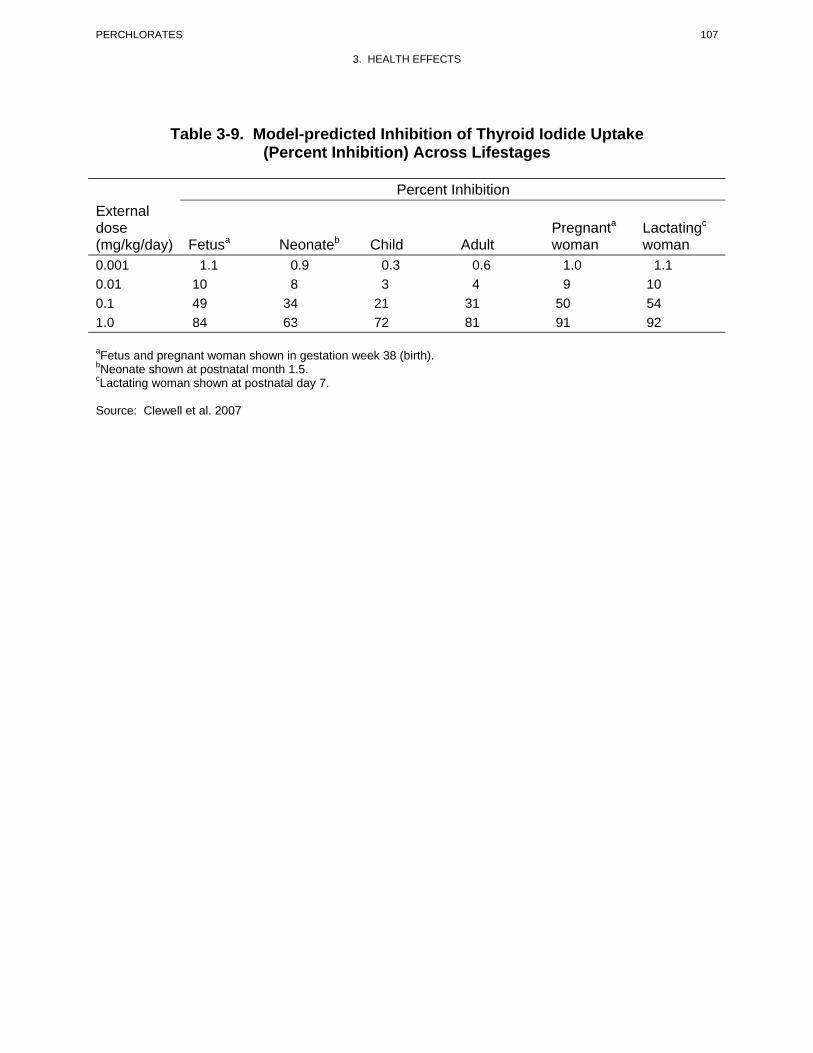
107 PERCHLORATES
3. HEALTH EFFECTS
Table 3-9. Model-predicted Inhibition of Thyroid Iodide Uptake (Percent Inhibition) Across Lifestages
Percent Inhibition External dose (mg/kg/day) Fetusa Neonateb Child Adult
Pregnanta
woman Lactatingc
woman 0.001 1.1 0.9 0.3 0.6 1.0 1.1 0.01 10 8 3 4 9 10 0.1 49 34 21 31 50 54 1.0 84 63 72 81 91 92
aFetus and pregnant woman shown in gestation week 38 (birth). bNeonate shown at postnatal month 1.5. cLactating woman shown at postnatal day 7.
Source: Clewell et al. 2007
108 PERCHLORATES
3. HEALTH EFFECTS
Species extrapolation. The models are designed for applications to rat or human dosimetry and
cannot be applied to other species without modification and validation.
Interroute extrapolation. The models are designed to simulate intravenous or oral exposures to
perchlorate and cannot be applied to other routes of exposure without modification and validation.
3.5 MECHANISMS OF ACTION 3.5.1 Pharmacokinetic Mechanisms
Perchlorate is readily soluble in water and is quickly absorbed through the digestive tract. The
mechanism by which perchlorate is transferred from the digestive system to the blood has not been
investigated. Since Durand (1938) detected perchlorate in the urine of subjects 10 minutes after oral
administration, it seems likely that absorption of perchlorate may begin in the stomach and continue in the
small intestine. Anbar et al. (1959) determined that perchlorate eliminated in the urine 3 hours after an
oral dose had not been metabolized (see Section 3.4.1). Whether microflora of the gut or intestinal
enzymes modify perchlorate that is finally eliminated in the feces has not been investigated.
Whatever the mechanism of absorption, perchlorate is distributed throughout the body via the circulation
(see Section 3.4.2). It apparently is not metabolized (Anbar et al. 1959) and it binds only weakly to
cations. Concentrations of perchlorate rise above serum levels only for those tissues that are equipped
with the anion transporter mechanism that normally takes up iodide. The effects of perchlorate on the
thyroid gland are known from studies on humans and animals (see Section 3.2); perchlorate levels in the
thyroid reach a maximum several hours after administration. Chow and co-workers (Chow and
Woodbury 1970; Chow et al. 1969) determined that perchlorate is taken up from interstitial fluid by
active transport at the base of thyroid follicular cells, which then actively transport it out into the follicular
lumen. The effects of perchlorate on the transfer of maternal iodide in milk have been studied in rats and
cattle (Clewell et al. 2003b; Dobian et al. 2007; Howard et al. 1996; Kirk et al. 2005). The accumulation
of perchlorate in ducts of the salivary gland has been described in mice (Lazarus et al. 1974). Studies on
rodents have demonstrated that perchlorate can cross the placental barrier and affect the thyroid gland of
the fetus (see Section 3.2).
Perchlorate transport in the thyroid gland and in other tissues that express NIS (e.g., mammary
epithelium) appears to be mediated by NIS. Perchlorate is accumulated in thyroid follicle cells and lumen

109 PERCHLORATES
3. HEALTH EFFECTS
against an electrochemical gradient, indicating an active transport mechanism, and possibly different
mechanisms at the basolateral and luminal membranes (Chow and Woodbury 1970; Chow et al. 1969;
Clewell et al. 2004; Goldman and Stanbury 1973). Thyroid uptake of perchlorate in hypophysectomized
rats is stimulated by administration of TSH (Chow et al. 1969). Perchlorate competitively inhibits iodide
transport in thyroid slices, cultured thyrocytes, cultured cells transformed to express thyroid NIS, and
thyrocyte membrane vesicles (Dohán et al. 2007; Eskandari et al. 1997; O'Neill et al. 1987; Tran et al.
2008; Wolff and Maurey 1962, 1963; Yoshida et al. 1997). The above observations suggest that
perchlorate transport into thyroid follicle cells, and possibly into other tissues where NIS is expressed, is
mediated by NIS (Wolff 1998). Perchlorate uptake into thyroid cells is stimulated by TSH (Tran et. al.
2008). Unlike the NIS-mediated transport of iodide, transport of perchlorate by NIS appears to be
electroneutral (Dohán et al. 2007; Eskandari et al. 1997; Yoshida et al. 1997). Chinese hamster ovary
(CHO) cells transfected with the rat thyroid NIS gene and Xenopus oocytes transfected with rat thyroid
NIS mRNA express active NIS that exhibits a Na(2):I(1) stoichiometry, is electrogenic (inward directed
current), occurs against an electrochemical gradient for iodide in the presence of an inward
electrochemical gradient for sodium, and is inhibited by perchlorate (Eskandari et al. 1997; Yoshida et al.
1997). Both systems, when clamped at an interior negative potential (40–50 mV), exhibit sodium-
dependent inward currents in the presence of I- and SCN-; the transfected oocyte exhibits sodium-
dependent inward currents in the presence of a variety of anions, including I-, ClO3-, SCN-, SeCN-, NO3
-,
Br-, BF4-, IO4
-, BrO3-, SO4
-2, F-, and HPO4-2. However, these systems do not show perchlorate-stimulated
currents in the presence or absence of a favorable inward-directed Na gradient. FRTL5 cells and other
cell types that have been transfected to express NIS transport the structural tetrahedral oxyanion analogs
of perchlorate, perrhenate (ReO4-), and pertechnetate (TcO4
-), providing further support for NIS-mediated
perchlorate transport. Furthermore, in MDCK cells transfected to express NIS-mediated electrogenic
transport of iodide, transport of perchlorate, perrhenate (ReO4-), and pertechnetate (ReO4
-) was also
electroneutral (Dohán et al. 2007).
Studies of the kinetics of excretion and elimination of perchlorate from serum in humans indicate that
absorbed perchlorate is excreted in urine with an elimination half-time of 8–14 hours (Durand 1938;
Greer et al. 2002; Lawrence et al. 2000). Thus, in humans, perchlorate would not be expected to
accumulate in the body with prolonged exposure. Based on an elimination half-time of approximately 8–
12 hours, a steady state would be achieved within 3–4 days of continuous exposure. Rapid elimination of
perchlorate (half-time of 20 hours) has also been observed in rats (Eichler and Hackenthal 1962; Fisher et
al. 2000; Goldman and Stanbury 1973; Yu et al. 2002). The mechanisms of renal excretion of perchlorate
are not understood.
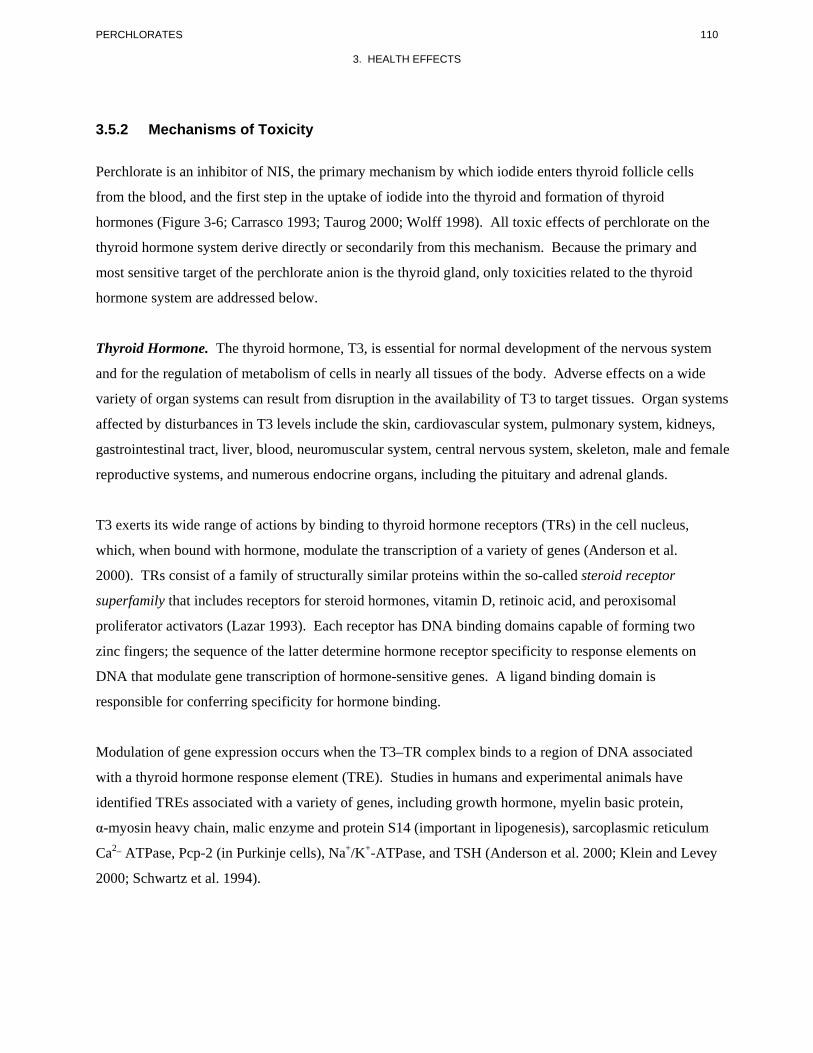
110 PERCHLORATES
3. HEALTH EFFECTS
3.5.2 Mechanisms of Toxicity
Perchlorate is an inhibitor of NIS, the primary mechanism by which iodide enters thyroid follicle cells
from the blood, and the first step in the uptake of iodide into the thyroid and formation of thyroid
hormones (Figure 3-6; Carrasco 1993; Taurog 2000; Wolff 1998). All toxic effects of perchlorate on the
thyroid hormone system derive directly or secondarily from this mechanism. Because the primary and
most sensitive target of the perchlorate anion is the thyroid gland, only toxicities related to the thyroid
hormone system are addressed below.
Thyroid Hormone. The thyroid hormone, T3, is essential for normal development of the nervous system
and for the regulation of metabolism of cells in nearly all tissues of the body. Adverse effects on a wide
variety of organ systems can result from disruption in the availability of T3 to target tissues. Organ systems
affected by disturbances in T3 levels include the skin, cardiovascular system, pulmonary system, kidneys,
gastrointestinal tract, liver, blood, neuromuscular system, central nervous system, skeleton, male and female
reproductive systems, and numerous endocrine organs, including the pituitary and adrenal glands.
T3 exerts its wide range of actions by binding to thyroid hormone receptors (TRs) in the cell nucleus,
which, when bound with hormone, modulate the transcription of a variety of genes (Anderson et al.
2000). TRs consist of a family of structurally similar proteins within the so-called steroid receptor
superfamily that includes receptors for steroid hormones, vitamin D, retinoic acid, and peroxisomal
proliferator activators (Lazar 1993). Each receptor has DNA binding domains capable of forming two
zinc fingers; the sequence of the latter determine hormone receptor specificity to response elements on
DNA that modulate gene transcription of hormone-sensitive genes. A ligand binding domain is
responsible for conferring specificity for hormone binding.
Modulation of gene expression occurs when the T3–TR complex binds to a region of DNA associated
with a thyroid hormone response element (TRE). Studies in humans and experimental animals have
identified TREs associated with a variety of genes, including growth hormone, myelin basic protein,
α-myosin heavy chain, malic enzyme and protein S14 (important in lipogenesis), sarcoplasmic reticulum
Ca2_ ATPase, Pcp-2 (in Purkinje cells), Na+/K+-ATPase, and TSH (Anderson et al. 2000; Klein and Levey
2000; Schwartz et al. 1994).
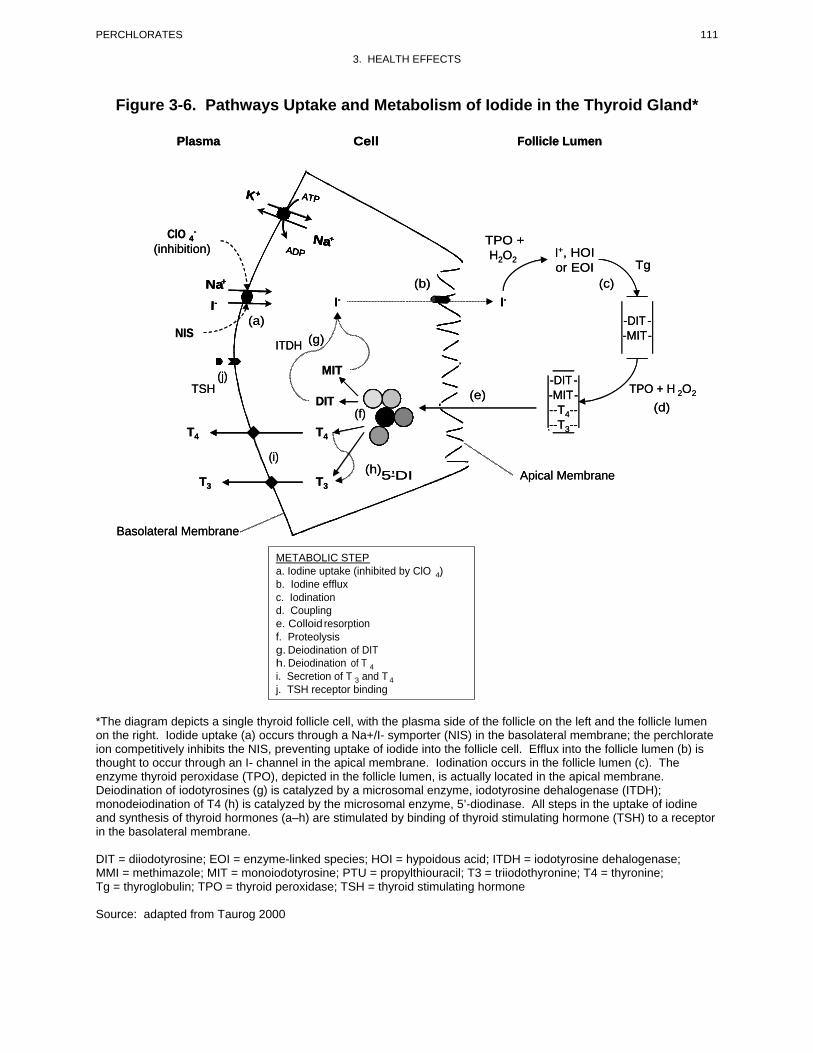
111
III---NNNaaa+ ++
AAAATTTTP PPP
AAAADDDDP PPPNNNNaaaa+ +++
KKKK+ +++
PERCHLORATES
3. HEALTH EFFECTS
Figure 3-6. Pathways Uptake and Metabolism of Iodide in the Thyroid Gland*
PlasmaPlasma CellCell Follicle LumenFollicle Lumen
--ClO 4ClO 4 TPO +TPO + H2O2
I+, HOIH2O2I+, HOIor EOIor EOI TgTg
(b)(b) (c)(c)
(inhibition)(inhibition)
I-I- I-I-
(a)(a) -DIT- DIT -NISNIS (g)(g) -MIT- MIT-
ITDHITDH
(j)(j) MITMIT-DIT- DIT-
TSHTSH TPO + H 2O2TPO + H 2O2DIT (e)DIT (e) -MIT- MIT-
--T4-- (d)--T4-- (d)(f)(f)--T3---T3--
Apical MembraneApical Membrane
T4T4 T4T4
(i)(i)(h)5’-DI(h)5’-DIT3T3 T3T3
Basolateral MembraneBasolateral Membrane
METABOLIC STEP a. Iodine uptake (inhibited by ClO 4) b. Iodine efflux c. Iodination d. Coupling e. Colloid resorption f. Proteolysis g. Deiodination of DIT h. Deiodination of T 4 i. Secretion of T 3 and T 4 j. TSH receptor binding
*The diagram depicts a single thyroid follicle cell, with the plasma side of the follicle on the left and the follicle lumen on the right. Iodide uptake (a) occurs through a Na+/I- symporter (NIS) in the basolateral membrane; the perchlorate ion competitively inhibits the NIS, preventing uptake of iodide into the follicle cell. Efflux into the follicle lumen (b) is thought to occur through an I- channel in the apical membrane. Iodination occurs in the follicle lumen (c). The enzyme thyroid peroxidase (TPO), depicted in the follicle lumen, is actually located in the apical membrane. Deiodination of iodotyrosines (g) is catalyzed by a microsomal enzyme, iodotyrosine dehalogenase (ITDH); monodeiodination of T4 (h) is catalyzed by the microsomal enzyme, 5’-diodinase. All steps in the uptake of iodine and synthesis of thyroid hormones (a–h) are stimulated by binding of thyroid stimulating hormone (TSH) to a receptor in the basolateral membrane. DIT = diiodotyrosine; EOI = enzyme-linked species; HOI = hypoidous acid; ITDH = iodotyrosine dehalogenase; MMI = methimazole; MIT = monoiodotyrosine; PTU = propylthiouracil; T3 = triiodothyronine; T4 = thyronine; Tg = thyroglobulin; TPO = thyroid peroxidase; TSH = thyroid stimulating hormone Source: adapted from Taurog 2000
112 PERCHLORATES
3. HEALTH EFFECTS
Adverse effects on cell metabolism and growth can result from either understimulation or overstimulation
of target tissues by T3. The amount of T3 available to target tissues is highly controlled by feedback
regulation of the production, secretion, and elimination of both T3 and its metabolic precursor,
T4 (Figure 3-7). Major components of this mechanism include negative feedback control mediated by
T4 and T3 of the synthesis and release of thyrotropin-releasing hormone (TRH) in the hypothalamus and
of TSH in the pituitary. TRH stimulates the synthesis and secretion of TSH in the pituitary and modulates
the biologic potency of TSH. The latter is thought to result from effects of TRH on posttranslational
glycosylation of TSH (Cohen et al. 2000; Scanlon and Toft 2000). TSH promotes growth of the thyroid
gland follicle cells and stimulates thyroid iodide uptake and synthesis and secretion of T4 and
T3 (Spaulding 2000).
The metabolism of T4 and T3 is also regulated by feedback control mechanisms (Darras et al. 1999).
T3 is synthesized from the deiodination of T4 in a reaction catalyzed by selenium requiring, microsomal
enzymes known as iodothyronine deiodinases. Although some production of T3 occurs in the thyroid,
most of the T3 that is available to extrathyroidal target tissues derives from deiodination of T4 that occurs
outside of the thyroid (Figure 3-7). The liver and kidney are thought to be major sites of production of
T3 in the circulation; however, local tissue production of T3 from T4 is thought to be the predominant
source of T3 in the brain and pituitary. Iodothyronine deoidinases also catalyze the inactivation of T4 and
T3. The activities of deiodinases are under feedback control, mediated by T3, T4, and reverseT3 (rT3) an
inactive deiodination product of T4 (Darras et al. 1999).
Mechanism of Uptake of Iodide into the Thyroid. Synthesis of T4 and T3 in the thyroid is dependent on
delivery of iodide into the thyroid follicle where the iodination of thyroglobulin occurs in the first steps of
hormone synthesis (Figure 3-6). Uptake of iodide into the thyroid is facilitated by a membrane carrier in
the basolateral membrane of the thyroid follicle cell (Carrasco 1993; Levy et al. 1998a; Shen et al. 2001).
The carrier, or NIS, catalyzes the simultaneous transfer of Na+ and I- across the basolateral membrane
(Chambard et al. 1983; Iff and Wilbrandt 1963; Nilsson et al. 1990). The NIS enables the follicle cell to
achieve intracellular/extracellular concentration ratios of 10–50 for iodide (Andros and Wollman 1991;
Bagchi and Fawcett 1973; Shimura et al. 1997; Vroye et al. 1998; Weiss et al. 1984b; Wolff 1964).
The NIS has been studied extensively in several in vitro preparations, including isolated plasma
membrane vesicles of mammalian thyroid (O’Neill et al. 1987), FRTL-5 cells, a cell line derived from
normal rat thyroid (Weiss et al. 1984b), Xenopus lavis oocytes transformed by intracellular injection of
FRTL-5 RNA to express NIS (Eskandari et al. 1997), and other mammalian cells cultures transformed to
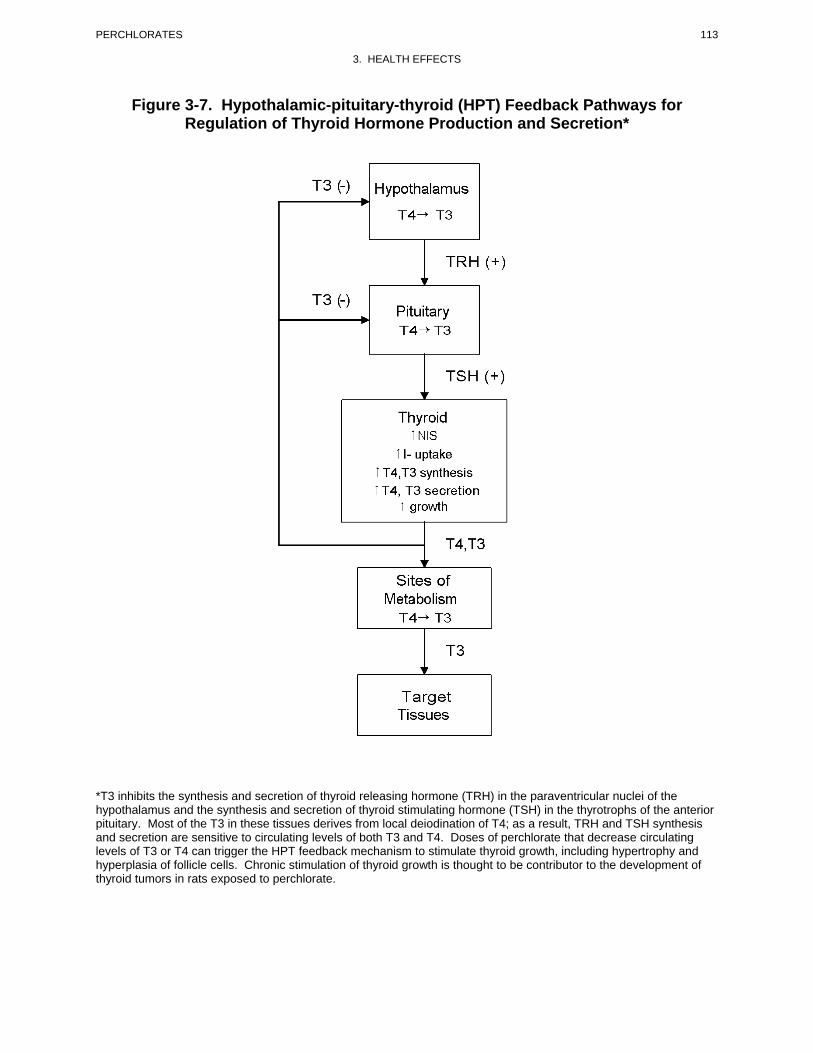
113 PERCHLORATES
3. HEALTH EFFECTS
Figure 3-7. Hypothalamic-pituitary-thyroid (HPT) Feedback Pathways for Regulation of Thyroid Hormone Production and Secretion*
*T3 inhibits the synthesis and secretion of thyroid releasing hormone (TRH) in the paraventricular nuclei of the hypothalamus and the synthesis and secretion of thyroid stimulating hormone (TSH) in the thyrotrophs of the anterior pituitary. Most of the T3 in these tissues derives from local deiodination of T4; as a result, TRH and TSH synthesis and secretion are sensitive to circulating levels of both T3 and T4. Doses of perchlorate that decrease circulating levels of T3 or T4 can trigger the HPT feedback mechanism to stimulate thyroid growth, including hypertrophy and hyperplasia of follicle cells. Chronic stimulation of thyroid growth is thought to be contributor to the development of thyroid tumors in rats exposed to perchlorate.
114 PERCHLORATES
3. HEALTH EFFECTS
express NIS (Levy et al. 1997; Nakamura et al. 1990; Smanik et al. 1996; Yoshida et al. 1997). Iodide
transport by the NIS is inhibited by other anions, most notably, thiocyanate (SCN-) and perchlorate
(ClO4-) (Carrasco 1993; Wolff 1964). Thiocyanate is one of several anions other than I- that can be
transported by the NIS, including SeCN-, NO3-, ClO3
-, Br-, BF4-, IO4
-, BrO3-, ReO4
-, and TcO4- (Eskandari
et al. 1997; Van Sande et al. 2003). Direct evidence for perchlorate transport by NIS (i.e., measurement
of radioperchlorate flux through the NIS) is lacking; however, transport activity is likely given that the
NIS transports the structural analogs, perrhenate and pertechnetate. Perchlorate transport by NIS may be
electroneutral, preventing its detection from measurements of ion currents or electrochemical gradients
(Dohán et al. 2007; Eskandari et al. 1997; Yoshida et al. 1997).
The NIS is expressed in a variety of other tissues, including breast tissue where it is thought to function in
the transport of iodide into breast milk (Levy et al. 1997; Smanik et al. 1997; Spitzweg et al. 1998). In
the rat, expression of the NIS, or a structurally similar membrane protein, increases during nursing and
decreases after weaning (Levy et al. 1998a). In the mouse, expression of NIS in mammary tissue appears
to be stimulated by prolactin (Perron et al. 2001; Rillema and Rowady 1997; Rillema et al. 2000).
Inhibition of Thyroid NIS and Thyroid Hormone Production by Perchlorate. Perchlorate inhibition of
NIS can limit the availability of iodide needed for the production of T4 and T3 in the thyroid. The degree
of perchlorate-induced iodide uptake inhibition required to impair T4 or T3 synthesis has not been
studied, but the duration of exposure required to produce a reduction in circulating levels of thyroid
hormones appears to vary with species. In this regard, the duration of perchlorate exposure required to
cause a reduction in circulating levels of thyroid hormones appears to be shorter in rats than in humans
(see Section 3.5.3). This difference is thought to derive from the rat thyroid gland having a smaller store
of iodinated thyroglobulin that is more quickly depleted when the availability of iodide is limited, and
from the rat having a shorter T4 half-life (about 1 day) compared to humans (about 7 days). In humans,
THBG functions as an important storage depot for circulating T4 and a buffer for homeostatic regulation
of free T4 levels in serum (Robbins 2000). If the production of T4 and T3 is impaired sufficiently to
deplete the thyroid of stored iodinated thyroglobulin, the thyroid cannot produce or secrete amounts of
T4 and T3 needed to support physiological demands, circulating levels of T4 (fT4) and T3 decrease, and a
state of thyroid hormone insufficiency ensues. A decrease in the levels of circulating thyroid hormones
triggers HPT feedback control mechanisms that serve to adjust thyroidal iodide transport and hormone
production in response to changes in circulating levels of T4, T3, and iodide. Major components of this
mechanism include inhibition of the secretion of TRH from the hypothalamus, TRH-stimulated secretion
of TSH from the pituitary, TSH-stimulated induction of thyroid follicle cell NIS (i.e., upregulation) and
115 PERCHLORATES
3. HEALTH EFFECTS
other thyroid cell proteins, increased capacity for transport of iodide into thyroid follicle cells, and
increased synthesis and secretion of T4 and T3 from the thyroid. This system normally maintains
circulating levels of T4 and T3 within narrow individual limits (Andersen et al. 2002). Doses of
perchlorate that are sufficient to decrease circulating levels of thyroid hormones outside of these
individual limits will result in increased secretion of TSH. Thus, an increase in the circulating levels of
TSH is a sign that perchlorate has perturbed circulating levels of thyroid hormones. In humans, intra-
individual variation in T4 levels is less than inter-individual variation, suggesting that the HPT feedback
mechanism can detect relatively small changes in thyroid hormone levels that are well within the range of
variation expected in populations (Andersen et al. 2002). Triggering of the HPT feedback response in
profound iodide deficiency can affect the response of the thyroid to perchlorate. Rats maintained on an
iodine-deficient diet for sufficient periods to lower serum T4 levels, exhibited higher 24-hour thyroid
radioiodide uptake when exposed to perchlorate in drinking water (1.1–28 mg/L) for 5 weeks than iodine-
replete rats (Paulus et al. 2007). The increased resistance to perchlorate-induced inhibition of thyroid
iodide uptake in iodine deficiency has been attributed, at least in part, to induction of NIS in the thyroid,
which partially overcomes the competitive inhibition of NIS resulting from a given dosage of perchlorate.
Perchlorate-induced Hypothyroidism. Inhibition of thyroid iodide uptake can potentially deplete stores
of T4 and T3 in the thyroid and lower serum T4 and T3 levels. Thus, perchlorate has the potential for
producing hypothyroidism or for aggravating an ongoing hypothyroid condition. The term
hypothyroidism refers to a state of suppressed production and/or secretion of thyroid hormones. The term
clinical hypothyroidism refers to a condition in which the circulating levels of T4 and/or T3 are depressed
below their normal ranges (usually accompanied with elevated serum TSH levels above the normal range)
and in which there are clinical symptoms of thyroid hormone insufficiency (Ladenson 2000). Typical
normal ranges for hormone levels are shown in Table 3-10. Subclinical hypothyroidism refers to an
increase in serum TSH (usually mild) with serum T4 and T3 remaining in their respective normal ranges
for age. An important question is whether small changes in circulating levels of thyroid hormones that
trigger the HPT feedback mechanism, but do not fall outside of the normal population range, are detected
as thyroid hormone insufficiency in tissues other than the hypothalamus or pituitary, including the
embryo or fetal brain.
In humans, relatively large doses of perchlorate (600–900 mg/day, 8–13 mg/kg/day) are required to
deplete thyroidal iodine stores sufficiently to decrease serum levels of T4 (Brabant et al. 1992; Bürgi et al.
1974). A 4-week oral exposure to 900 mg/day (approximately 13 mg/kg/day) did not produce clinical
hypothyroidism in healthy adults (Brabant et al. 1992); however, a dosage considerably lower,
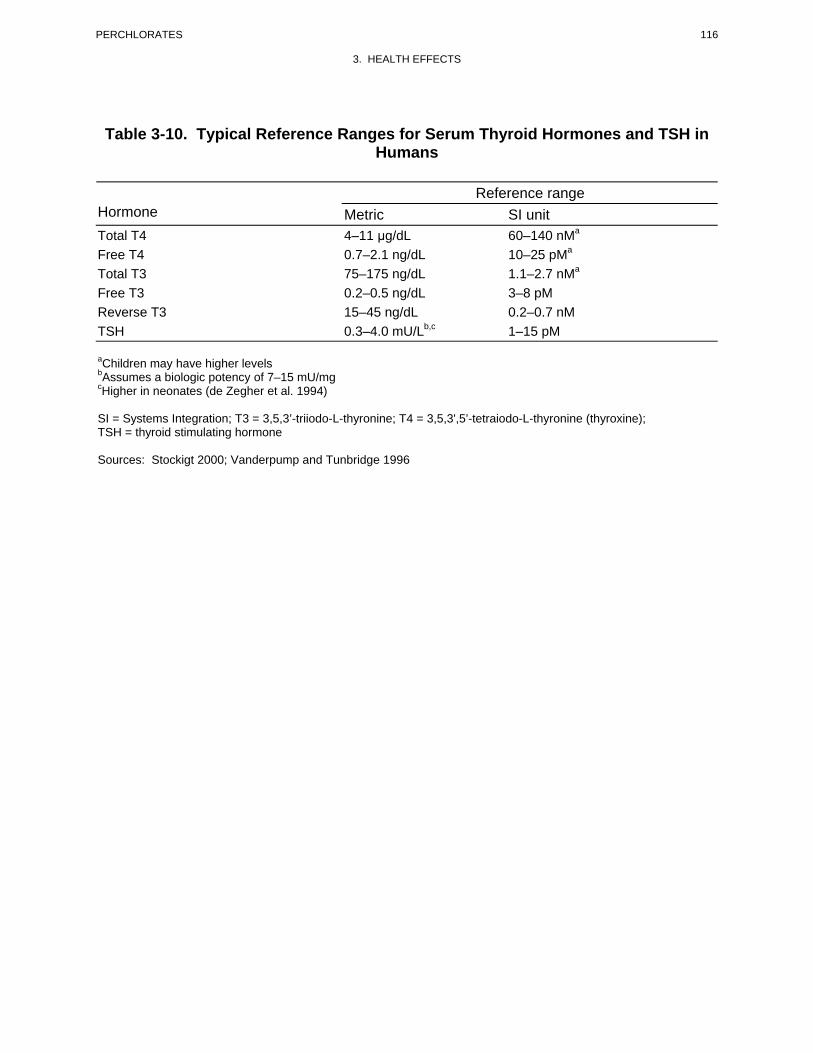
116 PERCHLORATES
3. HEALTH EFFECTS
Table 3-10. Typical Reference Ranges for Serum Thyroid Hormones and TSH in Humans
Hormone Metric Reference range
SI unit Total T4 Free T4 Total T3
4–11 μg/dL 0.7–2.1 ng/dL 75–175 ng/dL
60–140 nMa
10–25 pMa
1.1–2.7 nMa
Free T3 0.2–0.5 ng/dL 3–8 pM Reverse T3 TSH
15–45 ng/dL 0.3–4.0 mU/Lb,c
0.2–0.7 nM 1–15 pM
aChildren may have higher levels bAssumes a biologic potency of 7–15 mU/mg cHigher in neonates (de Zegher et al. 1994)
SI = Systems Integration; T3 = 3,5,3’-triiodo-L-thyronine; T4 = 3,5,3',5’-tetraiodo-L-thyronine (thyroxine); TSH = thyroid stimulating hormone
Sources: Stockigt 2000; Vanderpump and Tunbridge 1996
117 PERCHLORATES
3. HEALTH EFFECTS
0.5 mg/kg/day for 14 days, produced a 70% inhibition of thyroid iodide uptake with no effects on the
levels of circulating T4, T3, or TSH in serum, at least over the 14-day dosing period (Greer et al. 2002).
In these short-term studies, it is possible that thyroid hormone production could have been suppressed by
perchlorate inhibition of thyroid NIS without changing serum thyroid hormone levels. This could occur
because the human adult thyroid contains a surplus of T4 to support normal levels of serum levels for
several months (Greer et al. 2002). The ability of high dosages of perchlorate to lower T4 and T3 levels
in serum is the basis for use of perchlorate in the pharmacological management of thyrotoxicosis, the
clinical manifestation of abnormally elevated circulating levels of T4 and/or T3 (Soldin et al. 2001).
Perchlorate-induced Thyroid Enlargement and Cancer. Although there is no direct evidence of
perchlorate causing cancer in humans, perchlorate has produced thyroid cell hyperplasia and papillary
and/or follicular adenomas and/or carcinomas in rats and mice (see Section 3.2.2.7). Perchlorate itself
does not appear to be genotoxic (see Section 3.3). Production of thyroid tumors in rodents appears to be
related to perchlorate-induced inhibition of thyroid iodide uptake and the resulting triggering of the HPT
feedback control mechanism that elevates serum TSH levels. Persistent stimulation of the thyroid by
TSH results in hypertrophy and hyperplasia of thyroid follicle cells, which are reflected in an increase in
the size and weight of the thyroid (goiter). Tumors appear to be a progression of this hyperplasia. The
mechanism by which gland enlargement leads to thyroid tumors is not completely understood. Thyroid
gland proliferation may increase the fixation of mutations in the thyroid and promote the development of
autonomous nodules, regions of thyroid follicle tissue that are less responsive or unresponsive to serum
TSH concentrations (Corvilain et al. 2000; Fagin 2000). Consistent with the concept that TSH-
stimulation and the resulting thyroid cell hypertrophy and hyperplasia are contributing factors to thyroid
tumorigenesis are the observations that thyroid tumors can be produced in rats by a variety of different
treatments that chronically elevate serum TSH levels, including maintaining the animals on a diet
deficient in iodide, or by exposing the animals to chemical agents (e.g., thiouracil compounds,
sulfonamides) that disrupt thyroid hormone production (Capen 1997).
Developmental Effects of Perchlorate. Thyroid hormones are essential for normal development of the
nervous system, lung, skeletal muscle, and possibly other organ systems (Forhead et al. 2002; Hume et al.
2001; Porterfield and Hendrich 1993). The fetus is dependent on maternal thyroid hormones at least until
the fetal thyroid begins to produce T4 and T3 (Zoeller and Crofton 2000). In humans, this occurs at
approximately 16–20 weeks of gestation. Brain development begins in humans prior to the onset of fetal
thyroid hormone production, with a major growth spurt occurring between 12 and 18 weeks of gestation
with the beginning of neuron multiplication (Pintar 2000). This is followed by glial cell multiplication,
118 PERCHLORATES
3. HEALTH EFFECTS
myelination, and formation of dendritic extensions and synapses, which begin at approximately 18 weeks,
reaching their peak near the end of gestation and continuing through postnatal years 1 and 2 (Boyages
2000; Fisher and Brown 2000; Oppenheimer and Schwartz 1997). Thyroid hormones are present in
human amniotic fluid at 8 weeks of gestation prior to the onset of fetal thyroid hormone production
(Contempre et al. 1993; Thorpe-Beeston et al. 1991). Thyroid hormone receptors are present and
occupied by hormone at this time as well, suggesting that the fetus is capable of responding to maternal
thyroid hormones (Bernal and Pekonen 1984; Ferreiro et al. 1988). Calvo et al. (2002) showed that first
trimester fetal tissues are exposed to concentrations of free T4 (FT4) that depend ultimately on the
circulating maternal levels of T4 or FT4. Thus, a decrease in the maternal supply results in lower
concentrations of FT4 in fetal fluids and, consequently, of T4 available to the developing brain. The
contribution of maternal thyroid hormones to the fetal thyroid hormone status is also evident from infants
who have an inherited disorder that abolishes T4 production but are born, nevertheless, with normal
serum thyroid hormone levels (i.e., euthyroid) and become hypothyroid after birth if not administered
thyroid hormones within 2 weeks after birth (Larsen 1989; Vulsma et al. 1989). This suggests that
transfer during fetal life is at least partially protective in cases where the fetus cannot produce adequate
amounts of T4, providing that the maternal thyroid hormone production is not compromised. However,
athyrotic babies, although born euthyroid, show retarded skeletal maturation at birth, suggesting that fetal
thyroid function during earlier phases of gestation may be necessary for normal skeletal development
(Rovet et al. 1987; Wolter et al. 1979). Uncorrected maternal hypothyroidism, on the other hand, may
result in impaired neurodevelopment of the fetus with severe long-lasting implications. For example, Pop
et al. (1999) studied a cohort of 220 healthy children and found that children of women with FT4 levels
below the 5th and 10th percentiles at 12 weeks of gestation showed impaired psychomotor development at
10 months of age. In women with the lowest 10th percentile FT4 concentrations at 12 weeks of gestation,
maternal FT4 concentration was positively correlated with the children’s psychomotor development.
Haddow et al. (1999) measured TSH levels in serum collected from 25,216 women and found that the 7–
9-year-old children of the 62 women with high TSH levels performed less well in 15 tests relating to
intelligence, attention, language, reading ability, school performance, and visual-motor performance than
children of women with normal TSH values. Their full-scale IQ scores on the Wechsler Intelligence
Scale for Children averaged 4 points lower than those of the children of matched control women.
Studies in rats provide further support for the importance of maternal thyroid hormones in development.
Both T4 and T3 are present in rat fetal tissues prior to the onset of hormone production by the fetal
thyroid on approximately day 17 of gestation, and maternal hormones appear to make a significant
contribution to hormone levels in the fetus in late gestation as well (Calvo et al. 1990; Escobar del Rey et
119 PERCHLORATES
3. HEALTH EFFECTS
al. 1986; Morreale de Escobar et al. 1990; Zoeller and Crofton 2000). Furthermore, thyroid hormone-
responsive genes that are important in early development of the brain are expressed in the rat fetus prior
to fetal thyroid hormone production, and expression of these genes is sensitive to the maternal thyroid
hormone status (Dowling and Zoeller 2000; Dowling et al. 2001). Disruption of the maternal thyroid
hormone system of rats by removal of the maternal thyroid or maternal iodide deficiency results in
decreased levels of thyroid hormones in the fetus, and maternal iodide deficiency will result in fetal
iodide deficiency and congenital hypothyroidism (Escobar del Rey et al. 1986; Morreale de Escobar et al.
1985). These observations suggest an important role of maternal thyroid hormones in development of the
rat fetus and that, by limiting the availability of thyroid hormones to the early fetus, suppression of
maternal thyroid hormone production by perchlorate could translate into disruptions of fetal development.
The availability of maternal T4 to the fetus appears to be particularly important for maintenance of
T3 levels in the fetal rat brain. Treatment of pregnant rats with methimazole, an inhibitor of thyroid
hormone synthesis, resulted in decreased levels of both T4 and T3 in fetal tissues, including fetal brain
(Calvo et al. 1990). Maternal infusions of T4 restored brain T3 levels; however, maternal infusion of
T3 had little restorative effect on brain T3 levels, although it was able to restore T3 levels in other fetal
tissues. Studies in which radiolabelled T4 was administered to neonatal rats made hypothyroid by
maternal or neonatal treatment with methimazole provide direct evidence for the enhanced production of
brain T3 from T4 (Silva and Matthews 1984). These observations are consistent with an important role of
local generation of T3 from T4 in the brain by the action of brain iodothyronine deiodinases in
maintaining brain T3 levels (Darras et al. 1999; Zoeller and Crofton 2000). From a toxicological
perspective, these observations also suggest that in the rat, a decrease in maternal serum T4 levels, even in
the absence of changes in maternal serum T3 levels may have adverse consequences on fetal brain
development. Zoeller and Rovet (2004), and others cited therein, have reviewed the issue of the role of
thyroid hormones in brain development and concluded that studies of models of maternal
hypothyroidism, hypothyroxinemia and congenital hypothyroidism suggest that the timing and severity of
thyroid hormone insufficiency predicts the type and severity of the neurological deficits.
Perchlorate could potentially disrupt fetal thyroid hormone status by three mechanisms. Perchlorate
inhibition of maternal thyroid iodide uptake, and the resulting suppression in production and levels of
maternal thyroid hormones, could limit the availability of thyroid hormones needed for normal fetal
development prior to the onset of fetal thyroid hormone production if thyroid function in the mother is
compromised. Perchlorate can also cross the placenta and may directly inhibit fetal thyroid iodide uptake
and, secondarily, fetal thyroid hormone production. By inhibiting NIS in breast tissue, perchlorate may
also limit the availability of iodide to nursing infants, who depend entirely on breast milk for the iodide
120 PERCHLORATES
3. HEALTH EFFECTS
needed to produce thyroid hormone (Agency for Toxic Substances and Disease Registry 2004). No
information is available on the doses in humans that might decrease iodide uptake into breast milk.
Radioiodine uptake into mammary milk was decreased in rats exposed to 1 or 10 mg/kg/day perchlorate
in drinking water (Clewell et al. 2003b). Studies conducted in cows and goats have also shown that
perchlorate can decrease radioiodine uptake into mammary milk (Howard et al. 1996).
Thyroid suppression at birth has been observed in infants born to mothers who received potassium
perchlorate during pregnancy for treatment of hyperthyroidism (Crooks and Wayne 1960; Fisher et al.
1962). Direct evidence of maternal-fetal transfer of perchlorate and suppression of fetal thyroid iodide
uptake and hormone production has been provided from studies of rats and guinea pigs (Clewell et al.
2003a; Postel 1957; Schröder-van der Elst et al. 2001; York et al. 2001b). Several epidemiological
studies have explored the strength of possible associations between perchlorate exposures and neonatal
thyroid hormone status. Although some of these studies are suggestive of a possible association between
perchlorate exposures and elevated serum TSH levels in infants, the findings of the currently available
epidemiological literature, taken in toto, is inconclusive regarding effects of perchlorate on neonatal
thyroid hormone status (Brechner et al. 2000; Crump et al. 2000; Lamm and Doemland 1999; Li et al.
2000a, 2000b; Schwartz 2001). Furthermore, these studies were likely to be confounded because they did
not obtain individual estimates of perchlorate exposure. Without this information, it is likely that these
studies were comparing T4 levels, on average, among groups of people that were not, on average,
exposed to different levels of perchlorate. Studies conducted in rats provide direct evidence that
perchlorate exposures during pregnancy or lactation can disturb thyroid hormone status in the neonate
(Brown-Grant 1966; Brown-Grant and Sherwood 1971; Clewell et al. 2003a, 2003b; Golstein et al. 1988;
Lampe et al. 1967; Mahle et al. 2003; York et al. 2001a, 2003, 2004). The mechanisms for these effects
have not been elucidated.
3.5.3 Animal-to-Human Extrapolations
The ability of perchlorate to inhibit thyroid uptake of iodide in both humans (Bürgi et al. 1974; DeGroot
and Buhler 1971; Faure and Dussault 1975; Greer et al. 2002; Lawrence et al. 2000, 2001; Stanbury and
Wyngaarden 1952) and animals (Kapitola et al. 1971; Ortiz-Caro et al. 1983; Schonbaum et al. 1965;
Wyngaarden et al. 1952) is well established. Based on this ability, potassium perchlorate was widely
used for a time as treatment to restore normal thyroid activity in patients with hyperactive thyroids (e.g.,
Crooks and Wayne 1960; Morgans and Trotter 1960). Therapeutically effective doses in humans were in
the range of 5–20 mg perchlorate/kg/day.
121 PERCHLORATES
3. HEALTH EFFECTS
Although abundant evidence exists to show that perchlorate can inhibit thyroid iodide uptake in humans,
direct evidence that perchlorate can disrupt thyroid hormone levels and produce changes in thyroid
morphology (in the absence of underlying thyroid disorder, such as Graves’ disease or other causes such
as thyrotoxicosis) derives largely from animal studies. Changes in serum levels of thyroid hormones,
indicative of suppressed hormone production, and thyroid hypertrophy, indicative of stimulation of the
thyroid gland by TSH, have been shown to occur in rats and mice exposed to perchlorate by the oral route
(see Section 3.2.2.2, Endocrine Effects). Evidence that perchlorate can produce thyroid tumors also
derives from the results of studies conducted in mice and rats (see Section 3.2.2.7). In humans and other
mammals, a limitation in the availability of iodide for thyroid hormone production, regardless of the
cause of the limitation, triggers an HPT feedback mechanism, which serves to maintain serum hormones
at sufficient levels to satisfy physiological requirements. Extrapolation of dose levels that disrupt thyroid
hormone status in animals to pharmacodynamically equivalent doses in humans must take into account
not only potential species differences in perchlorate biokinetics, but also potential species differences in
the compensatory response to a limitation in iodide availability to the thyroid.
Few studies have been reported that allow direct comparisons of the dose-response relationships for the
effects of perchlorate on thyroid hormone status in humans and experimental animals. However, these
studies indicate that the response of human adults to short-term oral dosages (mg/kg/day) of perchlorate is
quantitatively different from the response observed in rats given comparable dosages. Inhibition of
thyroid iodide uptake has been observed in healthy euthyroid adults who were exposed to dosages
exceeding 0.007 mg/kg/day in drinking water (Greer et al. 2002; Lawrence et al. 2000). The dosage that
produced a 50% inhibition of 24-hour thyroid iodide uptake was approximately 0.15 mg/kg/day when the
exposure duration was either for 2 or 14 days (Figure 3-8; Greer et al. 2002). Oral doses that ranged from
0.007 to 0.5 mg/kg/day for 14 days had no observable effect on serum TSH or thyroid hormone levels in
healthy adults (Greer et al. 2002; Lawrence et al. 2000). Oral doses of perchlorate that produced the same
magnitude of inhibition of 24-hour thyroid iodide were higher in rats compared to humans. For example,
in rats, 1 mg/kg/day in drinking water for 1 or 14 days produced a 0 or 15% inhibition, respectively
(Figure 3-8; Yu et al. 2002). However, this same study observed inhibition of thyroid iodide uptake (10–
30%) that was similar in magnitude to that observed in humans when iodide was administered to rats
2 hours following a single intravenous dose of 0.01 or 0.1 mg perchlorate/kg/day and thyroid iodide
uptake was determined 2–9 hours following the radioiodide dose (Yu et al. 2002). Rats also exhibited
elevated plasma levels of TSH when exposed to perchlorate for 14 days, and a pronounced attenuation of
the inhibition in thyroid iodide uptake compared to the response observed following 2 days of exposure to
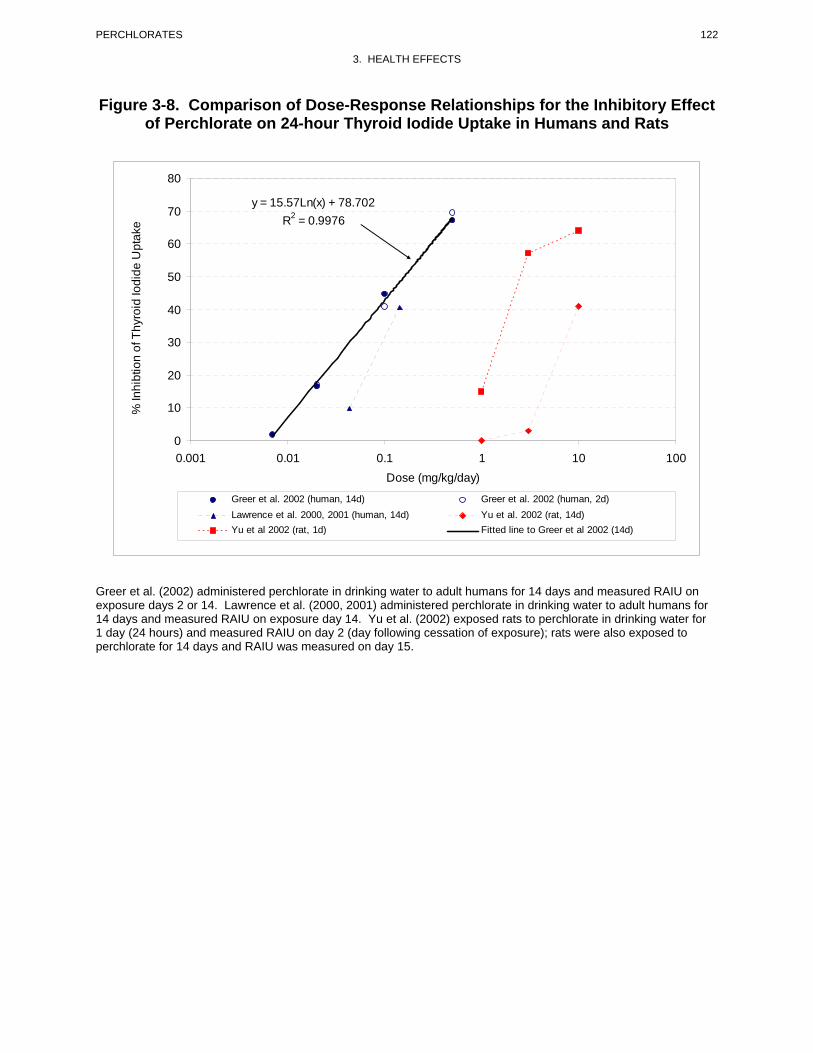
122 PERCHLORATES
3. HEALTH EFFECTS
Figure 3-8. Comparison of Dose-Response Relationships for the Inhibitory Effect of Perchlorate on 24-hour Thyroid Iodide Uptake in Humans and Rats
y = 15.57Ln(x) + 78.702 R2 = 0.9976
0
10
20
30
40
50
60
70
80
0.001 0.01 0.1 1 10 100 Dose (mg/kg/day)
Greer et al. 2002 (human, 14d) Greer et al. 2002 (human, 2d) Lawrence et al. 2000, 2001 (human, 14d) Yu et al. 2002 (rat, 14d) Yu et al 2002 (rat, 1d) Fitted line to Greer et al 2002 (14d)
% In
hibt
ion
of T
hyro
id Io
dide
Upt
ake
Greer et al. (2002) administered perchlorate in drinking water to adult humans for 14 days and measured RAIU on exposure days 2 or 14. Lawrence et al. (2000, 2001) administered perchlorate in drinking water to adult humans for 14 days and measured RAIU on exposure day 14. Yu et al. (2002) exposed rats to perchlorate in drinking water for 1 day (24 hours) and measured RAIU on day 2 (day following cessation of exposure); rats were also exposed to perchlorate for 14 days and RAIU was measured on day 15.
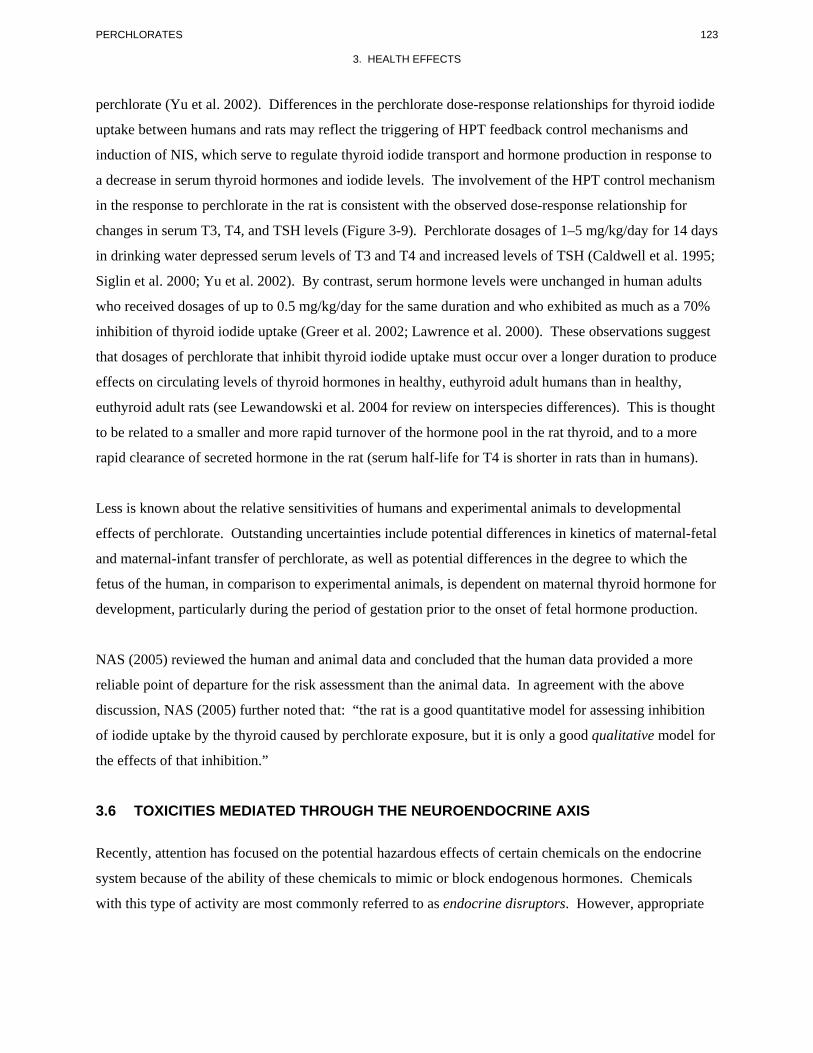
123 PERCHLORATES
3. HEALTH EFFECTS
perchlorate (Yu et al. 2002). Differences in the perchlorate dose-response relationships for thyroid iodide
uptake between humans and rats may reflect the triggering of HPT feedback control mechanisms and
induction of NIS, which serve to regulate thyroid iodide transport and hormone production in response to
a decrease in serum thyroid hormones and iodide levels. The involvement of the HPT control mechanism
in the response to perchlorate in the rat is consistent with the observed dose-response relationship for
changes in serum T3, T4, and TSH levels (Figure 3-9). Perchlorate dosages of 1–5 mg/kg/day for 14 days
in drinking water depressed serum levels of T3 and T4 and increased levels of TSH (Caldwell et al. 1995;
Siglin et al. 2000; Yu et al. 2002). By contrast, serum hormone levels were unchanged in human adults
who received dosages of up to 0.5 mg/kg/day for the same duration and who exhibited as much as a 70%
inhibition of thyroid iodide uptake (Greer et al. 2002; Lawrence et al. 2000). These observations suggest
that dosages of perchlorate that inhibit thyroid iodide uptake must occur over a longer duration to produce
effects on circulating levels of thyroid hormones in healthy, euthyroid adult humans than in healthy,
euthyroid adult rats (see Lewandowski et al. 2004 for review on interspecies differences). This is thought
to be related to a smaller and more rapid turnover of the hormone pool in the rat thyroid, and to a more
rapid clearance of secreted hormone in the rat (serum half-life for T4 is shorter in rats than in humans).
Less is known about the relative sensitivities of humans and experimental animals to developmental
effects of perchlorate. Outstanding uncertainties include potential differences in kinetics of maternal-fetal
and maternal-infant transfer of perchlorate, as well as potential differences in the degree to which the
fetus of the human, in comparison to experimental animals, is dependent on maternal thyroid hormone for
development, particularly during the period of gestation prior to the onset of fetal hormone production.
NAS (2005) reviewed the human and animal data and concluded that the human data provided a more
reliable point of departure for the risk assessment than the animal data. In agreement with the above
discussion, NAS (2005) further noted that: “the rat is a good quantitative model for assessing inhibition
of iodide uptake by the thyroid caused by perchlorate exposure, but it is only a good qualitative model for
the effects of that inhibition.”
3.6 TOXICITIES MEDIATED THROUGH THE NEUROENDOCRINE AXIS
Recently, attention has focused on the potential hazardous effects of certain chemicals on the endocrine
system because of the ability of these chemicals to mimic or block endogenous hormones. Chemicals
with this type of activity are most commonly referred to as endocrine disruptors. However, appropriate
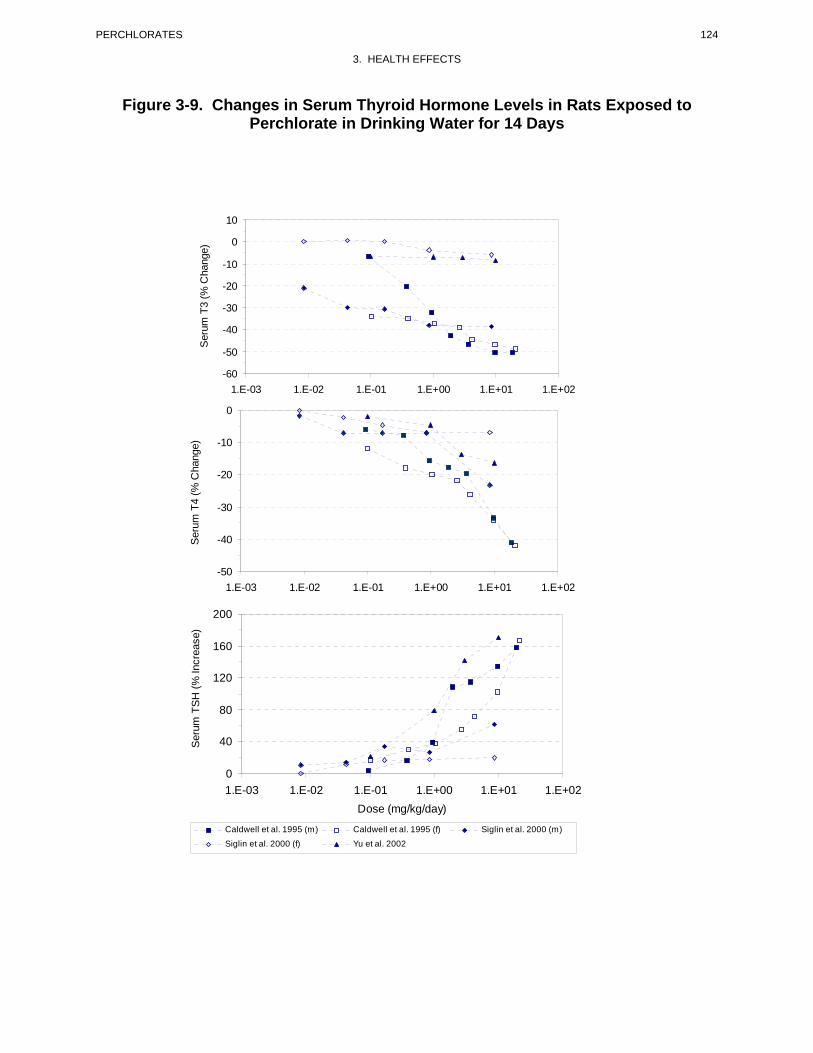
124 PERCHLORATES
3. HEALTH EFFECTS
Figure 3-9. Changes in Serum Thyroid Hormone Levels in Rats Exposed to Perchlorate in Drinking Water for 14 Days
1.E-03 1.E-02 1.E-01 1.E+00 1.E+01 1.E+02
1.E-03 1.E-02 1.E-01 1.E+00 1.E+01 1.E+02
1.E-03 1.E-02 1.E-01 1.E+00 1.E+01 1.E+02 Dose (mg/kg/day)
Caldwell et al. 1995 (m) Caldwell et al. 1995 (f) Siglin et al. 2000 (m)
Siglin et al. 2000 (f) Yu et al. 2002
-60
-50
-40
-30
-20
-10
0
10 S
erum
T3
(% C
hang
e)
-50
-40
-30
-20
-10
0
Seru
m T
4 (%
Cha
nge)
0
40
80
120
160
200
Ser
um T
SH (%
Incr
ease
)
125 PERCHLORATES
3. HEALTH EFFECTS
terminology to describe such effects remains controversial. The terminology endocrine disruptors,
initially used by Thomas and Colborn (1992), was also used in 1996 when Congress mandated the EPA to
develop a screening program for “...certain substances [which] may have an effect produced by a
naturally occurring estrogen, or other such endocrine effect[s]...”. To meet this mandate, EPA convened a
panel called the Endocrine Disruptors Screening and Testing Advisory Committee (EDSTAC), and in
1998, the EDSTAC completed its deliberations and made recommendations to EPA concerning endocrine
disruptors. In 1999, the National Academy of Sciences released a report that referred to these same types
of chemicals as hormonally active agents. The terminology endocrine modulators has also been used to
convey the fact that effects caused by such chemicals may not necessarily be adverse. Many scientists
agree that chemicals with the ability to disrupt or modulate the endocrine system are a potential threat to
the health of humans, aquatic animals, and wildlife. However, others think that endocrine-active
chemicals do not pose a significant health risk, particularly in view of the fact that hormone mimics exist
in the natural environment. Examples of natural hormone mimics are the isoflavinoid phytoestrogens
(Adlercreutz 1995; Livingston 1978; Mayr et al. 1992). These chemicals are derived from plants and are
similar in structure and action to endogenous estrogen. Although the public health significance and
descriptive terminology of substances capable of affecting the endocrine system remains controversial,
scientists agree that these chemicals may affect the synthesis, secretion, transport, binding, action, or
elimination of natural hormones in the body responsible for maintaining homeostasis, reproduction,
development, and/or behavior (EPA 1997a). Stated differently, such compounds may cause toxicities that
are mediated through the neuroendocrine axis. As a result, these chemicals may play a role in altering,
for example, metabolic, sexual, immune, and neurobehavioral function. Such chemicals are also thought
to be involved in inducing breast, testicular, and prostate cancers, as well as endometriosis (Berger 1994;
Giwercman et al. 1993; Hoel et al. 1992).
Perchlorate can impair thyroid hormone production and, therefore, can be classified as an endocrine
disruptor. As discussed in Sections 3.2.2.2 (Systemic-Endocrine Effects) and 3.5.2 (Mechanisms of
Toxicity), at sufficiently high dosages, perchlorate can limit the availability of iodide needed for the
production of the hormones in the thyroid and can depress serum levels of the thyroid hormones, T4 and
T3. The latter effect triggers HPT feedback control mechanisms to produce TSH, which stimulates
growth of the thyroid and induces NIS, the primary mechanism by which iodide enters thyroid follicle
cells from the blood and the first step in the uptake of iodide into the thyroid and formation of thyroid
hormones. Thus, perchlorate exposure at sufficiently high doses has the potential for producing all of the
adverse consequences of hypothyroidism including impairments in the development of the nervous
systems and other organ systems, thyroid gland enlargement, and follicular cell hyperplasia and neoplasia.
126 PERCHLORATES
3. HEALTH EFFECTS
However, studies discussed earlier indicate that at perchlorate levels routinely found in the environment,
no evidence of such adverse effects have been observed or documented.
3.7 CHILDREN’S SUSCEPTIBILITY
This section discusses potential health effects from exposures during the period from conception to
maturity at 18 years of age in humans, when most biological systems have fully developed. However, the
brain continues to develop until about 25 years of age. Potential effects on offspring resulting from
exposures of parental germ cells are considered, as well as any indirect effects on the fetus and neonate
resulting from maternal exposure during gestation and lactation. Relevant animal and in vitro models are
also discussed.
Children are not small adults. They differ from adults in their exposures and may differ in their
susceptibility to hazardous chemicals. Children’s unique physiology and behavior can influence the
extent of their exposure. Exposures of children are discussed in Section 6.6, Exposures of Children.
Children sometimes differ from adults in their susceptibility to hazardous chemicals, but whether there is
a difference depends on the chemical (Guzelian et al. 1992; NRC 1993). Children may be more or less
susceptible than adults to health effects, and the relationship may change with developmental age
(Guzelian et al. 1992; NRC 1993). Vulnerability often depends on developmental stage. There are
critical periods of structural and functional development during both prenatal and postnatal life, and a
particular structure or function will be most sensitive to disruption during its critical period(s). Damage
may not be evident until a later stage of development. There are often differences in pharmacokinetics
and metabolism between children and adults. For example, absorption may be different in neonates
because of the immaturity of their gastrointestinal tract and their larger skin surface area in proportion to
body weight (Morselli et al. 1980; NRC 1993); the gastrointestinal absorption of lead is greatest in infants
and young children (Ziegler et al. 1978). Distribution of xenobiotics may be different; for example,
infants have a larger proportion of their bodies as extracellular water, and their brains and livers are
proportionately larger (Altman and Dittmer 1974; Fomon 1966; Fomon et al. 1982; Owen and Brozek
1966; Widdowson and Dickerson 1964). The infant also has an immature blood-brain barrier (Adinolfi
1985; Johanson 1980) and probably an immature blood-testis barrier (Setchell and Waites 1975). Many
xenobiotic metabolizing enzymes have distinctive developmental patterns. At various stages of growth
and development, levels of particular enzymes may be higher or lower than those of adults, and
sometimes unique enzymes may exist at particular developmental stages (Komori et al. 1990; Leeder and
127 PERCHLORATES
3. HEALTH EFFECTS
Kearns 1997; NRC 1993; Vieira et al. 1996). Whether differences in xenobiotic metabolism make the
child more or less susceptible also depends on whether the relevant enzymes are involved in activation of
the parent compound to its toxic form or in detoxification. There may also be differences in excretion,
particularly in newborns who all have a low glomerular filtration rate and have not developed efficient
tubular secretion and resorption capacities (Altman and Dittmer 1974; NRC 1993; West et al. 1948).
Children and adults may differ in their capacity to repair damage from chemical insults. Children also
have a longer remaining lifetime in which to express damage from chemicals; this potential is particularly
relevant to cancer.
Certain characteristics of the developing human may increase exposure or susceptibility, whereas others
may decrease susceptibility to the same chemical. For example, although infants breathe more air per
kilogram of body weight than adults breathe, this difference might be somewhat counterbalanced by their
alveoli being less developed, which results in a disproportionately smaller surface area for alveolar
absorption (NRC 1993).
Fetuses, infants and children may be especially susceptible to the thyroid effects of perchlorate. Thyroid
hormones regulate cell proliferation, migration, and differentiation during development, therefore,
maintenance of normal levels is essential to normal growth and development. Disruption of circulating
hormone levels can have markedly different effects, depending on the stage of development. Effects can
include mental retardation, impaired motor skills, and hearing and speech impediments (Boyages 2000;
Fisher and Brown 2000; Haddow et al. 1999; Pop et al. 1999). Several factors may contribute to a high
vulnerability of the fetus and neonate to perchlorate (see Section 3.10, Susceptible Populations, for further
details). In addition, as discussed by NAS (2005), preterm infants are more sensitive to thyroid hormone
perturbations than term infants.
Thus far, there is no conclusive evidence that exposure to perchlorate produces developmental effects in
humans. Two studies of newborns in Arizona and California reported that neonates from women whose
drinking water contained perchlorate had higher TSH values than those from women with no exposure to
perchlorate (Brechner et al. 2000; Schwartz 2001). However, the methods used in the two latter studies
have been questioned. Other similar studies in the United States have found no significant associations
between maternal exposure to perchlorate via the drinking water and T4 levels (Li et al. 2000a), TSH
levels (Li et al. 2000b), and incidence of congenital hypothyroidism (Kelsh et al. 2003; Lamm and
Doemland 1999). Two studies of Chilean neonates whose mothers may have been chronically exposed to
up to 100–120 μg/L (ppb) of perchlorate in the drinking water found no evidence of adverse thyroid
128 PERCHLORATES
3. HEALTH EFFECTS
effects among the neonates (Crump et al. 2000; Téllez et al. 2005). Studies in experimental animals have
shown that exposure of the mother to perchlorate during gestation, or even during lactation, can lead to
reduced thyroid hormone levels and associated thyroid effects in the offspring (Brown-Grant and
Sherwood 1971; Golstein et al. 1988; Lampe et al. 1967; Postel 1957; York et al. 2001a, 2003, 2004).
Evaluation of a series of neurobehavioral parameters in rat pups exposed to perchlorate in utero (maternal
exposure up to 8.5 mg perchlorate/kg/day) and through maternal milk revealed no significant treatment-
related effects (Bekkedal et al. 2000; York et al. 2004). Microscopic examination of the brain from
12-day-old pups showed a significant increase in the thickness of the corpus callosum from females in the
highest dose group, 8.5 mg/kg/day (York et al. 2004), but a subsequent study by the same group of
investigators reported a similar effect at 0.09 and 0.9 mg/kg/day, but not at highest dose tested,
25.5 mg/kg/day (York et al. 2005b). The toxicological significance of this finding is controversial and its
biological significance has been questioned (NAS 2005). High-dose male offspring sacrificed at about
80 days of age had a significant increase in brain weight and in the weight of the prefrontal cortex and
corpus callosum (York et al. 2004). Exposure to perchlorate has not caused teratogenic effects in
animals.
Perchlorate has been shown to cross the placenta of rats (Clewell et al. 2003a; Schröeder-van der Elst et
al. 2001). Thus, in addition to the potential for perchlorate to exert effects on fetal development by
depressing levels of maternal thyroid hormones, perchlorate may exert direct effects on the fetal thyroid.
Thyroid suppression at birth has been observed in infants born to mothers who received potassium
perchlorate during pregnancy for treatment of hyperthyroidism (Crooks and Wayne 1960; Fisher et al.
1962). Direct evidence of maternal-fetal transfer of perchlorate and suppression of fetal thyroid hormone
production has been provided from studies of rats and guinea pigs (Postel 1957; York et al. 2001b; Yu et
al. 2002).
Studies conducted in experimental animals have shown that perchlorate enters mammary milk (Clewell et
al. 2003b). Perchlorate has also been detected in human breast milk at a mean concentration of 10 ppb
(Kirk et al. 2005). Whereas this indicates that nursing infants may be exposed to perchlorate in breast
milk, whether the amount of perchlorate in the breast milk is great enough to affect thyroid function of the
infant has not been demonstrated. However, a recent study in rats showed that the NIS actively
concentrates perchlorate in the milk and suggested that exposure of newborns to high levels of perchlorate
may pose a greater health risk than previously thought because it could directly inhibit the newborn
thyroidal iodide uptake (Dohán et al. 2007). Nevertheless, the beneficial aspects (biological and

129 PERCHLORATES
3. HEALTH EFFECTS
psychological) of breast-feeding outweigh any risks from exposure to perchlorate from mother’s milk,
especially if they consume adequate iodine from food and supplements.
Models of the biokinetics of perchlorate in adult humans and rats have been developed (Fisher et al. 2000;
Merrill et al. 2003, 2005). An adult rat model has been extended to include pregnancy and maternal-fetal
transfer of perchlorate, and lactation and maternal-pup perchlorate transfer through milk (Clewell et al.
2003a, 2003b). These models have been used to develop predictive models for the human gestation and
postnatal period (Clewell et al. 2007). In the latter study, pregnant and lactating women, the fetus, and
nursing infants were predicted to have higher concentrations of perchlorate in blood and greater thyroid
iodide uptake inhibition at a given concentration of perchlorate in drinking water than either nonpregnant
adults or older children. Although the fetus was predicted to receive the greatest dose, the predicted
extent of iodide inhibition was not significant (approximately 1%) at the NAS-recommended reference
dose of 0.7 µg/kg/day for perchlorate.
3.8 BIOMARKERS OF EXPOSURE AND EFFECT
Biomarkers are broadly defined as indicators signaling events in biologic systems or samples. They have
been classified as markers of exposure, markers of effect, and markers of susceptibility (NAS/NRC
1989).
Due to a nascent understanding of the use and interpretation of biomarkers, implementation of biomarkers
as tools of exposure in the general population is very limited. A biomarker of exposure is a xenobiotic
substance or its metabolite(s) or the product of an interaction between a xenobiotic agent and some target
molecule(s) or cell(s) that is measured within a compartment of an organism (NAS/NRC 1989). The
preferred biomarkers of exposure are generally the substance itself, substance-specific metabolites in
readily obtainable body fluid(s), or excreta. However, several factors can confound the use and
interpretation of biomarkers of exposure. The body burden of a substance may be the result of exposures
from more than one source. The substance being measured may be a metabolite of another xenobiotic
substance (e.g., high urinary levels of phenol can result from exposure to several different aromatic
compounds). Depending on the properties of the substance (e.g., biologic half-life) and environmental
conditions (e.g., duration and route of exposure), the substance and all of its metabolites may have left the
body by the time samples can be taken. It may be difficult to identify individuals exposed to hazardous
substances that are commonly found in body tissues and fluids (e.g., essential mineral nutrients such as
copper, zinc, and selenium). Biomarkers of exposure to perchlorates are discussed in Section 3.8.1.
130 PERCHLORATES
3. HEALTH EFFECTS
Biomarkers of effect are defined as any measurable biochemical, physiologic, or other alteration within an
organism that, depending on magnitude, can be recognized as an established or potential health
impairment or disease (NAS/NRC 1989). This definition encompasses biochemical or cellular signals of
tissue dysfunction (e.g., increased liver enzyme activity or pathologic changes in female genital epithelial
cells), as well as physiologic signs of dysfunction such as increased blood pressure or decreased lung
capacity. Note that these markers are not often substance specific. They also may not be directly
adverse, but can indicate potential health impairment (e.g., DNA adducts). Biomarkers of effects caused
by perchlorates are discussed in Section 3.8.2.
A biomarker of susceptibility is an indicator of an inherent or acquired limitation of an organism's ability
to respond to the challenge of exposure to a specific xenobiotic substance. It can be an intrinsic genetic or
other characteristic or a preexisting disease that results in an increase in absorbed dose, a decrease in the
biologically effective dose, or a target tissue response. If biomarkers of susceptibility exist, they are
discussed in Section 3.10, Populations That Are Unusually Susceptible.
3.8.1 Biomarkers Used to Identify or Quantify Exposure to Perchlorates
Studies in workers exposed to perchlorate (Lamm et al. 1999) and in volunteers who ingested daily doses
of perchlorate for 14 days (Lawrence et al. 2000) indicate that perchlorate is rapidly eliminated
unchanged in the urine (see Section 3.4.4). Urine, therefore, is a convenient testing medium for
perchlorate. However, the excretion of perchlorate is so rapid that an acute exposure might be detectable
for only a few days after exposure. Both occupational studies and studies with volunteers have estimated
an elimination half-life for perchlorate of approximately 8–12 hours (Greer et al. 2002; Lamm et al. 1999;
Lawrence et al. 2000). The methods used for measuring perchlorate in urine have not been standardized
(see also Section 7.1).
Using a highly selective analytical method of coupled ion chromatography and electrospray tandem mass
spectrometry, Valentín-Blasini et al. (2005) found an association between urinary levels of perchlorate
with the concentrations of perchlorate in drinking water in a population of women from Chile. In a
population with no known perchlorate drinking water contamination, concentrations of perchlorate
adjusted for urinary creatinine showed a median level of 7.8 μg perchlorate/g creatinine, with a range of
1–35 μg perchlorate/g creatinine. Although the intake of perchlorate through food had not been measured
in this population, this population probably has a high background dietary intake of perchlorate because
131 PERCHLORATES
3. HEALTH EFFECTS
Chilean soil is a natural source of of perchlorate. When the urine samples of the pregnant women in three
cities in the study in Chile (Crump et al. 2000) were analyzed by this method, the women in the city with
a drinking water concentration of perchlorate of about 0.4 ng/mL had a median urinary concentration of
21 μg perchlorate/g creatinine, those with a drinking water concentration of about 5.8 ng/mL had a
median urinary concentration of 37 μg perchlorate/g creatinine, and those with a drinking water
concentration of about 114 ng/mL had a median urinary concentration of 120 μg perchlorate/g creatinine
(Valentín-Blasini et al. 2005). Recently, Gibbs (2006) demonstrated a highly significant linear correlation
between the concentration of perchlorate in serum and dose over a dose range covering almost four orders
of magnitude. The studies that contributed data for Gibbs’ analysis included Brabant et al. (1992), Crump
et al. (2000), Lawrence et al. (2000), and Merrill et al. (2005).
Perchlorate has also been detected in human breast milk, but the concentrations were not correlated with
the water consumed by the lactating women. As perchlorate is fairly rapidly cleared when exposure
ceases, the presence of perchlorate in breast milk may be highly variable with time and recent dietary
history (Kirk et al. 2005; Pearce et al. 2007).
Other potential biomarkers of exposure to perchlorate relate to their effect on the thyroid gland. As
described in Section 3.5.2, Mechanisms of Toxicity, perchlorate blocks uptake of iodide into the thyroid,
leading to an increase in the serum level of free iodine (i.e., not bound to T4), which is then excreted in
urine. No study has developed a correlation between exposure to particular dose levels of perchlorate and
specific relative increases of free iodine in serum or urine. In serum, the normal level of free iodine
ranges from 1.0 to 5.2 µg/L and the level of protein-bound iodine ranges from 32 to 72 µg/L. Iodine is
excreted in urine at a rate that is nearly equal to the rate of intake, or approximately 100–200 µg/24 hours
(Agency for Toxic Substances and Disease Registry 2004). Saliva also has potential as a source of
noninvasive biomarker because anions such as perchlorate are actively sequestered into the salivary gland
by the NIS. Perchlorate produces a decrease in the levels of T3 and T4 in serum, while increasing the
serum level of TSH in rats, but this has not been shown in humans at doses below those used in clinical
medicine to treat thyrotoxicosis. Specific correlations between levels and duration of exposure to
perchlorate and alterations in serum levels of T3, T4, or TSH in humans have not been developed.
Furthermore, these potential biomarkers are not specific to perchlorate; other antithyroid agents, such as
carbimazole, can have similar effects.
132 PERCHLORATES
3. HEALTH EFFECTS
3.8.2 Biomarkers Used to Characterize Effects Caused by Perchlorates
The thyroid is the critical target for perchlorate. Perchlorate blocks uptake of iodide into the thyroid,
leading to an increase in the serum level of free iodine (i.e., not bound to T4), which is then excreted in
urine. If the dosage is sufficient to limit the availability of iodide for the production of thyroid hormones,
then perchlorate can also produce a decrease in the levels of T3 and T4 in serum, while increasing the
serum level of TSH. Therefore, levels of iodide in serum or urine, and levels of T3, T4, and TSH in
serum, can all be considered to be biomarkers of effect for perchlorate. A recent study showed that in
women with urinary iodine <100 µg/L, urinary perchlorate (which is a measure of perchlorate intake) was
a significant negative predictor of TT4 and a positive predictor of TSH (Blount et al. 2006). It should be
noted that none of these biomarkers is specific to perchlorate; other antithyroid agents such as
carbimazole can have similar effects. It should also be noted that TT4 is not routinely measured for
clinical significance as it is too impacted by other biological variables. Although the specific amount of
change in these biomarkers associated with a demonstrably adverse effect has not been established,
changes in these parameters can be considered to indicate potential impairment of health. Typical normal
ranges for hormone levels are shown in Table 3-4.
3.9 INTERACTIONS WITH OTHER CHEMICALS
No studies were located regarding health effects in humans exposed to perchlorate in combination with
other chemicals that are likely to be found with perchlorate in the environment, in the workplace, or at
hazardous waste sites.
Limited information was found in studies in animals. Administration of a single dose of 7.5 or 75 µg/kg
of 3,3’,4,4’5-pentachlorobiphenyl (PCB 126) to rats followed 9 days later by doses of up to 1 mg
perchlorate/kg/day in the drinking water for additional 14 days showed less than additive effects on serum
TSH, TT4, FT4, and hepatic T4-glucuronide (McLanahan et al. 2007). Exposure to lower doses of each
chemical (NOEL doses), resulted in no interaction between the chemicals for the thyroid indices
measured. In another study, simultaneous exposure of rats to various concentrations of ammonium
perchlorate and sodium chlorate for 7 days reduced serum total T4 to a greater extent than either chemical
alone (Khan et al. 2005).
Tonacchera et al. (2004) investigated the simultaneous joint effects of perchlorate and other competitive
inhibitors of iodide uptake (thiocyanate, nitrate, and non-radioactive iodide) in inhibiting RAIU in an
in vitro test system in which human NIS was stably transfected into a Chinese hamster ovary (CHO) cell
133 PERCHLORATES
3. HEALTH EFFECTS
line. The relative potency of perchlorate to inhibit 125I⎯ uptake at the NIS was 15, 30, and 240 times that
of thiocyanate, non-radioactive iodide, and nitrate, respectively, on a molar concentration basis. The
results showed that the anions interact in a simple additive fashion and that the concentration response for
each inhibitor was indistinguishable from that of each of the others after adjusting for differences in
inhibition potencies.
Nitrate and thiocyanate are widely distributed in nature and, because both anions also inhibit RAIU, as
demonstrated by Tonacchera et al. (2004), should also be included in the discussion of the effects of
inhibition of the NIS by anions. Nitrate is a natural constituent of green leafy vegetables and is also used
as a preservative. Administration of a diet containing 3% potassium nitrate to rats for 4 weeks resulted in
a significant increase in thyroid weight and serum TSH levels and in reductions in serum T3 and T4
(Mukhopadhyay et al. 2005). Thiocyanate can be derived from thioglucosides present in foods such as
cabbage, cauliflower, and broccoli, and is also found in tobacco. The effects of thiocyanate on thyroidal
function of humans have been known for a long time. Gibbs (2006) reviewed the literature and reported
that no adverse or non-adverse thyroidal effects of thiocyanate occur at serum concentrations of
thiocyanate <50 µmol/L. This concentration of thiocyanate is equivalent to approximately 3.3 µmol
perchlorate/L in terms of iodine uptake inhibition (Tonacchera et al. 2004). To achieve such
concentration of perchlorate in serum, the daily dose of perchlorate would have to be 0.27 mg/kg/day, or a
70-kg adult would have to drink 2 L of water daily containing 9 mg perchlorate (Gibbs 2006). However,
extrapolating data from the in vitro studies such as the Tonacchera et al. (2004) study to situations in vivo
may not be appropriate because the in vitro studies cannot account for the relative human half-lives of
perchlorate, thiocyanate, and nitrate or other factors such as protein binding and chronicity. In a related
study, De Groef et al. (2006) examined the possible contribution of nitrate and thiocyanate to NIS
inhibition. Using EPA’s current Maximum Contaminant Level (MCL) for nitrate in drinking water,
De Groef et al. (2006) showed that the concentration of nitrate allowed in water would cause an inhibition
of iodine uptake by the NIS equivalent to 300 ppb perchlorate, 12 times greater than the concentration of
about 25 ppb that corresponds to the RfD for perchlorate proposed by the NAS (assuming a 70-kg adult
consuming 2 L of water per day). The same exercise with thiocyanate showed that the MCL for
thiocyanate is equivalent to approximately 23 ppb perchlorate. The conclusion reached by the
investigators was that “when considering the potential thyroid-related health risks posed by monovalent
anions, perchlorate only accounts for a small fraction (<10%) of the exposure from drinking water.”

134 PERCHLORATES
3. HEALTH EFFECTS
3.10 POPULATIONS THAT ARE UNUSUALLY SUSCEPTIBLE
A susceptible population will exhibit a different or enhanced response to perchlorates than will most
persons exposed to the same level of perchlorates in the environment. Reasons may include genetic
makeup, age, health and nutritional status, and exposure to other toxic substances (e.g., cigarette smoke).
These parameters result in reduced detoxification or excretion of perchlorates or compromised function of
organs affected by perchlorates. Populations who are at greater risk due to their unusually high exposure
to perchlorates are discussed in Section 6.7, Populations with Potentially High Exposures.
Any condition affecting processes by which circulating iodide ultimately becomes part of a functional
thyroid hormone will increase the susceptibility to substances that affect thyroid function such as
perchlorate. Among these conditions are genetic factors. This topic has been reviewed by Scinicariello et
al. (2005) and original citations can be obtained therein. For example, people with congenital iodide
transport deficit (ITD), an infrequent autosomic recessive condition that has been linked to mutations of
the perchlorate-sensitive NIS gene, may exhibit a defective transport of iodide from circulation into the
thyroid cell. People who suffer from Pendred Syndrome (PDS), an autosomal recessive disorder
characterized by deafness and goiter, may have a diminished iodide transport over the apical membrane,
which causes iodide to remain in the thyrocyte. The PDS gene product pendrin is a protein that transports
chloride and iodide and mediates the exchange of chloride and formate. Increased susceptibility to
perchlorate can also result from defects in iodide organification, a process by which iodide is oxidized
and bound to thyrosine residue in thyroglobulin. Mutations identified in proteins involved in the
iodination of the thyrosine residue may result in accumulation of iodide in the thyrocyte.
As discussed in NAS (2005), fetuses and preterm newborns constitute the most sensitive populations,
although infants and developing children are also considered sensitive populations. The expected high
sensitivity of developing organisms is due to the important role played by thyroid hormones during
development (Zoeller 2006; see also Section 3.5.2). Perchlorate may reduce the level of circulating
thyroid hormones in the blood, and low thyroid hormone levels during embryonic or fetal development
can lead to effects such as mental retardation, impaired motor skills, and hearing and speech impediments
(Haddow et al. 1999; Pop et al. 1999; Soldin et al. 2001). This is because the fetus is dependent on
maternal thyroid hormones at least until the fetal thyroid begins to produce T4 and T3 (Zoeller and
Crofton 2000). In humans, this occurs at approximately 16–20 weeks of gestation. Perchlorate also can
inhibit the NIS in breast tissue (Levy et al. 1997; Smanik et al. 1997; Spitzweg et al. 1998), and therefore
may limit the availability of iodide to nursing infants, who depend entirely on breast milk for the iodide
135 PERCHLORATES
3. HEALTH EFFECTS
needed to produce thyroid hormone (Agency for Toxic Substances and Disease Registry 2004).
However, in a study of 57 lactating women in Boston, Massachusetts, no correlation was found between
perchlorate concentrations in breast milk and concentrations of iodide in breast milk (Pearce et al. 2007).
As discussed by Ginsberg et al. (2007), additional factors that make neonates a sensitive group include
their shorter serum half-life for T4 of approximately 3 days compared to approximately 7–10 days in
adults, a lower storage capacity of the thyroid for T4, and possibly slower urinary clearance of perchlorate
due to immature renal function. Hypothyroid pregnant women also constitute a susceptible group who
may also put the fetus at higher risk if maternal hypothyroidism is present before the onset of fetal thyroid
function at 10–12 weeks of gestation (Zoeller and Crofton 2000). Human models of pregnancy, maternal-
fetal transfer, and maternal-infant transfer of perchlorate have also been developed (Clewell et al. 2007,
see Section 3.4.5). These models have yielded predictions of external dose–internal dose relationships for
various human lifestages (Clewell et al. 2007; see Tables 3-6 and 3-7). The models predict a relatively
high vulnerability of the fetus, pregnant women, and lactating women to perchlorate-induced thyroid
iodine uptake, compared to other lifestages (e.g., greater inhibition of thyroid iodide uptake occurs in the
fetus in association with lower external doses). Women with low iodine intake may also constitute a
susceptible group, as suggested by a recent study in which urinary perchlorate was reported to be a
significant negative predictor of serum TT4 and a significant positive predictor of serum TSH in women
with urinary iodine <100 µg/L (Blount et al. 2006).
People with reduced thyroid activity from other causes may also be an unusually susceptible population.
This includes people living in endemic goiter areas with low iodine intake, people with exposure to other
anti-thyroid drugs (e.g., lithium) (Green 1996; Spaulding et al. 1972), and people with Hashimoto’s
disease (autoimmune hypothyroidism [Weetman 2000]) or other diseases that reduce thyroid hormone
levels. Exposure to perchlorate may produce additional deficiencies in these people beyond those due to
their pre-existing conditions, potentially increasing the severity of their conditions.
3.11 METHODS FOR REDUCING TOXIC EFFECTS
This section will describe clinical practice and research concerning methods for reducing toxic effects of
exposure to perchlorates. However, because some of the treatments discussed may be experimental and
unproven, this section should not be used as a guide for treatment of exposures to perchlorates. When
specific exposures have occurred, physicians who specialize in thyroid disorders should be consulted for
medical advice.
136 PERCHLORATES
3. HEALTH EFFECTS
No texts were located that provided specific information about treatment following exposures to
perchlorate.
3.11.1 Reducing Peak Absorption Following Exposure
There are no established methods for managing initial exposure to perchlorate or for reducing peak
absorption
Since perchlorate is readily excreted in the urine, it is reasonable to assume that increasing the water
uptake would help the body eliminate perchlorate. No studies have investigated this issue.
3.11.2 Reducing Body Burden
Perchlorate is readily eliminated from the body and does not bioaccumulate or result in a body burden.
The elimination half-life for perchlorate has been estimated to be 8–12 hours (Durand 1938; Greer et al.
2002; Lamm et al. 1999).
3.11.3 Interfering with the Mechanism of Action for Toxic Effects
There are no published studies on the treatment of perchlorate exposure by interfering with its mechanism
of toxicity. Since the inhibition of the NIS by perchlorate can limit the availability of iodide needed for
the production of T4 and T3 in the thyroid, it is important to maintain an adequate intake of iodine.
3.12 ADEQUACY OF THE DATABASE
Section 104(I)(5) of CERCLA, as amended, directs the Administrator of ATSDR (in consultation with the
Administrator of EPA and agencies and programs of the Public Health Service) to assess whether
adequate information on the health effects of perchlorates is available. Where adequate information is not
available, ATSDR, in conjunction with the National Toxicology Program (NTP), is required to assure the
initiation of a program of research designed to determine the health effects (and techniques for developing
methods to determine such health effects) of perchlorates.
The following categories of possible data needs have been identified. They are defined as substance-
specific informational needs that if met would reduce the uncertainties of human health assessment. This
definition should not be interpreted to mean that all data needs discussed in this section must be filled. In

137 PERCHLORATES
3. HEALTH EFFECTS
the future, the identified data needs will be evaluated and prioritized, and a substance-specific research
agenda will be proposed.
3.12.1 Existing Information on Health Effects of Perchlorates
The existing data on health effects of inhalation, oral, and dermal exposure of humans and animals to
perchlorates are summarized in Figure 3-10. The purpose of this figure is to illustrate the existing
information concerning the health effects of perchlorates. Each dot in the figure indicates that one or
more studies provide information associated with that particular effect. The dot does not necessarily
imply anything about the quality of the study or studies, nor should missing information in this figure be
interpreted as a “data need”. A data need, as defined in ATSDR’s Decision Guide for Identifying
Substance-Specific Data Needs Related to Toxicological Profiles (Agency for Toxic Substances and
Disease Registry 1989), is substance-specific information necessary to conduct comprehensive public
health assessments. Generally, ATSDR defines a data gap more broadly as any substance-specific
information missing from the scientific literature.
Human studies on perchlorate include cross-sectional epidemiology studies of perchlorate workers with
inhalation exposure, short-term oral experimental studies on healthy and hyperthyroid subjects, general
population studies of adults, school-age children, and neonates, and case reports of hyperthyroid patients
with intermediate- or chronic-duration oral treatment with perchlorate.
Animal studies for perchlorate are available only by the oral route. The available studies have included
investigation of systemic effects by acute, intermediate, and chronic exposure, as well as immunological,
reproductive, and developmental effects, lethality, and cancer. Limited information is available regarding
effects of perchlorate on the nervous system in adult animals. No experimental studies have been
conducted that examine the interactions of perchlorate exposure and dietary iodine levels.
3.12.2 Identification of Data Needs
Acute-Duration Exposure. Acute-duration studies are available for healthy humans (Bürgi et al.
1974; DeGroot and Buhler 1971; Faure and Dussault 1975; Greer et al. 2002; Lawrence et al. 2000, 2001)
and animals (Arieli and Chinet 1985; BRT 2000; Caldwell et al. 1995; DOD 1999; Kapitola et al. 1971;
Mannisto et al. 1979; Matsuzaki and Suzuki 1981; Schonbaum et al. 1965; Siglin et al. 2000; Spreca and
Musy 1974) orally exposed to perchlorate. These studies suggest that the thyroid is the main target for
acute exposure to perchlorate. The study by Greer et al. (2002) identified a NOEL for radioactive iodine

138 PERCHLORATES
3. HEALTH EFFECTS
Figure 3-10. Existing Information on Health Effects of Perchlorate
Inhalation
Oral
Dermal
Death
Acute
Intermediate
Chronic
Immun
ologic/Ly
mphoretic
Neurologic
Reproductive
Develo
pmental
Genotoxic
Cance
r
Systemic
Human
Inhalation
Oral
Dermal
Death
Acute
Intermediat
e
Chronic
Immuno
logic/Ly
ero
g
ero
u
eelo
m
eoto
i
ace
mh
rp
o etic
Nu
loic
Rp
dctiv
e
Dv
pental
Gn
x c
Cn
r
Systemic
Animal
Existing Studies
139 PERCHLORATES
3. HEALTH EFFECTS
uptake by the thyroid of 0.007 mg/kg/day. NAS (2005) recently completed an evaluation of the literature
on perchlorate and derived an RfD of 0.0007 mg/kg/day based on the findings of Greer et al. (2002).
ATSDR has adopted the EPA’s chronic RfD recommended by NAS (2005) for the chronic oral MRL.
Acute and intermediate MRL values will need to be assessed as relevant data from new studies are
published. Conducting acute studies by the inhalation route does not seem warranted since this route of
exposure does not play a significant role in environmental exposures to perchlorate. Although dermal
absorption of perchlorate should be negligible, information on dermal absorption and dermal toxicity
studies could be useful because skin contact with perchlorate in water supplies is likely when water
contains perchlorate. In its review of perchlorate toxicity, NAS (2005) notes that further studies of
perchlorate in rats would be of limited utility for clarifying the health effects of perchlorate in humans.
Instead, NAS recommends conducting a series of in vitro studies using human tissues and animal studies
to determine the role of NIS in placental iodide transport, the susceptibility of breast NIS to perchlorate
inhibition, the role of iodide status in these effects, and the effects of perchlorate on development
independently of effects on iodide transport. NAS (2005) further notes studies on the effects of
perchlorate on other tissues that contain NIS could be conducted.
Intermediate-Duration. Intermediate-duration studies are available for humans (Brabant et al. 1992;
Braverman et al. 2006) and animals (Bekkedal et al. 2000; BRT 2000; DOD 1999; Eskin et al. 1975;
Gauss 1972; Hiasa et al. 1987; Logonder-Mlinsek et al. 1985; MacDermott 1992; Ortiz-Caro et al. 1983;
Pajer and Kalisnik 1991; Postel 1957; Sangan and Motlag 1986, 1987; Selivanova and Vorobieva 1969;
Shevtsova et al. 1994; Siglin et al. 2000; Tarin-Remohi and Jolin 1972; Vijayalakshmi and Motlag 1989a,
1989b, 1990, 1992; York et al. 2001a, 2001b, 2003, 2004, 2005a, 2005b) orally exposed to perchlorates.
Brabant et al. (1992) studied the effect of administration of perchlorate for 4 weeks on thyroid hormone
levels in healthy volunteers and their findings suggested that a period of iodide deficiency may increase
the sensitivity of the thyroid to TSH. Braverman et al. (2006) reported that administration of up to
approximately 0.04 mg perchlorate/kg/day to volunteers for 6 months caused no significant alterations in
thyroid function tests, including radioiodine uptake. The studies in animals provided information on
systemic, immunologic, reproductive, and developmental effects of perchlorate. The thyroid gland was
shown to be the most sensitive target. Almost all of the earlier studies used only one dose level, usually
quite high. Studies conducted in the past few years have used much lower doses, which allow the
construction of dose-response relationships and the identification of NOAELs and LOAELs. In three of
these studies (Siglin et al. 2000; York et al. 2003, 2005a), ATSDR identified LOAELs of
0.009 mg/kg/day. Additional studies in animals would be useful to clarify some controversial findings of
the studies recently available. These findings concern effects of perchlorate on neurobehavioral effects
140 PERCHLORATES
3. HEALTH EFFECTS
and brain morphometry in young animals exposed in utero. As indicated above, additional studies in rats
for the purpose of clarifying the health effects of perchlorate in humans seem unnecessary given the
difference in the manner rats and humans handle the inhibition of iodide uptake by the thyroid. As
mentioned above, studies by inhalation and dermal exposure do not seem necessary at this time since the
most relevant route of exposure for perchlorate is the oral route, specifically drinking water.
Chronic-Duration Exposure and Cancer. Humans with chronic inhalation exposure to
perchlorate at work were the subject of cross-sectional epidemiology studies (Braverman et al. 2005;
Gibbs et al. 1998; Lamm et al. 1999). These studies found no significant effects associated with
perchlorate exposure. Cancer has not been reported in humans with exposure to perchlorate. A study by
Li et al. (2001) found no significant association between perchlorate in drinking water and the prevalence
of thyroid diseases or thyroid cancer residents in Nevada counties. However, no information was
available on age, gender, ethnicity, iodine intake, and other risk factors. An additional study of cancer
among residents of San Bernardino County, California, was limited by mixed exposures and lack of
adjustment for potential confounding variables (Morgan and Cassady 2002). A few chronic-duration
studies of toxicity and carcinogenicity are available in animals exposed to perchlorate orally (Kessler and
Kruskemper 1966; Toro Guillen 1991). A few intermediate-duration carcinogenicity studies by the oral
route are also available (Florencio Vicente 1990; Gauss 1972; Pajer and Kalisnik 1991). The data from
these studies are limited for assessment of toxicity or carcinogenicity, however, because only a high dose
level was used. Still, it was evident that the main target of toxicity was the thyroid gland, as thyroid
adenomas and/or carcinomas were observed in the animals. It is unclear whether additional studies would
provide new key information. As noted above, ATSDR has adopted the NAS (2005) recommended RfD
for the chronic oral MRL. EPA adopted this chronic RfD based on the NAS (2005) recommendation.
NAS (2005) recommended a clinical study designed to provide information on the potential chronic
effects of low-dose perchlorate exposure on thyroid function, with a special focus on the ability and
mechanisms of thyroid compensation. If for ethical or other reasons it is not possible to conduct studies
in humans, NAS (2005) suggested that chronic studies in nonhuman primates could provide useful
information. However, baseline thyroid studies would have to be conducted first to compare strains of
monkeys to humans.
Genotoxicity. No genotoxicity studies were located for perchlorate in humans, but two studies were
located in animals in vivo. Siglin et al. (2000) found no evidence of bone marrow micronucleus
formation in male and female rats exposed to perchlorate in the drinking water for 90 days. Similar
negative results were reported by Zeiger et al. (1998b) in mice treated with perchlorate intraperitoneally
141 PERCHLORATES
3. HEALTH EFFECTS
for 3 days. In vitro studies were limited to a test for SOS-inducing activity in S. typhimurium (Nakamura
and Kosaka 1989), a test for production of DNA-protein cross links in cultured human lymphocytes
(Costa et al. 1996), tests for mutagenicity in various Salmonella strains (Zeiger et al. 1998a), and a mouse
lymphoma assay (San and Clarke 1999). Perchlorate gave negative results in all tests. Additional testing
does not seem necessary at this time.
Reproductive Toxicity. No data on reproductive effects of perchlorate in humans were located.
Earlier reproductive toxicity studies available for perchlorate in animals (Brown-Grant 1966; Brown-
Grant and Sherwood 1971) were of limited utility for assessing reproductive toxicity because they
included only brief exposure of females during gestation, limited investigation of reproductive end points,
and single dose levels. In a two-generation reproduction study, exposure of rats to up to 25.5 mg
perchlorate/kg/day did not affect any reproductive index (York et al. 2001b). In another study, exposure
of rats to up to 25.5 mg perchlorate/kg/day beginning 2 weeks before cohabitation with untreated males
and continuing during gestation did not result in any significant alterations in numbers of corpora lutea
and implantations, percent implantation loss, litter size, early or late resorptions, or sex ratio (York et al.
2005a). In addition, a 90-day drinking water in rats did not find gross or microscopic alterations in the
testes, prostate, epididymis, uterus, ovaries, or mammary glands (Siglin et al. 2000). That study also
reported no significant effects on sperm motility, concentration, count, or morphology. Further studies do
not appear to be necessary at this time.
Developmental Toxicity. There are several oral studies available that evaluated the effects of
perchlorate on thyroid parameters in human newborns (Amitai et al. 2007; Brechner et al. 2000; Crump et
al. 2000; Kelsh et al. 2003; Lamm and Doemland 1999; Li et al. 2000a, 2000b; Schwartz 2001; Téllez et
al. 2005). Crump et al. (2000) also examined the effects of perchlorate on thyroid function in school-age
children. For the most part, no significant alterations were reported, although Brechner et al. (2000) and
Schwartz (2001) reported an association between high levels of perchlorate in the drinking water and
elevated serum levels of TSH, but the methods used in the two latter studies have been criticized. The
neurodevelopmental progress of children presumed to have been exposed to perchlorate in utero could be
followed in longitudinal studies in search of possible long-term effects. Developmental toxicity studies
are available for perchlorate in animals (Bekkedal et al. 2000; Brown-Grant and Sherwood 1971; Golstein
et al. 1988; Lampe et al. 1967; Mahle et al. 2003; Postel 1957; York et al. 2001a, 2001b, 2003, 2004,
2005a, 2005b). Although the earlier studies were of limited utility because standard developmental
toxicity end points were not monitored and only single high dose levels were administered, the studies
conducted in the past few years have been able to establish dose-response relationships using relatively

142 PERCHLORATES
3. HEALTH EFFECTS
low exposure levels of perchlorate. Exposure of pregnant rats to perchlorate has resulted in thyroid
alterations in the pups at maternal doses as low as 0.009 mg/kg/day (York et al. 2003, 2005a). In addition
to evaluating thyroid effects in the offspring, some recent studies have conducted neurobehavioral testing
in the offspring at various ages and have also conducted histological and morphometric evaluations of
pups’ brains (Bekkedal et al. 2000; York et al. 2003, 2004, 2005b). However, these studies have not
evaluated known thyroid hormone-responsive end points in brain; for example, expression of genes that
are known to respond to thyroid hormone or maturation specific brain structures (i.e., Purkinje cells) that
respond to thyroid hormone (Porterfield and Hendrich 1993; Zoeller and Crofton 2000). Furthermore,
there is no evidence that the linear measures of specific brain areas that have been evaluated in animal
studies are responsive to changes in circulating levels of thyroid hormone. Studies directed at
characterizing the reaction of thyroid hormone responsive end points in brain to small changes in thyroid
hormone have not been conducted. NAS (2005) noted that studies of pregnant monkeys could provide
useful information on the effects of perchlorate on fetal and neonatal development. Continued research is
necessary to help improve our understanding of the potential mechanistic steps resulting in thyroid
hormone level changes from exposure to low levels of perchlorate and other environmental contaminants
such as thyocyanate and nitrate that can inhibit iodide uptake and potentially result in prenatal and
infant/early childhood effects. In addition, metabolic differences between perchlorate and other
goitrogens, such as nitrate and thiocyanate (availability in the body) need to be further explored.
Immunotoxicity. Immune system and lymphoreticular effects due to perchlorate have not been
systematically studied in healthy humans. Lymphoreticular effects were reported in one case series of
human thyrotoxicosis patients treated with potassium perchlorate (Morgans and Trotter 1960). Immune
effects in animals treated with very high doses of perchlorate (300–2,600 mg/kg/day) were reported as
increases in the number and degranulation of mast cells in the thyroid and other tissues (Logonder-
Mlinsek et al. 1985; Spreca and Musy 1974). More recent acute- and intermediate-duration studies
assessed indices of humoral- and cell-mediated immunocompetence in mice (0.1–50 mg/kg/day), but
there were deficiencies in the studies (BRT 2000; DOD 1999). It would be helpful if some other end
points were studied, such as the determination of whether perchlorate increases the sensitizing response to
other chemicals or whether perchlorate is a sensitizer itself.
Neurotoxicity. No data were located regarding neurological effects in humans or animals exposed to
perchlorate. Neither 14-day nor 90-day studies in animals observed any signs indicative of neurotoxicant
in adult animals. However, since thyroid hormone insufficiency is known to affect brain function in adult
humans, and perchlorate can produce decreased circulating levels of thyroid hormone, it is likely that

143 PERCHLORATES
3. HEALTH EFFECTS
perchlorate can, at some dose, impair brain function in adults. The dose-response relationship for these
effects has not been characterized. As mentioned above under Developmental Effects, some studies in
rats have suggested that exposure to perchlorate during pregnancy can cause neurodevelopmental
alterations in the offspring (York et al. 2004, 2005b). The biological significance of some of the
neurodevelopmental alterations, particularly the changes in thickness of the corpus callosum (York et al.
2004, 2005b), has been questioned (NAS 2005).
Epidemiological and Human Dosimetry Studies. Information on effects of exposure to
perchlorate in healthy humans is derived from occupational studies (Braverman et al. 2005; Gibbs et al.
1998; Lamm et al. 1999), studies of the general population, including adults, children, and neonates
(Brechner et al. 2000; Chang et al. 2003; Crump et al. 2000; Kelsh et al. 2003; Li et al. 2000a, 2000b,
2001; Schwartz 2001; Téllez et al. 2005) and controlled exposures in volunteers (Braverman et al. 2006;
Greer et al. 2002; Lawrence et al. 2000, 2001). All of these studies provide information on the effects of
perchlorate on thyroid parameters, but a few of them provide additional information on hematological,
hepatic, and renal effects. Although it is well known that the thyroid is the target organ for perchlorate,
the existing studies of the general population have had design limitations that preclude establishing with
confidence the levels of environmental exposure that may induce clinically significant alterations in
thyroid function and, therefore, represent a health risk. Well-designed epidemiological studies of
environmentally exposed populations could provide valuable information and decrease the uncertainty of
using data collected in acute studies in volunteers to establish long-term safe exposure levels. NAS
(2005) identified pregnant women, their fetuses, and newborns as populations at greatest risk of the
adverse effects of iodide deficiency and recommended that epidemiologic research should focus on
assessing possible health effects of perchlorate exposure in these populations. These studies should use
direct methods of exposure to perchlorate in individuals and methods more suitable for examining
potentially causal associations. NAS (2005) further suggested that future research could be organized
into additional analysis of existing data, new studies of health effects in selected populations, and
monitoring of the frequencies of specific conditions in communities affected by the continuing efforts to
reduce perchlorate in drinking water. Regarding a study in Chile (Téllez et al. 2005), NAS (2005)
recommended incorporating more extensive neurodevelopmental assessments of the children beginning in
infancy and continuing through school age. Specific end points that should be assessed in follow-up
studies include auditory function, including measures of otoacoustic emissions; visual attention; cognitive
function, including tests for executive function and memory; and tests of motor function, particularly
balance, coordination, and rapid finger movements (NAS 2005). Increasing the sample sizes of the birth
cohorts from the cities studied in Chile would be desirable to achieve appropriate statistical power for
144 PERCHLORATES
3. HEALTH EFFECTS
detecting possible differences among exposure groups on the developmental assessments. NAS (2005)
also suggested that the question of whether or not exposures to perchlorate at concentrations present in
municipal drinking water are related to an increased incidence of maternal hypothyroidism during
gestation could be addressed in the study of pregnant women in Chile (Téllez et al. 2005) and that using
larger samples would improve the precision of the estimates.
Biomarkers of Exposure and Effect.
Exposure. Potential biomarkers of exposure include perchlorate in urine, breast milk, iodide in blood and
urine, thyroid (T4, T3) and pituitary (TSH) hormones in blood, and radioactive iodine uptake.
Perchlorate in urine is a biomarker that is specific for exposure to perchlorate; however, the biomarkers
for iodine and thyroid hormones are not exclusive to perchlorate (changes may be produced by other anti
thyroid compounds and may be influenced by diet). One study of women from Chile found an
association between urinary levels of perchlorate and drinking water concentrations of perchlorate
(Valentín-Blasini et al. 2005). Further studies designed to correlate levels of one or more of these
potential biomarkers with exposure levels would be useful to facilitate medical surveillance that can lead
to early detection of exposure to perchlorate.
Effect. Biomarkers of effect for perchlorate also include levels of iodine in blood and urine, and thyroid
(T4, T3) and pituitary (TSH) hormones in blood. Dosimetry has not been established to relate specific
degrees of change in these markers to demonstrably adverse effects. Studies designed to perform this
dosimetry would be useful to determine whether exposed populations may be experiencing adverse health
effects due to perchlorate exposure.
Absorption, Distribution, Metabolism, and Excretion. Existing studies of absorption,
distribution, metabolism, and excretion of perchlorate in humans provide information about the extent of
absorption of ingested perchlorate and the extent and kinetics of urinary excretion of absorbed perchlorate
(Anbar et al. 1959; Durand 1938; Greer et al. 2002; Lawrence et al. 2000). These studies lend support to
estimates of elimination half-time of absorbed perchlorate of approximately 8–12 hours. Studies in
animals provide support for the above estimates as well as information about the tissue distribution and
kinetics of elimination of perchlorate from various tissues after intravenous or oral exposures (Chow and
Woodbury 1970; Chow et al. 1969; Clewell et al. 2003a, 2003b; Durand 1938; Fisher et al. 2000;
Goldman and Stanbury 1973; Lazarus et al. 1974; Selivanova et al. 1986; Yu et al. 2002). The above
information has been used to support the development of PBPK models of perchlorate in adult humans,
145 PERCHLORATES
3. HEALTH EFFECTS
adult rats, pregnant rats and rat fetus, and lactating rats and rat pups (Clewell et al. 2003a, 2003b, 2007;
Fisher et al. 2000; Merrill et al. 2003, 2005).
All of the above studies were by the oral or parenteral routes; no information is available regarding
absorption following inhalation or dermal exposure. Inhalation is a potential route of exposure for
perchlorate workers, but may not be relevant for the general population; however, dermal absorption is
expected to be negligible, but experimental information could confirm this expectation as dermal contact
with water is likely when water contains perchlorate.
Comparative Toxicokinetics. Existing studies in humans and rats provide comparative information
on the extent of absorption of ingested perchlorate, the routes of excretion of absorbed perchlorate, and
the kinetics of excretion of absorbed perchlorate. PBPK models have been developed for the adult human
and rat for the purpose of species extrapolation of oral or intravenous dosages of perchlorate (Clewell et
al. 2003a, 2003b, 2007; Merrill et al. 2003, 2005). However, further research is necessary to determine
how differences in thyroid physiology between humans and rats may affect the use of these models for
human risk characterization and risk assessment. NAS (2005) identified a number of issues as potential
data gaps with existing rat PBPK models including the need to: “(1) develop a more biologically-based
description of placental transfer of perchlorate and iodide in rats, (2) determine whether perchlorate is
transported by thyroid NIS if analytic methods of sufficient sensitivity can be developed or radiolabeled
perchlorate with high radiochemical purity can be synthesized, (3) modify the adult human model to
include the physiology of pregnancy and lactation to incorporate data from the recommended human
clinical studies (if they are conducted), and (4) modify models to incorporate dietary iodide measurements
from biomonitoring studies in pregnant or lactating women.” Issue (2) has been partially addressed by a
study that showed that the NIS actively transports perchlorate (Dohán et al. 2007). Issue (3) also has been
partially addressed by a recent study that described a model that is able to predict iodide and perchlorate
kinetics in the human from fetal life through adulthood, thus allowing the quantitative estimation of dose
in the target tissue, the developing thyroid (Clewell et al. 2007).
Methods of Reducing Toxic Effects. There are no established methods for reducing the toxic
effects of perchlorate. Removal of the individual from exposure would also be effective since perchlorate
is rapidly eliminated from the body (elimination half-time 8–12 hours) (Greer et al. 2002). Research into
methods for reducing the toxic effects of perchlorate would enable treatment for individuals experiencing
adverse health effects due to perchlorate exposure.
146 PERCHLORATES
3. HEALTH EFFECTS
Children’s Susceptibility. Data needs relating to both prenatal and childhood exposures, and
developmental effects expressed either prenatally or during childhood, are discussed in detail in the
Developmental Toxicity subsection above.
Children, infants, and the developing embryo and fetus may be especially susceptible to the thyroid
effects of perchlorate because thyroid hormones are essential to normal growth and development. The
embryo and fetus is dependent on maternal thyroid hormones prior to the onset of fetal thyroid hormone
production at mid-gestation. Perchlorate studies in animals have shown that exposure of the mother to
perchlorate during gestation, or even during lactation, can lead to reduced thyroid hormone levels and
associated thyroid effects in the offspring (Brown-Grant and Sherwood 1971; Golstein et al. 1988; Lampe
et al. 1967; Postel 1957; York et al. 2001b, 2003, 2004). Human models of pregnancy, maternal-fetal
transfer, and maternal-infant transfer of perchlorate have also been developed (Clewell et al. 2007, see
Section 3.4.5). These models have yielded predictions of external dose–internal dose relationships for
various human lifestages (Clewell et al. 2007; see Tables 3-6 and 3-7). The models predict a relatively
high vulnerability of the fetus, pregnant women, and lactating women to perchlorate-induced thyroid
iodine uptake, compared to other lifestages (e.g., greater inhibition of thyroid iodide uptake occurs in the
fetus in association with lower external doses). Further characterization of the toxicokinetics of
perchlorate during pregnancy and lactation as well as comparisons of neurobehavioral tests between
young animals exposed only in utero with animals exposed solely through lactation would provide
valuable information.
Child health data needs relating to exposure are discussed in Section 6.8.1, Identification of Data Needs:
Exposures of Children.
3.12.3 Ongoing Studies
The following ongoing research has been identified in the Federal Research in Progress database
(FEDRIP 2008).
Dr. J. Hershman from the Department of Veterans Affairs, Medical Center West Los Angeles, California,
has proposed research to test the hypothesis that increasing iodide intake will prevent the deleterious
effects of perchlorate on thyroid function; perchlorate does not alter thyroid cell growth; and perchlorate
does not impair neural development through a direct effect on the brain. The research is sponsored by the
Department of Veterans Affairs, Research and Development.
147 PERCHLORATES
3. HEALTH EFFECTS
Drs. J. Fisher, F. Duncan, and J. Wagner from the University of Georgia are conducting research to
develop biologically based pharmacokinetic (BBPK) maternal and fetal/neonatal models of the HPT axis
in the rat by conducting experimental and computational research. The BBPK models of the HPT will
describe the highly nonlinear relationships between the administered dose of thyroid active chemicals,
mode-of-action, specific perturbations in the HPT axis, and developmental neurotoxicity. The research is
sponsored by EPA’s National Center for Environmental Research.
Dr. T. Zoeller from the University of Massachusetts is conducting research to test the hypothesis that
thyroid hormone produces nonlinear, dose-dependent effects on end points within the developing brain,
heart, and liver and to determine if some end points are more sensitive than others to thyroid hormones.
Dr. Zoeller proposes that thyroid toxicants disrupting the HPT axis by different mechanisms will produce
different dose-response curves on these end points. Dr. Zoeller suggests that a principle mechanism
shaping the dose-response curve to thyroid hormone or by extension, thyroid disrupters, is a change in
tissue metabolism of thyroid hormone in response to perturbations in the HPT axis. The research is
sponsored by EPA’s National Center for Environmental Research.