3 Farming trends - Parliamentary Commissioner for … · his chapter looks at some recent farming...
23
31 P C E C H A P T E R 3 Farming trends
Transcript of 3 Farming trends - Parliamentary Commissioner for … · his chapter looks at some recent farming...

3131P C E
C H A P T E R 3 Farming trends

32G R O W I N G F O R G O O D
This chapter looks at some recent farming trends in New Zealand. It begins with a
broad overview and examines trends within each farming sector. It then investigates
the use of natural capital and takes a closer look at the state of the environment in
intensive farming areas. New Zealand does not currently have a well developed set of
indicators supported by comprehensive data in this area, so the trends identified in this
chapter are based on available sources of data.
3.1 Overview of farming today
New Zealand’s farming systems have developed through a significant modification of the
original land cover and indigenous biodiversity. Over the past century, the area of land
under pasture has increased from less than two million hectares to about 14 million
hectares. More than half of New Zealand’s land area is now classified as farmland.1 In
general, farming in this country has gone through a series of distinct phases, as
summarised below:2
Pre-1840s Exploitation of resources and early farming
• birds and seafood provided the first settlers to New Zealand with an abundant source
of food. Over time, hunting and harvesting depleted many of these sources.
• kumara gardening developed, particularly in the upper North Island.
• following the arrival of Europeans in New Zealand, native forests and populations of
marine animals were further exploited and depleted before more widespread farming
began.
1840s-1860s Extensive pastoralism
• animals were grazed on the grasslands of the East Coast of the North Island and
tussock grasslands of the South Island.
• natural limits to further production were reached by the 1870s.
1870s-1920s Expansion
• forests across much of New Zealand were cut and burned for farming.
• a wheat boom in the 1870s contributed to the rapid depletion of soils.
• the development of refrigeration in 1882, and expansion of the railway system,
enabled exports of meat, butter and cheese.
• a permanent grassland system began to evolve.
1920s-1940s Early intensification
• after World War I, farming settlements developed with varying success, often on
unsuitable land.
• soil science and fertiliser technologies developed, and improved grass species for
pasture began to be introduced.

333333P C E
1950s-1970s Diversification
• the development of suitable pasture species (such as
perennial ryegrass and clover) contributed to the ‘grasslands
revolution’. Affordable sources of phosphate fertilisers also
helped to lift soil fertility for grazing purposes.
• new mechanical and electrical technologies were introduced,
including tractors, shearing plants, electric fences, milking
sheds, milk tankers and planes for aerial topdressing.
• after World War II, about 90 percent of farm products were
exported to Britain.
• Britain joined the European Community in 1973 and New
Zealand’s status as ‘Britain’s other farm’ ended.
• new export products such as casein and milk powder were
developed as well as new markets in countries such as America, Japan and Korea.
• improved stock breeding techniques, such as artificial insemination, were developed,
as well as improved pest control methods.
• horticulture, deer and goat farming expanded rapidly in the 1970s.
• the role of producer boards was expanded.
• farm output roughly doubled between 1945 and 1970.
• the level of government support for farming increased significantly during the mid
1970s in response to falling agricultural prices.
1980s-today Further intensification, diversification and development ofcertification schemes
• amidst a period of massive change and upheaval in New Zealand society, the farming
sector was deregulated from 1985 onwards, with all farming subsidies removed.
Agricultural reforms encouraged farmers to aim for higher and higher levels of
productivity (see also Chapter 4).
• farmers responded to deregulation in various ways. Since the 1980s there has been
ongoing diversification into areas such as kiwifruit, forestry, viticulture and organics. As
the rest of this chapter will highlight, there has also been further intensification in
many farming sectors.
• the approaches taken toward intensification have differed significantly. In general, two
dominant trends have emerged. While some sectors have mostly relied on more
material and energy inputs to boost production volumes, others have focused on high
value production and quality through various certification schemes.
• the dairy industry in particular has expanded substantially, with growing demand for
dairy products as markets have globalised.

34G R O W I N G F O R G O O D
• new technologies are still being developed, including those from genetic sciences.
As this brief history suggests, farming has played a significant role in New Zealand’s
economy for over 100 years. Farming products, excluding forestry, earn more than 40
percent of New Zealand’s export income.3 Dairy and meat products are New Zealand’s
biggest single export earners. Overall, farming contributes approximately six percent of
gross domestic product (GDP) in New Zealand.4 If first-stage processing and manufacturing
of products from farms are taken into account, farming contributes about 17 percent.5
Thus, the importance of farming in New Zealand’s overall economy is substantial.
As noted in Section 1.1, there are approximately 70,000 farms in New Zealand today.6
More than half of New Zealand’s land area is used for farming, excluding forestry. Figure
3.1 illustrates the land area used by different types of farming in 2002. The dominant land
use for farming in New Zealand is sheep farming.
Figure 3.1 Land area distribution of different farming types in 2002(excluding forestry)*
Source: Statistics New Zealand, 2003a
*Viticulture is included within horticulture, as vineyards make up only about 0.13 percent of the total land
area farmed in New Zealand. The total area of land used for farming is approximately 14 million hectares.
Current farming systems in New Zealand vary according to climate, topography and soil
types, and the farming activities undertaken. Table 3.1 details the hectares farmed and
livestock numbers for the different farming sectors discussed in the report.
Sheep52%
Sheep and Beef7%
Beef16%
Dairy15%
Arable2%
Horticulture1%
Other5%
Deer2%

353535P C E
Table 3.1 Number of hectares farmed and livestock numbers by selectedsectors of New Zealand farming, 2002.
Sector Hectares farmed Livestock numbers
Sheep &10,348,291
39,545,609
Beef cattle 4,494,678
Dairying 2,048,211 5,161,589
Deer 341,447 1,643,938
Cropping 123,176 -
Vegetable growing 52,721 -
Pipfruit orchards 12,680 -
Kiwifruit 12,000 -
Grape growing 17,400 -
Source: Statistics New Zealand, 2003a
3.2 Trends in farming sectors
New Zealand does not currently have a well-developed set of indicators supported by
comprehensive data to thoroughly examine farming trends. The quality of information
varies. Detailed data is available in some areas, but in other cases gaps are present. Some
measurement systems have changed over time, making it difficult to develop a clear
picture of any consistent trends. Our assessments are therefore based on the best available
information. In some cases, regional data is used to illustrate a trend when national data is
unavailable.
Although it has not been possible to build a complete picture, we have been able to
identify the broad direction of trends within each farming sector. These trends are depicted
as:
The focus for each sector is on:
• scale – hectares farmed, stock numbers, etc.
• inputs – nitrogen fertiliser urea,7 irrigation8
• outputs – production volumes
• intensity – outputs relative to scale and inputs.
We begin with a brief overview of each farming sector and then examine trends from the
mid-1990s onward. The actual years of coverage vary according to the available data.
?u n c e r t a i n
s t e a d yd e c r e a s i n
g
i nc r
e a s i n g

36G R O W I N G F O R G O O D
3.2.1 Dairying
Overview
Dairying is the largest industry in New Zealand, accounting for 20 percent of export
income.9 New Zealand’s dairy products make up almost a third of internationally traded
dairy products.10 The vast majority of dairy herds (83 percent) are located in the North
Island.11 Most herds supply milk on a seasonal basis for manufacturing. Cows are milked in
spring, summer and autumn, but dried off in winter when pasture production is lower. The
remaining herds supply milk year-round for the domestic milk industry. The seasonal milk
production system has historically relied on highly productive, rotationally grazed pasture
and cow herds of high genetic merit.12 The warm climate and productive pastures of New
Zealand have enabled herds to graze on pasture year-round, avoiding the need for indoor
housing and expensive feed supplements that characterise some overseas systems.13
Trends
The dairy farming sector is clearly growing and becoming more intensive. Between 1994
and 2002, the number of dairy cows increased by 34 percent while the area of land
directly used for dairy farming increased by only 12 percent.14 Over this same period,
production of milksolids, on a per-hectare basis, increased by 34 percent, and milksolids
production per cow also increased.15 While the size of the average dairy herd has been
increasing, there has been a drop in the overall number of herds.16 This suggests a trend
toward amalgamation of farms and expansions by individual farmers.
The dominant trend in this sector is a move away from traditional pasture-based systems
toward systems that are highly dependent on inputs from outside the farm. A key feature
is the increasing use of feed supplements such as maize and cereal silage. Maize silage is
now the single biggest crop grown in the arable sector, with over a million tonnes
produced in the year to June 2002 (see also Section 3.2.6).17
The use of synthetic fertilisers based on fossil fuels on dairy farms is also increasing. Total
energy input into the average New Zealand dairy farm has doubled over the last 20 years,
mostly due to the increase in nitrogen fertiliser usage.18 Dairying is also expanding into
relatively dry regions such as Canterbury and Otago where significant irrigation is required
to enable intensive dairy farming.
Hectares farmed Dairy cow numbers Dairy cows per hectare
Up 12% Up 34% Up 19%
1994 – 2002 1994 – 2002 1994 – 2002
Source: Statistics New Zealand, 2003a
inc r
e a s i n g
inc r
e a s i n g
inc r
e a s i n g

373737P C E
Milksolids production Production volume Urea fertiliser use
volume per hectare per hectare
Up 50% Up 34% Up 162%
1994 – 2002 1994 – 2002 1996 – 2002
Source: Statistics New Zealand, 1996; Statistics New Zealand, 2003a; Livestock Improvement Corporation
Limited, 2003
3.2.2 Sheep and beef1919191919
Overview
The meat industry is one of New Zealand’s oldest industries. Over 90 percent of sheep
meat produced in New Zealand is exported, amounting to about 55 percent of the world’s
export trade.20 Eighty-three percent of beef production is exported, which makes up
around eight percent of world beef exports.21
There is a wide range of sheep and beef farm types and systems that vary according to
land type, topography, climate, scale, and farmer preference. Many farms have both sheep
and beef cattle, which complement each other in pasture-based grazing systems. Some
farms also run deer or cultivate arable crops. Traditionally, sheep and beef farms have run
on low input pasture grazing systems, sometimes supplemented with hay, silage and
fodder cropping.22
Trends
Sheep numbers nationally fell by 42 percent between 1980 and 2003.23 Sheep numbers
peaked in 1982 at 70.3 million.24 Beef cattle numbers also decreased, by 13 percent
between 1980 and 2003.25 Beef cattle numbers peaked in 1975 at 6.3 million.26 However
on intensive sheep and beef farms, beef cattle numbers have
risen between 44 percent and 77 percent in the same period.27
Stock units per hectare on intensive farms have declined, from
between 10.8 and 13.4 in 1981 to between 10.2 and 12.6 in
2002.28
Despite the decline in livestock numbers, national production
from sheep and beef farms has increased. Lambing rates
nationally have increased 25 percent between 1980 and 2003.29
Calving rates have remained relatively stable.30 The most
significant change has been the increase in livestock weights.
The export carcass weight of lamb has increased 25 percent
between 1980 and 2003. Similarly, mutton carcass weight has
increased 18 percent and beef carcass weight has increased by
13 percent.31 Thus the increase in production in the sheep and
beef sector has not been achieved through increased stocking
inc r
e a s i n g
inc r
e a s i n g
inc r
e a s i n g

38G R O W I N G F O R G O O D
rates, but rather through increased lambing rates and livestock weights. Both improved
lambing rates and livestock weights are partly a result of improved animal nutrition, which
is largely due to an increase in fertiliser use by these sectors.32
Fertiliser use in the sheep and beef sector generally has increased. Although fertiliser use
per hectare is far below that of the dairy sector or some horticultural sectors, the sheep
and beef sector covers a far larger land area. There has been an increase in fertiliser use in
the intensive sheep and beef sector of between 24 and 28 percent between 1991 and
2002.33 In the 2001-2002 year on North Island Hill farms an average of 309 kilograms per
hectare of fertiliser was applied to pasture; on North Island Intensive Finishing farms, 352
kilograms per hectare; and on South Island Intensive Finishing farms 345 kilograms per
hectare was applied.34 The amount of nitrogen contained in the fertilisers used on
intensive sheep and beef farms has also increased. For example between 1991 and 2002
on North Island Intensive Finishing farms the percent of nitrogen in the fertiliser applied to
pasture increased from 1.3 percent to 4.2 percent.35
Hectares farmed: Sheep numbers on Beef cattle Stock per hectare
intensive farms intensive farms numbers on on intensive farms
intensive farms
Down 7% Down 20% on Up between Down between
1981 – 2002 North Island farms 44-77% 5-20%
and up 28% on 1981 – 2002 1981 – 2002
South Island farms
1981 – 2002
Source: MWES, 1982; MWES, 2003a; MWES, 2004
Lambing rates on Fertiliser use on Fertiliser use per
intensive farms intensive farms36 hectare on
intensive farms37
Up between 11-19% Up between 168-263% Up between 24-28%
1981 – 2002 1991 – 2002 1991 – 2002
Source: MWES, 1982; MWES, 1992; MWES, 2003a
3.2.3 Deer
Overview
The New Zealand farmed deer industry began over 25 years ago, providing venison, velvet
and other products for export. New Zealand is the world’s largest producer and exporter of
d e c r e a s i ng
i nc r
e a s i n g?u n c e r t a i n
d e c r e a s i ng
i nc r
e a s i n g
inc r
e a s i n g
inc r
e a s i n g

393939P C E
farmed venison, 90 percent of which goes to Europe.38 Deer are
frequently run as a secondary enterprise in conjunction with
other pastoral livestock, but there are nearly 2,000 farms where
they provide over 50 percent of revenue.39 These specialist farms
carry 63 percent of all deer.40 Deer are farmed in all regions of
New Zealand, but are most common in Canterbury, the Bay of
Plenty and Southland. Most deer graze on pasture, but
supplementary feeds in winter may include silage, hay or grain.41
Trends
The number of hectares farmed, deer numbers, and the
production volume of venison have all increased in recent years.
Deer per hectare and production of venison per hectare vary from
year to year, due in part to world prices. If prices are low farmers
may keep their stock from slaughter until the following year,
when prices hopefully improve. Urea fertiliser usage has also
increased significantly in this sector.
Hectares farmed Deer numbers Production Urea fertiliser
of venison use per hectare
Up 60% Up 34% Up 38% Up 244%
1994 – 2002 1994 – 2002 1994 – 2002 1996 – 2002
Source: Statistics New Zealand, 1996; Statistics New Zealand, 2003a
3.2.4 Horticulture
Overview
Fruit growing accounts for about 40 percent of horticultural land use in New Zealand, with
vegetable growing accounting for the remainder.42 Key fruit crops include kiwifruit and
apples. Major vegetable crops include potatoes, onions, peas and beans, squash and sweet
corn. Avocados, capsicums and carrots are emerging export earners.
Crops, orchards and market gardens are generally classified as intensive forms of land use,
requiring high inputs of fertilisers, mechanical energy, labour, pesticides and herbicides.43
Crop volumes produced can vary greatly from year to year due to factors beyond the
control of growers, such as climate (e.g. frost and hail), pests, and levels of pollination.
Trends
The overall size of the horticulture sector, in terms of hectares farmed, is gradually
increasing—up six percent between 1994 and 2002.44 Horticultural exports have increased
phenomenally in the last 25 years (see Figure 3.2). Trends vary according to crop.
For example, between 1994 and 2002 the change in hectares farmed for the following
inc r
e a s i n g
inc r
e a s i n g
inc r
e a s i n g
inc r
e a s i n g

40G R O W I N G F O R G O O D
crops were:
• apples – decreased by 24 percent
• kiwifruit – increased by 2 percent
• onions and potatoes – both increased by 12 percent
• squash – decreased by 12 percent
• avocadoes – increased by 121 percent.45
The area of land under irrigation for horticultural use has
increased markedly, from 26,623 hectares in 1985 to 79,692
hectares in 2002, including viticulture.46 The intensity of nitrogen
fertiliser use differs according to horticultural crop. For example,
the vegetable sector applied an average of 167 kilograms of urea
per hectare in 2002, whilst the kiwifruit sector applied 75 kg/ha,
and the pipfruit sector applied 43 kg/ha.47 Between 1996 and
2002, urea application per hectare increased by 49 percent in the
kiwifruit sector and 3 percent in the pipfruit sector.48
Unfortunately, 1994 urea figures were unavailable for the
vegetable sector, so no comparison between years can be made.
However, available figures for another nitrogen fertiliser,
diammonium phosphate (DAP) between 1996 and 2002 show
that there was a 150 percent increase in DAP application per
hectare by this sector.49
Figure 3.2 Horticultural exports from New Zealand 1965 to 2002 ($million,free on board).
Source: HortResearch, 2002
Fresh fruit
0
500
1000
1500
2000
2500
1965 1975 1985 1995 2000 2002
WineFlowers, seeds and plantsProcessed vegetables
Fresh vegetables
Processed fruit
Year
$ m
illio
n, f
ree
on
bo
ard

414141P C E
The broad trend in horticulture is toward environmental management systems that reduce
pesticide use, though the picture varies according to crop type.
Hectares farmed Land under irrigation DAP fertiliser use
per hectare
Up 6% Up 199% Up 150%
1994 – 2002 (including viticulture) in the vegetable sector
1985 – 2002 1996 – 2002
Source: Statistics New Zealand, 1996; Statistics New Zealand, 2003a; Lincoln Environmental, 2000c
3.2.5 Viticulture
Overview
Although vineyards only make up a small proportion of farming land in New Zealand, the
wine industry has grown dramatically over the last two decades. Wineries are now found
in ten out of 12 New Zealand regions. The three largest wine grape production areas are
Marlborough, Hawke’s Bay and Gisborne. New Zealand is a niche producer of quality
wines, making up less than 0.5 percent of global wine production.50 Average selling prices
in major export markets are high by international standards. Most New Zealand wineries
are small. Only 10 wineries produce more than 2 million litres of wine per year, 35 wineries
produce between 200,000 and 2 million litres of wine and the remaining 376 produce less
than 200,000 litres.51
Trends
There were 421 wineries in New Zealand in 2003, compared with 190 in 1994.52 The area
of land planted in wine grapes grew by 142 percent between 1994 and 2002.53 Much of
this recent planting is just starting to come into production. Irrigated viticultural land has
increased in the last 20 years, and is now more than 12,000 hectares (see Figure 3.3 –
viticulture is included within horticulture data on the graph).54
Hectares farmed Production: tonnes
of wine grapes
Up 142% Up 66%
1994 – 2002 1990 – 2002
Source: Statistics New Zealand, 2003a; http://www.nzwine.com/statistics
inc r
e a s i n g
inc r
e a s i n g
inc r
e a s i n g
inc r
e a s i n g
inc r
e a s i n g

42G R O W I N G F O R G O O D
3.2.6 Arable crops
Overview
The arable industry produces milling, malting and feed grains, including wheat, barley,
maize, oats and peas. New Zealand is a relatively small player in world grain production
terms with less than 0.5 percent of world production.55 The industry is located primarily in
Canterbury, which produces 80 percent of the total crop, but production is also significant
in Southland, Otago, Manawatu, Hawke’s Bay and the Waikato.56 Arable farms usually run
a variable but significant number of livestock as well, including sheep, beef cattle, dairy
cattle or deer.
Trends
The overall size of the arable sector is shrinking, and is becoming increasingly focused on
producing silage for the dairy industry. Maize silage is now the single largest crop.57 While
arable land under irrigation has decreased, urea application on a per hectare basis by the
arable sector has increased.58
Hectares farmed Land under irrigation Urea fertiliser use
per hectare
Down 37% Down 43% Up 110%
1994 – 2002 1985 – 2002 1996 – 2002
Source: Statistics New Zealand, 1996; Statistics New Zealand, 2003a; Lincoln Environmental 2000c
3.3 Trends in the use of inputs
This section examines some key inputs to farming in New Zealand. It looks at recent trends
in water use for irrigation as well as nutrient/fertiliser inputs and energy use. The trends
identified are based on available data and research.
3.3.1 Water for irrigation
The area of irrigated land in New Zealand has been increasing at a rate of about 55
percent each decade since 1965 (see Figure 3.3). Water abstraction from irrigation
schemes is also increasing steadily. Most of New Zealand’s irrigated land (70 percent) is
located in the Canterbury region, and it is here that irrigation pressures are most obvious.59
Water is an increasingly critical component of New Zealand’s rural economy. The move to
more intensive farming systems is usually accompanied by a demand for increased quantity
and reliability in water supply. Irrigation undoubtedly supports farming, water being the
key to plant growth and hence farm productivity. However, irrigation can also contribute to
the development of farming systems that require higher inputs of fertiliser and energy as
well as water. For example, irrigated dairy farms use nearly double the electricity of non-
irrigated dairy farms (30.6 gigajoules per hectare compared to 16.9).60 Similarly, nitrogen
d e c r e a s i ng
d e c r e a s i ng
i nc r
e a s i n g

434343P C E
fertiliser use is much greater on dairy farms with irrigation (135 kilograms of nitrogen per
hectare compared to 68 on non-irrigated dairy farms).61 Chapter 5 looks at irrigation issues
in much more detail.
Land under irrigation Water abstraction
Increasing at a rate of Increasing for both
around 55% nationally surface and groundwater
each decade abstraction in the
Canterbury region
Source: Lincoln Environmental 2000c; Statistics New Zealand, 2003a
Figure 3.3 Hectares under irrigation in New Zealand
Source: Lincoln Environmental 2000c; Statistics New Zealand, 2003a
3.3.2 Nutrients and fertilisers
Synthetic fertiliser usage across most farming sectors has increased significantly in New
Zealand in recent years.62 In particular, use of nitrogen fertiliser in New Zealand has soared,
as has the proportion of total fertiliser being applied as nitrogen. This trend highlights a
new technology that has moved from being innovative in the early 1990s to mainstream
and widely adopted in 2001. The intensity of nitrogen fertiliser use, that is, the amount of
fertiliser applied per hectare in New Zealand also increased in most sectors. For example,
the intensity of urea use increased by 670 percent in the sheep and beef sector and by 160
percent in the dairy sector between 1996 and 2002.63 Although there has been a huge
increase in urea use by the sheep and beef sector, per hectare use is still far below that of
the dairy sector or some horticultural sectors.
inc r
e a s i n g
inc r
e a s i n g
500
450
400
350
300
250
200
150
100
50
0
Hec
tare
s (’0
00s)
1965 1985 2002
Arable
Pasture
Horticulture
Year

44G R O W I N G F O R G O O D
In general, New Zealand is moving away from systems that use natural processes for
providing nitrogen in soil (e.g. nitrogen-fixing clover in pasture) to a greater reliance on
synthetic substitutes. Chapter 5 looks at nutrients and fertilisers in more detail and
considers the risks and challenges associated with current trends.
Synthetic fertiliser Nitrogen fertiliser:
consumption urea consumption
Up 21% Up 160%
1996 – 2002 1996 – 2002
Source: Statistics New Zealand, 1996; Statistics New Zealand, 2003a
3.3.3 Energy
The energy required to produce a good or service is called direct energy, while indirectenergy is the energy embodied in products that are consumed in producing the good or
service. Overall, the amount of direct energy used by the farming sector increased by
about 30 percent between 1992 and 2002.64 More recently, direct energy use has
increased in some farming sectors and decreased in others. For example, dairy farming
used about one percent less direct energy in 2002 than it did in 1996, despite increased
production during the period.65
However, these figures do not account for all of the energy used in farming. Energy is used
indirectly in the manufacture of farm inputs such as fertiliser and machinery. Given the
significant increases in the use of fossil fuel derived fertilisers over recent years, New
Zealand farmers are generally using much more energy to grow food on their farms.
Direct energy use Indirect energy use
Increasing gradually, but Growing significantly
generally by less than the due to increasing use of
increase in economic activity fossil-fuel based
fertilisers
Source: EECA, 2003; Statistics New Zealand, 2003a
inc r
e a s i n g
inc r
e a s i n g
inc r
e a s i n g
inc r
e a s i n g
New Zealand ismoving awayfrom systemsthat use naturalprocesses forprovidingnitrogen in soilto a greaterreliance onsyntheticsubstitutes.

454545P C E
3.4 Trends in the state of natural capital
This section looks at the state of natural capital in intensive farming areas, based on
available data and research. The primary focus is on water, although trends for soil and
atmosphere are also discussed.
3.4.1 Water
Water quality in areas of intensive pastoral farming is poor relative to the Ministry for the
Environment microbiological water quality guidelines and Australian and New Zealand
Environment Conservation Council (ANZECC) water quality guidelines—a fact known for
many years.66 Water quality declines markedly in lowland streams and rivers in pasture-
dominated catchments. Many rivers draining farmland are unsuitable for swimming
because of faecal contamination from farm animals, poor water clarity, and nuisance algal
growths caused by excess nutrients. Furthermore, groundwater quality in aquifers that
exist under pastoral farming areas, in particular dairying areas, tend to have elevated
nitrate concentrations sometimes exceeding drinking water standards.67
Surface water quality Groundwater quality
Most rivers in farming Although the state of
areas, particularly in groundwater quality is not
lowlands, generally fail known comprehensively
to meet recommended at a national level, many
guidelines as a result of shallow aquifers beneath
contamination from dairying or horticultural
increased nutrients, land have elevated
turbidity and animal faecal nitrate levels.
matter.
In those regions with intensive farming systems, such as Waikato and Canterbury, where
data has been gathered, declining water quality has been confirmed in some areas.
Chapter 5 looks at these issues in more detail. More detailed information on trends and
issues relating to water in the Canterbury, Hawke’s Bay, Southland and Waikato regions
follows.
d e c r e a s i ng
?u n c e r t a i n

46G R O W I N G F O R G O O D
Water trends in the Canterbury Region
Water allocation and abstraction Water quantity
Surface water Groundwater Surface water Groundwater
Surface water quality Groundwater quality
Microbiological Inorganic Microbiological Inorganic
Future demand Regulatory framework
Proposed irrigation schemes
?u n c e r t a i n
?u n c e r t a i n
?u n c e r t a i n
d e c r e a s i ng
i nc r
e a s i n g
inc r
e a s i n g ?u n c e r t a i n
?u n c e r t a i n
The volume of surfacewater allocated forabstraction doubledbetween 1985 and2001. There is aconcern that somerivers are currently overallocated.
Regional groundwaterallocation increased by50 percent between1996 and 2001.
Average surface waterflows were almost allbelow their long-termmeans. ECan attributesthis trend primarily toclimatic conditions, withincreases in surface waterabstraction having a minoreffect.
In some areas themagnitude of annualgroundwater levelvariations hasincreased in responseto growinggroundwaterabstraction.
In 2000-2001, 28% ofsites tested formicrobiological waterquality were in ‘alert’mode, 10% in ‘action’mode and 62% wereconsideredacceptable.
Concentrations ofnutrients in the mainrivers are considered tobe low but theyincrease downstreamand are worst closest tothe coast.
Nitrate concentrations areabove drinking waterstandards in localisedareas, but elevatedconcentrations arewidespread over someareas, and there areindications thatconcentrations areincreasing.
Microbialcontaminants arefound inapproximately 10-15percent ofgroundwater samplesabstracted fromwells.
i nc r
e a s i n g
Proposed schemes include:• Central Plains water enhancement scheme
(84,000 ha)• Rangitata South irrigation scheme (20,000 ha)• Barhill Chertsey irrigation scheme (40,000 ha)• South Canterbury augmentation and irrigation
development (Aoraki) (30,000 ha).
Environment Canterbury notified its ProposedNatural Resource Regional Plan for publicsubmissions on 3 July 2004. Chapter 4 of theplan deals with water quality; Chapter 5 dealswith water quantity; Chapter 6 deals with bedsand margins of rivers and lakes; and Chapter 7deals with wetlands.
Source: Environment Canterbury, 2002a; Environment Canterbury, 2004; Lincoln Environmental, 2002

474747P C E
d e c r e a s i ng
s t e a d y
Water trends in the Hawke’s Bay Region
Water allocation and abstraction Water quantity
Surface water Groundwater Surface water Groundwater
Surface water quality Groundwater quality
Microbiological Inorganic Microbiological Inorganic
Future demand Regulatory framework
Proposed irrigation schemes
?u n c e r t a i n
?u n c e r t a i n
?u n c e r t a i n
d e c r e a s i ng
i nc r
e a s i n g
inc r
e a s i n g
inc r
e a s i n g
20% decrease in numberof surface water consents,but 65% increase innumber of hectaresirrigated between 1995and 2003. Although morewater has been allocated,it is used over morehectares. This suggests anoverall increase inefficiency.
9% increase in thenumber ofgroundwaterconsents grantedbetween 1996 and2003, 89% of whichhave been forirrigation.
Hawke’s Bay rivers areextremely variable. Up to40 years of flow recordsand 100 years of rainfallrecords show no significanttrends at either regional orsub-regional level. Thevariability in river flows isattributable to variability inclimate patterns ratherthan increasing use, orclimate-driven changes intrends.
Generally sufficient tomeet irrigation anddomestic demands.However in some localisedareas pressure on theresource may occur. Waterlevels in 51% ofmonitored wells aredeclining by less than 1metre/10 years. 11% ofwells are declining bybetween 1 and 2 metres/10 years. Water levels in17% of wells areincreasing.
Microbiological waterquality across the regionis generally good andcompares favourably withRiver EnvironmentClassification standards.Data suggests that waterquality in the region isdecreasing over time.However, HBRC attributesthis primarily to flowlevels rather than human-induced changes.
Inorganic water qualityacross the region isgenerally good, althoughthere are some areas withelevated nitrate-nitrogenconcentrations.Data suggests that waterquality in the region isdecreasing over time,however, HBRC attributesthis primarily to flow levelsrather than human-induced changes.
Currently water inmonitored wells isgenerally good acrossthe region. Only one ofthe monitored wellsexceeded the drinkingwater standards forfaecal coliforms.No trend formicrobiologicaldeterminants
Currently water in a number ofmonitored wells exceedsdrinking water standards.Median manganeseconcentrations exceed healthstandards at 7 wells (of 48monitored). Aestheticmanganese and iron standardsare commonly exceeded acrossHawke’s Bay. Generally therehave been increasing trends inpH, ammoniacal nitrogen,nitrate, manganese, iron,chloride and soluble reactivephosphorus in wells.
There is interest in developing irrigation schemesbut no firm proposals. Individual users areincreasingly aware of the greater certaintyprovided by groundwater
• Proposed Regional ResourceManagement Plan 1998 sets capon amount of surface water forirrigation
• Minimum flow set for all streamsand rivers
• Plan provides for what exists butdoes not provide for futuredemands, pressures anduncertainties.
Source: Hawke’s Bay Regional Council; Hawke’s Bay Regional Council, 2004
48G R O W I N G F O R G O O D
s t e a d y
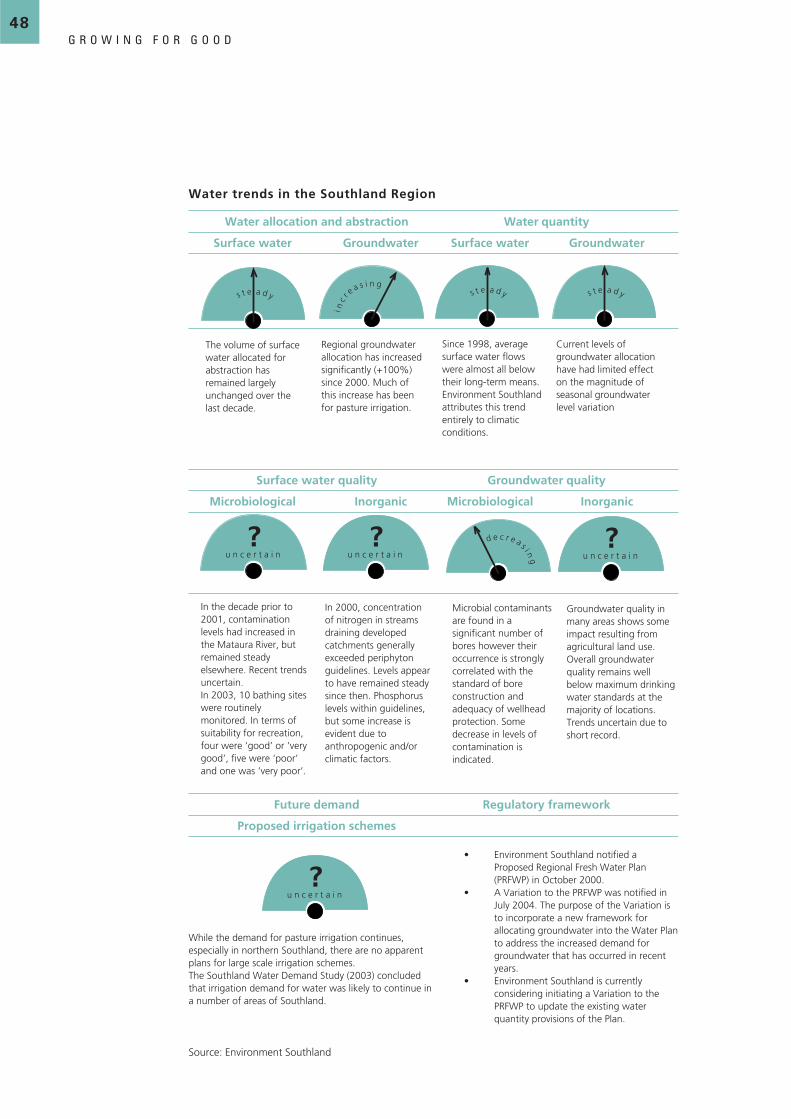
Water trends in the Southland Region
Water allocation and abstraction Water quantity
Surface water Groundwater Surface water Groundwater
Surface water quality Groundwater quality
Microbiological Inorganic Microbiological Inorganic
Future demand Regulatory framework
Proposed irrigation schemes
?u n c e r t a i n
?u n c e r t a i n
?u n c e r t a i n
d e c r e a s i ng
i nc r
e a s i n gs t e a d y s t e a d y
?u n c e r t a i n
The volume of surfacewater allocated forabstraction hasremained largelyunchanged over thelast decade.
In the decade prior to2001, contaminationlevels had increased inthe Mataura River, butremained steadyelsewhere. Recent trendsuncertain.In 2003, 10 bathing siteswere routinelymonitored. In terms ofsuitability for recreation,four were ‘good’ or ‘verygood’, five were ‘poor’and one was ‘very poor’.
While the demand for pasture irrigation continues,especially in northern Southland, there are no apparentplans for large scale irrigation schemes.The Southland Water Demand Study (2003) concludedthat irrigation demand for water was likely to continue ina number of areas of Southland.
• Environment Southland notified aProposed Regional Fresh Water Plan(PRFWP) in October 2000.
• A Variation to the PRFWP was notified inJuly 2004. The purpose of the Variation isto incorporate a new framework forallocating groundwater into the Water Planto address the increased demand forgroundwater that has occurred in recentyears.
• Environment Southland is currentlyconsidering initiating a Variation to thePRFWP to update the existing waterquantity provisions of the Plan.
Regional groundwaterallocation has increasedsignificantly (+100%)since 2000. Much ofthis increase has beenfor pasture irrigation.
Since 1998, averagesurface water flowswere almost all belowtheir long-term means.Environment Southlandattributes this trendentirely to climaticconditions.
Current levels ofgroundwater allocationhave had limited effecton the magnitude ofseasonal groundwaterlevel variation
In 2000, concentrationof nitrogen in streamsdraining developedcatchments generallyexceeded periphytonguidelines. Levels appearto have remained steadysince then. Phosphoruslevels within guidelines,but some increase isevident due toanthropogenic and/orclimatic factors.
Microbial contaminantsare found in asignificant number ofbores however theiroccurrence is stronglycorrelated with thestandard of boreconstruction andadequacy of wellheadprotection. Somedecrease in levels ofcontamination isindicated.
Groundwater quality inmany areas shows someimpact resulting fromagricultural land use.Overall groundwaterquality remains wellbelow maximum drinkingwater standards at themajority of locations.Trends uncertain due toshort record.
Source: Environment Southland

494949P C E
Water trends in the Waikato Region
Water allocation and abstraction Water quantity
Surface water Groundwater Surface water Groundwater
Surface water quality Groundwater quality
Microbiological Inorganic Microbiological Inorganic
?u n c e r t a i n
d e c r e a s i ng
i nc r
e a s i n g
inc r
e a s i n g ?u n c e r t a i n
?u n c e r t a i n
d e c r e a s i ng
d e c r e a s i ng
In 2002, 560,000 m3/dayof surface water wasallocated forconsumptive use such asirrigation and watersupply.Many waterways in theregion are reaching theirallocation limits. Muchof the recent pressurehas come from irrigationtakes.
In 2002 there were339 consents to takegroundwateramounting to 547,000m3/day. 39% of theconsents were forirrigation. However thisamounted to only 9%of the groundwaterallocated.There has been a 61%increase in amount ofgroundwater allocatedbetween 1987 and2002.
Changes in dischargeare generally related toclimate influences. Thereis natural variation fromyear to year in the rangeof plus or minus 40% ofthe long-term averagedischarge. The allocationlimits in the RegionalPlan limit the depletioneffects due to surfacewater takes.
Most areas in the Waikatoregion have low stressfrom groundwaterabstraction, with less than10% of availablegroundwater being used.Thirteen areas are underhigh pressure, with morethan 30% of availablegroundwater being used.
Water quality for contactrecreation in rivers isgenerally good in theUpper Waikato River andin rivers and streams inthe Taupo andCoromandel areas. It ispoorer in areas whereland use is moreintensive.A 2002 study found thatmedian E. coliconcentrations in 53 of73 stream and river sitessampled in the region,exceeded the guidelinefor freshwaterrecreation.3 of 69 sites monitoredacross the region hadincreases in E. coliconcentrations between1998 and 2002. 62 sitesshowed no significanttrends.
Water quality forecological health isgenerally good acrossthe region, however it ispoorer in intensivelyfarmed areas.More than 90% ofstreams in intensivelyfarmed catchments inthe region havemoderate to high levelsof nitrogen.Across the region aswhole, monitoringbetween 1987 and 2002indicates a generaldecline in water quality(increased total nitrogen,total phosphorus,decreased dissolvedoxygen and pH).
Localised microbialcontamination ofgroundwater is aproblem in some coastalareas, due to septictanks.At present there is littleinformation aboutmicrobial contaminationof rural groundwater,however a study of 40wells in Matangi foundthat 12.5% werecontaminated withfaecal coliforms.
Nitrate contaminationlevels in groundwatercommonly exceed drinkingwater guidelines.Nitrate concentrations areincreasing in many areas.Pesticide residues atgenerally low levels havebeen detected in areas offrequent use. Theycommonly relate tohistoric practices.

50G R O W I N G F O R G O O D
s t e a d y
Future demand Regulatory framework
Proposed irrigation schemes
There are currently no proposed irrigation schemes.Future demand will come from individual takes andnot from irrigation schemes.
• Proposed Waikato Regional Plan is the mainplanning framework for managing waterresources in the Waikato Region.
• Environment Waikato proposes to address non-point source discharges through a combination ofeducation and encouragement and conditions onpermitted activities, to gradually change identifiedinappropriate farming practice. More stringentconditions and standards may be used inregulatory methods in the future if noimprovement in water quality is detected.
• The Clean Streams project aims to encourage andsupport farmer efforts to reduce the impacts offarming on waterways. Advice and financialsupport of up to 35 percent of farmers’ costs forfencing and planting waterway margins isavailable. The project runs for 10 years and EWhas committed up to $10 million.
• The Protecting Lake Taupo Project proposesregulatory control of non-point source dischargesto the lake supported by education, advice,research on low nitrogen farm systems and landuse and public funds to reduce nitrogendischarges to the lake.
NB: Environment Waikato measures water quality for contact recreation by assessing water clarity and E.coli levelsin rivers and streams. It measures water quality for ecological health by assessing dissolved oxygen, pH, turbidity,ammonia, temperature, nitrogen and phosphorus levels in rivers and streams.
Source: Environment Waikato
3.4.2 Soil
New Zealand loses between 200 and 300 million tonnes of soil to the oceans every year.68
This rate is about 10 times faster than the rest of the world, and accounts for between 1.1
and 1.7 percent of the world’s total soil loss to the oceans, despite a land area of only 0.1
percent of the world’s total.69
Soil erosion is thus a significant issue across much of agricultural New Zealand – from
extensive hill country grazing to more intensive types of farming such as horticulture.70 This
is partly because of the mountainous terrain and maritime climate. However, soil erosion
can also be accelerated by land clearance and unsuitable land management practices (e.g.
grazing on steep slopes, over-stocking). Farmed land in New Zealand has an average of
only 15 centimetres of topsoil.71 Moderate to slight erosion affects over half of the country,
and almost 10 percent of the country has severe to extreme erosion.72 The 1997 State of
New Zealand’s Environment report concluded that about 30 percent of New Zealand is
able to sustain pastoral farming without significant erosion problems, and a further 28
percent can support limited livestock grazing provided it was accompanied by erosion
management measures.73
The annual economic cost to New Zealand of soil erosion and sedimentation was
conservatively estimated at $127 million in 1998.74 However, it is unclear how much of this
soil erosion can be attributed to farming given New Zealand’s high background erosion
rates reflecting tectonism and steep topography.

515151P C E
The loss of this precious, non-renewable resource is a major issue, and so too is the
downstream effect that sediment has on waterways and estuaries. Sediment from farming
activities can enter waterways and harm aquatic ecosystems by reducing light penetration
and visual clarity, and by sedimentation. Chapter 5 discusses the effects of soil erosion on
water quality and aquatic ecosystems in more detail.
3.4.3 Atmosphere
Certain gases present in the atmosphere trap heat from the sun and help to maintain the
Earth’s climate. This natural phenomenon is called the greenhouse effect. In the past 50 to
100 years, atmospheric concentrations of certain greenhouse gases such as carbon dioxide
(CO2), methane (CH4) and nitrous oxide (N2O) have been rising at an increasing rate. This is
contributing to global warming, which is also affecting weather patterns and climatic
conditions (i.e. it is leading to climate change).
In New Zealand, the farming sector contributes over half of the country’s greenhouse gas
emissions, compared to an average share of less than ten percent in other countries.75 The
main greenhouse gases emitted through farming are methane and nitrous oxide. Nearly all
of New Zealand’s methane emissions originate from the belching of ruminant animals
(cattle, sheep, deer and goats).76 Ruminants produce methane in their rumen
(forestomach) as a by-product of digestion. Nitrous oxide emissions are produced by soil
bacteria. The major source of nitrogen for these processes is animal waste (urine and
dung). Nitrous oxide emissions are also associated with the use of nitrogen-based
fertilisers.
The farming sector is responsible for around 90 percent of New Zealand’s methane
emissions and more than 90 percent of nitrous oxide emissions.77 These two greenhouse
gases are both more potent in terms of their global warming effect than carbon dioxide
(methane is 21 times more potent and nitrous oxide 310 times).78
According to the latest estimates, greenhouse emissions from New Zealand’s farming
sector are currently about 15 percent above 1990 levels.79 The most significant changes
have been in the dairy sector, where methane emissions have increased by 65 percent
since 1990 due to the increase in stock numbers.80
Greenhouse gases
Up over 15%
1990 – 2002
Source: New Zealand Climate Change Office, 2004a
inc r
e a s i n g

52G R O W I N G F O R G O O D
3.5 Other trends
3.5.1 Social trends
Although the primary focus of this report is on natural capital, it is also important to
consider some social trends in rural areas of New Zealand. There have been some
substantial social shifts across rural New Zealand in recent decades. As a Ministry of
Agriculture and Forestry report has commented:
Until recently, at least, most rural communities have functioned asclose-knit groups, frequently focused around the activities of sportingclubs, churches, schools and pubs. Today, the characteristics of manyrural communities have changed. Rural depopulation and a drop intraditional employment opportunities have resulted in a decline in theimportance of the agricultural population relative to other ruralresidents...These changes have occurred in combination with theclosure of many rural churches, schools, banks and other traditionalfacilities. Together these changes have had a fundamental effect oncommunity dynamics.81
Some recent trends include:
• schools — rural schools often play a major role in holding the fabric of rural
communities together. Many schools in rural areas are currently under threat of
closure.82
• health services — there are ongoing challenges to recruit and retain health
professionals and to maintain high quality health services in rural areas.83
• population — both depopulation and repopulation have occurred in rural areas over
time. The rural population has decreased by about 12 percent over the last 50 years,
but is now growing gradually (albeit much more slowly than the urban population).84 It
is often difficult to retain younger people in particular in rural areas.85
• employment — employment opportunities in rural communities often fluctuate, but
there has been a general increase in employment in the farming sector in recent years.
However, there have also been significant labour and skill shortages in this sector,
sometimes co-existing with substantial levels of local unemployment.86
3.5.2 Human capital trends
The Ministry of Agriculture and Forestry commissioned a report in 2000 to examine
student numbers in farming fields of study and to compare skill and knowledge
requirements in the farming sector with the education opportunities available. The
resulting report found that enrolments in farming and forestry courses declined overall
during the 1990s — especially in universities. 87 If this trend continues, the development of
human capital in the farming sector may be impeded.

535353P C E
3.5.3 Science and research trends
During interviews for this investigation, we found deep concerns about aspects of the
contribution that science is making to the future of farming in New Zealand. For many
farmers, processors, councils, investors and science teams, the concern is not so much
about what is being done, which is generally regarded very highly. The concern is more
about what is not being done and how what is being done is being communicated and
implemented.
We conducted a review of Foundation for Research Science and Technology (FRST),
Ministry of Agriculture (MAF), Marsden Fund and Ministry for the Environment (MfE)
funding and research. Our initial analysis suggests that there is significantly less research
into the natural resources necessary for farming (such as water and soil) than research into
the manipulation of natural resources for farming and into farm management practices to
improve production. It is important to acknowledge that some of the research into
improving farm products will make a contribution to the understanding of the health and
functioning of natural resources. There is some excellent work underway, such as research
into land management practices and managing the environmental effects of those
practices, supported by the MAF Sustainable Farming Fund.
Over the last year FRST has been revising its research investment portfolios to better reflect
Government priorities for knowledge development and wealth creation. This is further
discussed in Chapter 6.
3.6 Summary and key points
Farming in New Zealand has changed enormously over the past century. Trends during the
last decade include:
• dairy farming — there is a general move away from traditional pasture-based systems
towards systems that are highly dependent on external inputs. There has been a major
increase in the use of urea fertiliser. Dairying is also expanding into relatively dry
regions where significant irrigation is required.
• sheep and beef farming — although there has been an overall decrease in the number
of sheep and beef cattle in New Zealand, stock numbers have increased on intensive
sheep and beef farms. Lambing rates nationally have increased significantly. Livestock
weights have also increased, partly due to improved animal nutrition. This has been
enabled partly through the use of significantly more fertiliser to boost pasture growth.
• deer farming — deer numbers, hectares farmed and production volumes have all
increased in recent years. Urea fertiliser use has also increased significantly in this
sector.
• horticulture and viticulture — the overall size of these sectors, in terms of hectares
farmed, is gradually increasing. The area of land under irrigation has also increased
significantly. A positive trend in the horticulture and viticulture sectors is toward
Environmental Management Systems that reduce pesticide use.


![Handbook of goat farming[1]](https://static.fdocuments.in/doc/165x107/55182bf74a7959a5098b45e9/handbook-of-goat-farming1.jpg)